+ All Categories
Home > Documents > Calculating and Comparing CO2 Emissions from the … environmental/2012...Emissions Rating. Similar...

Calculating and Comparing CO2 Emissions from the … environmental/2012...Emissions Rating. Similar...

Date post: 26-Apr-2018
Category:
Upload: buithuan
View: 214 times
Download: 0 times
Share this document with a friend
26
Calculating and Comparing CO 2 Emissions from the Global Maritime Fleet December 2012 This document, and much more, is available for download from Martin's Marine Engineering Page - www.dieselduck.net
Transcript

Calculating and Comparing CO2

Emissions from the Global Maritime Fleet

December 2012

This document, and much more, is available for download from Martin's Marine Engineering Page - www.dieselduck.net

VISION

“To be the supplier of choice of marine vetting services to

achieve with our customers a safer and cleaner maritime

environment”

MISSION

To enable our customers to reduce their marine risk by

providing comprehensive marine assessments on vessels and

marine suppliers.

This document, and much more, is available for download from Martin's Marine Engineering Page - www.dieselduck.net

Background

While international shipping is the most carbon efficient mode of commercial transport, total

emissions are comparable to those of a major national economy, necessitating emission reduction1.

In 2009, shipping was estimated to have emitted 3.3% of global CO₂ emissions, of which

international shipping contributed 2.7% or 870 million tonnes². Moreover, according to the

International Maritime Organization’s (IMO) 2nd Greenhouse Gas (GHG) Study2, if unabated,

shipping’s contribution to GHG emissions could reach 18% by 2050.

In July 2011, the IMO Marine Environment Protection Committee (MEPC) adopted mandatory

measures to reduce GHG emissions from international shipping through amendments to MARPOL

Annex VI Regulations. These amendments include the application of the Energy Efficiency Design

Index (EEDI) for new ships which will require ships to meet a minimum level of energy efficiency. The

EEDI applies to all new ships built from 1 January 2013.

From 1 January 2013, existing ships are required to document their energy usage through the

introduction of a Ship Energy Efficiency Management Plan (SEEMP) that is linked to the ship’s

broader management plan.

Carbon dioxide emissions breakdown does not divide into all ships equally and considerations such

as ship size, fuel type and engine performance as well as advances in maritime technology mean that

some ships are more efficient than others. Recognising that such vessel specific sustainability

information is dispersed and costly to obtain and coordinate in a systematic manner, RightShip

created its GHG Emissions Rating. The GHG Emissions Rating is a simple to use tool enabling

charterers to select the most energy efficient vessel; terminals, insurers and banks to provide

preferred rates to owners of more efficient vessels; and reward ship owners for investing in

technology to make their vessel more efficient.

1 ICS, 2009, Shipping, World Trade and the Reduction of CO2 Emissions. International Chamber of Shipping,

London, UK.

2 IMO, 2009, Second IMO GHG Study 2009, International Maritime Organization, London, UK.

This document, and much more, is available for download from Martin's Marine Engineering Page - www.dieselduck.net

Contents

1. Summary ......................................................................................................................................... 1

2. IMO MEPC EEDI ............................................................................................................................... 2

3. RightShip’s GHG Emissions Rating .................................................................................................. 3

3.1 EVDI™ ...................................................................................................................................... 3

3.1.1 Data Validity .................................................................................................................... 4

3.1.2 Assumptions .................................................................................................................... 5

3.1.3 Ship Types ....................................................................................................................... 6

3.2 GHG Emissions Rating A - G Scale ........................................................................................... 7

3.2.1 GHG Emissions Calculation ............................................................................................. 9

3.2.2 Natural Adjustment ....................................................................................................... 11

3.2.3 Retrofits and Upgrades ................................................................................................. 11

3.2.4 Sister Ships .................................................................................................................... 12

3.2.5 Comparing Existing Ship’s CO₂ Emissions ..................................................................... 12

3.2.6 Why Newer is Not Always Better or More Efficient ..................................................... 13

3.2.7 Improving a Vessel’s GHG Emissions Rating ................................................................. 16

4. Presentation of Information in SVIS™ ........................................................................................... 16

5. EVDI™ – A Practical Application .................................................................................................... 18

5.1 The Benefits of EVDI™ and GHG Emissions Rating ............................................................... 19

5.1.1 Charterers ..................................................................................................................... 20

5.1.2 Vessel Owners ............................................................................................................... 20

5.1.3 Terminals ....................................................................................................................... 20

5.1.4 Financial Institutions ..................................................................................................... 21

6. RightShip – In a Nutshell ............................................................................................................... 22

7. Contact Information ...................................................................................................................... 22

Confidentiality

This report contains information, which is confidential to RightShip Pty Ltd (RightShip) and may not

be reproduced in any form or communicated to any other person, firm or company without the prior

written approval of RightShip.

This document, and much more, is available for download from Martin's Marine Engineering Page - www.dieselduck.net

1 | P a g e

1. Summary The IMO defined energy efficiency as grams of CO2 per tonne nautical mile and the IMO MEPC

formulated the EEDI as a measure of a ship’s CO2 emissions. EEDI is calculated using characteristics

of the ship at build, incorporating parameters that include ship capacity, engine power and fuel

consumption.

RightShip has developed an Existing Vessel Design Index (EVDI™) and a Greenhouse Gas (GHG)

Emissions Rating. Similar to the IMO MEPC’s EEDI, RightShip’s EVDI™ measures a ship’s CO2

emissions, however, unlike the EEDI, the EVDI™ can be applied to existing ships. The GHG Emissions

Rating is a practical measure derived from the EVDI™ that allows relative comparison of a ship’s CO2

emissions to vessels of a similar size and type. Ship types are largely consistent with those used by

IMO MEPC.

This report details the calculations and methodology of the EVDI™ and GHG Emissions Rating and

contains practical examples of their application to the shipping industry.

This document, and much more, is available for download from Martin's Marine Engineering Page - www.dieselduck.net

2 | P a g e

2. IMO MEPC EEDI The EEDI was developed to measure the theoretical CO2 emission performance of new ships over 400 gross tonnes and is calculated from ship design and engine performance data. The intended application of this index is to stimulate innovation and technical development of all elements influencing the energy efficiency of a ship from its design phase. The EEDI is calculated using the following formula3:

in which:

• ME and AE, represent Main Engine(s) and Auxiliary Engine(s);

• P, the power of the engines (kW);

• CF, a conversion factor between fuel consumption and CO2 based on fuel carbon content;

• SFC, the certified specific fuel consumption of the engines (g/kWh);

• Capacity, the deadweight or gross tonnage (tonnes);

• Vref, the ship speed (nm/h); and

• fj, a correction factor to account for ship specific design elements (eg. ice-class)

The IMO should be commended for developing the EEDI, the first ever mandatory global greenhouse

gas reduction regime for an international industry sector. However, as the EEDI applies to new ships

built after 1 January 2013, it does not address the existing world fleet of 60,000 vessels that

currently emit over one billion tonnes of carbon dioxide annually. Given the typical 25 year lifecycle

of a vessel, it has been estimated that less than 15% of the fleet will be subject to EEDI certification

by 20204.

3 IMO, 2009, Interim Guidelines on the Method of Calculation of the Energy Efficiency Design Index for New

Ships. Circular MEPC.1/Circ.681. International Maritime Organization, London, UK.

4 IMO, 2011. Circular MEPC 63 5 13 GHG Emissions from Existing Vessels, WWF & CSC.

The calculated EEDI is a theoretical measure of the mass of CO2 emitted per unit of transport

work (grams CO2 per tonne nautical mile) for a particular ship design.

This document, and much more, is available for download from Martin's Marine Engineering Page - www.dieselduck.net

3 | P a g e

3. RightShip’s GHG Emissions Rating In response to customer demand, RightShip developed a systematic and transparent means of

comparing the relative theoretical efficiency and sustainability of the existing fleet.

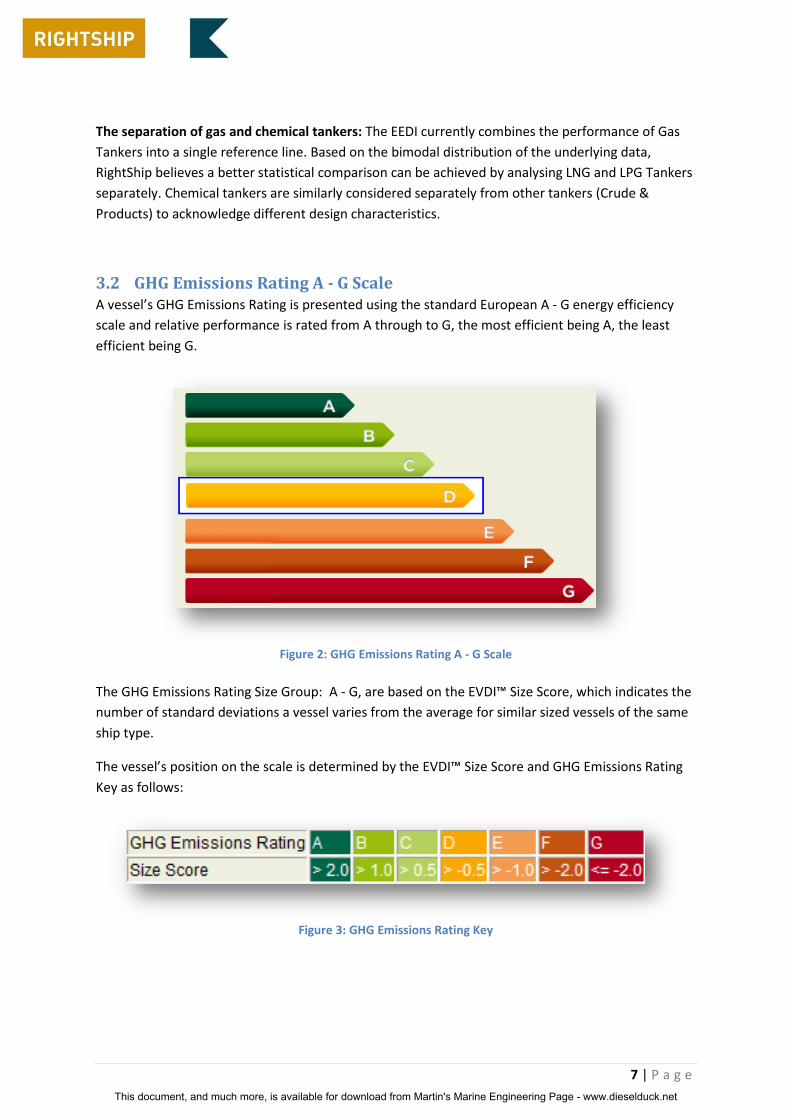
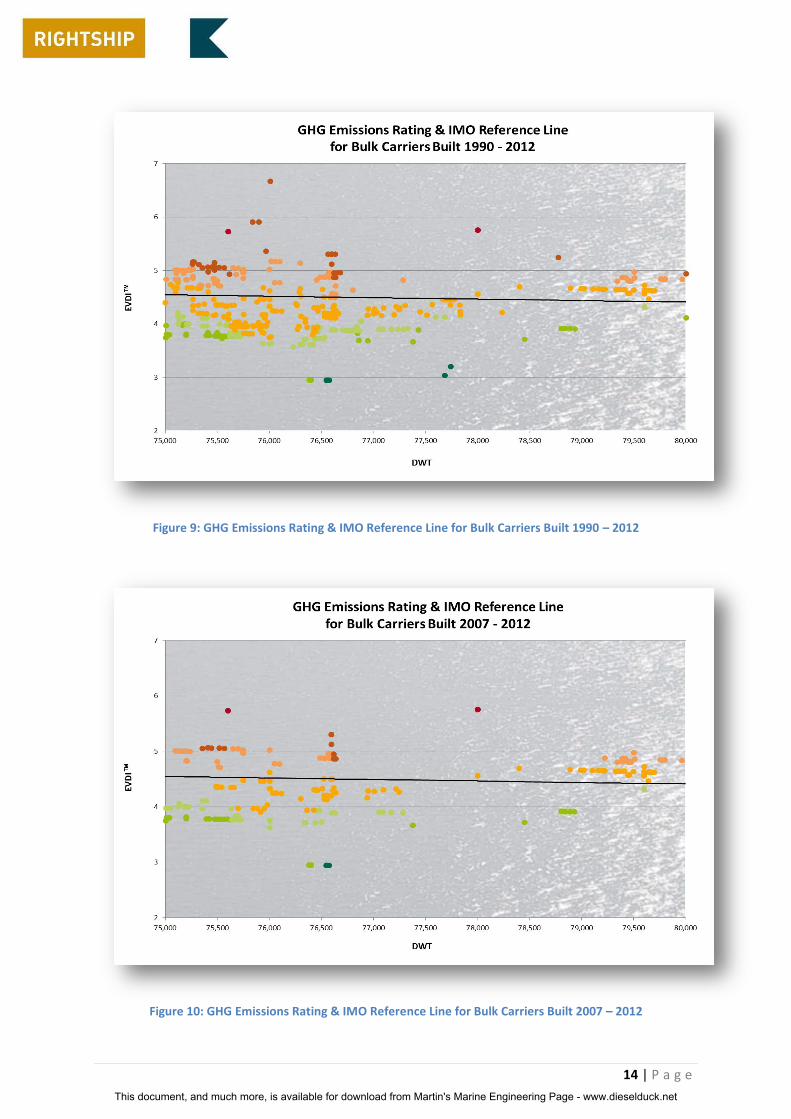
The GHG Emissions Rating is an innovative measure that allows comparison of a ship’s theoretical

CO2 emissions relative to peer vessels of a similar size and type using a simple A - G scale. Ship types

are largely consistent with those used by IMO MEPC. While the A - G benchmarking scale is simplistic

and easy to understand, the methodology using an algorithm to calculate the GHG Rating is complex.

This A - G rating enables shippers to identify the most energy efficient vessel, ship owners to

compare their vessels to peer vessels and reward them for investing in sustainability, banks to

reduce their risk by investing in efficient vessels and ports to reward efficient vessels with reduced

port fees.

3.1 EVDI™ RightShip’s Existing Vessel Design Index (EVDI™) is the core measure used to calculate the RightShip

GHG Emissions Rating and is comparable across all vessels in RightShip’s Ship Vetting Information

System (SVIS™) database.

The 2007 DNV paper that initially proposed the EEDI to the IMO at MEPC 57 suggested that from a

technical perspective, it is possible to retrospectively apply the EEDI to existing ships. The IMO has

now documented EEDI benchmarks and reference lines based on the existing fleet and historical

data.

RightShip's EVDI™

• Over 60,000 Existing Ships

IMO MEPC’s EEDI

• New Ships from 1 January 2013

Similar to the IMO MEPC’s EEDI, RightShip’s EVDI™ measures a ship’s theoretical CO2 emissions

per nautical mile travelled. However, unlike the EEDI that is applied only to new ships the

EVDI™ is designed for application to existing vessels.

This document, and much more, is available for download from Martin's Marine Engineering Page - www.dieselduck.net

4 | P a g e

3.1.1 Data Validity

EVDI™ values are calculated from vessel design information and associated data.

The primary sources of this data are:

RightShip’s Ship Vetting Information System (SVIS™);

Ship-sourced data;

Classification Societies; and

IHS Fairplay (IHS) database.

RightShip recognises that the reliability of its calculations directly correlates to the accuracy of

source data used. Prior to the launch of the EVDI™ in 2010, RightShip invited all owner/manager

customers to validate the vessel design particulars of their fleet provided by IHS Fairplay and other

sources. In September 2012, RightShip also contacted over 4,300 ship owners and managers inviting

them to view and update their fleet’s design particulars through the free site shippingefficiency.org.

RightShip continues to work closely with ship owners, yards and Classification Societies to validate

the data used for the calculations.

Since RightShip launched the EVDI™ and GHG Emissions Rating, our system and data has been

accessed and validated over 96,000 times and this gives us confidence about the reliability of our

information.

RightShip welcome feedback pertaining to any missing or additional information including retrofits

or upgrades through RightShip’s SVIS™ portal, shippingefficiency.org or by emailing

[email protected]

This document, and much more, is available for download from Martin's Marine Engineering Page - www.dieselduck.net

5 | P a g e

3.1.2 Assumptions

Where ship specific data is not available such as specific fuel consumption, the values used in the

EVDI™ calculation are based on the same assumptions used in the IMO GHG Study2 and/or detailed

in IMO Circulars on calculation of the energy efficiency measure. RightShip’s approach utilises the

same data set recognised by IMO MEPC in their establishment of an EEDI reference line for new

ships. Assumptions are shown below:

• Specific Fuel Consumption (Main Engine), SFCME:

Engine Age MCRME (kW) SFCME (g/kWh)

Pre-1983

> 15,000 205

5,000 to 15,000 215

< 5,000 225

1984-2000

> 15,000 185

5,000 to 15,000 195

< 5,000 205

2001-2007

> 15,000 175

5,000 to 15,000 185

< 5,000 195

• Specific Fuel Consumption (Auxiliary Engine), SFCAE:

Engine Age MCRAE > 800 kW MCRAE < 800 kW

Any 220 g/kWh 230 g/kWh

• Power (Main Engine), PME: = 0.75 MCRME

• Power (Auxiliary Engine), PAE:

MCRME > 10,000 kW < 10,000 kW

PAE =(0.025*MCRME)+250 0.05*MCRME

• Ship Speed, Vref: = Design Speed

Capacity:

o 100% deadweight, for bulk carriers, tankers, gas tankers, ro-ro cargo and

general cargo ships

o 70% deadweight, for containerships

o 100% gross tonnage for passenger and ro-ro passenger ships

• CO2 Conversion Factors, CF:

Fuel Type Carbon Content CF

(t-CO2/t-Fuel)

Diesel/Gas Oil (DGO) 0.875 3.206

Light Fuel Oil (LFO) 0.86 3.15104

Heavy Fuel Oil (HFO) 0.85 3.1144

Liquified Petroleum Gas (LPG)

Propane 0.819 3.000

Butane 0.827 3.030

Liquified Natural Gas (LNG) 0.75 2.750

This document, and much more, is available for download from Martin's Marine Engineering Page - www.dieselduck.net

6 | P a g e

3.1.3 Ship Types

The categories of ship used for the derivation of comparative GHG Emissions Ratings predominantly

follow those in the IMO document MEPC 61/WP.105:

01 Bulker

02 Chemical Tanker

03 Container

04 Crude & Products Tanker (inc OBO)

05 Cruise

06 General Cargo

07 LNG Tanker

08 LPG Tanker

09 Refrigerated Cargo Ship

10 Vehicle

11 Ferry Pax Only

12 Ro Ro Cargo Ship : weight carrier

Non-Standard Propulsion: The EEDI, as presently constructed, is not designed or intended for

application to vessels with a non-conventional propulsion system. It is anticipated that the IMO will

develop refined parameters, formulas, and reference baselines for these ships in the near future.

These vessels (including LNG and passenger vessels which have diesel-electric, turbine, and other

non-conventional means of propulsion) do not have calculated EVDI’s and GHG Emissions Rating’s

and display a banner in the system. Accordingly, any attempted evaluation of this type of ship using

the EVDI™ needs to be understood as being outside the effective purpose of the index.

Ice Class Vessels: Ice-class vessels have design and structural features that increase their estimated

EVDI™ relative to similarly-sized conventional vessels. Power and capacity correction factors (where

available) have been applied to the EVDI™ calculation and this is reflected in the system –

5 IMO, 2010, Report of the Working Group on Energy Efficiency Measures for Ships. Annex 2. Guidelines for

calculation of reference lines for use with the Energy Efficiency Design Index. Paper MEPC 61/WP.10 Annex 2.

International Maritime Organization, London, UK.

Figure 1: Ice Class Vessel Correction Factors within SVIS™

This document, and much more, is available for download from Martin's Marine Engineering Page - www.dieselduck.net

7 | P a g e

The separation of gas and chemical tankers: The EEDI currently combines the performance of Gas

Tankers into a single reference line. Based on the bimodal distribution of the underlying data,

RightShip believes a better statistical comparison can be achieved by analysing LNG and LPG Tankers

separately. Chemical tankers are similarly considered separately from other tankers (Crude &

Products) to acknowledge different design characteristics.

3.2 GHG Emissions Rating A - G Scale A vessel’s GHG Emissions Rating is presented using the standard European A - G energy efficiency

scale and relative performance is rated from A through to G, the most efficient being A, the least

efficient being G.

Figure 2: GHG Emissions Rating A - G Scale

The GHG Emissions Rating Size Group: A - G, are based on the EVDI™ Size Score, which indicates the

number of standard deviations a vessel varies from the average for similar sized vessels of the same

ship type.

The vessel’s position on the scale is determined by the EVDI™ Size Score and GHG Emissions Rating

Key as follows:

Figure 3: GHG Emissions Rating Key

This document, and much more, is available for download from Martin's Marine Engineering Page - www.dieselduck.net

8 | P a g e

If the distribution of the EVDI™ Size Scores exactly fitted a normal distribution, the score ranges

would match the following fixed percentiles of the data set -

GHG Emissions Rating A B C D E F G

Size Score > 2.0 > 1.0 > 0.5 > -0.5 > -1.0 > -2.0 <= -2.0

Area Under Curve 2.5% 13.5% 16% 36% 16% 13.5% 2.5%

The bell curve below in Figure 4 shows the percentage distribution with the corresponding letter

displayed in the appropriately coloured area under the curve. The x- axis is expressed as a count of

standard deviations which matches the Size Score in the key.

Figure 4: GHG Emissions Rating Key – Normal Peer Distribution

It is important to note that as each vessel size group is a subset of the entire ship type group the

percentages within each subset’s size group will have some variability from these percentages. The

size groups are discussed in detail in 3.2.5.

This document, and much more, is available for download from Martin's Marine Engineering Page - www.dieselduck.net

9 | P a g e

3.2.1 GHG Emissions Rating Calculation

To produce an A - G Rating, EVDI™ values are converted using a logarithmic calculation - due to a

strongly skewed distribution of raw data - to permit correct and normalised statistical comparison.

The transformed value allows calculation of a Z Score which is the metric that determines the GHG

Emissions Rating.

The reasoning is best described by example: The frequency of occurrence of EVDI™ values for bulk

carriers is presented in Figure 5. The distribution of values for all ships does not fit a normal bell-

shaped curve, with the average of all values not central to the distribution. Therefore, direct

comparison of individual ship values to the average value would have a bias against above average

ships for the overall ship type and the ship size group within the ship type.

Figure 5: Frequency distribution of EVDI™ values for all bulk carriers in the SVIS™ database and two dwt

banding examples.

EVDI™ Log EVDI™ Z Score

(Size & Type)

EVDI™ Size

Score

GHG Emissions

Rating

This document, and much more, is available for download from Martin's Marine Engineering Page - www.dieselduck.net

10 | P a g e

Applying a logarithmic transformation to the calculated EVDI™ values normalises the frequency

distribution for the overall ship type and ship size groups within the ship type (Figure 6). Individual

ship values can then be accurately compared to the average for the size group within the ship type.

Figure 6: Frequency distribution of logarithmic (natural log) transformed EVDI™ values for all bulk carriers in

the SVIS™ database and two dwt banding examples.

A Z Score is a standard measure of the variation of an individual value from a normally distributed

average with a mean of zero and a standard deviation of one. It is calculated by dividing the

difference between the ship value and the overall average for the type or size within the type by the

standard deviation for the type or size within the type.

Z Score = –

Where:

• is the ship natural log EVDI™ value;

• is the average of natural log EVDI™ values for the type or size group within the type; and

• is the standard deviation of the natural log EVDI™ value distribution for the type or size

group within the type.

The method for comparing an individual ship’s EVDI™ value to the ship type or size group within

the ship type, and to derive the EVDI™ Size Score reported in the RightShip GHG Emissions

Rating, is based on calculating a statistical Z Score.

This document, and much more, is available for download from Martin's Marine Engineering Page - www.dieselduck.net

11 | P a g e

For the purpose of the RightShip GHG Emissions Rating, the negative Z Score is used; ie. the sign,

positive or negative, of the calculated Z Score is reversed. The negative Z Score is used because the

calculation will give positive numbers for values above the average (high EVDI™) and negative

numbers for values below the average (low EVDI™). Low EVDI™ values represent better energy

efficiency, therefore it is more intuitive to assign a positive value to the score as it represents good

performance.

3.2.2 Natural Adjustment

The GHG Emissions Rating is dynamic and will almost always use a different dataset for each vessel’s

relative calculation. As older vessels are scrapped and new vessels are commissioned or existing

retrofits/upgrades are verified at sea trials, relative performance adjusts and vessels continue to rate

better and worse than the average.

3.2.3 Retrofits and Upgrades

Vessels that acquire eco-efficiency technologies and/or measures such as waste heat recovery

systems or propeller ducts are eligible for recognition from RightShip. The efficiency retrofits and/or

upgrades are documented as part of the SVIS™ Environmental Rating page, as shown:

Figure 7: Display of a vessel’s efficiency retrofits and or upgrades

The efficiency percentage used by RightShip is based on the Fathom publication Ship Efficiency: the

Guide6 and is an approximate estimate of the efficiency gain associated with a retrofit or upgrade.

The example in Figure 7 (shown above) indicates that the vessel is operating around 4% more

efficiently than design due to the inclusion of a propulsion – propeller efficiency measurement

where multiple retrofits/upgrades are shown, it is important to note the efficiency percentages need

to be looked at individually and are not a cumulative total.

6 2011, Lokley, P., & Jarabo-Martin, A., (Ed), Ship Efficiency: The Guide , Fathom, Berkshire, UK.

This document, and much more, is available for download from Martin's Marine Engineering Page - www.dieselduck.net

12 | P a g e

Approved enhancement measures will have a plus + sign adjoined to their GHG Emissions Rating

which is shown for the E rated vessel below:

Figure 8: A plus + sign is adjoined to a vessel’s GHG Emissions Rating for recognised retrofits and or upgrades

RightShip believe it is important to acknowledge and reward owners who have invested capital and

systems to operate their vessels above compliance and the plus + notation helps to increase their

visibility.

3.2.4 Sister Ships

Some sister ships will have different GHG Emissions Ratings. A vessel’s EVDI™ value is based on many

parameters and if one of these parameters (normally deadweight tonnage) differs between sister

ships they could have a different EVDI™, moving them into a different rating bracket. The base data

used in the rating calculation of an individual vessel is displayed in SVIS™, so the source of

differences between sister ships can be checked.

3.2.5 Comparing Existing Ship’s CO₂ Emissions

RightShip’s GHG Emissions Rating methodology differentiates between vessel type and size. The

major ship types that the rating applies to are shown below:

Ship Type Basis of Size

Range

Size Rating

Range (Vessels)

Approximate

Number of Ships

Bulker DWT 200 11,300

Chemical Tanker DWT 50 700

Container TEU 200 5,300

Crude & Products Tanker (inc OBO) DWT 200 10,300

Cruise GT 50 600

General Cargo DWT 100 11,700

LNG Tanker CBM 50 400

LPG Tanker CBM 50 1,200

Refrigerated Cargo Ship DWT 50 1000

Vehicle DWT 50 800

This document, and much more, is available for download from Martin's Marine Engineering Page - www.dieselduck.net

13 | P a g e

The Size Rating Range (Vessels) column shows the number of vessels by Ship Type included in the

EVDI™ Size Score calculation. The number of ships chosen for comparison is based on the quantity of

ships of that type in the SVIS™ database and their size distribution.

For the typical GHG Emissions Rating calculation, the size comparison is to the 50, 100 or 200 ships

within the type that are closest in capacity (dwt, gt, teu or cbm) to the individual ship, for example:

For vessel types in the 100 Size Rating Range, the 50 ships with capacity closest to, but less than the

ship, and the 50 ships with capacity closest to but greater than the ship is the basis of the size group

range used for comparison.

Where there is an insufficient quantity of vessels to allow for an even split of vessels (near to the

upper and lower ends of the group) the Size Rating Range is adjusted to best approximate a like-for-

like comparison, for example: The second largest bulk carrier would be compared to the 199 bulk

carriers immediately smaller and the 1 larger bulk carrier to determine its GHG Emissions Rating.

Scattergrams of the calculated EVDI™ Size Scores for each of these ship types against capacity (dwt,

gt, cbm or teu) show the EVDI™ Size Score/capacity relationship to be best represented by a power

regression line, as recognised by IMO MEPC in their establishment of an EEDI “reference line” for

new ships.

Detailed analysis of the EVDI™ Size Scores across RightShip’s SVIS™ database has shown the method

used to develop a comparative rating of EVDI™ Size Scores as a component of the RightShip GHG

Emissions Rating, is applicable across the different ship types. The method therefore provides a

statistically valid means of comparing the energy efficiency of existing ships.

Notwithstanding a vessel’s individual size, speed and year of build it is possible to demonstrate that

certain vessels are simply designed more efficiently and it is important that this is factored into the

decision making process.

3.2.6 Why Newer is Not Always Better or More Efficient

By using appropriate mathematical techniques, a meaningful comparison between vessels can be

achieved and as shown by the Figures below, newer vessels do not always perform as well as their

existing peers.

Figure 9 (overleaf) shows bulk carriers delivered over the last 22 years between 75,000 and 80,000

dwt using the A - G GHG Emissions Rating scale. The x-axis shows dwt and the y-axis displays EVDI™.

The IMO MEPC reference line has been overlaid as a comparison and right across this dwt range

there are a large number of vessels above and below the line. This makes sense as the reference line

is reflective of 92.89% of bulk carriers delivered during the IMO MEPC reference period as noted in

MEPC 62/6/4.

Figure 10 (counterfoil) shows this same dwt spread and deliveries since 2007 onwards. If newer

vessels are always more efficient, we would expect all of the bulk carriers built in the last five years

between 2007 and 2012 to be below the reference line in Figure 9, which is clearly not the case.

More efficient and less efficient vessels are always evident if we apply a consistent framework to

gauge efficiency.

This document, and much more, is available for download from Martin's Marine Engineering Page - www.dieselduck.net

14 | P a g e

Figure 9: GHG Emissions Rating & IMO Reference Line for Bulk Carriers Built 1990 – 2012

Figure 10: GHG Emissions Rating & IMO Reference Line for Bulk Carriers Built 2007 – 2012

This document, and much more, is available for download from Martin's Marine Engineering Page - www.dieselduck.net

15 | P a g e

The same approach to tankers between 105,000 – 115,000 dwt (Figure 11) delivered in the last five

years yields three interesting insights.

Although the reference line for tankers is reflective of 94.46% of tankers delivered during

the IMO MEPC reference period (MEPC 62/6/4) in this subset of data almost all tankers are

already below the reference line.

Despite being more efficient than the minimum required from 2013, there is still separation

across the fleet (some are better and some are worse).

An owner building at minimum efficiency (reference line) would not be competitive and

needs to understand his relative peer efficiency rather than rely on legislation to guide

decision making. Particularly given the oversaturation of tonnage and emerging two tiered

market for more efficient vessels.

Figure 11: GHG Emissions Rating & IMO Reference Line for Tankers Built 2007 – 2012

This document, and much more, is available for download from Martin's Marine Engineering Page - www.dieselduck.net

16 | P a g e

3.2.6 Improving a Vessel’s GHG Emissions Rating

The data used to calculate a vessel’s EVDI™ can be verified by accessing RightShip’s SVIS™ (for

customers) or through shippingefficiency.org. Any changes can be updated in the SVIS™ portal,

through these websites (Figure 12 below) or by emailing [email protected]

Figure 12: Retrofit and Upgrade drop-down menu in www.shippingefficiency.org

A raft of retrofits and upgrades such as changes to ship design, propulsion and machinery may help

to improve a vessels GHG Emissions Rating. Any upgrade or retrofit which has been verified by a

Classification Society can be submitted to RightShip to enable the GHG Emissions Rating to be

recalculated.

A vessel’s EVDI™ does not take into account operational measures such as slow steaming or eco

speeds. By focusing on design and then supplementing results with operational metrics, a more

meaningful outcome is achievable - enabling a like-for-like comparison.

This document, and much more, is available for download from Martin's Marine Engineering Page - www.dieselduck.net

17 | P a g e

4. Presentation of Information in SVIS™ Figure 13 (below) shows a system display of the EVDI™ and GHG Emissions Rating graphic, including

the data used in calculating the EVDI™ Size Score and accompanying GHG Emissions Rating. The

hyperlinks (in blue) indicate the top five rated peer vessels based on EVDI™ Size Score. The top

rated peers enables the user to identify the relative performance differential between any given

vessel and the most efficient in its peer group.

Figure 13: Example of the GHG Emissions Rating data table for an individual ship in SVIS™

This document, and much more, is available for download from Martin's Marine Engineering Page - www.dieselduck.net

18 | P a g e

5. EVDI™ – Practical Applications

Figure 14: Possible voyage plan of a vessel travelling from Vitoria, Brazil to Qingdao, China

The following page shows two tables, common among each are the vessels selected and their

170,000 to 173,000 dwt range and the 11,023 nautical mile voyage as illustrated above in Figure 14.

Although complications regarding ballast leg measurement and confusion around who should be

responsible for vessel emissions exist, these simple examples highlight the potential efficiency

benefits and economic savings accessible through informed selection.

Actual emissions for a voyage will vary from this theoretical calculation due to the fuel consumption

and consequent emissions varying with operational voyage characteristics such as speed, cargo load

and weather conditions.

EVDI™ is an estimated measure of the CO2 emitted per tonne nautical mile travelled.

Therefore a vessel’s theoretical footprint is the EVDI™ multiplied by both the distance travelled

and tonnes carried: CO2 footprint = EVDI™ x nautical miles travelled x tonnes carried.

11,023 nautical miles

This document, and much more, is available for download from Martin's Marine Engineering Page - www.dieselduck.net

19 | P a g e

By focusing on vessels less than 2 standard deviations from the mean – B through to F – the

potential variation in CO2 emitted for the same journey and the same amount of cargo being

delivered is significant.

CO2 emitted for the 11,023 nautical mile journey:

The theoretical difference between a B rated vessel and an F rated vessel is 1,400 tonnes with a 25%

variance from the mean.

Using USD650 for the price of fuel / tonne:

GHG Emissions Rating

DWT Power (Kw) USD Price of

fuel for voyage USD Variation

from Mean % USD Variation

from Mean

B 172,964 16,044 $1,387,498 -$89,410 -6%

C 172,964 15,404 $1,332,150 -$144,757 -10%

D 171,516 16,861 $1,412,400 -$64,508 -4%

E 171,681 18,736 $1,517,494 $40,587 3%

F 170,000 18,661 $1,630,174 $153,267 10%

The spread between the best and worst performing vessel represents around a USD245,000

differential for the same amount of cargo being delivered over the same distance.

5.1 The Benefits of RightShip’s EVDI™ and GHG Emissions Rating From 2020, developed economies have pledged to generate US$100 billion annually to help finance

climate mitigation and adaptation in developing economies through the Green Climate Fund7. In

June 2012, Christine Lagarde, Managing Director of the International Monetary Fund gave a speech

to the G20 countries at the United Nations Conference on Sustainable Development suggesting that

US$25 billion of the fund should come from international shipping.

7 de Mooij, R., Parry, Ian W.H., & Keen, M., (Ed), 2012. Fiscal policy to mitigate climate change: A guide for

policymakers, International Monetary Fund, ebook.

GHG Emissions Rating

DWT EVDI™ CO2 Tonne Variation from

Mean Variation from

Mean %

B 172,964 2.63 5,013 -734 -13%

C 172,964 2.75 5,243 -504 -9%

D 171,516 2.94 5,567 -181 -3%

E 171,681 3.15 5,966 218 4%

F 170,000 3.42 6,410 662 12%

This document, and much more, is available for download from Martin's Marine Engineering Page - www.dieselduck.net

20 | P a g e

An accompanying policy paper flagged the introduction of a carbon charge of $25 per tonne of

carbon dioxide on maritime fuel as a means of raising the funds8. Applying a flat tax across the

shipping industry’s 80,000 vessels translates to $312,000 per vessel. This would be a huge cost to

ship owners at a time when the global shipping market is severely depressed. While a fuel tax will

raise money, it won’t do anything to meaningfully reduce carbon dioxide emissions.

By using informed selection through the EVDI™ to only charter the more efficient vessels in the

market, we have estimated that US$70 billion can be saved annually – this is almost three times the

proposed amount to be raised by the IMF. By incentivizing sustainability through market based

solutions and informed decisions rather than penalizing emissions through a tax, a much bigger win

for industry and the environment is achievable.

5.5.1 Charterers

As at November 2012, seven RightShip chartering customers, who between them transport 475

million tonnes of cargo per annum, factor energy efficiency into the vessel selection process. This

represents around 10,000 vessel movements a year and nearly 10% of global non-containerized

trade. Feedback from the early adopters suggests this framework has not only helped to reduce

shipping costs, but has also gone a long way to publically demonstrate their commitment towards

corporate social responsibility.

These companies have taken an environmental leadership position and are enjoying the economic

and sustainability benefits flowing through to the business.

5.1.2 Vessel Owners

Depending on the chartering arrangement, a vessel owner with a more energy efficient vessel can

reduce their bunkers and will be a preferred vessel for shippers that factor efficiency into their

chartering selection process.

While retrofits and upgrades can be costly, the payback period can be as little as six months. In a

joint initiative between NGO, The Carbon War Room, vessel owners, technology providers and

financial institutions, two pilot programs are underway to measure the payback period for vessels

investing in a range of energy efficiency measures. The upgrades are being funded by the financial

institutions and technology providers with no outlay by the ship owner.

Other benefits to vessel owners include port/terminal discounts, lower insurance premiums and an

enhanced reputation.

5.1.3 Terminals

Terminals seeking to position themselves as an environmental leader can provide discounts and

incentives to more efficient vessels.

Under the Port of Vancouver’s Eco Action Program vessel’s that have an EVDI™ rating of A, B or C are

8 de Mooij, R., Parry, Ian W.H., & Keen, M., (Ed), 2012. Fiscal policy to mitigate climate change: A guide for

policymakers, International Monetary Fund, ebook.

This document, and much more, is available for download from Martin's Marine Engineering Page - www.dieselduck.net

21 | P a g e

given discounted harbour due rates of $0.061 per gross registered tonne compared to the base rate

of $0.094 per gross registered tonne.

RightShip is also an incentive provider to the Environmental Ship Index (ESI) which identifies ships

that reduce air emissions above the current emission standards of the IMO. The index is used by

ports to reward vessels when they participate in the ESI. Participating incentive providers include:

Port of Amsterdam;

Port of Rotterdam;

Port of Oslo;

Hamburg Port Authority;

Ports of Bremen, Bremerhaven;

Port of Antwerp;

Seehafen Kiel GmbH & Co. KG Kiel;

Autorità Portuale di Civitavecchia;

Port of Zeebrugge;

Port of Le Havre;

Brunsbüttel Ports GmbH;

Port of Ashdod;

Tata Steel IJmuiden Terminals;

Port of Los Angeles; and

The Port Authority of New York & New Jersey.

Last year ESI recognised ships received discounts amounting to around €40,000. In 2012, this figure

has already risen to more than €600,000.9

Terminals seeking to set targets for their environmental performance can calculate their historical

benchmark and compare their performance over time for reporting purposes such as the Annual

Report.

5.1.4 Financial Institutions

Financial institutions increasingly factor in sustainability into their financing criteria as the trend

towards responsible investment grows. An energy efficient vessel has lower fuel costs and better

chartering potential which may lead to a higher initial asset value and a longer period of economic

depreciation. Given the current over supply of vessels in the market, it makes economic sense for

banks to reduce their risk by financing energy efficient assets, particularly given the typical 25 year

investment horizon.

The EVDI™ and GHG Emissions Rating provide a standardised framework for measuring the

efficiency of an investment portfolio and tracking changes over time. Financial institutions can also

use the environmental rating to map the correlation between investment risk and vessel

employment as an increasing number of charterers seek out more efficient vessels. As more nations

9 Port of Rotterdam Authority, 2012. Media Release, Green Award Foundation and Environmental Ship Index

Join Forces, www.portofrotterdam.com, 30/10,2012.

This document, and much more, is available for download from Martin's Marine Engineering Page - www.dieselduck.net

22 | P a g e

place a price on carbon, the payoff for investing in energy efficient vessels will materialise and

financial institutions who are first movers will have significant market advantage.

6. RightShip – In a Nutshell

RightShip is committed to achieving with our customers a safer and cleaner maritime environment.

RightShip’s major services are:

Online vetting through our proprietary web-based Ship Vetting Information System (SVIS™),

Physical inspections of ships worldwide,

Vessel environmental performance assessments,

Hosting and supporting clients’ own in-house vetting system, and

Advice on vetting policy and processes.

7. Contact Information Melbourne Level 20 500 Collins Street Melbourne Vic 3000 Australia Tel: +61 3 8686 5741 [email protected]

London Floor 15 30, St Mary Axe London EC3A 8BF United Kingdom Tel: +44 207 868 1621 [email protected]

Houston Suite 300, 2600 South Shore Boulevard League City Texas 77573 United States of America Tel: +1 (281) 245 3381 [email protected]

This document, and much more, is available for download from Martin's Marine Engineering Page - www.dieselduck.net


Recommended