ISSUE SUMMARY Form SOP-0402-07. Revision 10 DESIGN CONTROL SUMMARY CLIENT: PSEG Power LLC UNIT NO.: N/A PAGE NO. : 1 PROJECT NAME: PSEG Site ESPA PROJECT NO.: 12380-019 I S&L NUCLEAR QA PROGRAM I CALC. NO .. : 2014-06515 APPLICABLE YES 0 NO TITLE: Analysis of RAI-57 Question on Wave Run- up EQUIPMENT NO.: N/A IDENTIFICATION OF PAGES ADDED/REVISED/SUPERSEDEDIVOIDED & REVIEW METHOD INPUTS/ ASSUMPTIONS VERIFIED o UNVERIFIED REVIEW METHOD: Deta iled REV.: 0 STATUS: o SUPERSEDED BY CALCULATION NO. OVOID DATE FOR REV.: 8/8/2014 PREPARER: Todd DeMunda/Atk ins /1/ DATE: 8/8/2014 REVIEWER: '.X) / DATE: 8/8/2014 William R. Dally/Atkins APPROVER: Paul Jensen/Atkins DATE: 8/8/2014 S&L DATE: 8/8/2014 ACCEPTANCE:: Nikhil Patel/S&L IDENTIFICATION OF PAGES ADDED/REVISED/SUPERSEDEDIVOIDED & REVIEW METHOD INPUTSI ASSUMPTIONS o VERIFIED o UNVERIFIED REVIEW METHOD: Detailed REV.: STATUS: o APPROVED o SUPERSEDED BY CALCULATION NO. OVOID DATE FOR RE V. : PREPARER: DATE: REVI E WER: DATE: APPROVE R: DATE: S&L DATE: ACCEPTANCE: NOTE: PRINT AND SIGN IN TH E SIGNATURE AREAS SOP040207.DOC Page 1 of 1 Rev. Date : 05-19-2014
Transcript
ISSUE SUMMARY Form SOP-0402-07. Revision 10
DESIGN CONTROL SUMMARY
CLIENT: PSEG Power LLC UNIT NO.: N/A PAGE NO. : 1
PROJECT NAME: PSEG Site ESPA
PROJECT NO.: 12380-019 I S&L NUCLEAR QA PROGRAM
I CALC. NO .. : 2014-06515 APPLICABLE ~ YES 0 NO
TITLE: Analysis of RAI-57 Question on Wave Run-up
EQUIPMENT NO.: N/A
IDENTIFICATION OF PAGES ADDED/REVISED/SUPERSEDEDIVOIDED & REVIEW METHOD
INPUTS/ ASSUMPTIONS
~ VERIFIED o UNVERIFIED
REVIEW METHOD: Detailed REV.: 0 STATUS: ~APPROVED o SUPERSEDED BY CALCULATION NO. OVOID DATE FOR REV.: 8/8/2014
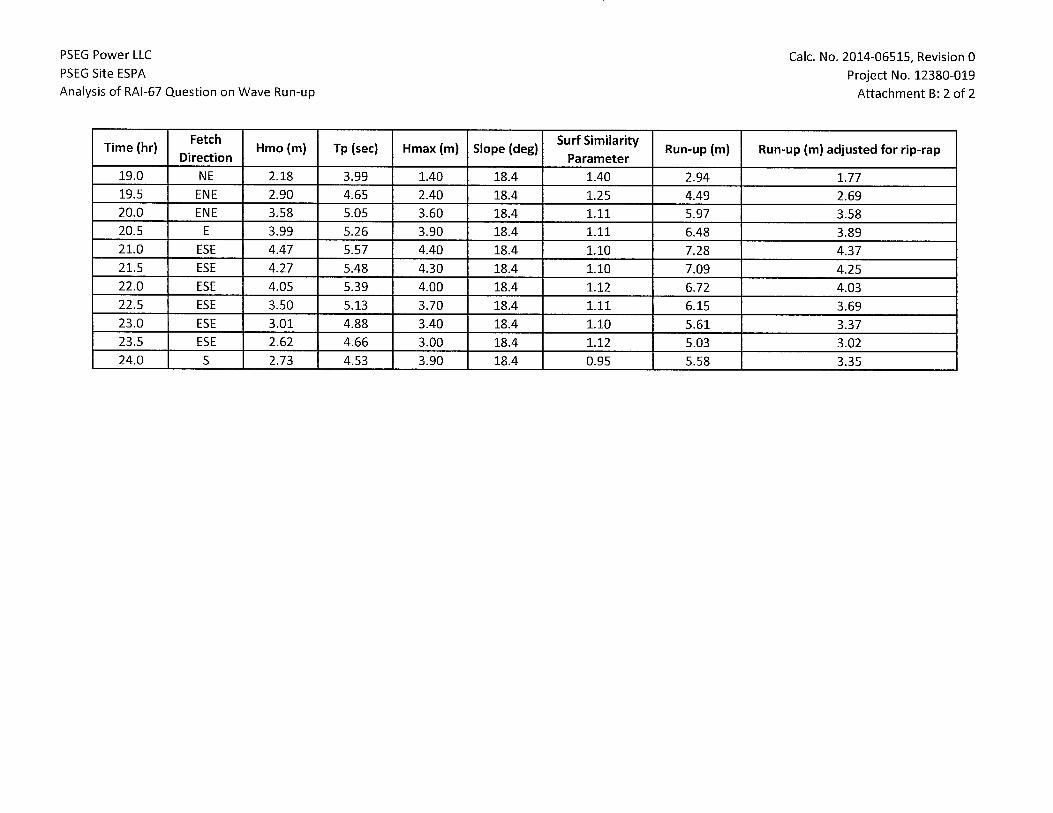
19.0 NE 2.18 3.99 1.40 18.4 19.5 ENE 2.90 4.65 2.40 18.4 20.0 ENE 3.58 5.05 3.60 18.4 20.5 E 3.99 5.26 3.90 18.4 21.0 ESE 4.47 5.57 4.40 18.4 21.5 ESE 4.27 5.48 4.30 18.4 22.0 ESE 4.05 5.39 4.00 18.4 22.5 ESE 3.50 5.13 3.70 18.4 23.0 ESE 3.01 4.88 3.40 18.4 23.5 ESE 2.62 4.66 3.00 18.4 24.0 S 2.73 4.53 3.90 18.4
iTul1e column corresponds to the tune step of the PMH event simulated In Reference I. 2Fetch direction refers to the dominant wind direction at that time in the simulation and corresponds to the fetch
directions shown in Figure 2 below.
3Hmo corresponds to the energy-based significant wave from Reference I. 4Tp corresponds to the calculated spectral peak period applied in the calculations provided in Reference I.
5Final Hmax used in the analysis was the lower of 1.67*Hmo or breaking wave height.
6SIope corresponds to angle created by the I V:3H side slopes.
PSEG Power LLC PSEG Site ESPA Analysis of RAI-67 Question on Wave Run-up
where the waves impinging on the new plant's slope will be non-breaking and normally-incident to
the slope.
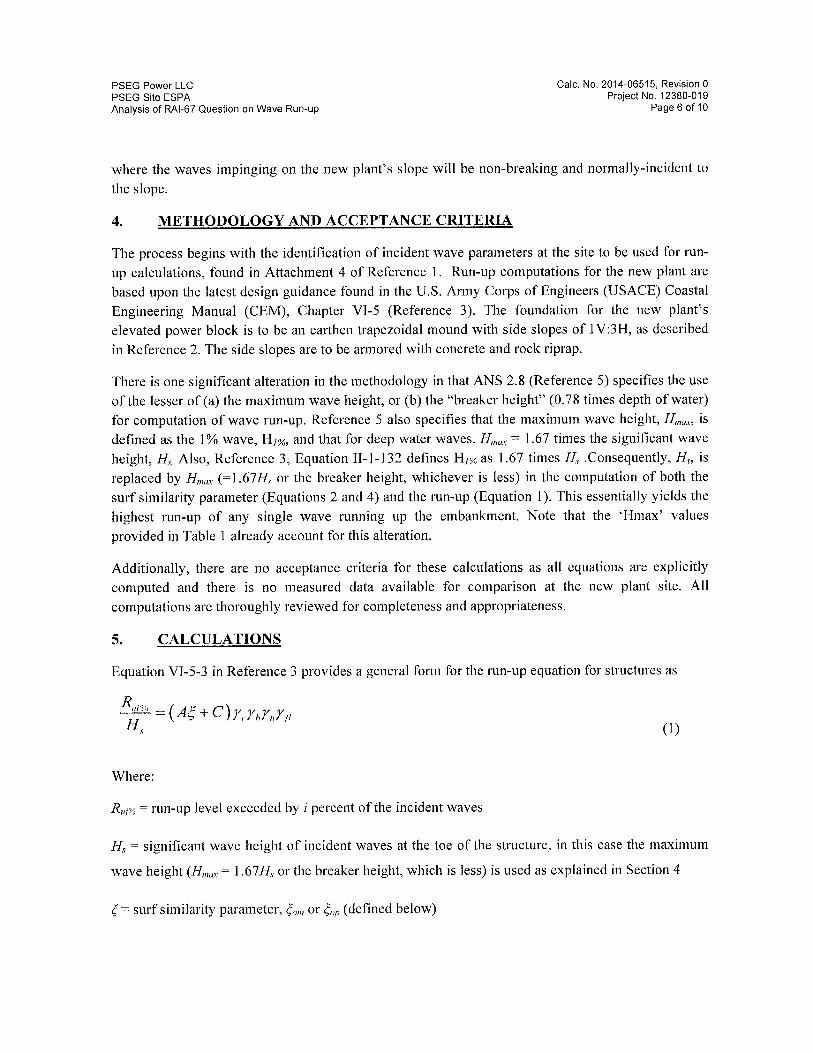
4. METHODOLOGY AND ACCEPTANCE CRITERIA
The process begins with the identification of incident wave parameters at the site to be used for run
up calculations, found in Attachment 4 of Reference 1. Run-up computations for the new plant are
based upon the latest design guidance found in the U.S. Army Corps of Engineers (USACE) Coastal
Engineering Manual (CEM), Chapter VJ-5 (Reference 3). The foundation for the new plant's
elevated power block is to be an earthen trapezoidal mound with side slopes of 1 V:3H, as described
in Reference 2. The side slopes are to be armored with concrete and rock riprap.
There is one significant alteration in the methodology in that ANS 2.8 (Reference 5) specifies the use
of the lesser of (a) the maximum wave height, or (b) the "breaker height" (0.78 times depth of water)
for computation of wave run-up. Reference 5 also specifies that the maximum wave height, H mux, is
defined as the 1 % wave, H/%, and that for deep water waves, Hmux = 1.67 times the significant wave
height, H.I. Also, Reference 3, Equation 11-1-132 defines H/% as 1.67 times H., .Consequently, H." is replaced by Hmax (=1.67H., or the breaker height, whichever is less) in the computation of both the
surf similarity parameter (Equations 2 and 4) and the run-up (Equation 1). This essentially yields the
highest run-up of any single wave running up the embankment. Note that the 'Hmax' values
provided in Table 1 already account for this alteration.
Additionally, there are no acceptance criteria for these calculations as all equations are explicitly
computed and there is no measured data available for comparison at the new plant site. All
computations are thoroughly reviewed for completeness and appropriateness.
5. CALCULATIONS
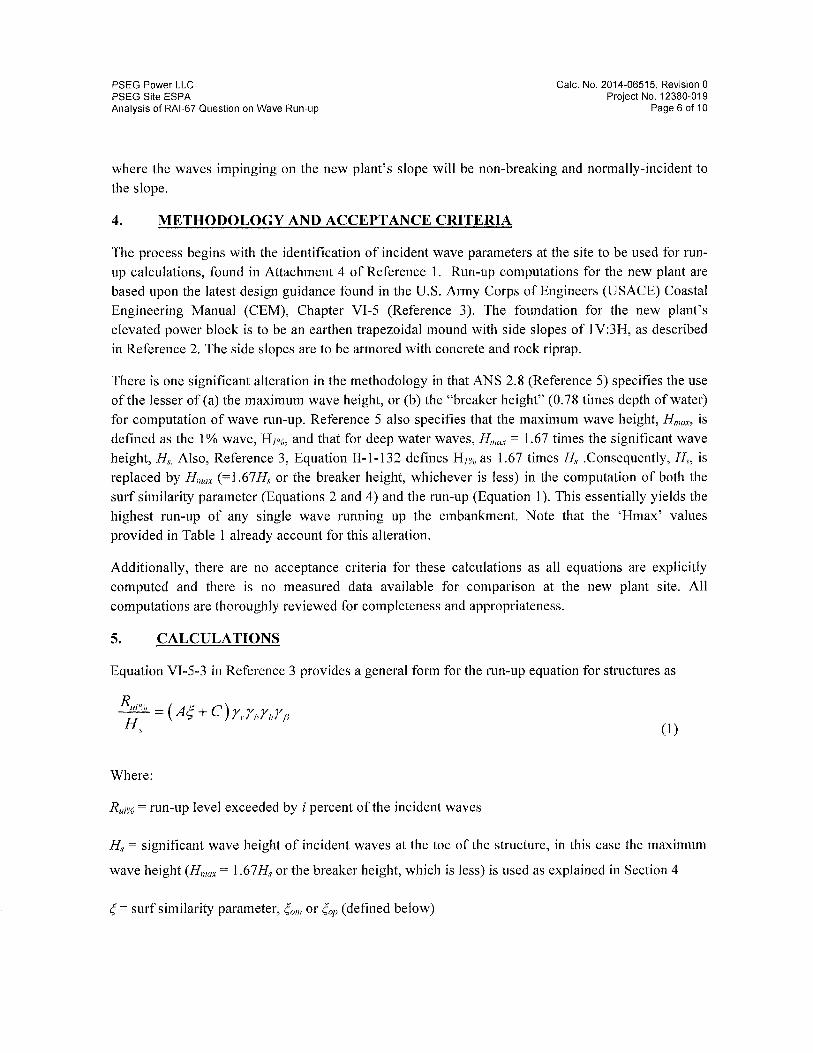
Equation VJ-5-3 in Reference 3 provides a general form for the run-up equation for structures as
(1)
Where:
RUi% = run-up level exceeded by i percent of the incident waves
H., = significant wave height of incident waves at the toe of the structure, in this case the maximum
wave height (Hnwx = 1.67H., or the breaker height, which is less) is used as explained in Section 4
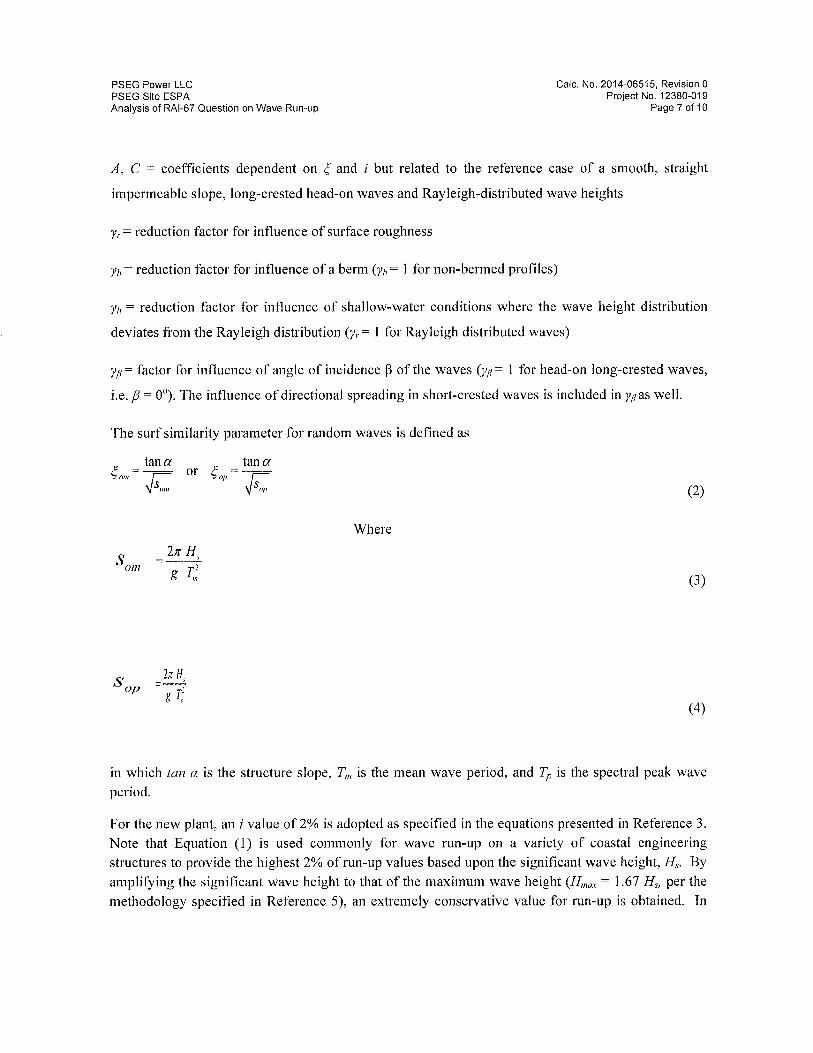
(= surf similarity parameter, (om or (op (defined below)
PSEG Power LLC PSEG Site ESPA Analysis of RAI-67 Question on Wave Run-up
This document details the response to RAJ 67, Question 02.04.05-15, regarding the calculation of wave run-up at the new plant's elevated power block for the design storm described in Reference 1. The calculations herein utilize the wave parameters from Reference 1 to calculate wave run-up using accepted methodology from the USACE CEM.
2. DESIGN INPUTS
There are two major design inputs to this calculation. The first is the physical layout of the new
plant's elevated power block; 1 V:3I-I side slopes armored with riprap. This is conveyed in SSAR Figure 2.5.4.5-2 (Reference 2). The second is the set of wave parameters at the site bracketing the peak of the design storm simulation that is documented in Attachment 4 of Reference 1 and is
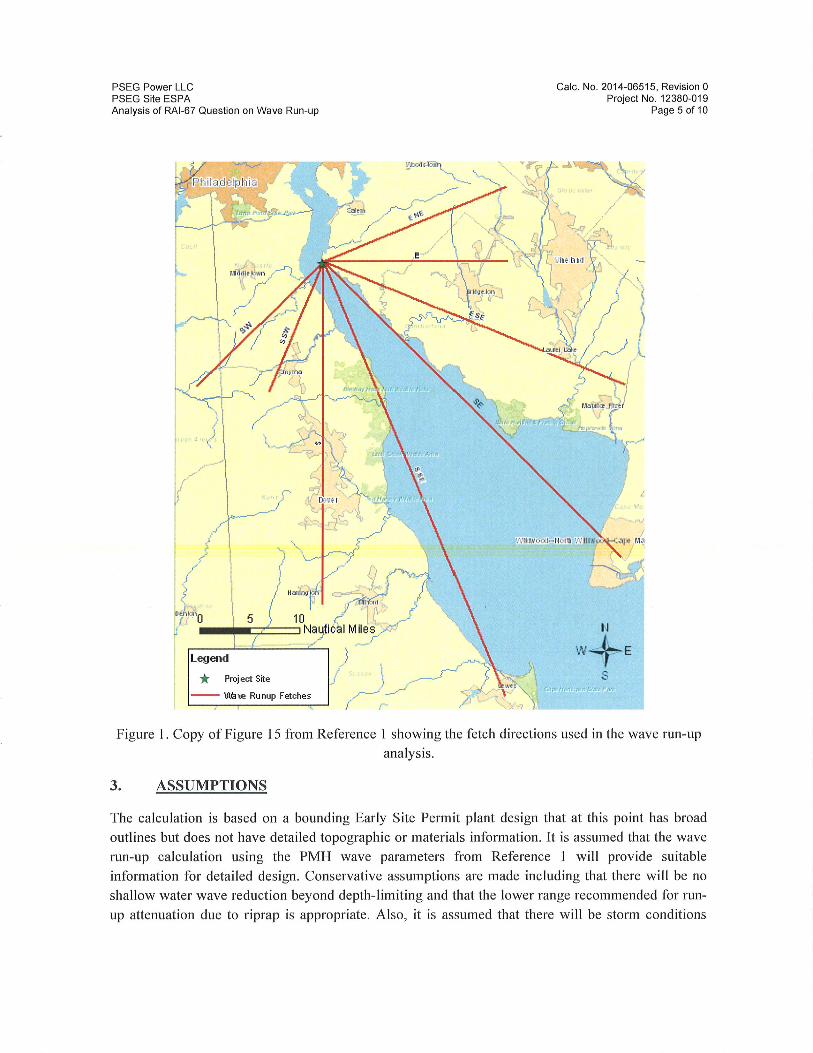
provided in Table 1 below. Figure 1 below is a copy of Figure 15 from Reference 1 that shows the fetch directions relative to the plant site. Note that a fetch analysis was performed in Reference 1 to determine the input wave information defined in Table 1 below; however, RAJ 67 Question
02.04.05-15 is specifically in regards to the run-up equation that was used in Reference 1, not the
supporting fetch analysis. As such, the resulting wave data produced from the fetch analysis in Reference 1 is used herein for the updated run-up calculations without modification.
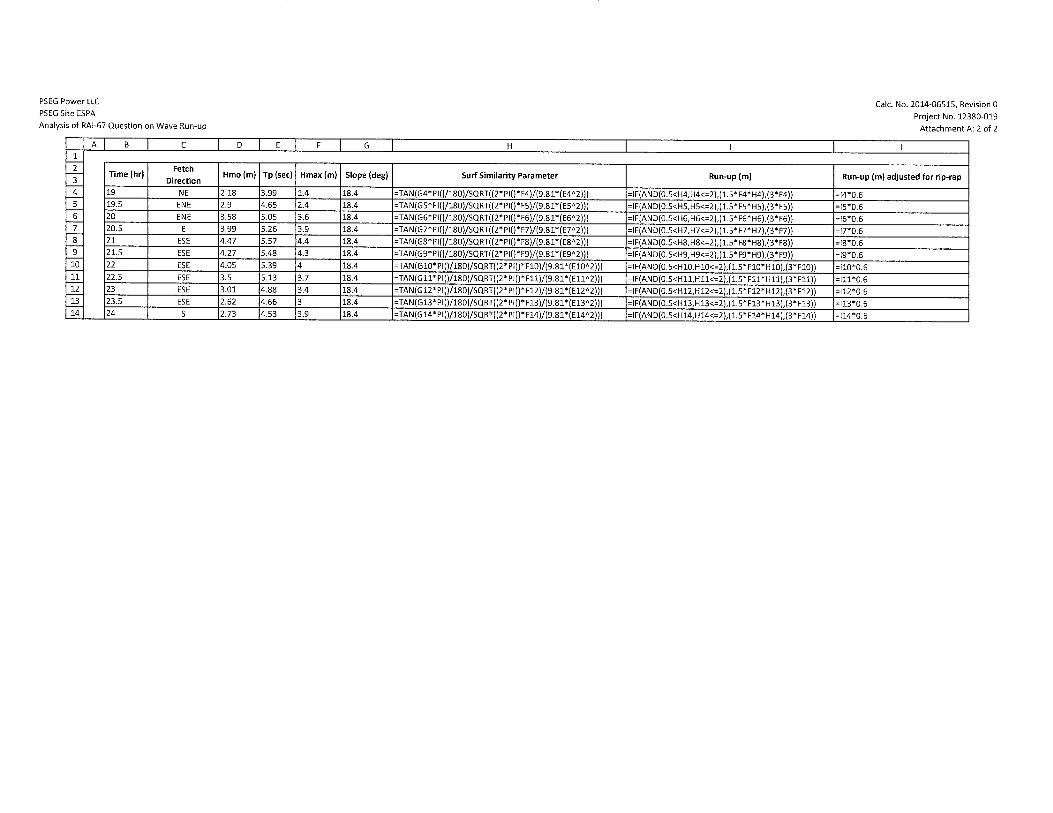
Table 1. Input wave parameters obtained from Attachment 4 of Reference 1.
19.0 NE 2.18 3.99 1.40 18.4 19.5 ENE 2.90 4.65 2.40 18.4 20.0 ENE 3.58 5.05 3.60 18.4 20.5 E 3.99 5.26 3.90 18.4 21.0 ESE 4.47 5.57 4.40 18.4 21.5 ESE 4.27 5.48 4.30 18.4 22.0 ESE 4.05 5.39 4.00 18.4 22.5 ESE 3.50 5.13 3.70 18.4 23.0 ESE 3.01 4.88 3.40 18.4 23.5 ESE 2.62 4.66 3.00 18.4 24.0 S 2.73 4.53 3.90 18.4
iTlme column corresponds to the tllne step of the PMH event sImulated In Reference I. 2Fetch direction refers to the dominant wind direction at that time in the simulation and corresponds to the fetch
directions shown in Figure 2 below.
3Hmo corresponds to the energy-based significant wave from Reference I. 4Tp corresponds to the calculated spectral peak period applied in the calculations provided in Reference 1.
5Final Hmax used in the analysis was the lower of 1.67*Hmo or breaking wave height.
6SIope corresponds to angle created by the 1 V:3H side slopes.
PSEG Power LLC PSEG Site ESPA Analysis of RAI-67 Question on Wave Run-up
where the waves impinging on the new plant's slope will be non-breaking and normally-incident to
the slope.
4. METHODOLOGY AND ACCEPTANCE CRITERIA
The process begins with the identification of incident wave parameters at the site to be used for run
up calculations, found in Attachment 4 of Reference 1. Run-up computations for the new plant are
based upon the latest design guidance found in the U.S. Army Corps of Engineers (USACE) Coastal
Engineering Manual (CEM), Chapter VJ-5 (Reference 3). The foundation for the new plant's
elevated power block is to be an earthen trapezoidal mound with side slopes of 1 V:3H, as described
in Reference 2. The side slopes are to be armored with concrete and rock riprap.
There is one significant alteration in the methodology in that ANS 2.8 (Reference 5) specifies the use
of the lesser of (a) the maximum wave height, or (b) the "breaker height" (0.78 times depth of water)
for computation of wave run-up. Reference 5 also specifies that the maximum wave height, H max, is
defined as the I % wave, HJ%, and that for deep water waves, Hmax = 1.67 times the significant wave
height, n. Also, Reference 3, Equation JI-I-132 defines HJ% as 1.67 times H" .Consequently, H" is replaced by Hmax (=1.67H" or the breaker height, whichever is less) in the computation of both the
surf similarity parameter (Equations 2 and 4) and the run-up (Equation I). This essentially yields the
highest run-up of any single wave running up the embankment. Note that the 'Hmax' values
provided in Table I already account for this alteration.
Additionally, there are no acceptance criteria for these calculations as all equations are explicitly
computed and there is no measured data available for comparison at the new plant site. All
computations are thoroughly reviewed for completeness and appropriateness.
5. CALCULATIONS
Equation VJ-5-3 in Reference 3 provides a general form for the run-up equation for structures as
(1)
Where:
RUi% = run-up level exceeded by i percent of the incident waves
H, = significant wave height of incident waves at the toe of the structure, in this case the maximum
wave height (Hmax = 1.67 H, or the breaker height, which is less) is used as explained in Section 4
~ = surf similarity parameter, ~()m or ~()P ( defined below)
PSEG Power LLC PSEG Site ESPA Analysis of RAI-67 Question on Wave Run-up