Calculation of Heater-tube Thickness in Petroleum Refineries API STANDARD 530 SEVENTH EDITION, APRIL 2015 Copyright American Petroleum Institute Provided by IHS under license with API No reproduction or networking permitted without license from IHS --``,,,```,````,``,,,,,,`,,,`,`,-`-`,,`,,`,`,,`---
Transcript
Calculation of Heater-tube Thickness in Petroleum Refineries
API STANDARD 530SEVENTH EDITION, APRIL 2015
Copyright American Petroleum Institute
Provided by IHS under license with API
No reproduction or networking permitted without license from IHS
API publications necessarily address problems of a general nature. With respect to particular circumstances, local,state, and federal laws and regulations should be reviewed.
Neither API nor any of API's employees, subcontractors, consultants, committees, or other assignees make anywarranty or representation, either express or implied, with respect to the accuracy, completeness, or usefulness of theinformation contained herein, or assume any liability or responsibility for any use, or the results of such use, of anyinformation or process disclosed in this publication. Neither API nor any of API's employees, subcontractors,consultants, or other assignees represent that use of this publication would not infringe upon privately owned rights.
API publications may be used by anyone desiring to do so. Every effort has been made by the Institute to assure theaccuracy and reliability of the data contained in them; however, the Institute makes no representation, warranty, orguarantee in connection with this publication and hereby expressly disclaims any liability or responsibility for loss ordamage resulting from its use or for the violation of any authorities having jurisdiction with which this publication mayconflict.
API publications are published to facilitate the broad availability of proven, sound engineering and operatingpractices. These publications are not intended to obviate the need for applying sound engineering judgmentregarding when and where these publications should be utilized. The formulation and publication of API publicationsis not intended in any way to inhibit anyone from using any other practices.
Any manufacturer marking equipment or materials in conformance with the marking requirements of an API standardis solely responsible for complying with all the applicable requirements of that standard. API does not represent,warrant, or guarantee that such products do in fact conform to the applicable API standard.
Users of this Standard should not rely exclusively on the information contained in this document. Sound business,scientific, engineering, and safety judgment should be used in employing the information contained herein.
Where applicable, authorities having jurisdiction should be consulted.
Work sites and equipment operations may differ. Users are solely responsible for assessing their specific equipmentand premises in determining the appropriateness of applying the Standard. At all times users should employ soundbusiness, scientific, engineering, and judgment safety when using this Standard.
API is not undertaking to meet the duties of employers, manufacturers, or suppliers to warn and properly train andequip their employees, and others exposed, concerning health and safety risks and precautions, nor undertaking theirobligations to comply with authorities having jurisdiction
All rights reserved. No part of this work may be reproduced, translated, stored in a retrieval system, or transmitted by any means, electronic, mechanical, photocopying, recording, or otherwise, without prior written permission from the publisher. Contact the
Publisher, API Publishing Services, 1220 L Street, NW, Washington, DC 20005.
Nothing contained in any API publication is to be construed as granting any right, by implication or otherwise, for themanufacture, sale, or use of any method, apparatus, or product covered by letters patent. Neither should anythingcontained in the publication be construed as insuring anyone against liability for infringement of letters patent.
Shall: As used in a standard, “shall” denotes a minimum requirement in order to conform to the specification.
Should: As used in a standard, “should” denotes a recommendation or that which is advised but not required in orderto conform to the specification.
This document was produced under API standardization procedures that ensure appropriate notification andparticipation in the developmental process and is designated as an API standard. Questions concerning theinterpretation of the content of this publication or comments and questions concerning the procedures under whichthis publication was developed should be directed in writing to the Director of Standards, American PetroleumInstitute, 1220 L Street, NW, Washington, DC 20005. Requests for permission to reproduce or translate all or any partof the material published herein should also be addressed to the director.
Generally, API standards are reviewed and revised, reaffirmed, or withdrawn at least every five years. A one-timeextension of up to two years may be added to this review cycle. Status of the publication can be ascertained from theAPI Standards Department, telephone (202) 682-8000. A catalog of API publications and materials is publishedannually by API, 1220 L Street, NW, Washington, DC 20005.
Suggested revisions are invited and should be submitted to the Standards Department, API, 1220 L Street, NW,Washington, DC 20005, [email protected].
iii
Copyright American Petroleum Institute
Provided by IHS under license with API
No reproduction or networking permitted without license from IHS
Calculation of Heater-tube Thickness in Petroleum Refineries
1 Scope
This standard specifies the requirements and gives recommendations for the procedures and design criteria used for calculating the required wall thickness of new tubes and associated component fittings for fired heaters for the petroleum, petrochemical, and natural gas industries. These procedures are appropriate for designing tubes for service in both corrosive and noncorrosive applications. These procedures have been developed specifically for the design of refinery and related fired heater tubes (direct-fired, heat-absorbing tubes within enclosures). These procedures are not intended to be used for the design of external piping.
This standard does not give recommendations for tube retirement thickness; Annex A describes a technique for estimating the life remaining for a heater tube.
2 Normative References
The following referenced documents are indispensable for the application of this document. For dated references, only the edition cited applies. For undated references, the latest edition of the referenced document (including any amendments) applies.
ANSI/API Standard 560, Fired Heaters for General Refinery Service
ASME Boiler and Pressure Vessel Code (BPVC) 1, Section VIII, Division 1: Pressure Vessels—Rules for
Construction of Pressure Vessels
ASME Boiler and Pressure Vessel Code (BPVC), Section VIII, Division 2: Pressure Vessels—Rules for
Construction of Pressure Vessels—Alternative Rules
ASME B31.3, Process Piping
ASTM A106/A106M 2, Specification for Seamless Carbon Steel Pipe for High-Temperature Service
ASTM A192/A192M, Specification for Seamless Carbon Steel Boiler Tubes for High-Pressure Service
ASTM A209/A209M, Specification for Seamless Carbon-Molybdenum Alloy-Steel Boiler and Superheater
Tubes
ASTM A210/A210M, Specification for Seamless Medium-Carbon Steel Boiler and Superheater Tubes
ASTM A213/A213M, Specification for Seamless Ferritic and Austenitic Alloy-Steel Boiler, Superheater and
Heat-Exchanger Tubes
ASTM A312/A312M, Specification for Seamless and Welded Austenitic Stainless Steel Pipes
ASTM A335/A335M, Specification for Seamless Ferritic Alloy-Steel Pipe for High-Temperature Service
ASTM A376/A376M, Specification for Seamless Austenitic Steel Pipe for High-Temperature Central-Station
Service
1 ASME International, 3 Park Avenue, New York, NY 10016, www.asme.org. 2 ASTM International, 100 Barr Harbor Drive, West Conshohocken, Pennsylvania 19428, www.astm.org.
Copyright American Petroleum Institute
Provided by IHS under license with API
No reproduction or networking permitted without license from IHS
ASTM A608/A608M, Standard Specification for Centrifugally Cast Iron-Chromium-Nickel High-Alloy Tubing
for Pressure Application at High Temperatures
ASTM B407, Standard Specification for Nickel-Iron-Chromium Alloy Seamless Pipe and Tube
WRC Bulletin 541 3, Evaluation of Material Strength Data for Use in API Std 530, M. Prager, D.A. Osage, and C.H. Panzarella, 2013
3 Terms and Definitions
For the purposes of this document, the following terms and definitions apply.
3.1 actual inside diameter Di
Inside diameter of a new tube.
NOTE The actual inside diameter is used to calculate the tube skin temperature in Annex B and the thermal stress in Annex C.
3.2
component fitting Fittings connected to the fired heater tubes.
EXAMPLES Return bends, elbows, reducers.
NOTE 1 There is a distinction between standard component fittings and specially designed component fittings; see 5.9.
NOTE 2 Typical material specifications for standard component fittings are ASTM A234/A234M [1], ASTM A403/A403M [2], and ASTM B366 [3].
3.3
corrosion allowance
δCA Additional material thickness added to allow for material loss during the design life of the component.
3.4
design life tDL
Operating time used as a basis for tube design.
NOTE The design life is not necessarily the same as the retirement or replacement life.
3.5
design metal temperature Td
Tube-metal or skin temperature used for design.
NOTE This is determined by calculating the maximum tube metal temperature (Tmax in Annex B) or the equivalent tube metal temperature (Teq in 3.8) and adding an appropriate temperature allowance (see 3.16). A procedure for calculating the maximum tube metal temperature from the heat-flux is included in Annex B. When the equivalent tube metal temperature is used, the maximum operating temperature can be greater than the design metal temperature.
3 Welding Research Council, P.O. Box 201547, Shaker Heights, Ohio 44122, forengineers.org.
Copyright American Petroleum Institute
Provided by IHS under license with API
No reproduction or networking permitted without license from IHS
CALCULATION OF HEATER-TUBE THICKNESS IN PETROLEUM REFINERIES 3
When the equivalent tube metal temperature is used to determine the design metal temperature, this design metal temperature is only applicable to the rupture design. It is necessary to develop a separate design metal temperature applicable to the elastic design. The design metal temperature applicable to the elastic design is the maximum calculated tube metal temperature among all operating cases plus the appropriate temperature allowance.
3.6
elastic allowable stress
time-independent allowable stress
σel
Allowable stress for the elastic range. See 6.2.
3.7
elastic design pressure pel
Maximum pressure that the heater coil can sustain for short periods of time.
NOTE This pressure is usually related to relief-valve settings, pump shut-in pressures, etc.
3.8
equivalent tube metal temperature Teq
Calculated constant metal temperature that in a specified period of time produces the same creep damage as does a changing metal temperature.
NOTE The equivalent tube metal temperature concept is described in more detail in 5.8. It provides a procedure to calculate the equivalent tube metal temperature based on a linear change of tube metal temperature from start-of-run to end-of-run.
3.9
inside diameter
Inside diameter of a tube with the corrosion allowance removed; used in the design calculations.
NOTE The inside diameter of an as-cast tube is the inside diameter of the tube with the porosity and corrosion allowances removed.
3.10
minimum thickness
δmin
Minimum required thickness of a new tube, taking into account all appropriate allowances.
NOTE See 5.4, Equation (5).
3.11
outside diameter Do
Outside diameter of a new tube.
3.12
rupture allowable stress
time-dependent allowable stress
σr
Allowable stress for the creep-rupture range. See 5.4.
iD ∗
Copyright American Petroleum Institute
Provided by IHS under license with API
No reproduction or networking permitted without license from IHS
Maximum operating pressure that the coil section can sustain during normal operation.
3.14
rupture exponent
n
Parameter used for design in the creep-rupture range.
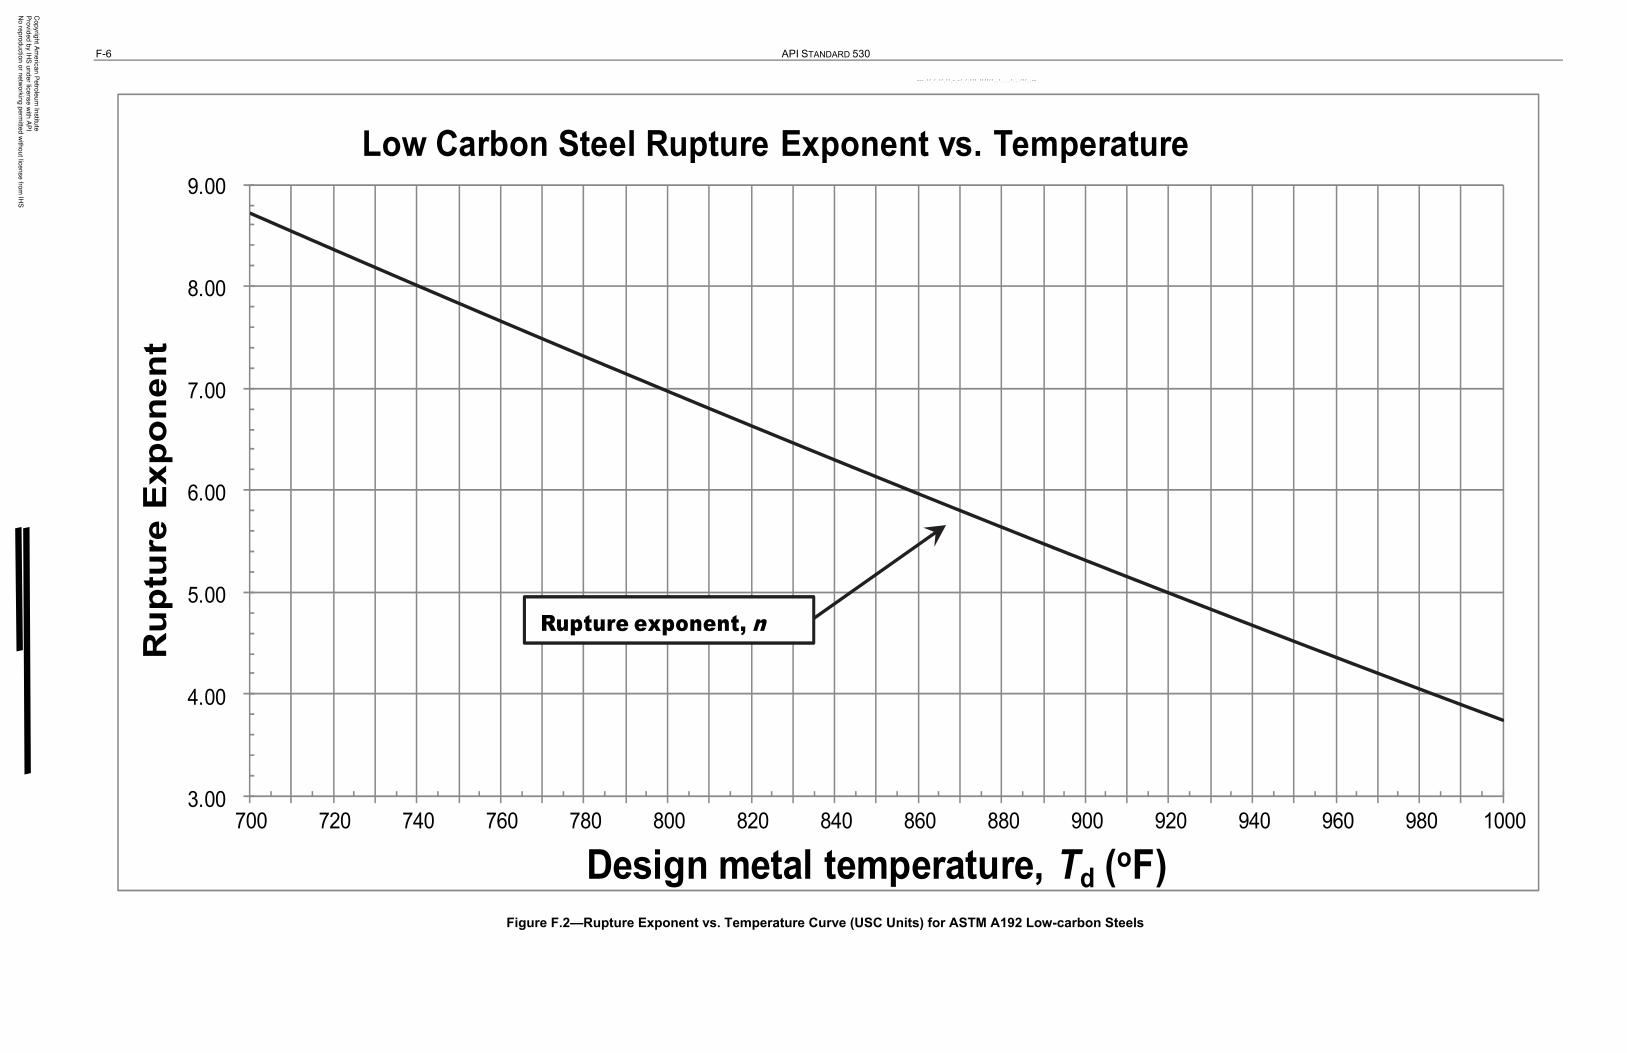
NOTE See Figures E.2 through E.65 and Tables E.1 through E.22 (and Figures F.2 through F.65 and Tables F.1 through F.22).
3.15
stress thickness
δσ
Thickness, excluding all thickness allowances, calculated from an equation that uses an allowable stress.
3.16
temperature allowance TA Part of the design metal temperature that is included for process- or flue-gas mal-distribution, operating unknowns, and design inaccuracies.
NOTE The temperature allowance is added to the calculated maximum tube metal temperature or to the equivalent tube metal temperature to obtain the design metal temperature (see 3.5).
4 General Design Information
4.1 Information Required
The design parameters (design pressures, design fluid temperature, corrosion allowance, and tube material) shall be defined. In addition, the following information shall be furnished:
a) design life of the heater tube;
b) whether the equivalent-temperature concept is to be applied and, if so, the operating conditions at the start and at the end of the run;
c) temperature allowance (see ANSI/API 560), if any;
d) corrosion fraction (if different from that shown in Figure 1);
e) whether elastic-range thermal-stress limits are to be applied.
If any of items a) to e) are not furnished, use the following applicable parameters:
⎯ design life equal to 100,000 hours;
⎯ design metal temperature based on the maximum metal temperature (the equivalent-temperature concept shall not apply);
⎯ temperature allowance equal to 15 °C (25 °F);
Copyright American Petroleum Institute
Provided by IHS under license with API
No reproduction or networking permitted without license from IHS
CALCULATION OF HEATER-TUBE THICKNESS IN PETROLEUM REFINERIES 5
⎯ corrosion fraction given in Figure 1;
⎯ elastic-range thermal-stress limits.
4.2 Limitations for Design Procedures
4.2.1 The allowable stresses are based on a consideration of yield strength and rupture strength only; plastic or creep strain has not been considered. Using these allowable stresses can result in small permanent strains in some applications; however, these small strains do not affect the safety or operability of heater tubes.
4.2.2 No considerations are included for adverse environmental effects, such as graphitization, carburization or hydrogen attack. Limitations imposed by hydrogen attack may be developed from the Nelson curves in API 941
[4].
4.2.3 These design procedures have been developed for seamless tubes. They are not applicable to tubes that have a longitudinal weld. ANSI/API 560 allows only seamless tubes.
4.2.4 These design procedures have been developed for thin tubes (tubes with a thickness-to-outside-diameter ratio, δmin/Do, of less than 0.15). Additional considerations can apply to the design of thicker tubes.
4.2.5 No considerations are included for the effects of cyclic pressure or cyclic thermal loading.
4.2.6 Limits for thermal stresses are provided in Annex C. Stresses imposed by tube/fluid weight, supports, end connections, and so forth are not discussed in this standard.
4.2.7 The relationship between temperature, stress, and time to failure (taken here to mean test, service, or design life) is represented by the Larson-Miller Parameter (LMP) as explained 6.6 and in H.5. The limiting design metal temperature ranges for each material for which the LMP applies are shown in Table 5.
4.2.8 The procedures in this standard have been developed for systems in which the heater tubes are subject to an internal pressure that exceeds the external pressure. There are some cases in which a heater tube can be subject to a greater external pressure than the internal pressure. This can occur, for example, in vacuum heaters or on other types of heaters during shutdown or trip conditions, especially when a unit is cooling or draining, forming a vacuum inside the heater tubes. Conditions where external pressures exceed the internal pressures can govern heater-tube wall thickness. Determination of this (i.e. vacuum design) is not covered in this standard. In the absence of applicable local or national codes, it is recommended that a pressure vessel code, such as ASME BPVC, Section VIII, Division 1 be used to address external pressure designs.
5 Design
5.1 General
There is a fundamental difference between the behavior of carbon steel in a hot-oil heater tube operating at 300 °C (575 °F) and that of chromium-molybdenum steel in a catalytic-reformer heater tube operating at 600 °C (1110 °F). The steel operating at the higher temperature creeps, or deforms permanently, even at stress levels well below the yield strength. If the tube metal temperature is high enough for the effects of creep to be significant, the tube eventually fails due to creep rupture, although no corrosion or oxidation mechanism is active. For the steel operating at the lower temperature, the effects of creep are nonexistent or negligible. Experience indicates that, in this case, the tube lasts indefinitely, unless a corrosion or an oxidation mechanism is active.
Copyright American Petroleum Institute
Provided by IHS under license with API
No reproduction or networking permitted without license from IHS
Since there is a fundamental difference between the behaviors of the materials at these two temperatures, there are two different design considerations for heater tubes: elastic design and creep-rupture design. Elastic design is design in the elastic range, in which allowable stresses are based on the yield strength (see 5.3) and are independent of service time. Creep-rupture design (referred to below as rupture design) is the design for the creep-rupture range, at higher temperatures, in which allowable stresses are based on the rupture strength (see 5.4) and are dependent of service time.
The temperature that separates the elastic and creep-rupture ranges of a heater tube is not a single value; it is a range of temperatures that depends on the alloy. For carbon steel, the lower end of this temperature range is about 425 °C (800 °F); for type 347 stainless steel, the lower end of this temperature range is about 590 °C (1100 °F). The considerations that govern the design range also include the elastic design pressure, the rupture design pressure, the design life, and the corrosion allowance.
The rupture design pressure is never more than the elastic design pressure. The characteristic that differentiates these two pressures is the relative length of time over which they are sustained. The rupture design pressure is a long-term loading condition over a period of years. The elastic design pressure is usually a short-term loading condition that typically lasts only hours or days. The rupture design pressure is used in the rupture design equation, since creep damage accumulates as a result of the action of the operating, or long-term, stress. The elastic design pressure is used in the elastic design equation to prevent excessive stresses in the tube during periods of operation at the maximum pressure.
The tube shall be designed to withstand the rupture design pressure for long periods of operation. If the operating pressure increases during an operating run, the highest pressure shall be taken as the rupture design pressure.
In the temperature range near or above the point where the elastic and rupture allowable stress curves cross, both elastic and rupture design equations are to be used. The larger value of δmin shall govern the design (see 5.5). A sample calculation that uses these methods is included in Section 7. Calculation sheets (see Annex D) are available for summarizing the calculations of minimum thickness and equivalent tube metal temperature.
The minimum allowable thickness of a new tube is given in Table 1. All of the design equations described in Section 5 are summarized in Table 2.
If the heater is required to operate in turndown or operating conditions other than design mode, the purchaser shall identify this on the datasheet. A review of these operations is required with the purpose of identifying the most conservative case.
Copyright American Petroleum Institute
Provided by IHS under license with API
No reproduction or networking permitted without license from IHS
In both the elastic range and the creep-rupture range, the design equation is based on the mean-diameter equation for stress in a tube. In the elastic range, the elastic design pressure, pel, and the elastic allowable stress, σel, are used. In the creep-rupture range, the rupture design pressure, pr, and the rupture allowable stress, σr, are used.
The mean-diameter equation gives a good estimate of the pressure that produces yielding through the entire tube wall in thin tubes (see 4.2, fourth paragraph, for a definition of thin tubes). The mean-diameter equation also provides a good correlation between the creep rupture of a pressurized tube and a uniaxial test specimen. Therefore, it shall be used in both the elastic range and the creep-rupture range [5], [6], [7], [8]. The mean-diameter equation for stress is as given in Equation (1):
o i 1 12 2
D Dp pσ
δ δ
= − = +
(1)
where
σ is the stress, expressed in megapascals (pounds per square inch);
p is the pressure, expressed in megapascals (pounds per square inch);
Do is the outside diameter, expressed in millimeters (inches);
Di is the inside diameter, expressed in millimeters (inches), including the corrosion allowance;
δ is the thickness, expressed in millimeters (inches).
The equations for the stress thickness, δσ, in 5.3 and 5.4 are derived from Equation (1).
5.3 Elastic Design
The elastic design is based on preventing failure by bursting when the pressure is at its maximum (that is, when a pressure excursion has reached pel) near the end of the design life after the corrosion allowance has been used up. With the elastic design, δσ and δmin (see 5.6) are calculated as given in Equations (2) and (3):
el o el iσ σ
el el el elor
2 2p D p D
p pδ δ
σ σ
∗
= =+ −
(2)
δmin = δσ + δCA (3)
where
is the inside diameter, expressed in millimeters (inches), with corrosion allowance removed;
σel is the elastic allowable stress, expressed in megapascals (pounds per square inch), at the design metal temperature.
iD ∗
Copyright American Petroleum Institute
Provided by IHS under license with API
No reproduction or networking permitted without license from IHS
CALCULATION OF HEATER-TUBE THICKNESS IN PETROLEUM REFINERIES 9
5.4 Rupture Design
The rupture design is based on preventing failure by creep rupture during the design life. With the rupture design, δσ and δmin (see 5.6) are calculated from Equations (4) and (5):
r o r iσ σ
r r r ror
2 2p D p D
p pδ δ
σ σ
∗
= =+ −
(4)
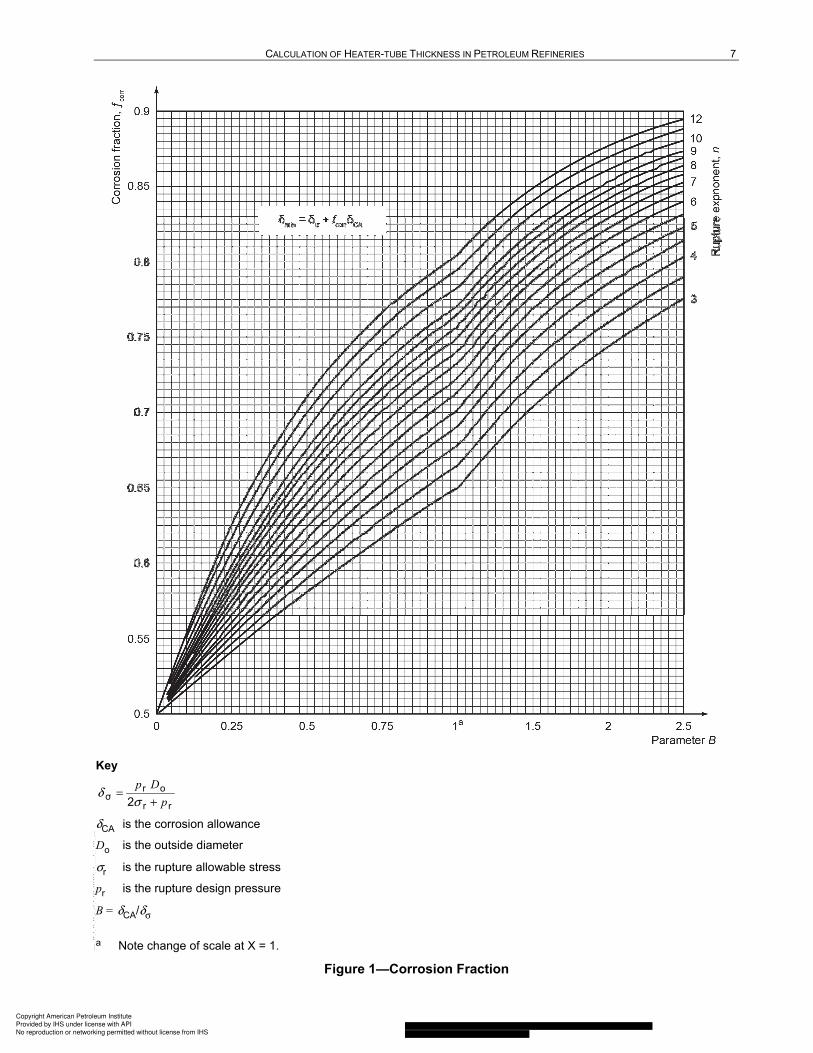
δmin = δσ + fcorrδCA (5)
where
σr is the rupture allowable stress, expressed in megapascals (pounds per square inch), at the design metal temperature and the design life;
fcorr is the corrosion fraction, given as a function of B and n in Figure 1;
B = δCA/δσ ;
n is the rupture exponent at the design metal temperature (shown in the figures given in Annexes E and F).
The derivation of the corrosion fraction is described in Annex G. It is recognized in this derivation that stress is reduced by the corrosion allowance; correspondingly, the rupture life is increased.
Equations (4) and (5) are suitable for heater tubes; however, if special circumstances require that the user choose a more conservative design, a corrosion fraction of unity ( fcorr = 1) may be specified.
5.5 Intermediate Temperature Range
At temperatures near or above the point where the curves of σel and σr intersect in the figures given in Annex E and Annex F, either elastic or rupture considerations govern the design. In this temperature range, it is necessary to apply both the elastic and the rupture designs. The larger value of δmin shall govern the design.
5.6 Minimum Allowable Thickness
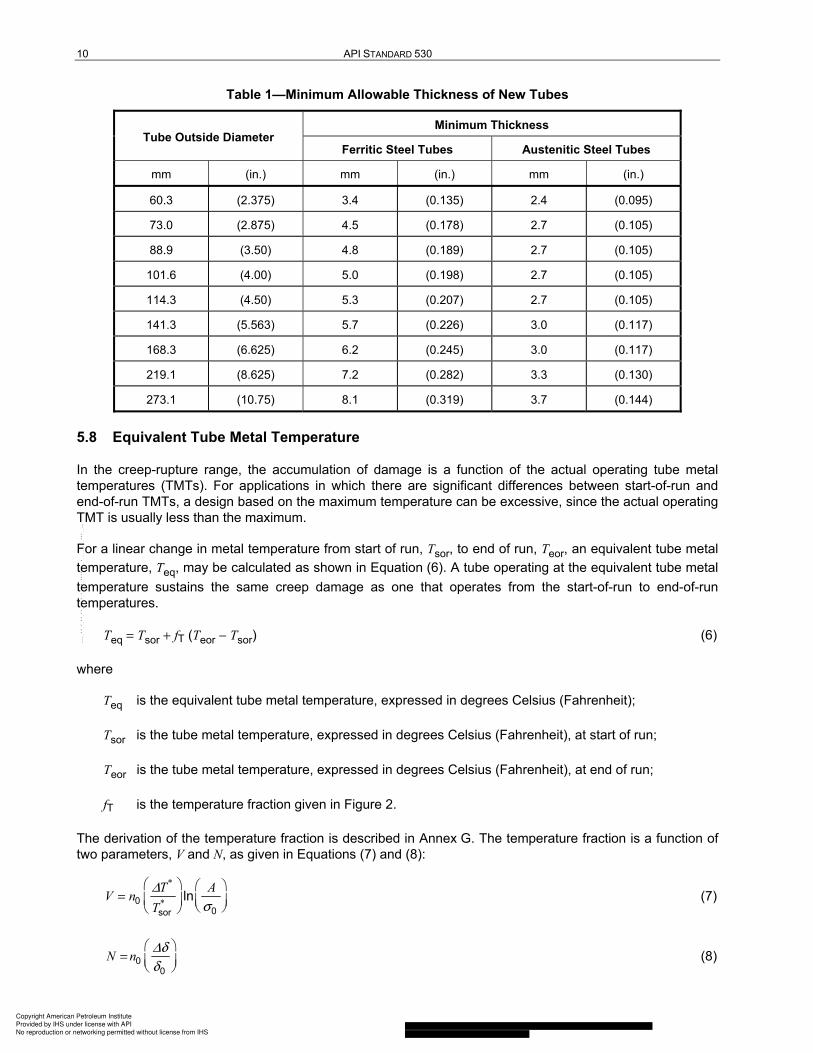
The minimum thickness, δmin, of a new tube (including the corrosion allowance) shall not be less than that shown in Table 1. For ferritic steels, the values shown are the minimum allowable thicknesses of schedule 40 average wall pipe. For austenitic steels, the values are the minimum allowable thicknesses of schedule 10S average wall pipe. (Table 6 shows which alloys are ferritic and which are austenitic.) The minimum allowable thicknesses are as defined in applicable ASTM specifications. These minima are based on industry practice. The minimum allowable thickness is not the retirement or replacement thickness of a used tube.
5.7 Minimum and Average Thicknesses
All thickness specifications shall indicate whether the specified value is a minimum or an average thickness. The tolerance used to relate the minimum and average wall thicknesses shall be the tolerance given in the ASTM specification to which the tubes or pipes are purchased.
Copyright American Petroleum Institute
Provided by IHS under license with API
No reproduction or networking permitted without license from IHS
In the creep-rupture range, the accumulation of damage is a function of the actual operating tube metal temperatures (TMTs). For applications in which there are significant differences between start-of-run and end-of-run TMTs, a design based on the maximum temperature can be excessive, since the actual operating TMT is usually less than the maximum.
For a linear change in metal temperature from start of run, Tsor, to end of run, Teor, an equivalent tube metal temperature, Teq, may be calculated as shown in Equation (6). A tube operating at the equivalent tube metal temperature sustains the same creep damage as one that operates from the start-of-run to end-of-run temperatures.
Teq = Tsor + fT (Teor − Tsor) (6)
where
Teq is the equivalent tube metal temperature, expressed in degrees Celsius (Fahrenheit);
Tsor is the tube metal temperature, expressed in degrees Celsius (Fahrenheit), at start of run;
Teor is the tube metal temperature, expressed in degrees Celsius (Fahrenheit), at end of run;
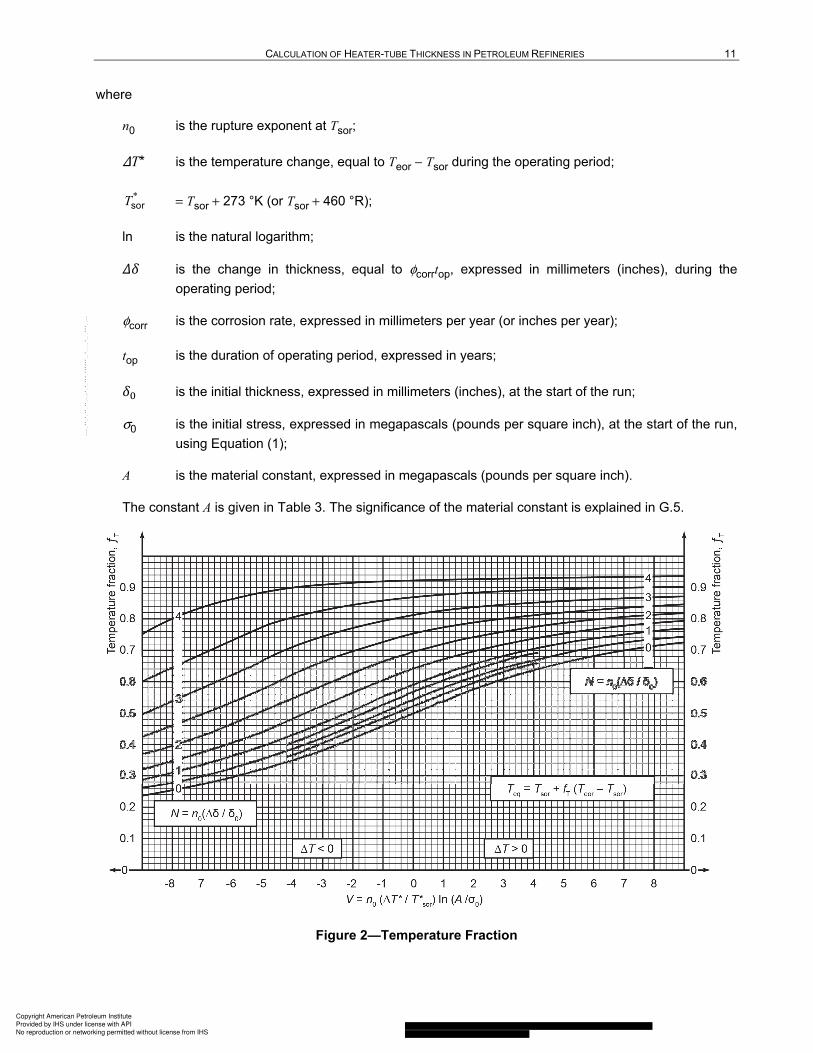
fT is the temperature fraction given in Figure 2.
The derivation of the temperature fraction is described in Annex G. The temperature fraction is a function of two parameters, V and N, as given in Equations (7) and (8):
00sor
ln*
*
T AV n
T
Δ
σ
=
(7)
00
N nΔδ
δ
=
(8)
Copyright American Petroleum Institute
Provided by IHS under license with API
No reproduction or networking permitted without license from IHS
where δσ is the stress thickness, expressed in millimeters (inches); pel is the elastic design gauge pressure, expressed in megapascals (pounds per square inch); pr is the rupture design gauge pressure, expressed in megapascals (pounds per square inch); Do is the outside diameter, expressed in millimeters (inches);
is the inside diameter, expressed in millimeters (inches), with the corrosion allowance removed;
σel is the elastic allowable stress, expressed in megapascals (pounds per square inch), at the design metal temperature;
σr is the rupture allowable stress, expressed in megapascals (pounds per square inch), at the design metal temperature and design life;
δmin is the minimum thickness, expressed in millimeters (inches), including corrosion allowance;
δCA is the corrosion allowance, expressed in millimeters (inches); fcorr is the corrosion fraction, given in Figure 1 as a function of B and n, where CA σB δ δ= ;
n is the rupture exponent at the design metal temperature. Equivalent tube metal temperature:
( )eq sor T eor sorT T f T T= + − (6)
where
Δ (= Teor − Tsor) is the temperature change, expressed in degrees Kelvin (degrees Rankine), during the operating period;
Tsor is the tube metal temperature, expressed in degrees Celsius (Fahrenheit), at the start of the run; Teor is the tube metal temperature, expressed in degrees Celsius (Fahrenheit), at the end of the run;
= Tsor + 273 °K (or Tsor + 460 °R);
A is the material constant, expressed in megapascals (pounds per square inch) from Table 3; σ0 is the initial stress, expressed in megapascals (pounds per square inch), at the start of the run
using Equation (1); Δδ (= φcorrtop) is the change in thickness, expressed in millimeters (inches), during the operating
period; δ0 is the initial thickness, expressed in millimeters (inches), at the start of the run;
φcorr is the corrosion rate, expressed in millimeters per year (inches per year);
top is the duration, expressed in years, of the operating period.
iD ∗
T ∗
sorT ∗
Copyright American Petroleum Institute
Provided by IHS under license with API
No reproduction or networking permitted without license from IHS
The temperature fraction and the equivalent temperature shall be calculated for the first operating cycle. In applications that involve very high corrosion rates, the temperature fraction for the last cycle is greater than that for the first. In such cases, the calculation of the temperature fraction and the equivalent temperature should be based on the last cycle.
If the temperature change from start-of-run to end-of-run is other than linear, a judgment shall be made regarding the use of the value of fT given in Figure 2.
Note that the calculated thickness of a tube is a function of the equivalent temperature, which, in turn, is a function of the thickness (through the initial stress). A few iterations may be necessary to arrive at the design. (See the sample calculation in 7.4.)
Copyright American Petroleum Institute
Provided by IHS under license with API
No reproduction or networking permitted without license from IHS
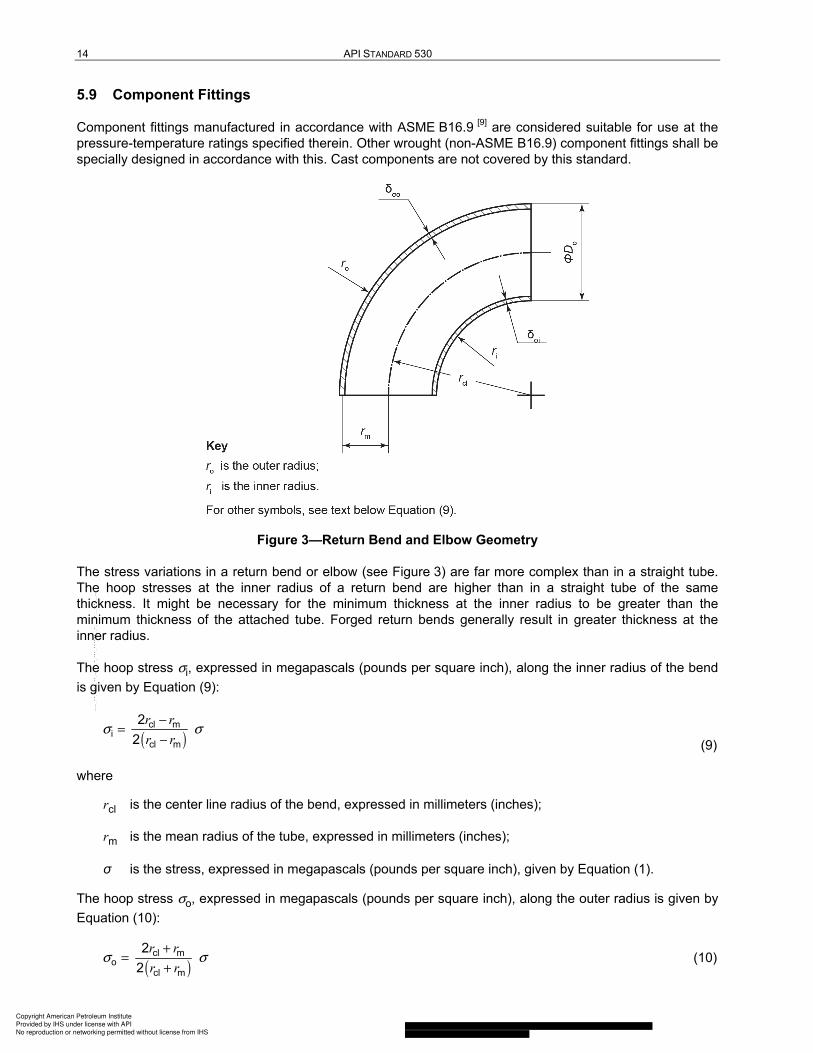
Component fittings manufactured in accordance with ASME B16.9 [9] are considered suitable for use at the pressure-temperature ratings specified therein. Other wrought (non-ASME B16.9) component fittings shall be specially designed in accordance with this. Cast components are not covered by this standard.
Figure 3—Return Bend and Elbow Geometry
The stress variations in a return bend or elbow (see Figure 3) are far more complex than in a straight tube. The hoop stresses at the inner radius of a return bend are higher than in a straight tube of the same thickness. It might be necessary for the minimum thickness at the inner radius to be greater than the minimum thickness of the attached tube. Forged return bends generally result in greater thickness at the inner radius.
The hoop stress σi, expressed in megapascals (pounds per square inch), along the inner radius of the bend is given by Equation (9):
( )cl m
icl m
2 2
r r
r rσ σ
−=
− (9)
where
rcl is the center line radius of the bend, expressed in millimeters (inches);
rm is the mean radius of the tube, expressed in millimeters (inches);
σ is the stress, expressed in megapascals (pounds per square inch), given by Equation (1).
The hoop stress σo, expressed in megapascals (pounds per square inch), along the outer radius is given by Equation (10):
( )cl m
ocl m
2 2
r r
r rσ σ
+=
+ (10)
Copyright American Petroleum Institute
Provided by IHS under license with API
No reproduction or networking permitted without license from IHS
CALCULATION OF HEATER-TUBE THICKNESS IN PETROLEUM REFINERIES 15
Using the approximation that rm is almost equal to Do/2, Equation (9) can be solved for the stress thickness at the inner radius. For design, the stress thickness is given by Equation (11).
oσi
i2D p
N pδ
σ=
+ (11)
where
δσi is the stress thickness, expressed in millimeters (inches), at the inner radius;
(12)
σ is the allowable stress, expressed in megapascals (pounds per square inch) at the design metal temperature.
NOTE 1 p represents both elastic design pressure and rupture design pressure.
The return bend thickness evaluations shall be made using both elastic design pressure and rupture design pressure, and the governing thicknesses shall be the larger values at the inner and outer radii.
Using the approximation given above, Equation (10) can be solved for the stress thickness at the outer radius. For elastic design, the stress thickness is as given in Equation (13):
oσo
o2D p
N pδ
σ=
+ (13)
where
δσo is the stress thickness, expressed in millimeters (inches), at the outer radius;
(14)
σ is the allowable stress, expressed in megapascals (pounds per square inch), at the design metal temperature.
NOTE 2 p represents both elastic design pressure and rupture design pressure.
The return bend thickness evaluations shall be made using both elastic design pressure and rupture design pressure, and the governing thicknesses shall be the larger values at the inner and outer radii.
The minimum thickness, δσi, at the inside radius and the minimum thickness, δσo, at the outside radius shall be calculated using Equations (11) and (13). The corrosion allowance, δCA, shall be added to the minimum calculated thickness.
The minimum thickness along the neutral axis of the bend shall be the same as for a straight tube.
r
DN
r
D
−
=
−
cl
oi
cl
o
4 2
4 1
r
DN
r
D
+
=
+
cl
oo
cl
o
4 2
4 1
Copyright American Petroleum Institute
Provided by IHS under license with API
No reproduction or networking permitted without license from IHS
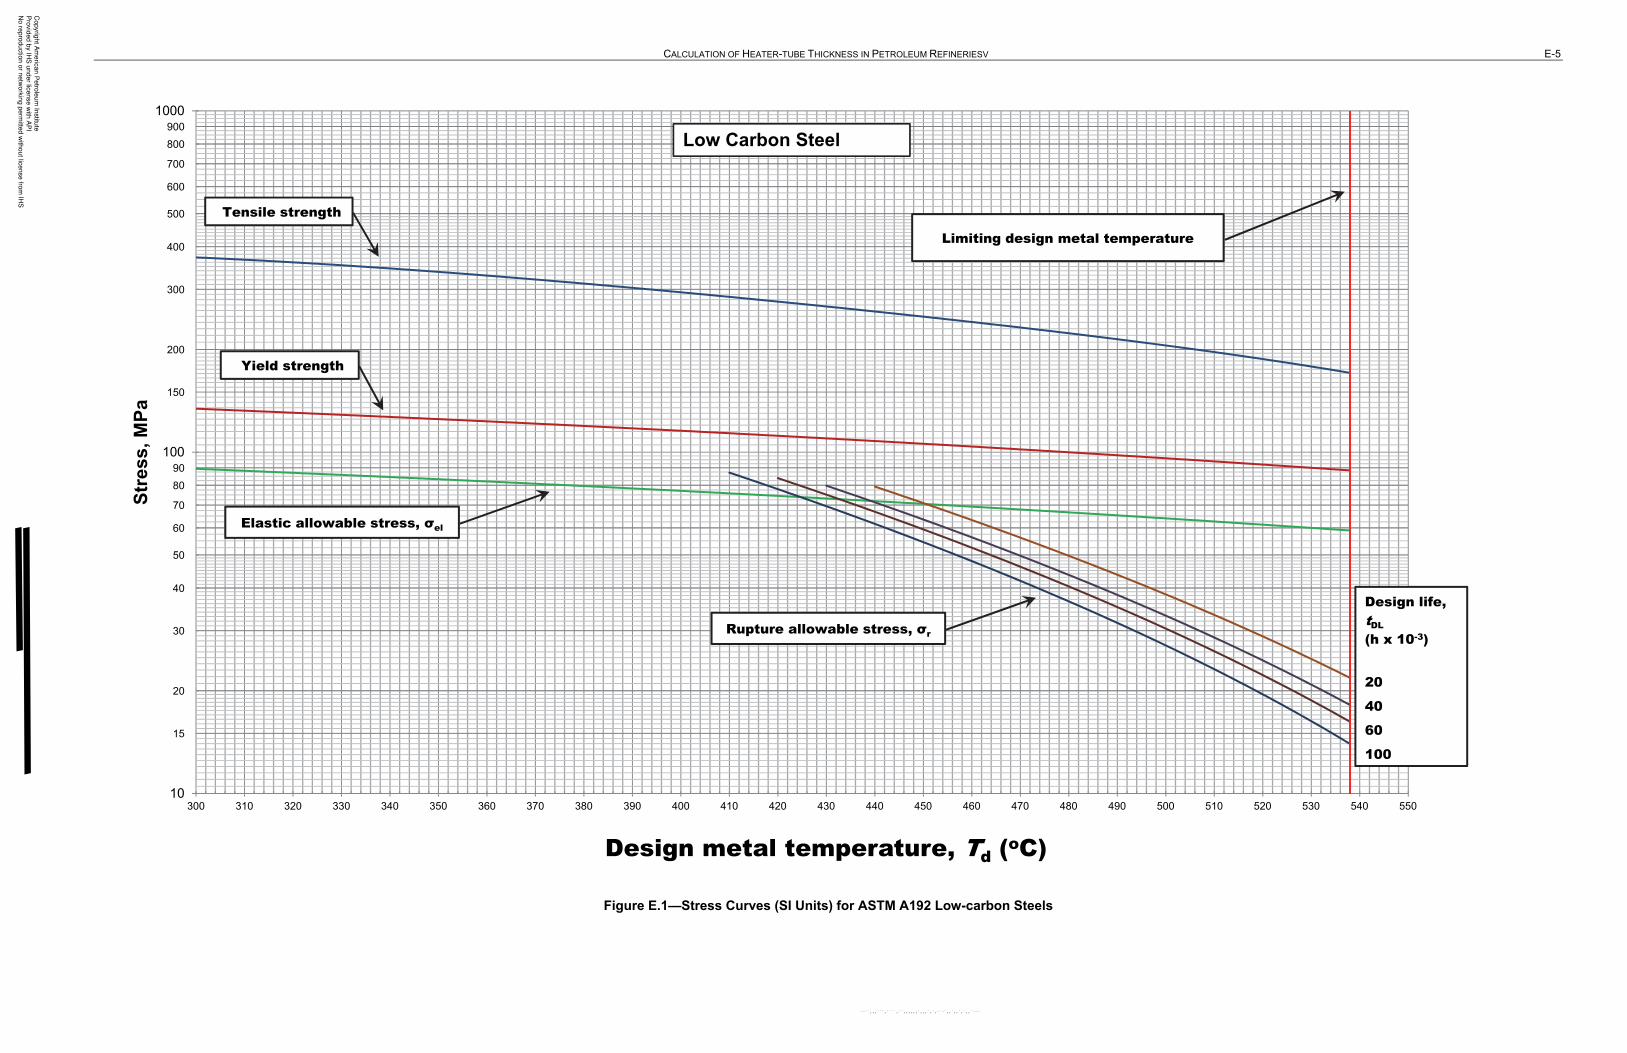
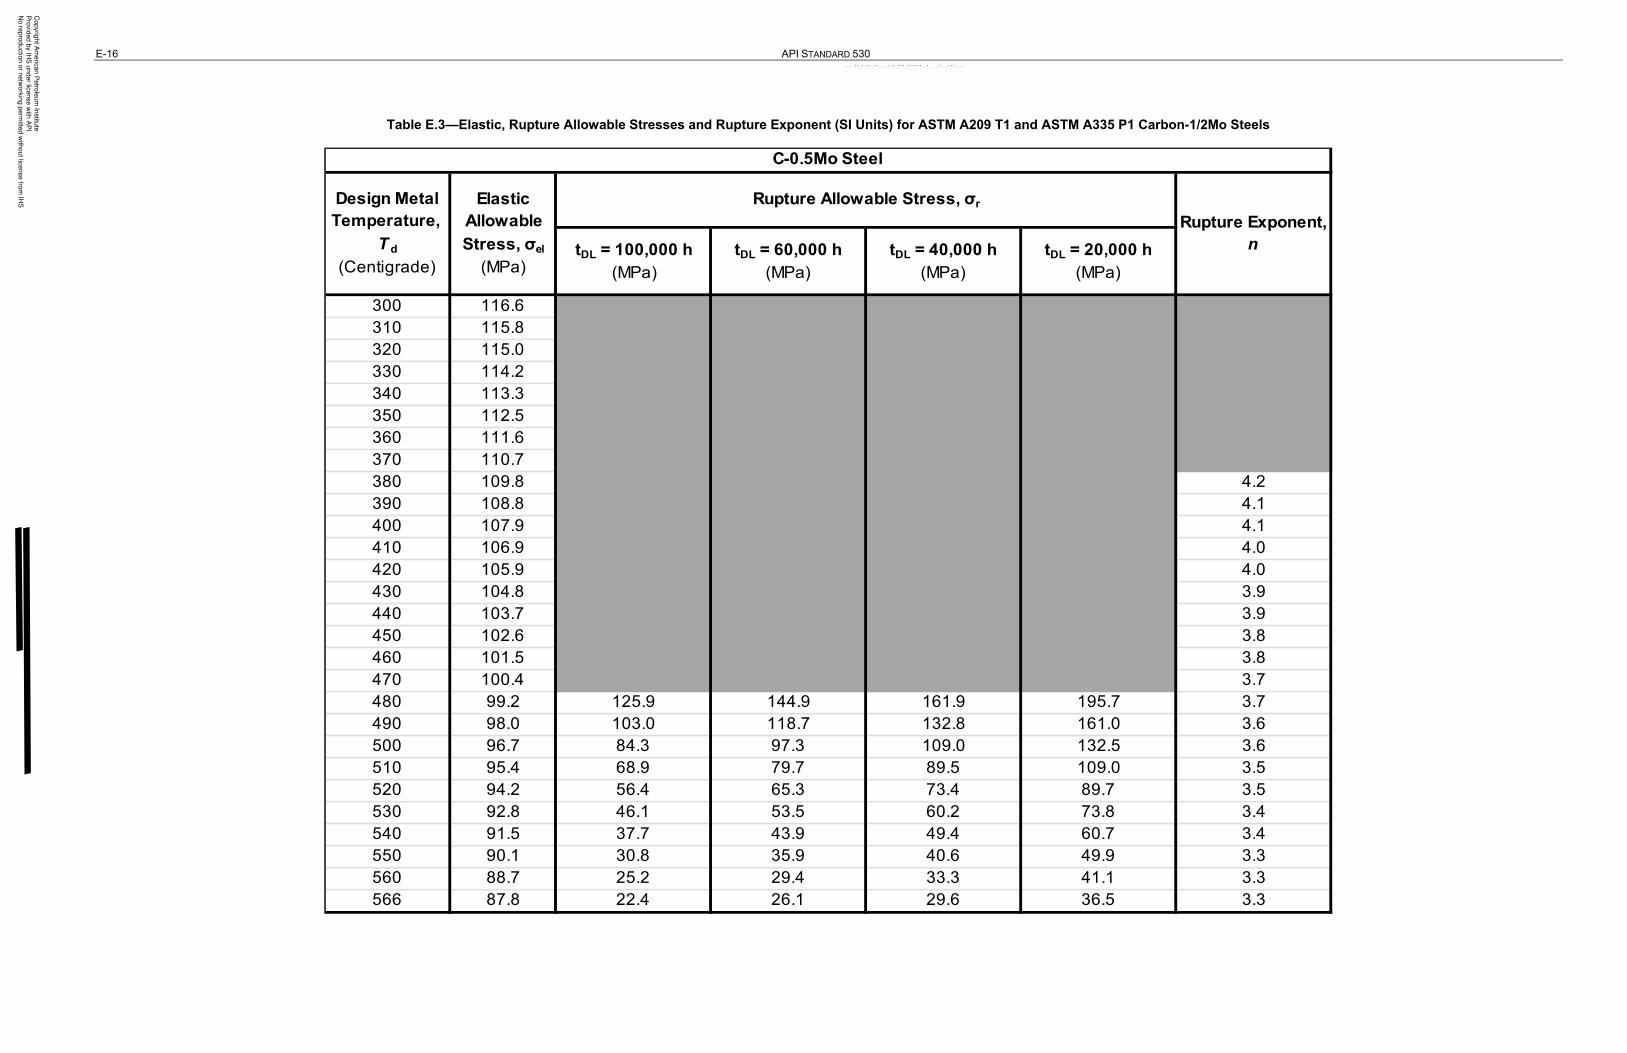
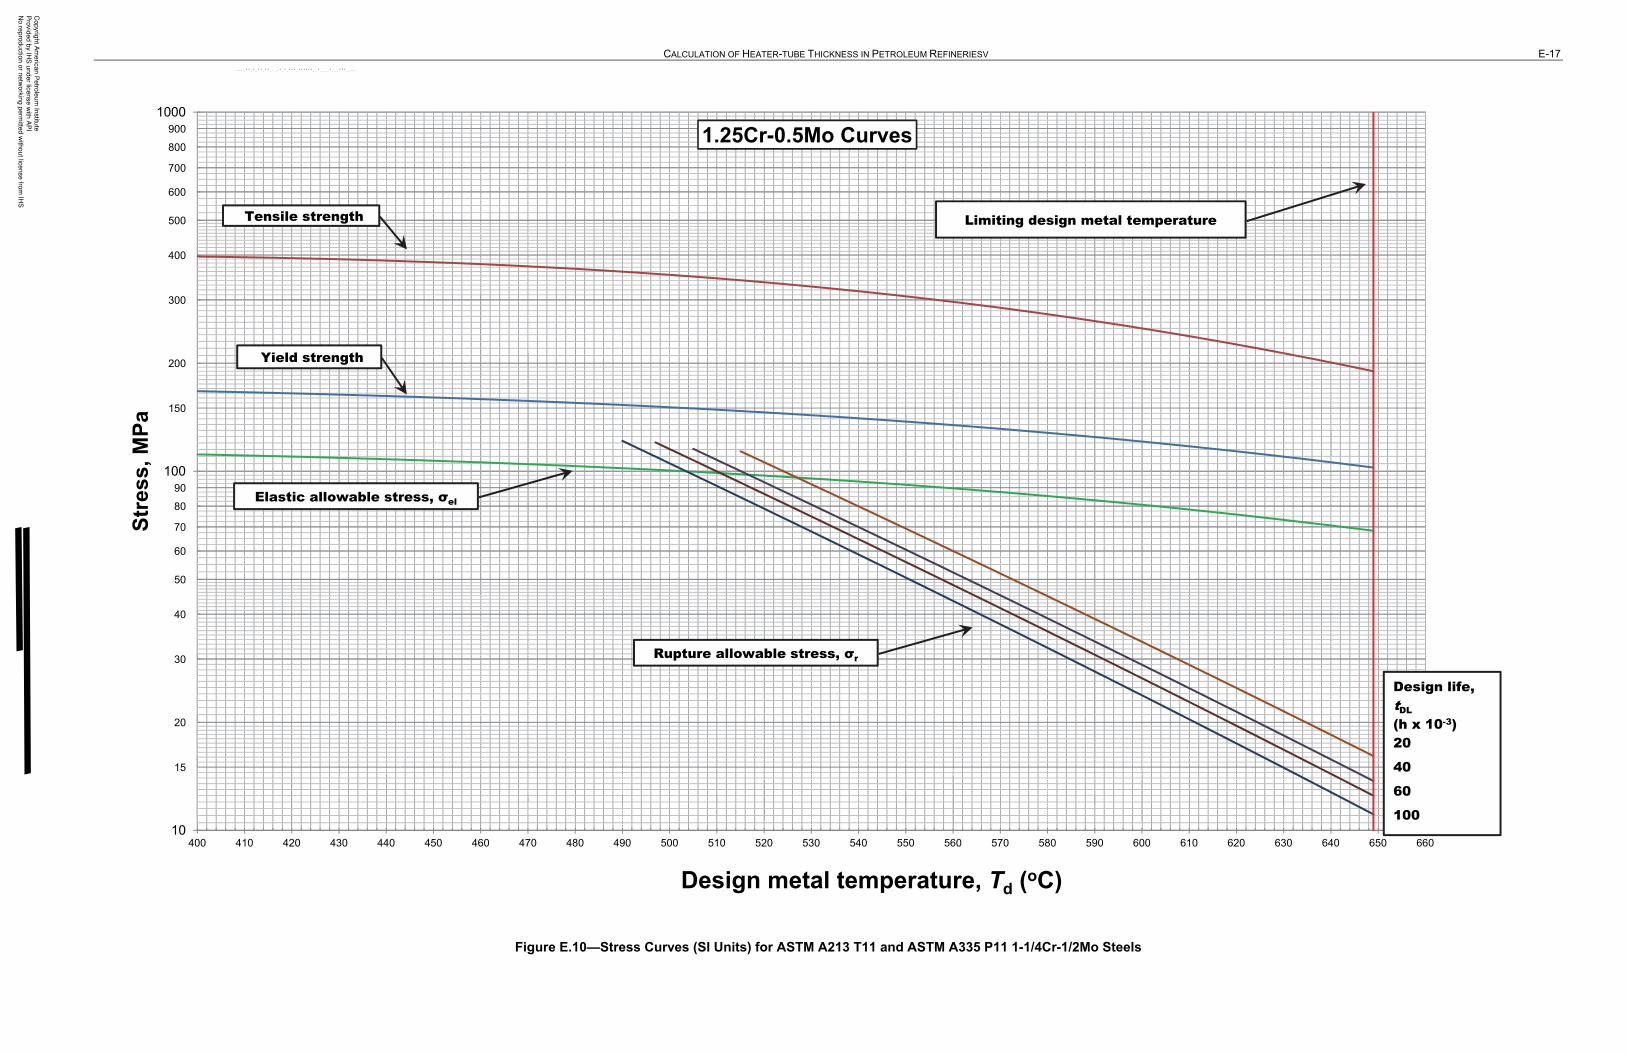
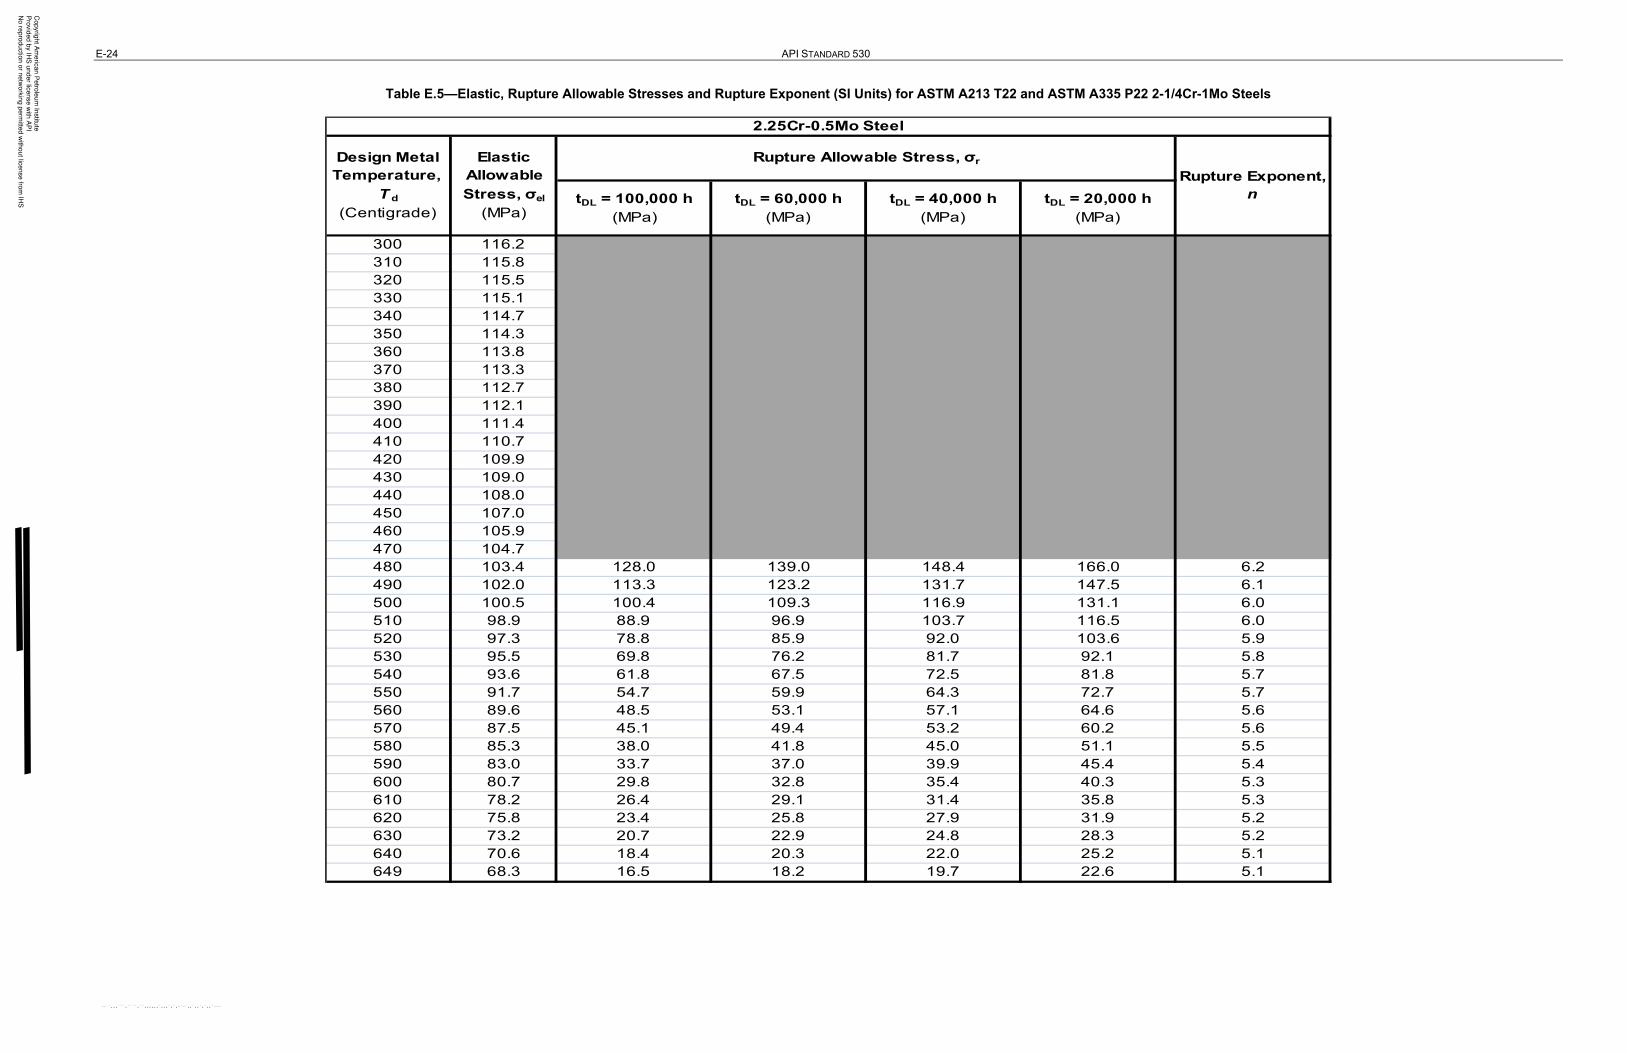
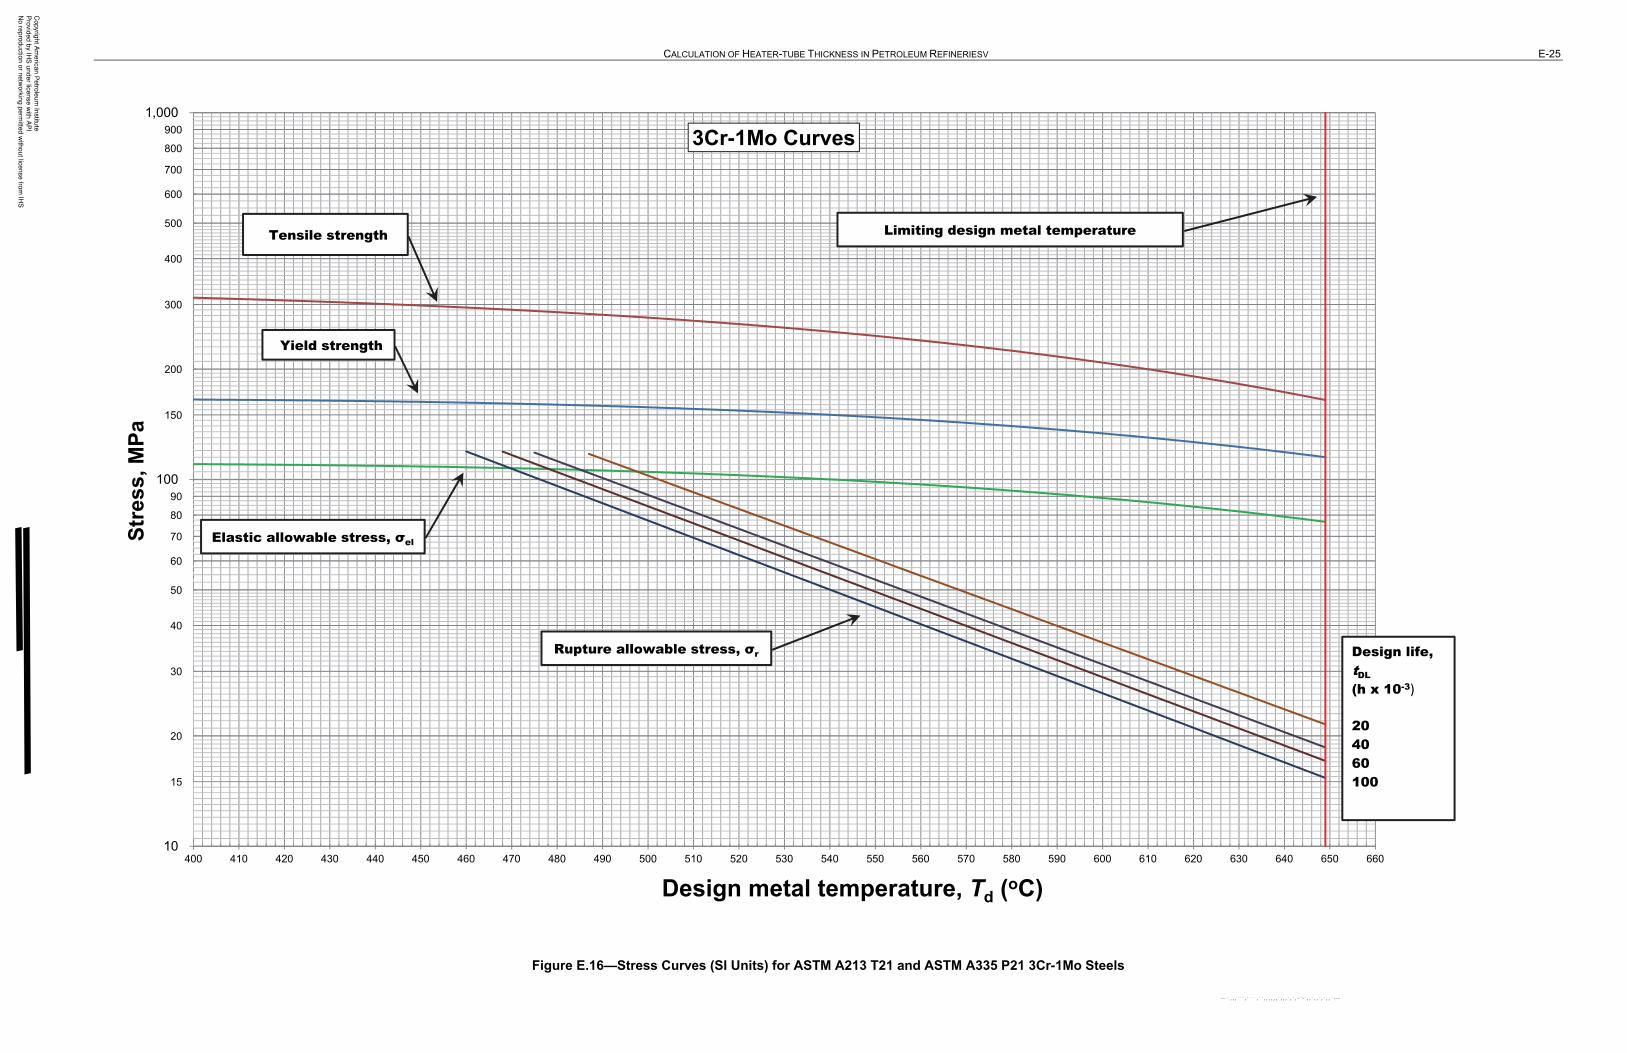
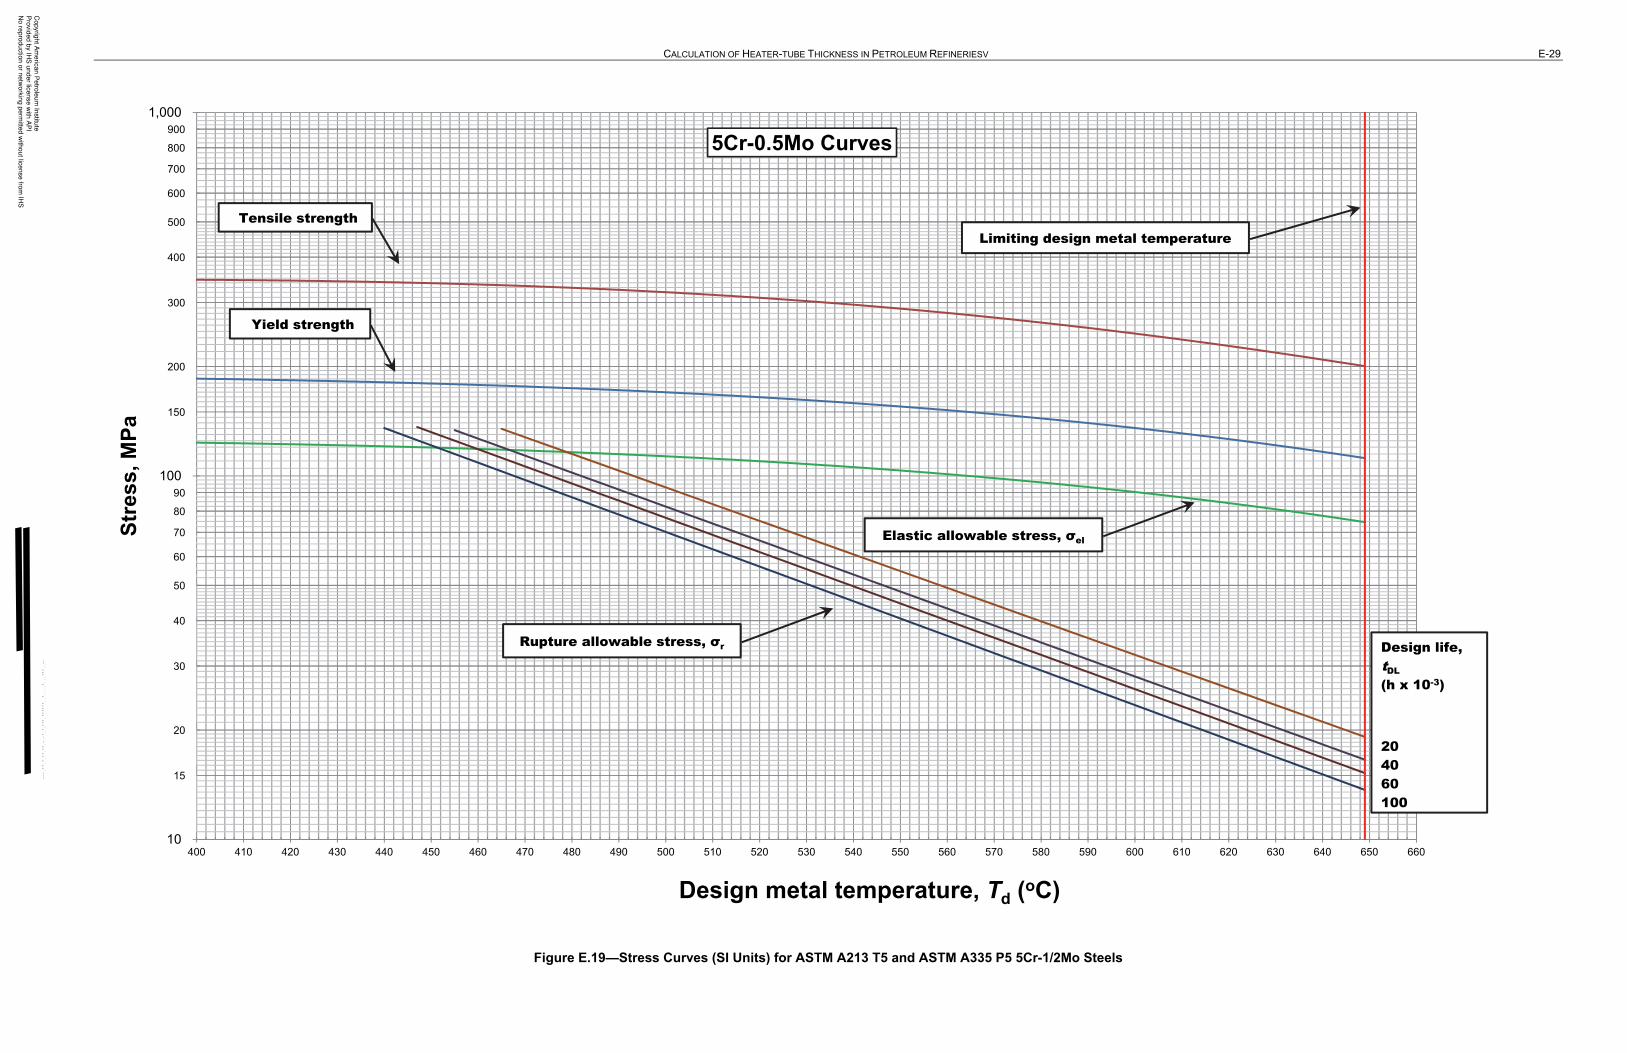
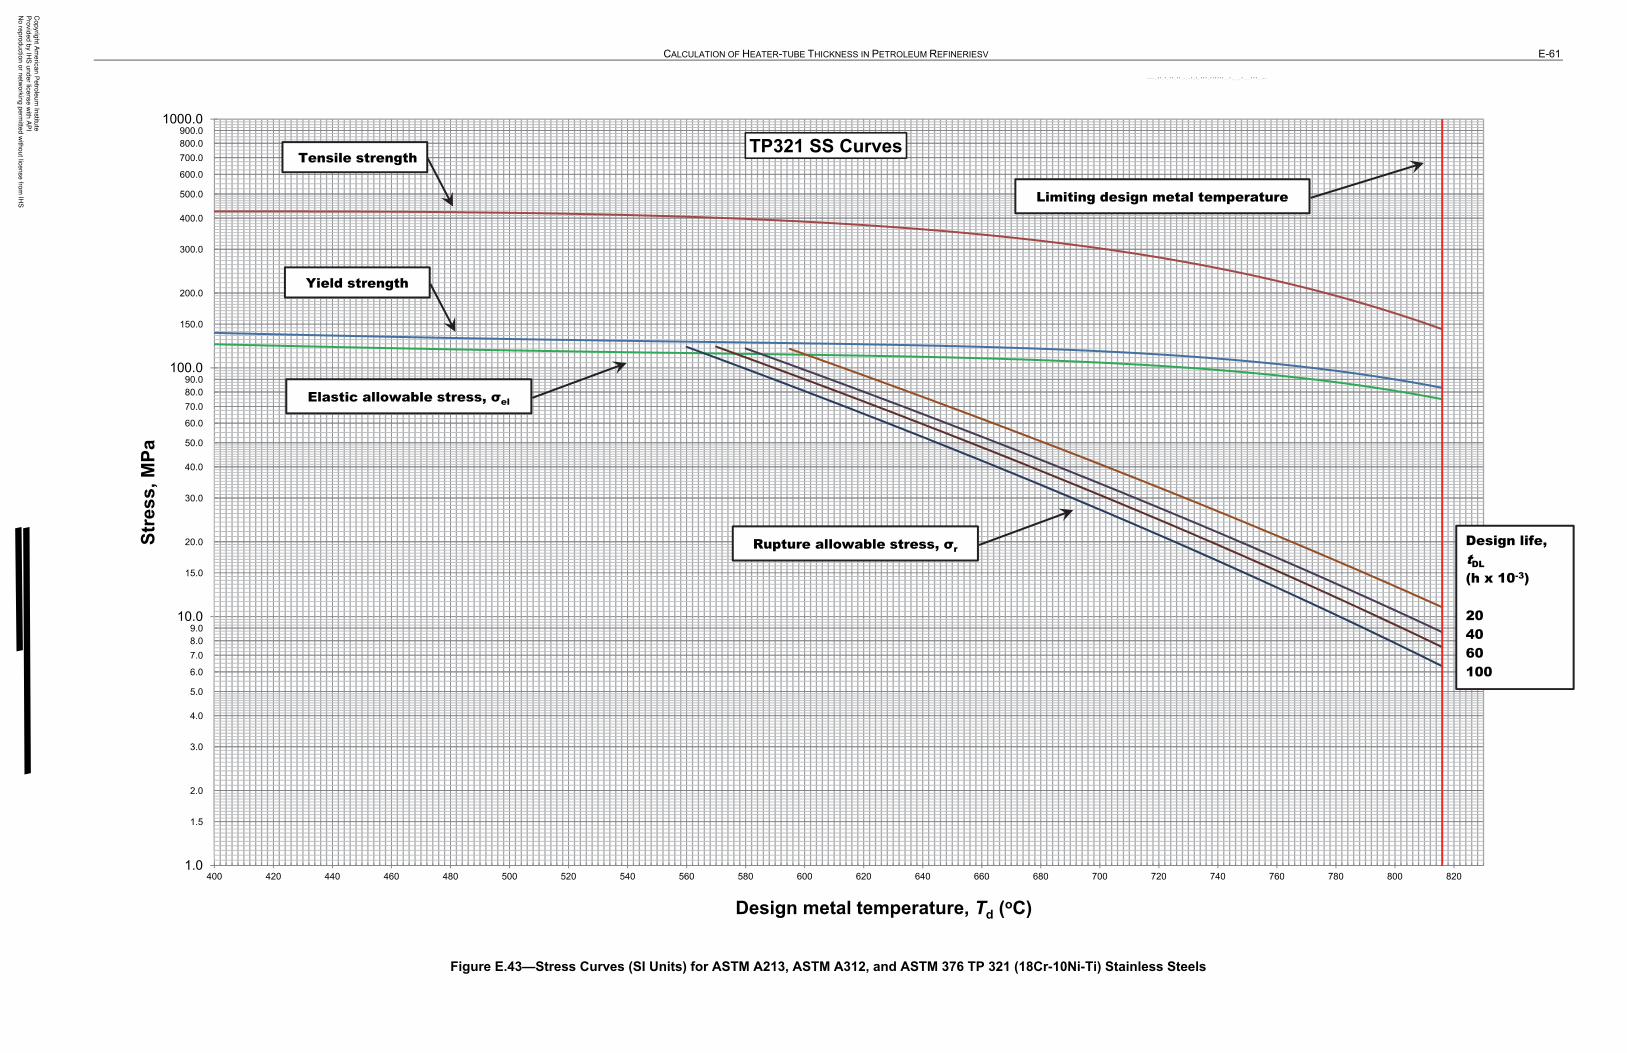
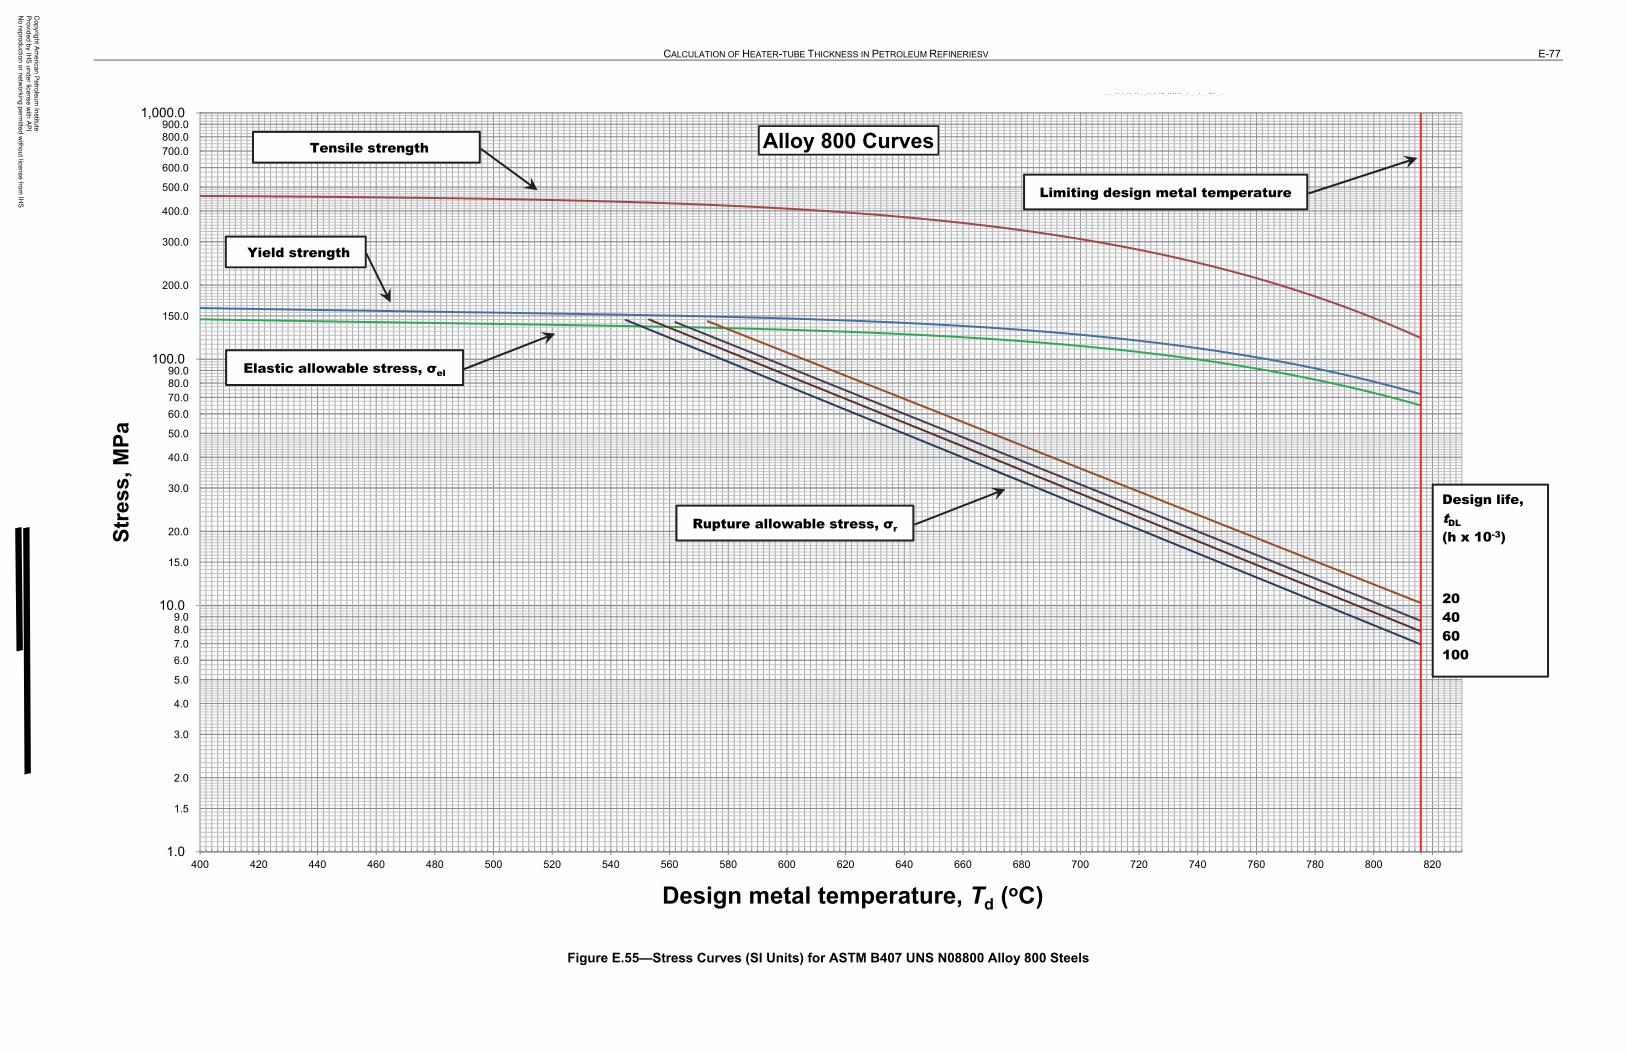
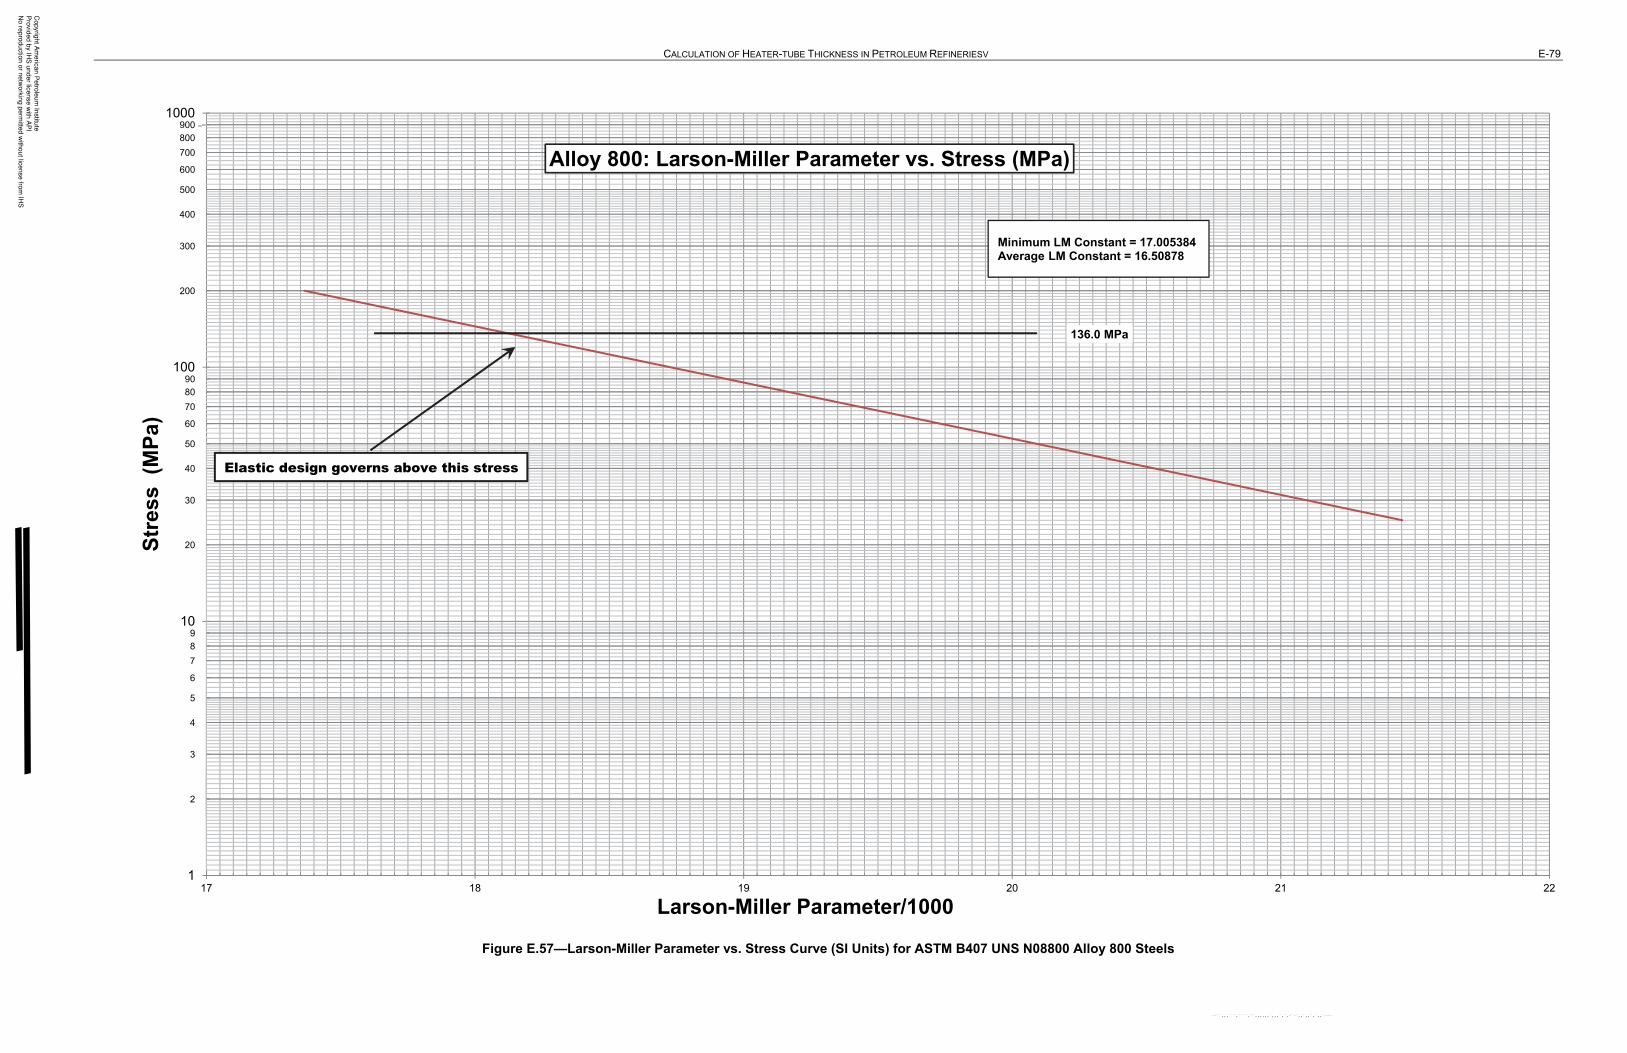
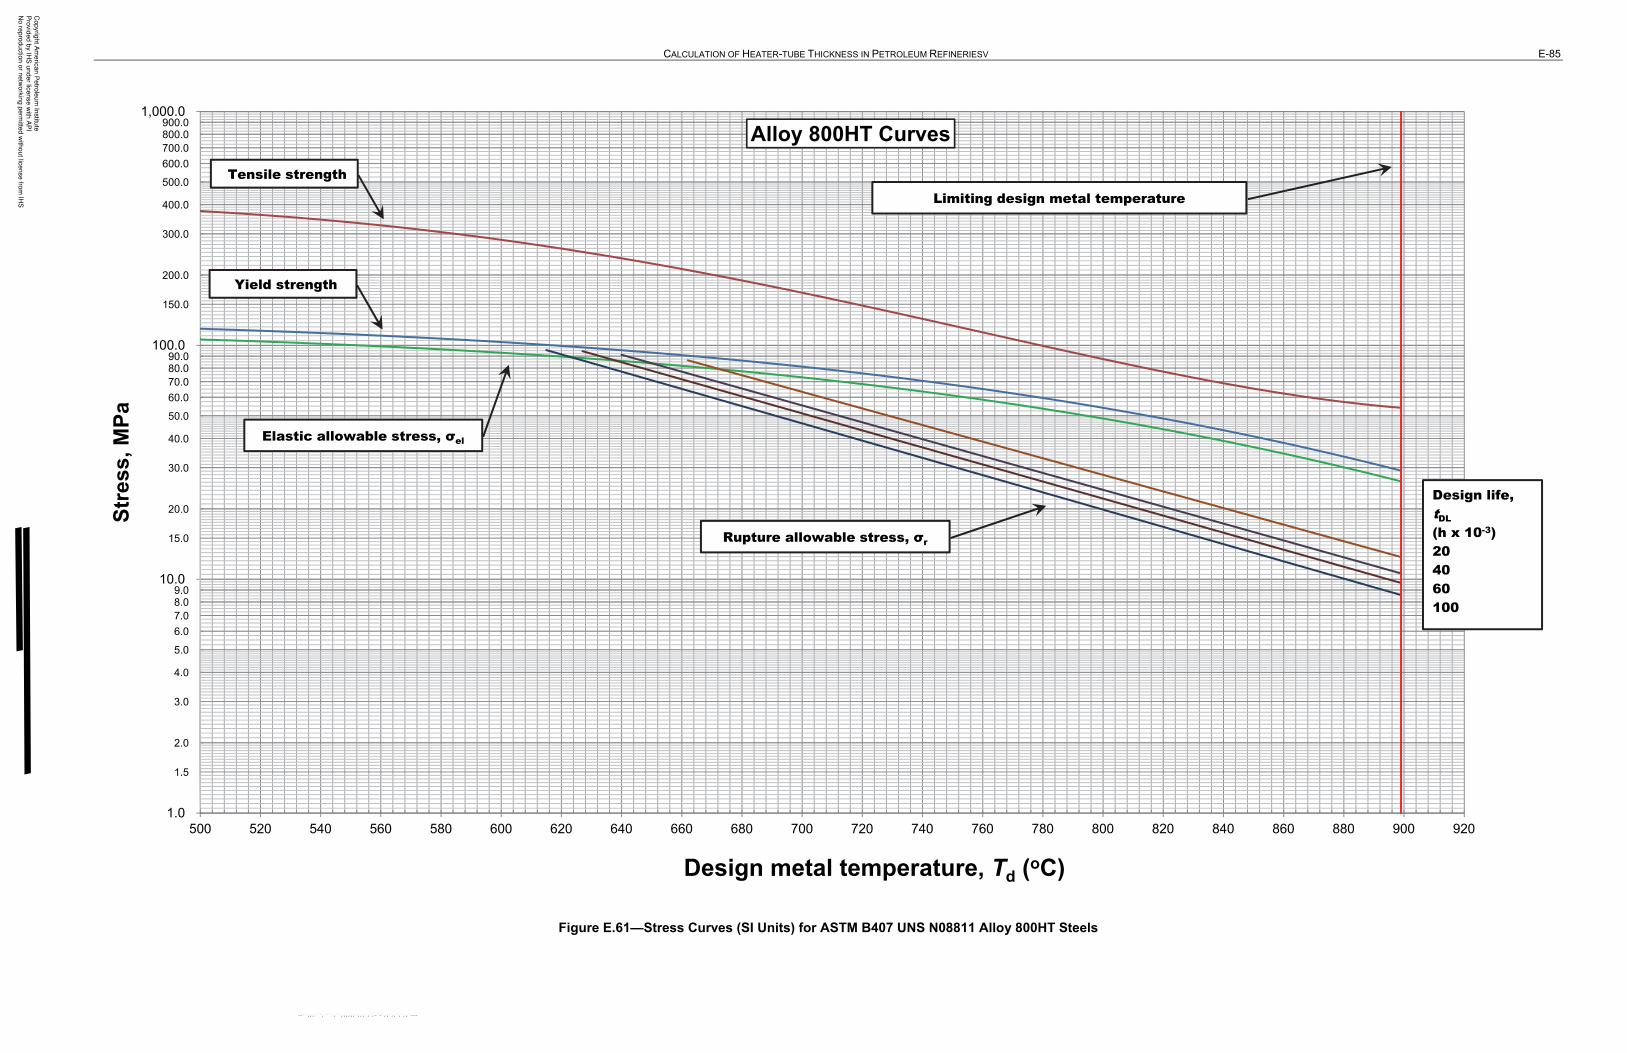
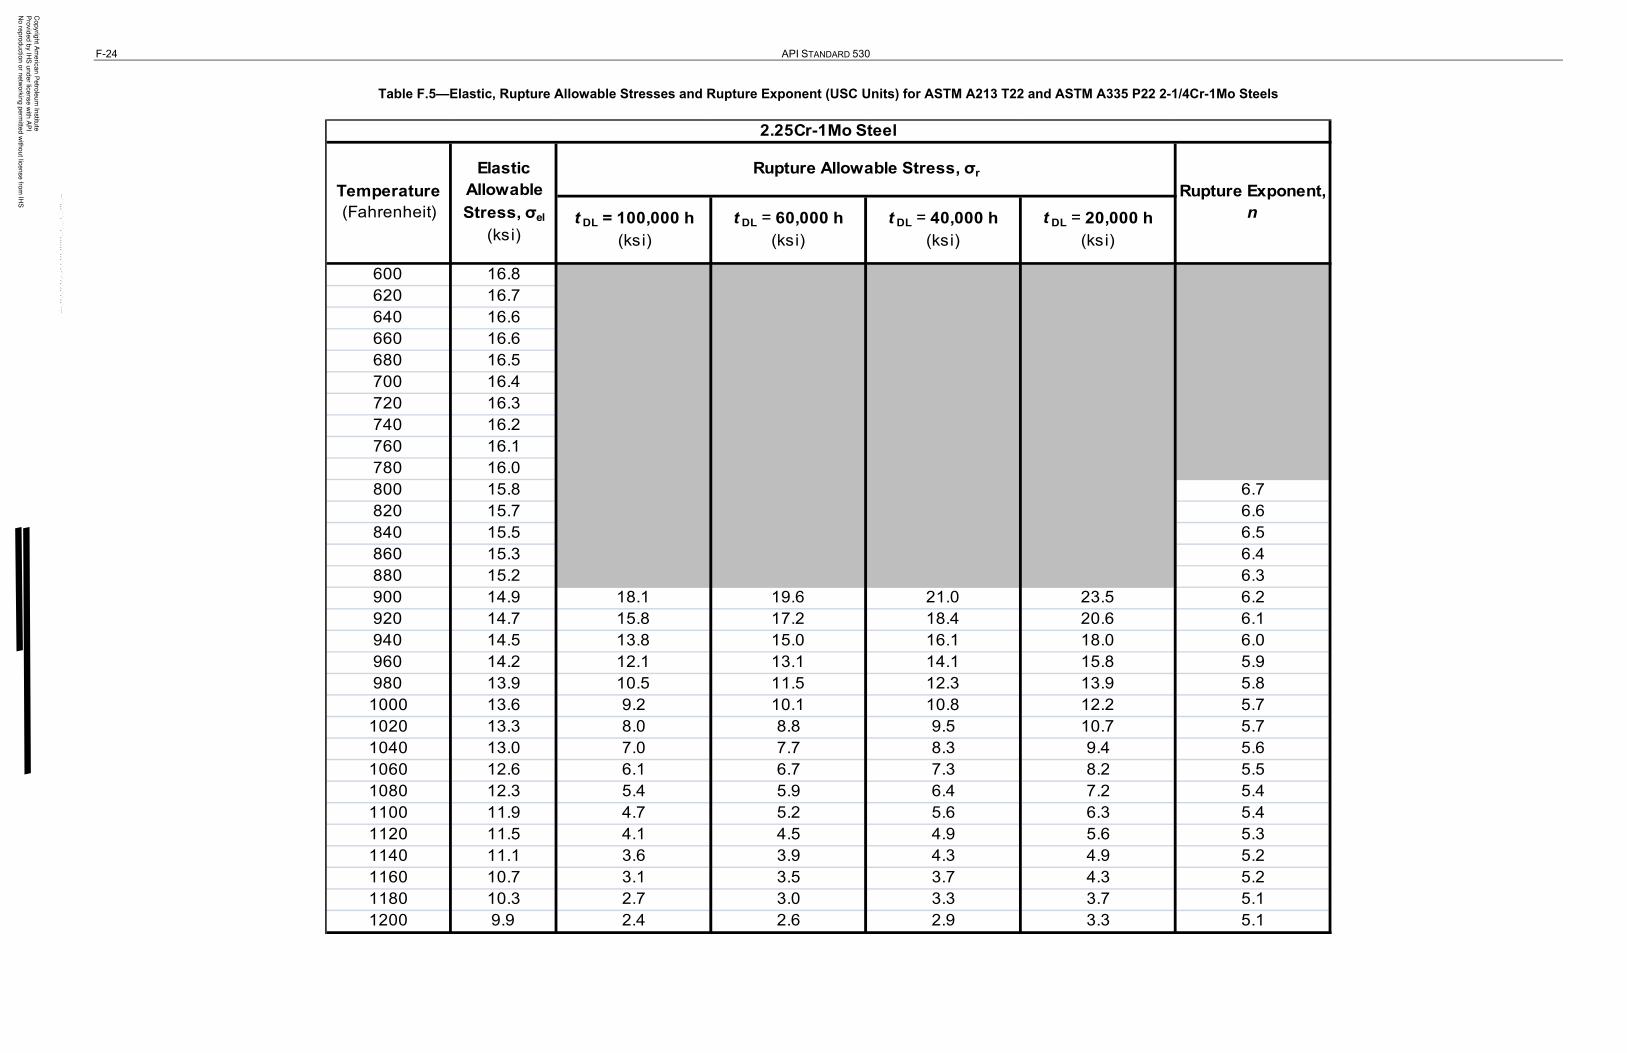
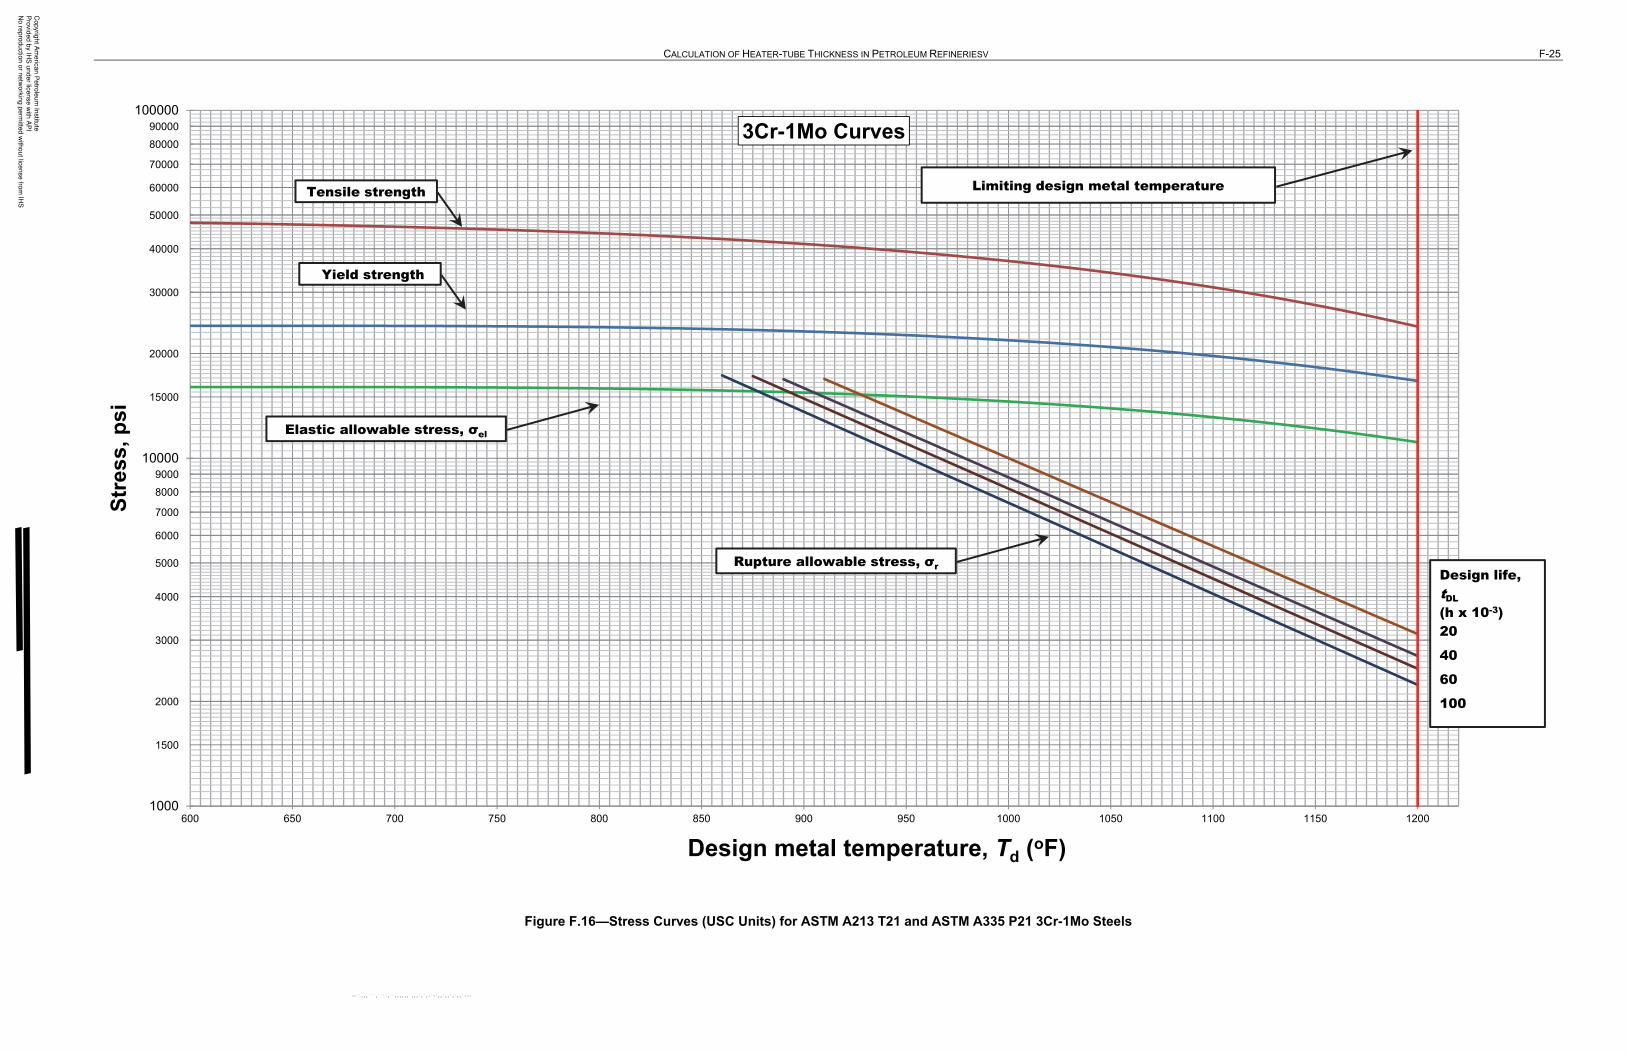
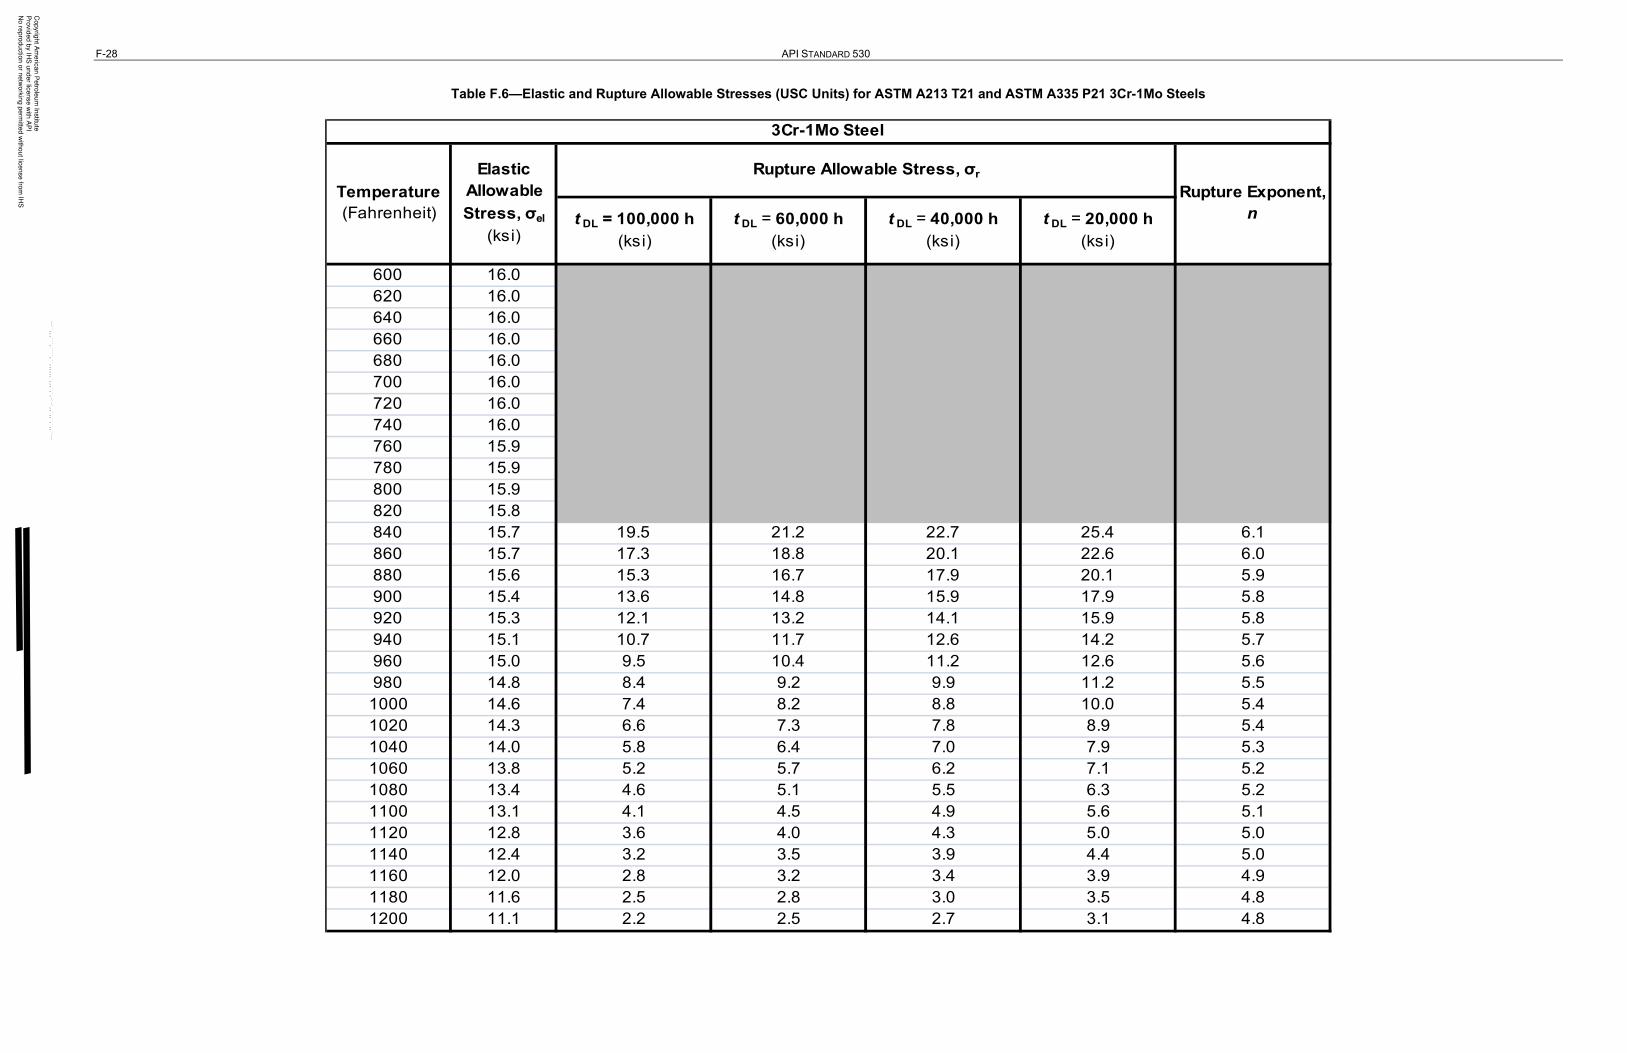
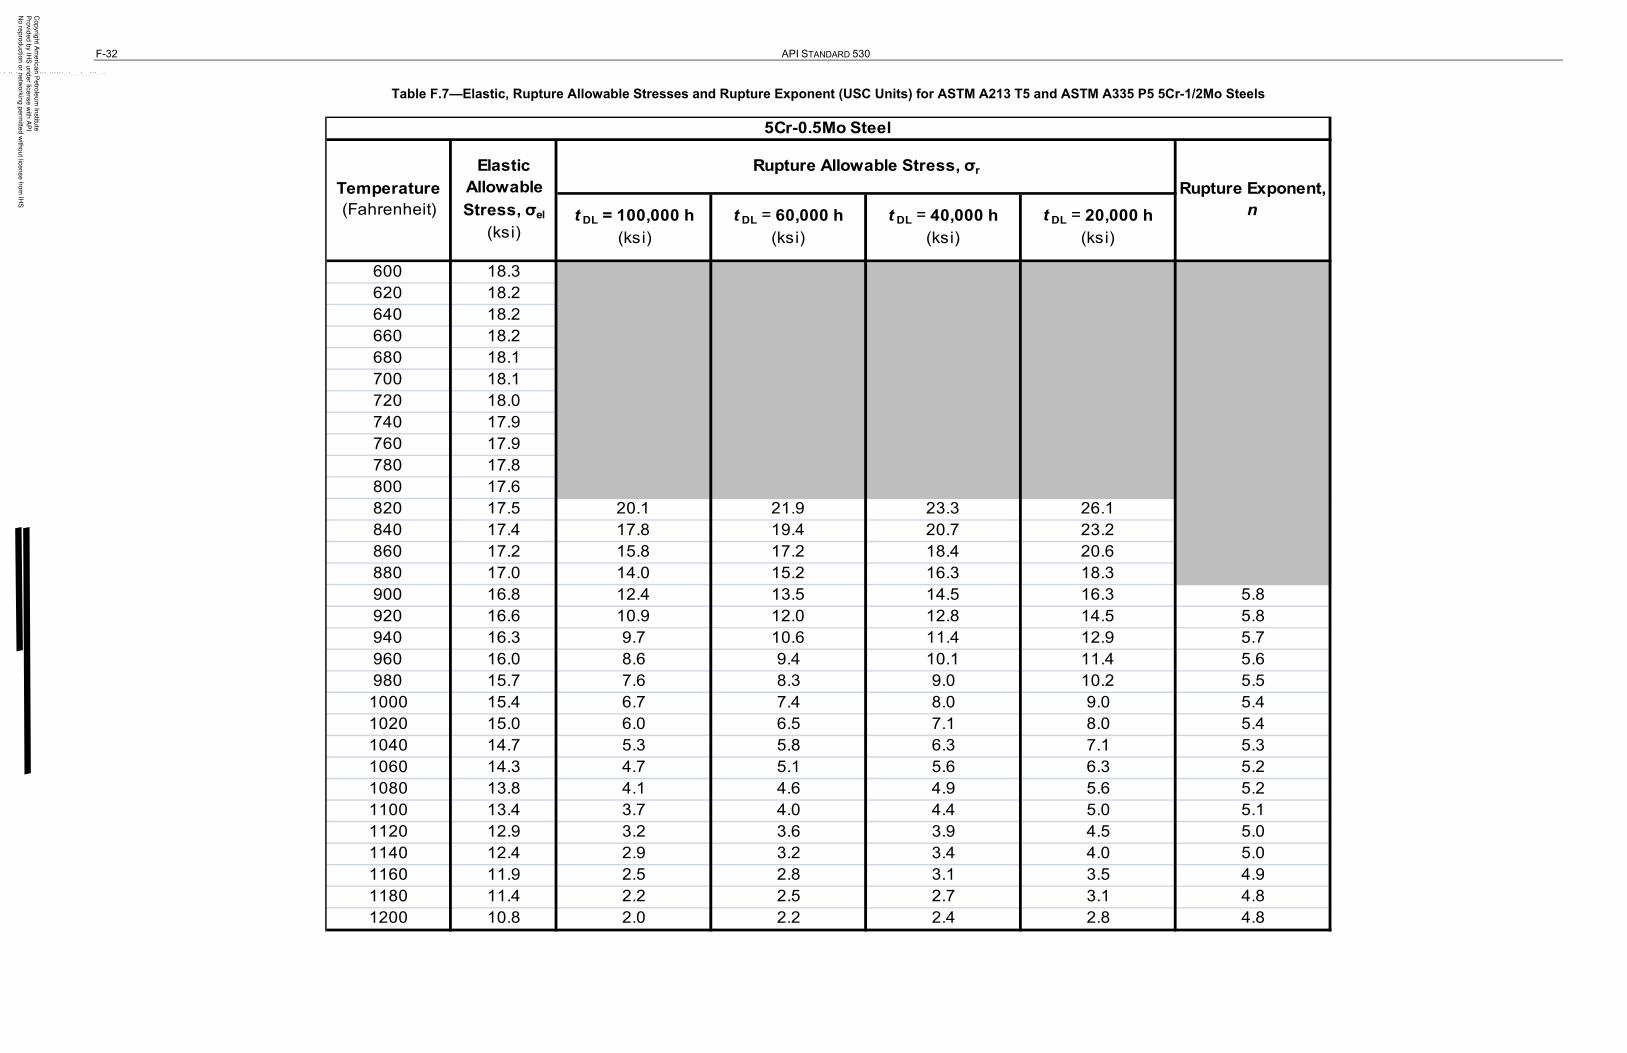
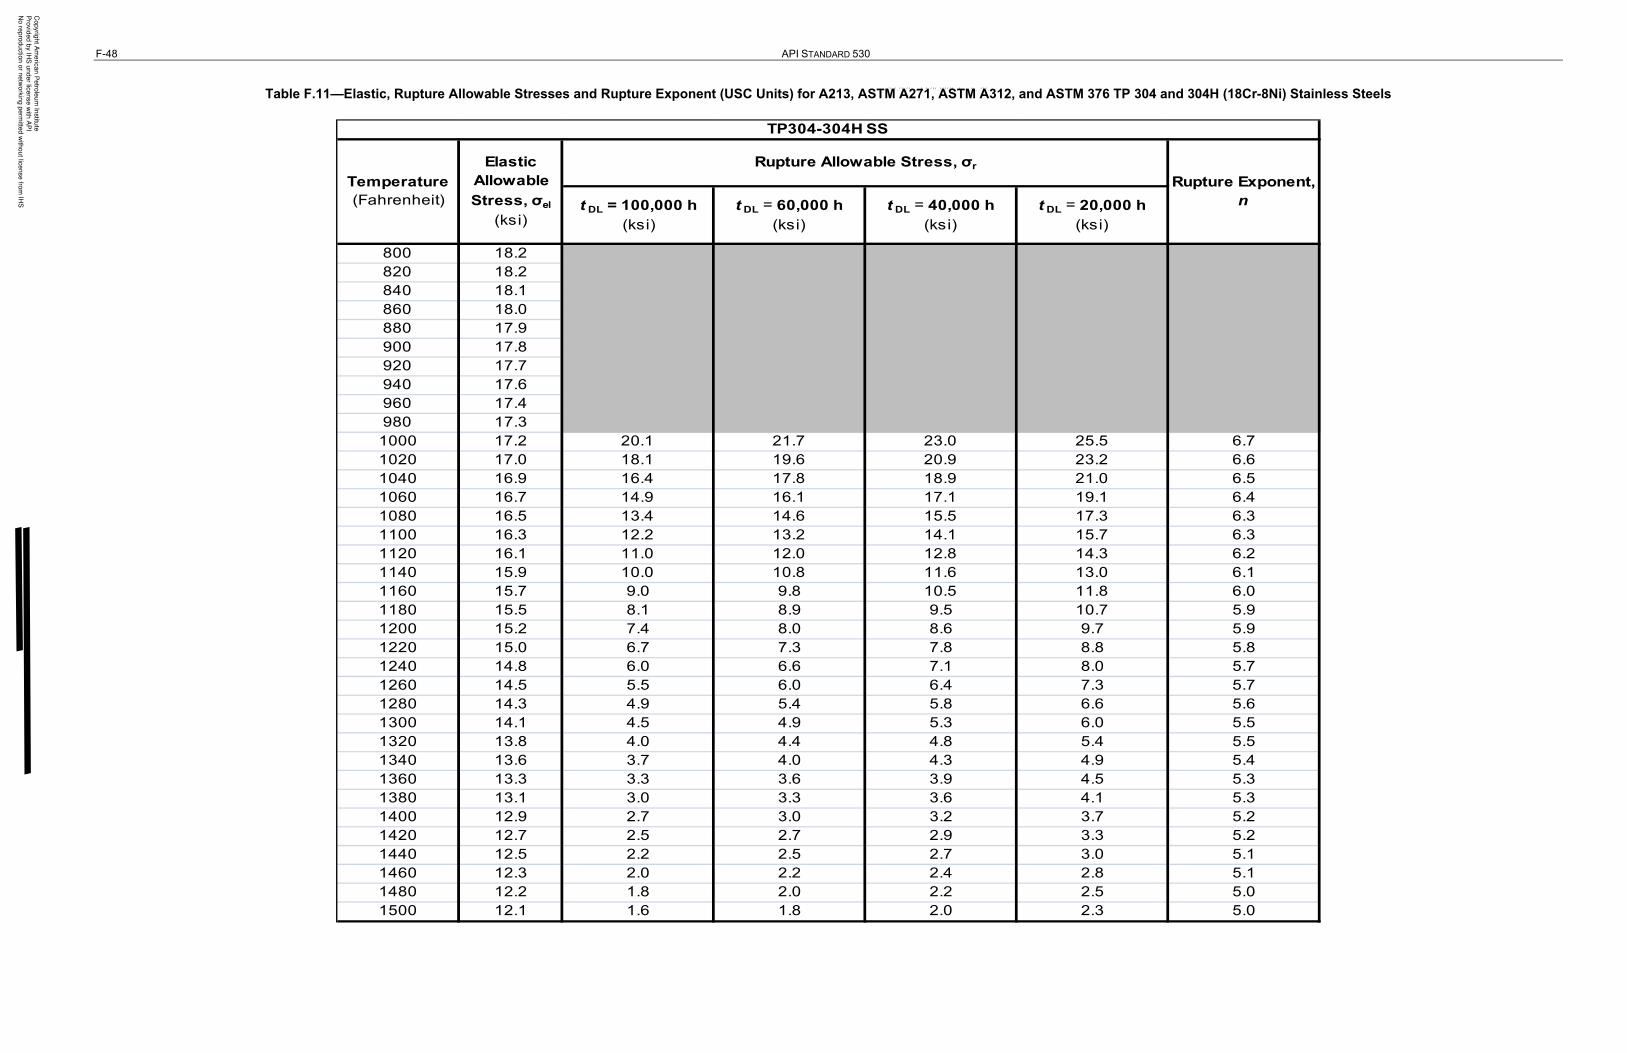
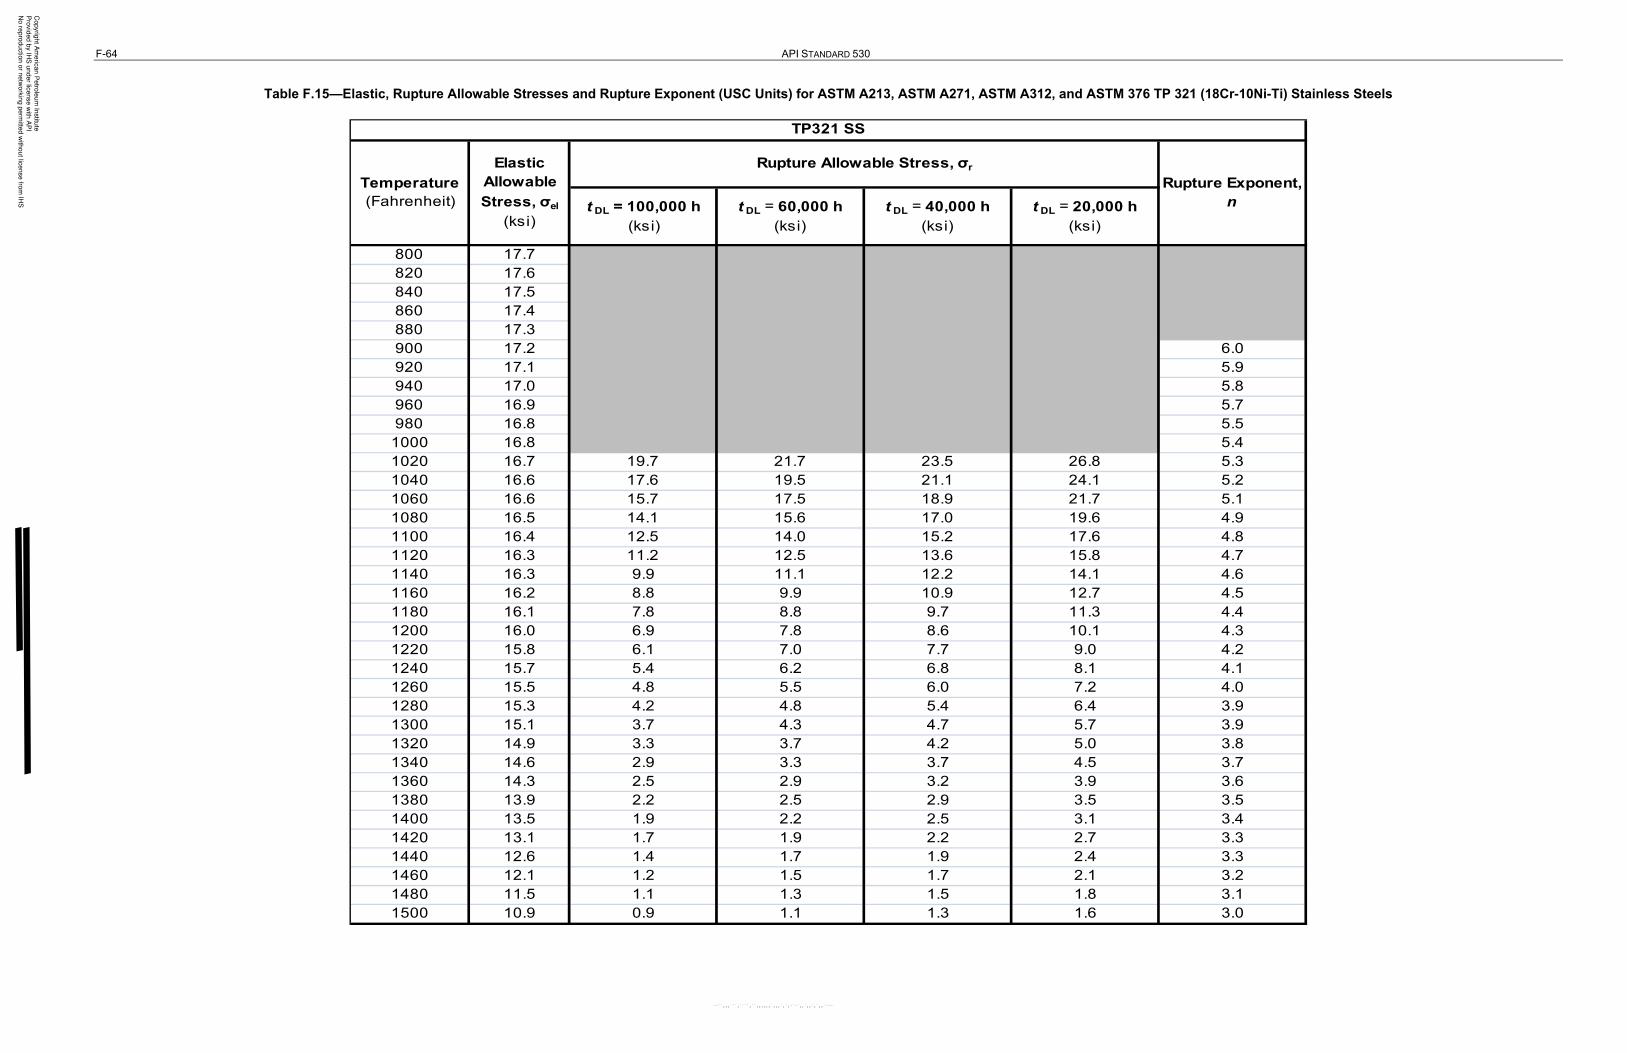
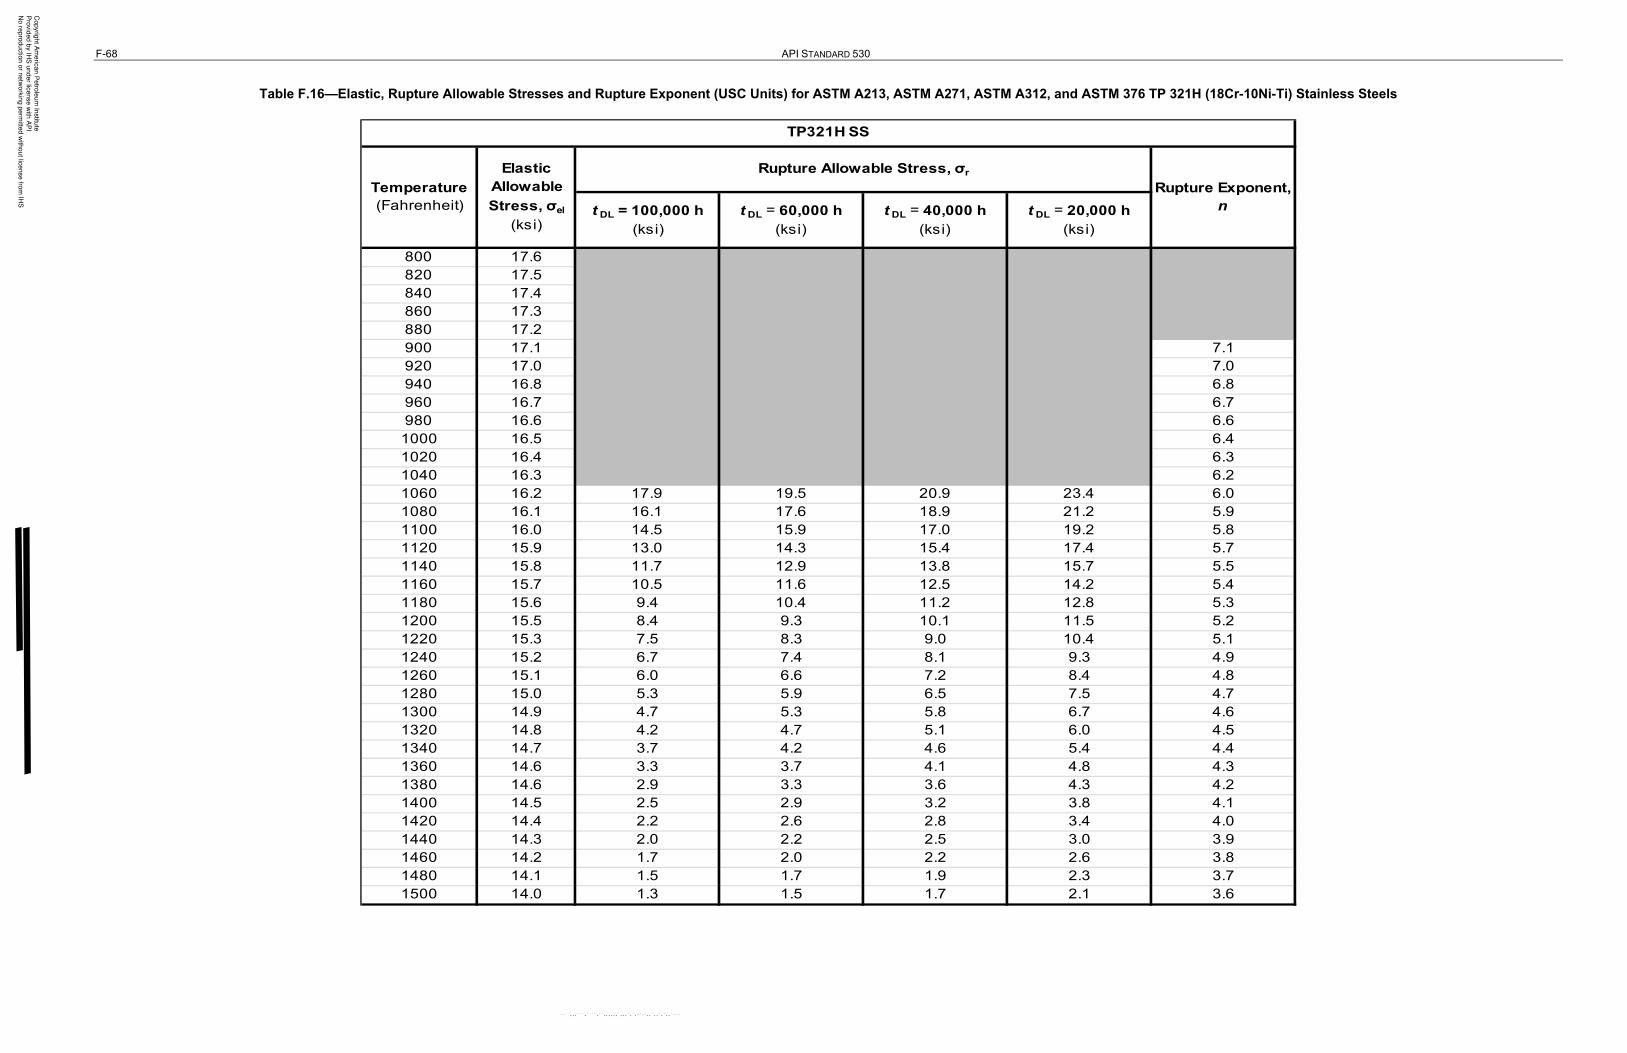
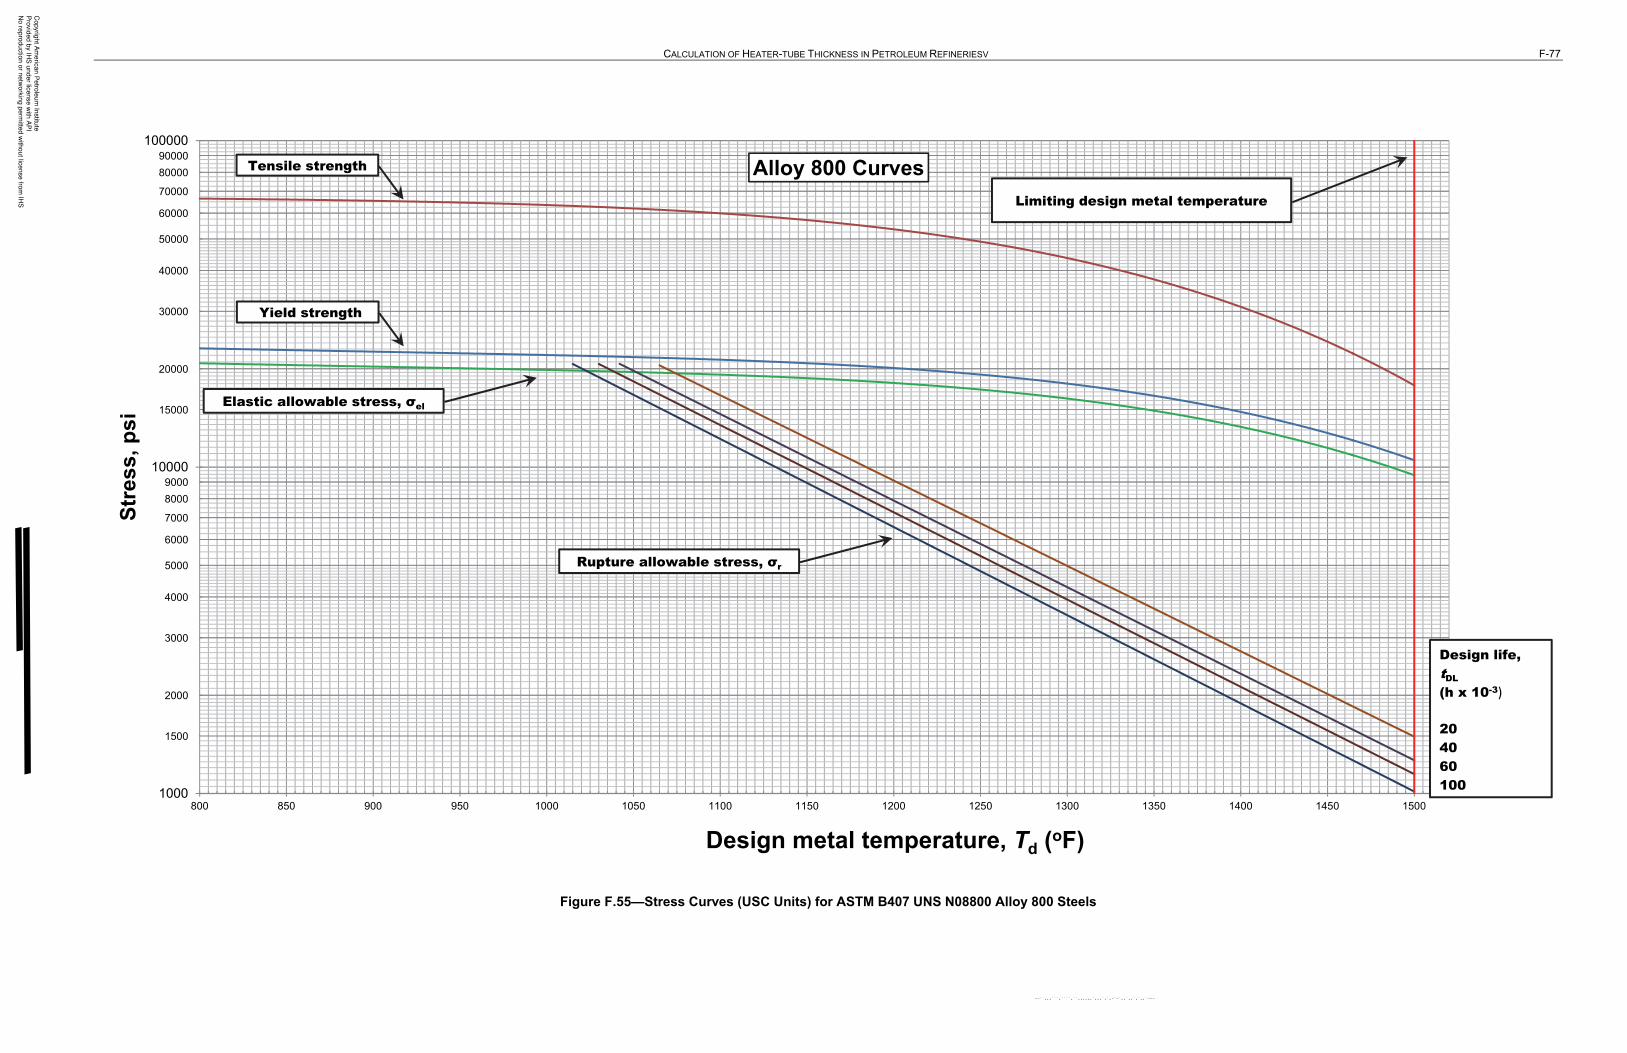
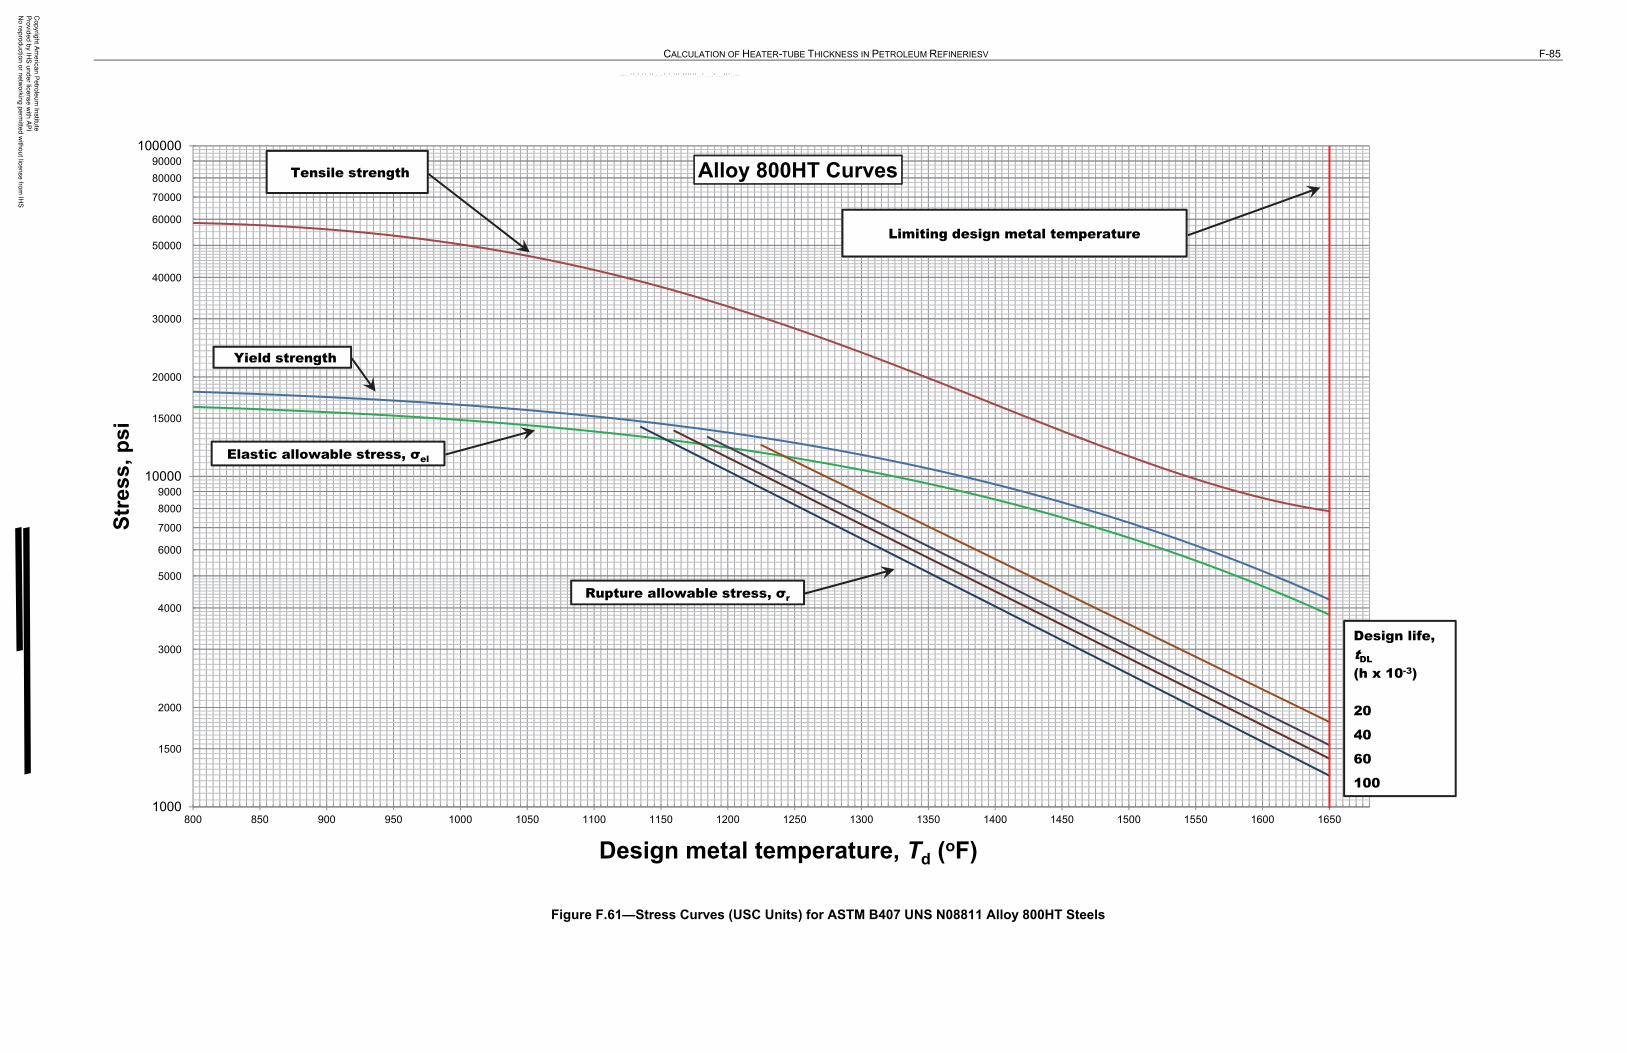
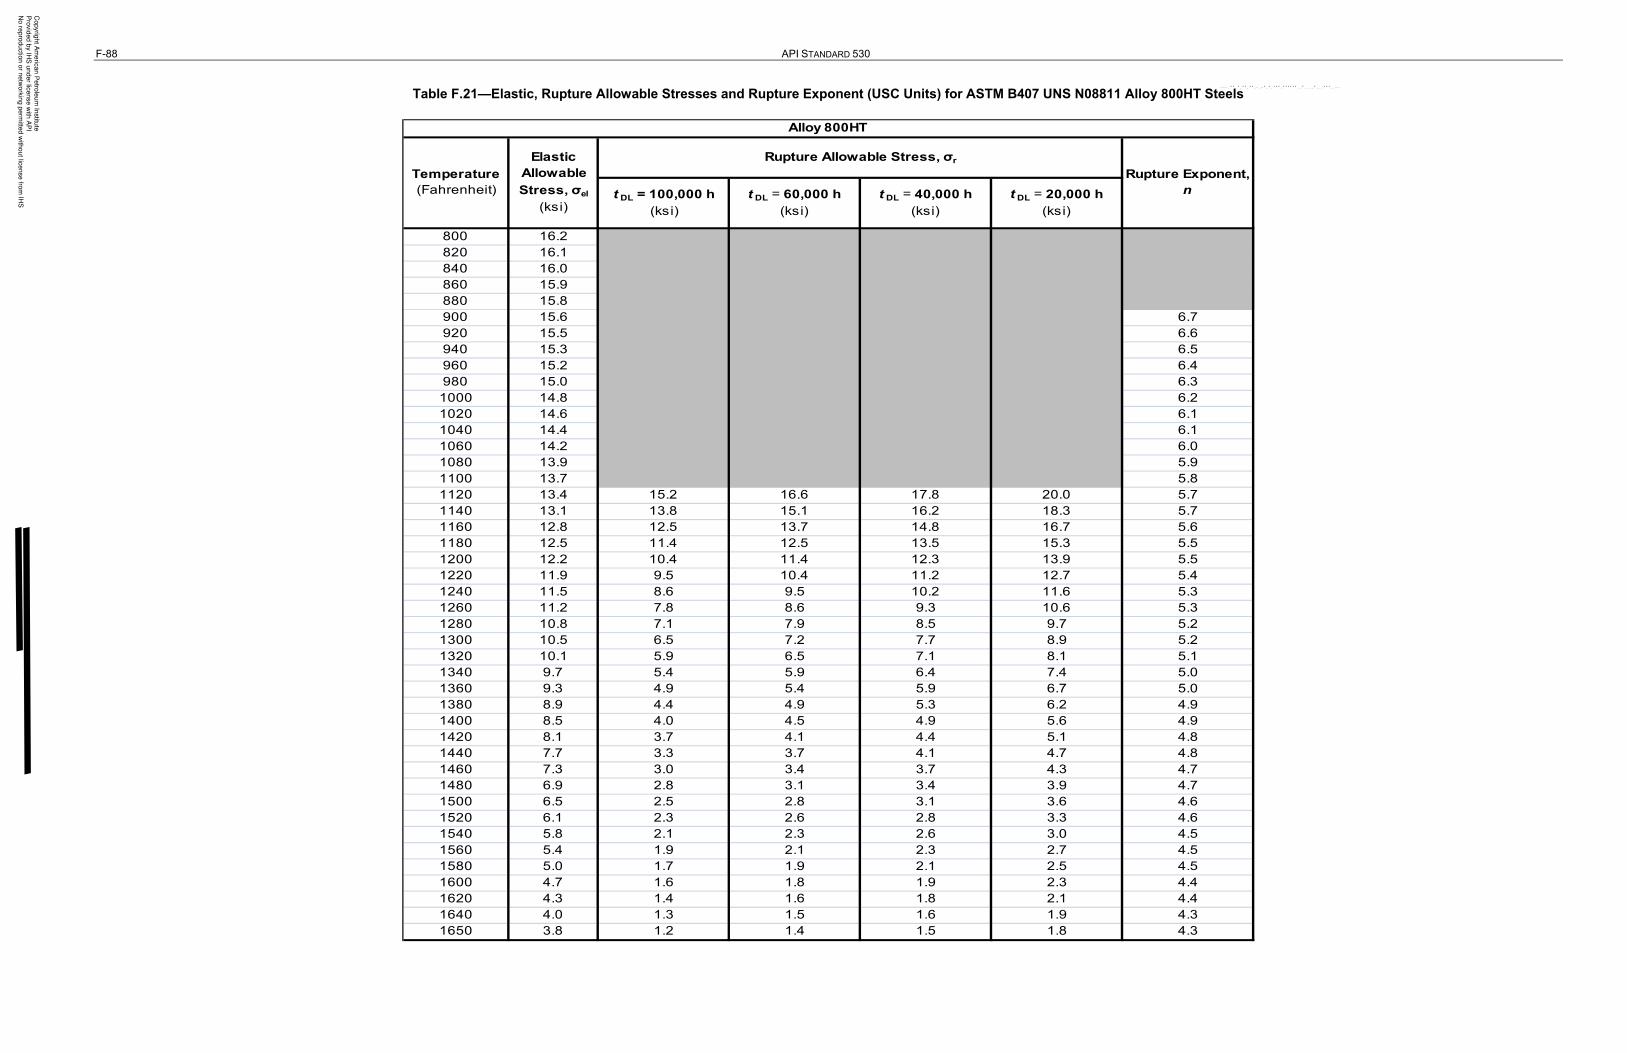
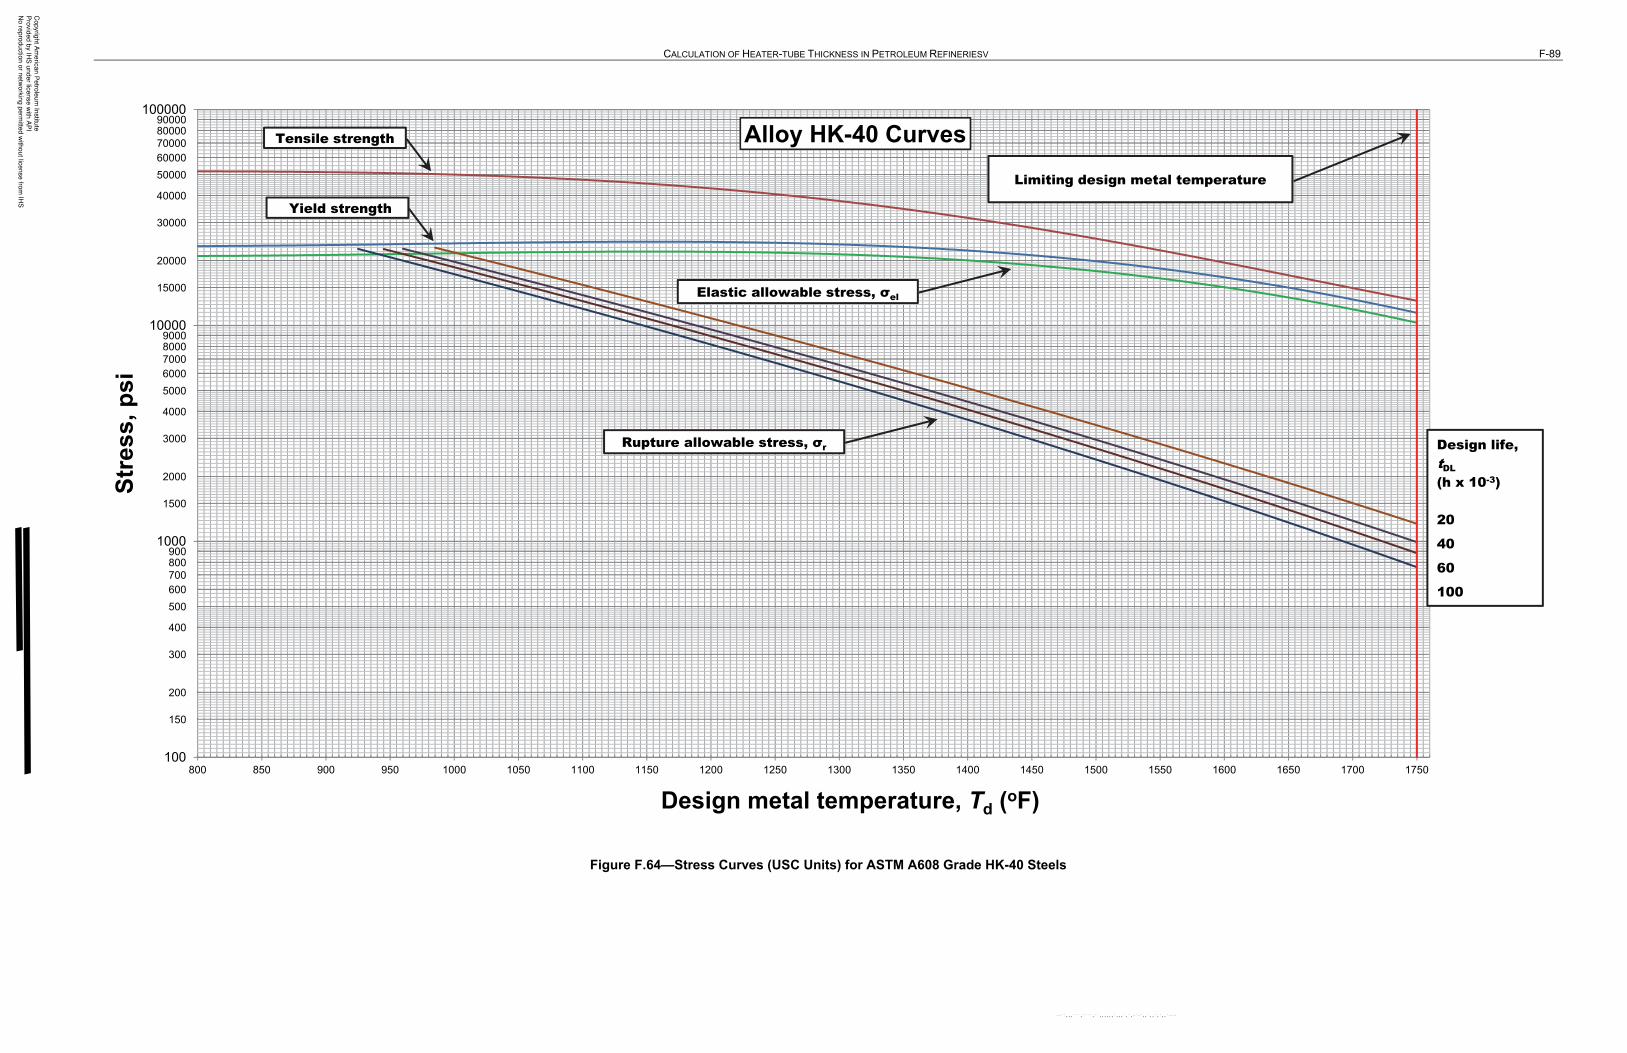
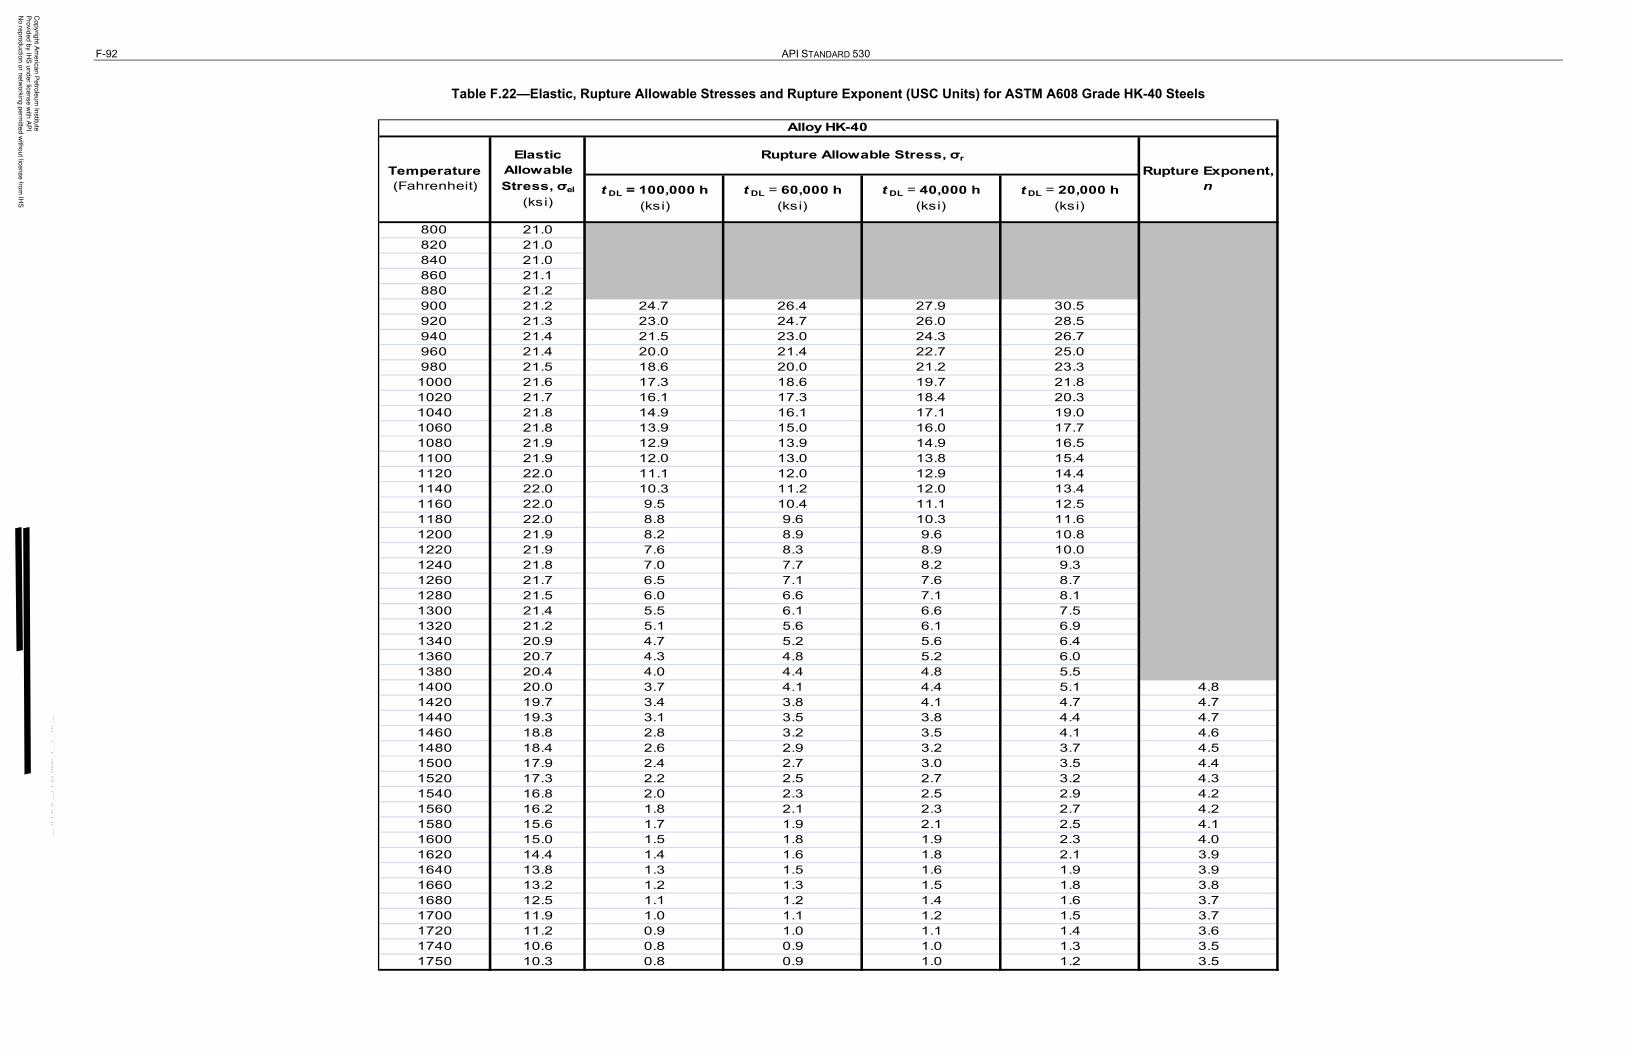
The allowable stresses for various heater-tube alloys are plotted against design metal temperature in Figures E.1 to E.64 (SI units) and Figures F.1 to F.64 [U.S. customary (USC) units]. The data is also shown in tabular format in Tables E.1 to E.22 and Tables F.1 to F.22. The values shown in these figures and tables are recommended only for the design of heater tubes. These figures show two different allowable stresses, the elastic allowable stress and the rupture allowable stress. The bases for these allowable stresses are given in 6.2 and 6.3 (see also 4.2.3).
6.2 Elastic Allowable Stress
The elastic allowable stress, σel, is two-thirds of the yield strength at temperature for ferritic steels and 90 % of the yield strength at temperature for austenitic steels. The data sources for the yield strength are given in Annex H.
If a different design basis is desired for special circumstances, the user shall specify the basis, and the alternative elastic allowable stress shall be developed from the yield strength.
6.3 Rupture Allowable Stress
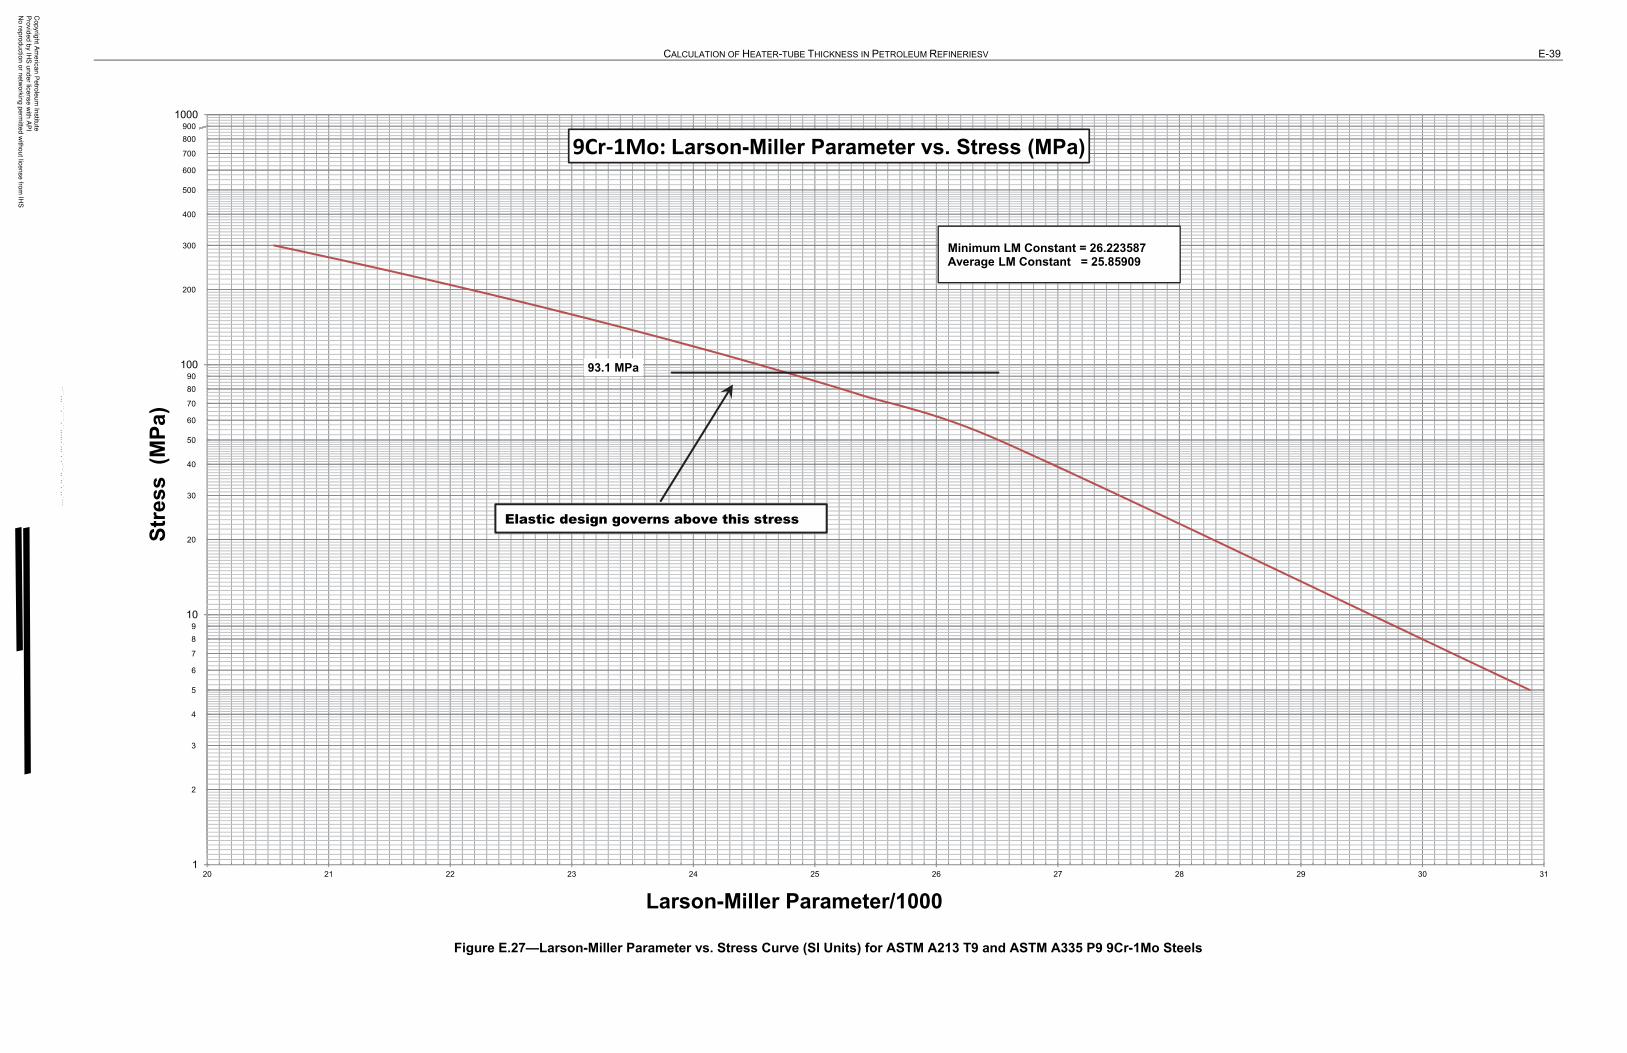
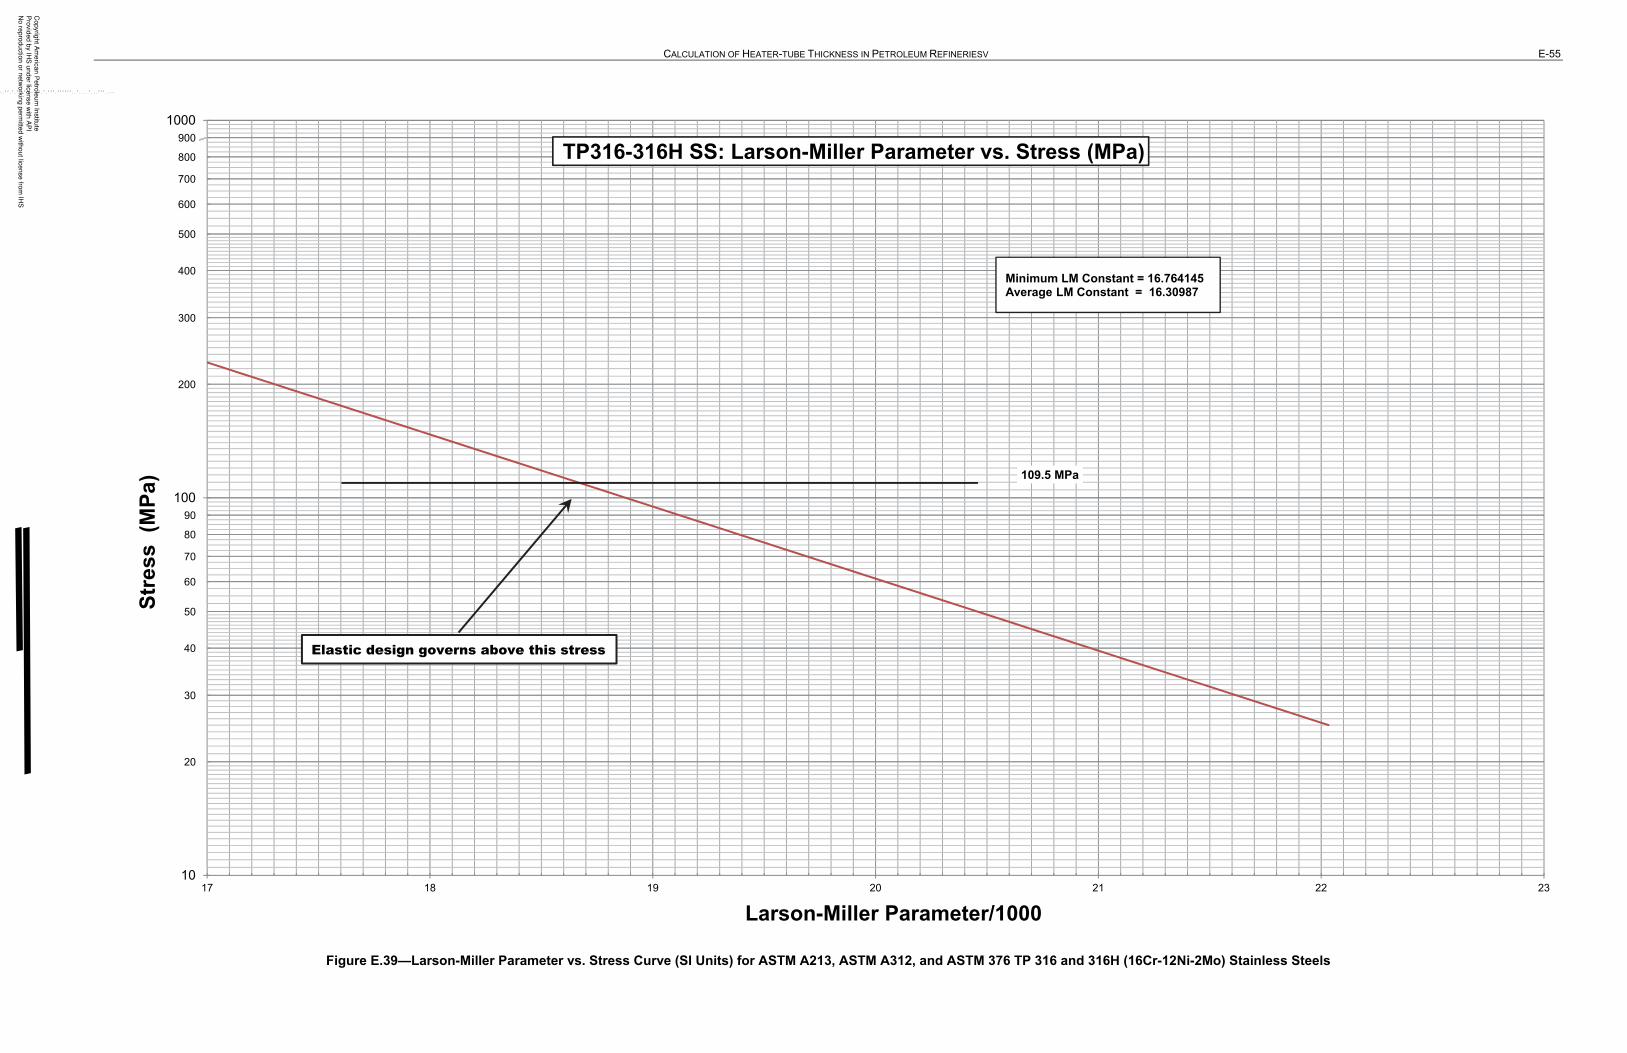
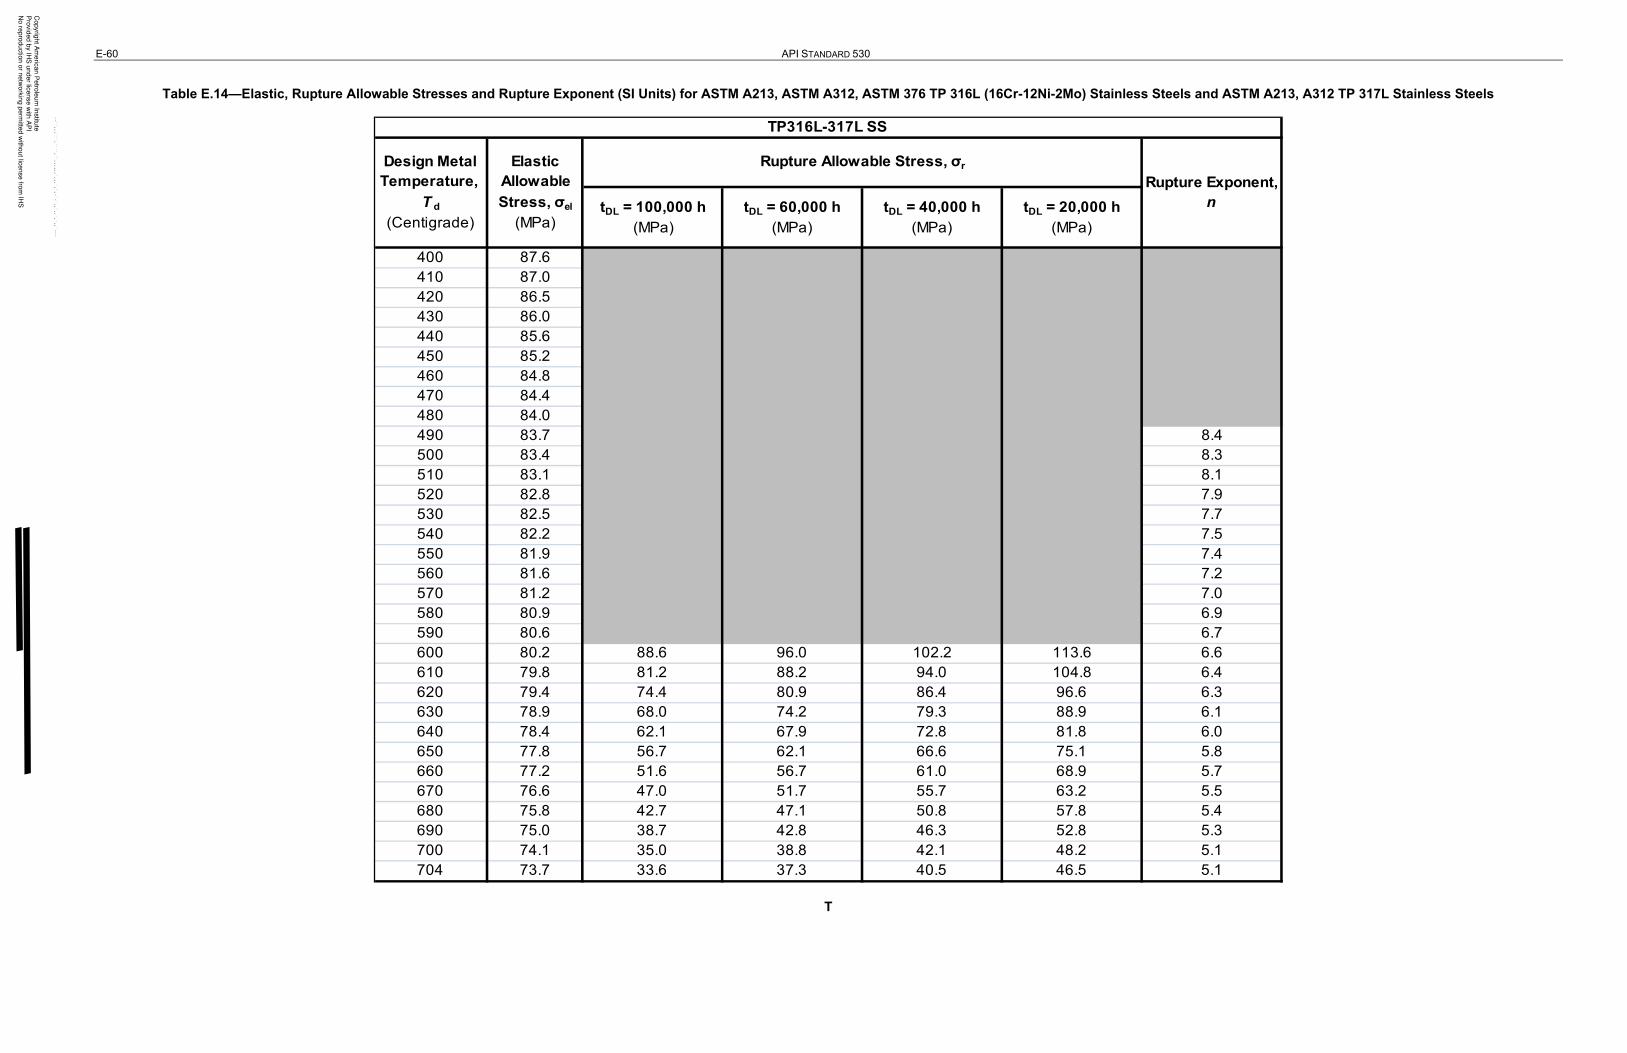
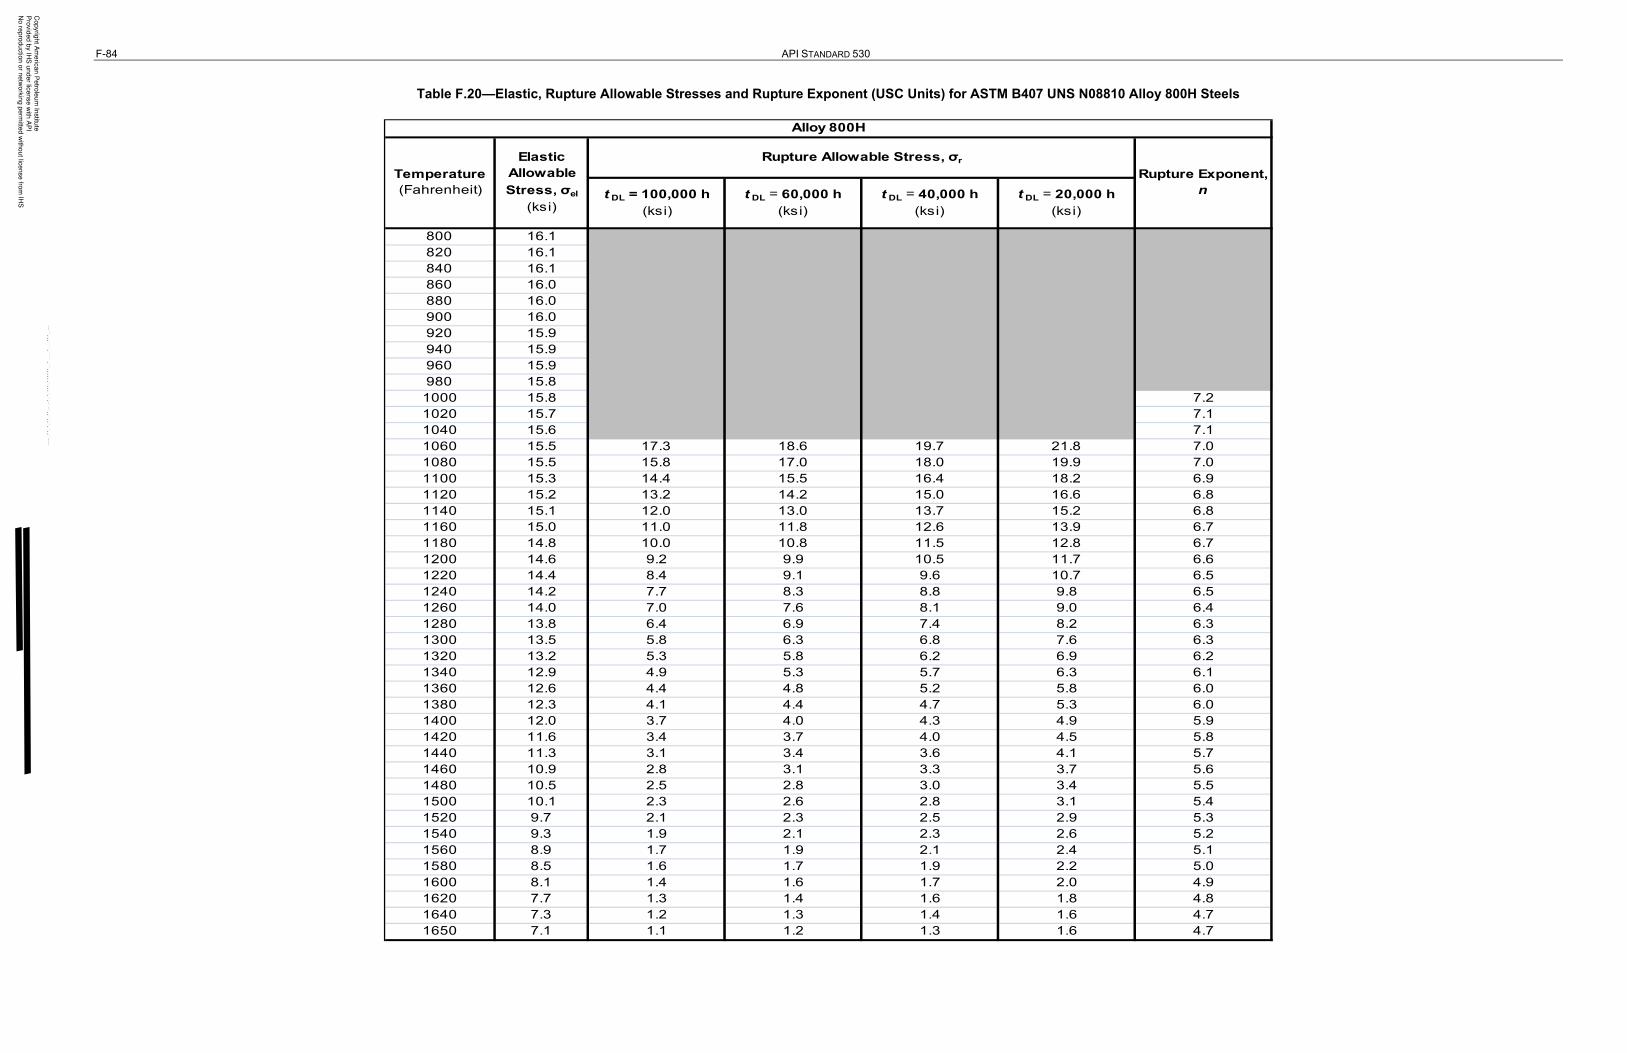
The rupture allowable stress, σr, is 100 % of the minimum rupture strength for a specified design life within the limiting design metal temperatures shown in Table 5. Section H.6 defines rupture strength and provides the data sources. The 20,000-hour, 40,000-hour, 60,000-hour, and 100,000-hour rupture allowable stresses were developed from the Larson-Miller Parameter curves for the minimum rupture strength. For a design life other than those shown, the corresponding rupture allowable stress shall be developed from the Larson-Miller Parameter curves for the minimum rupture strength (see 6.6). The Larson-Miller curves used are based on curves published in WRC Bull 541 and reflect the mechanical property data obtained from tubes manufactured using modern techniques.
If a different design basis is desired, the user shall specify the basis, and the alternative rupture allowable stress shall be developed from the Larson-Miller Parameter curves for the minimum or average rupture strength. If the resulting rupture allowable stress is greater than the minimum rupture strength for the design life, the effects of creep on the tube design equation should be considered.
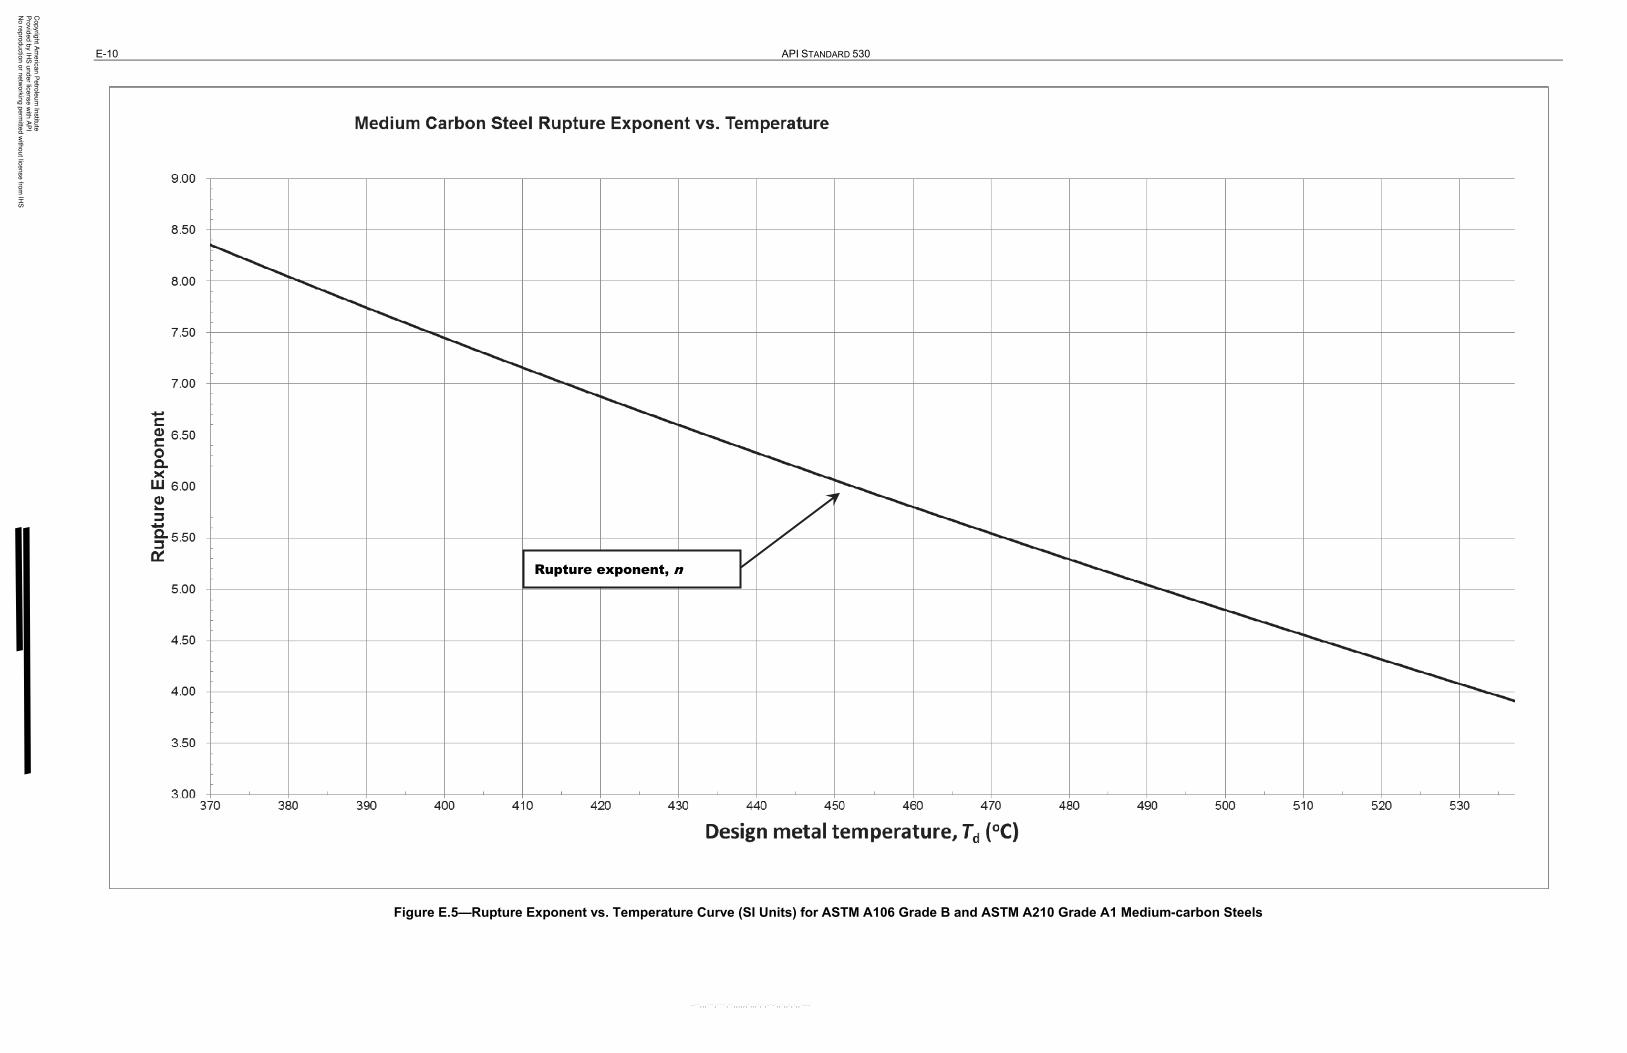
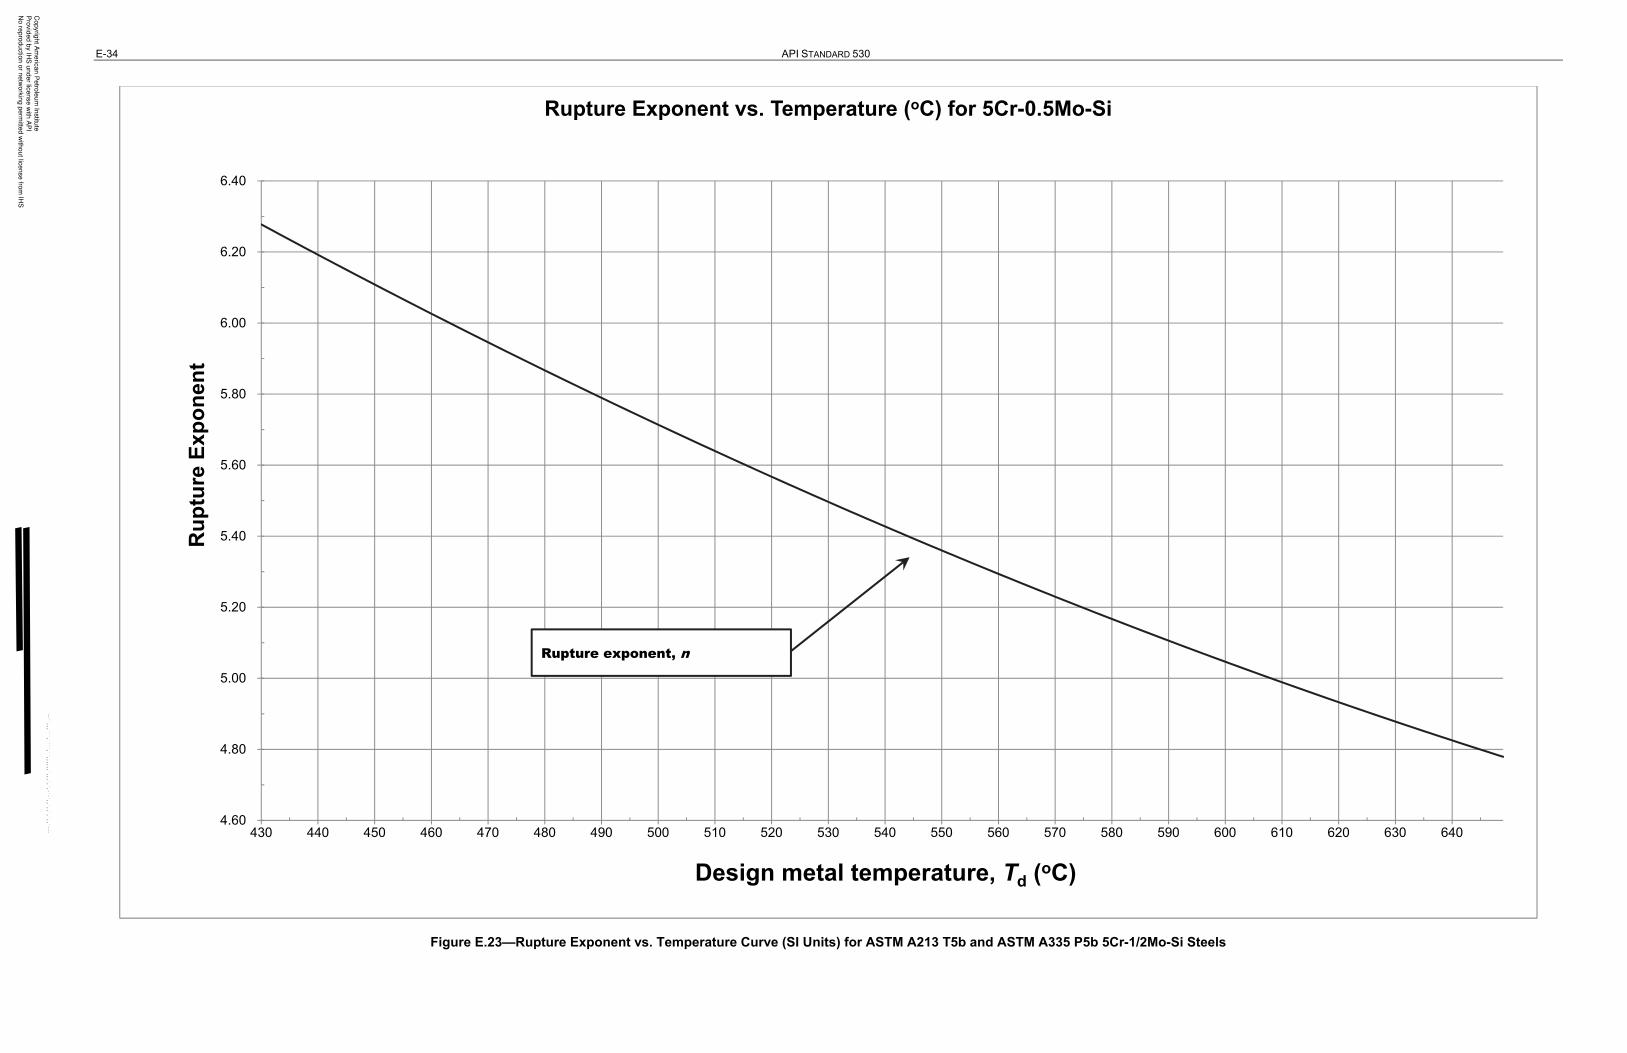
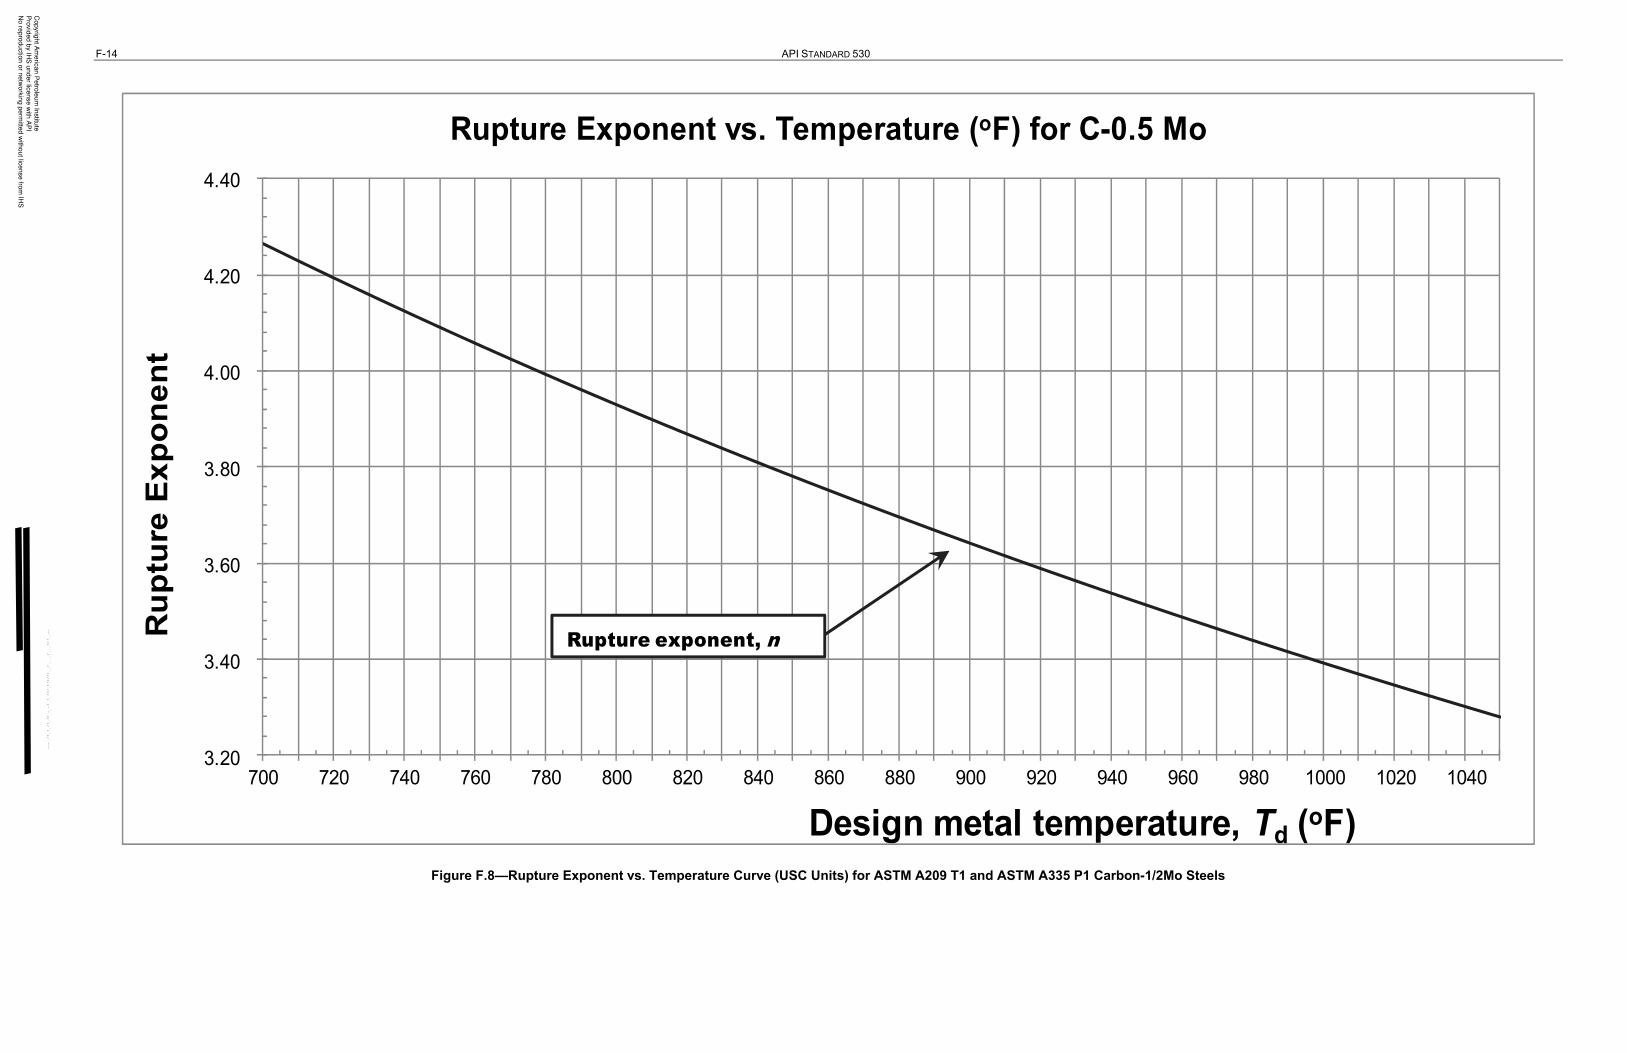
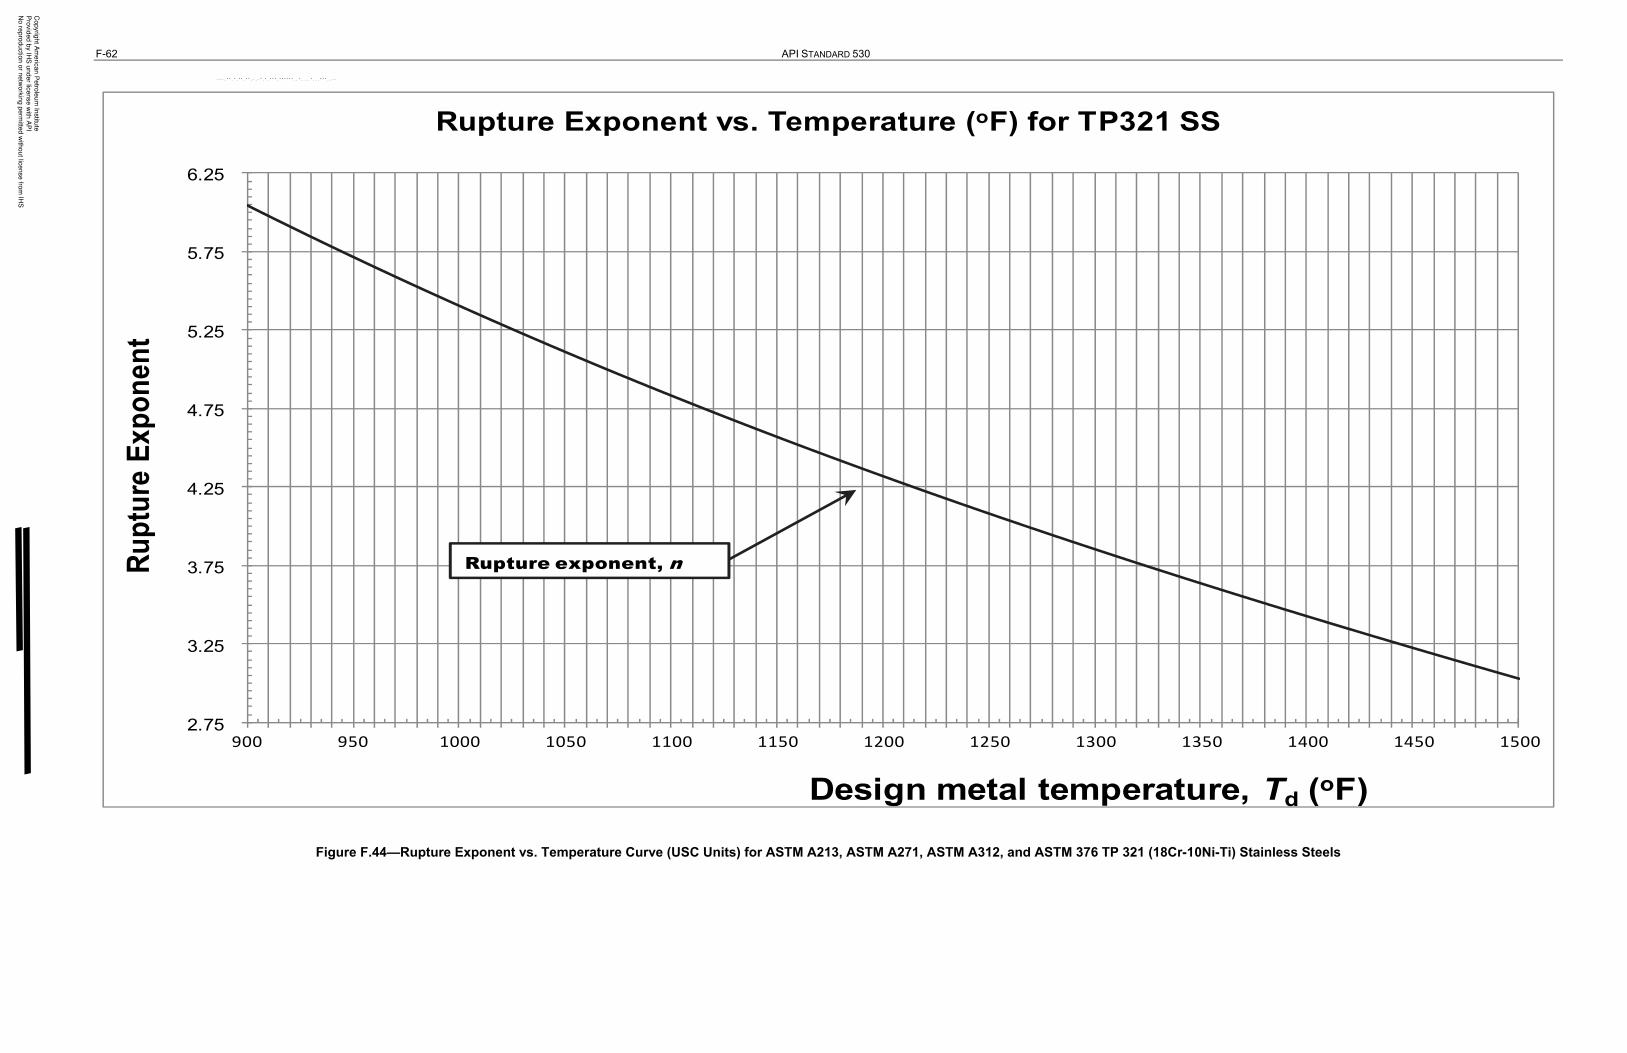
6.4 Rupture Exponent
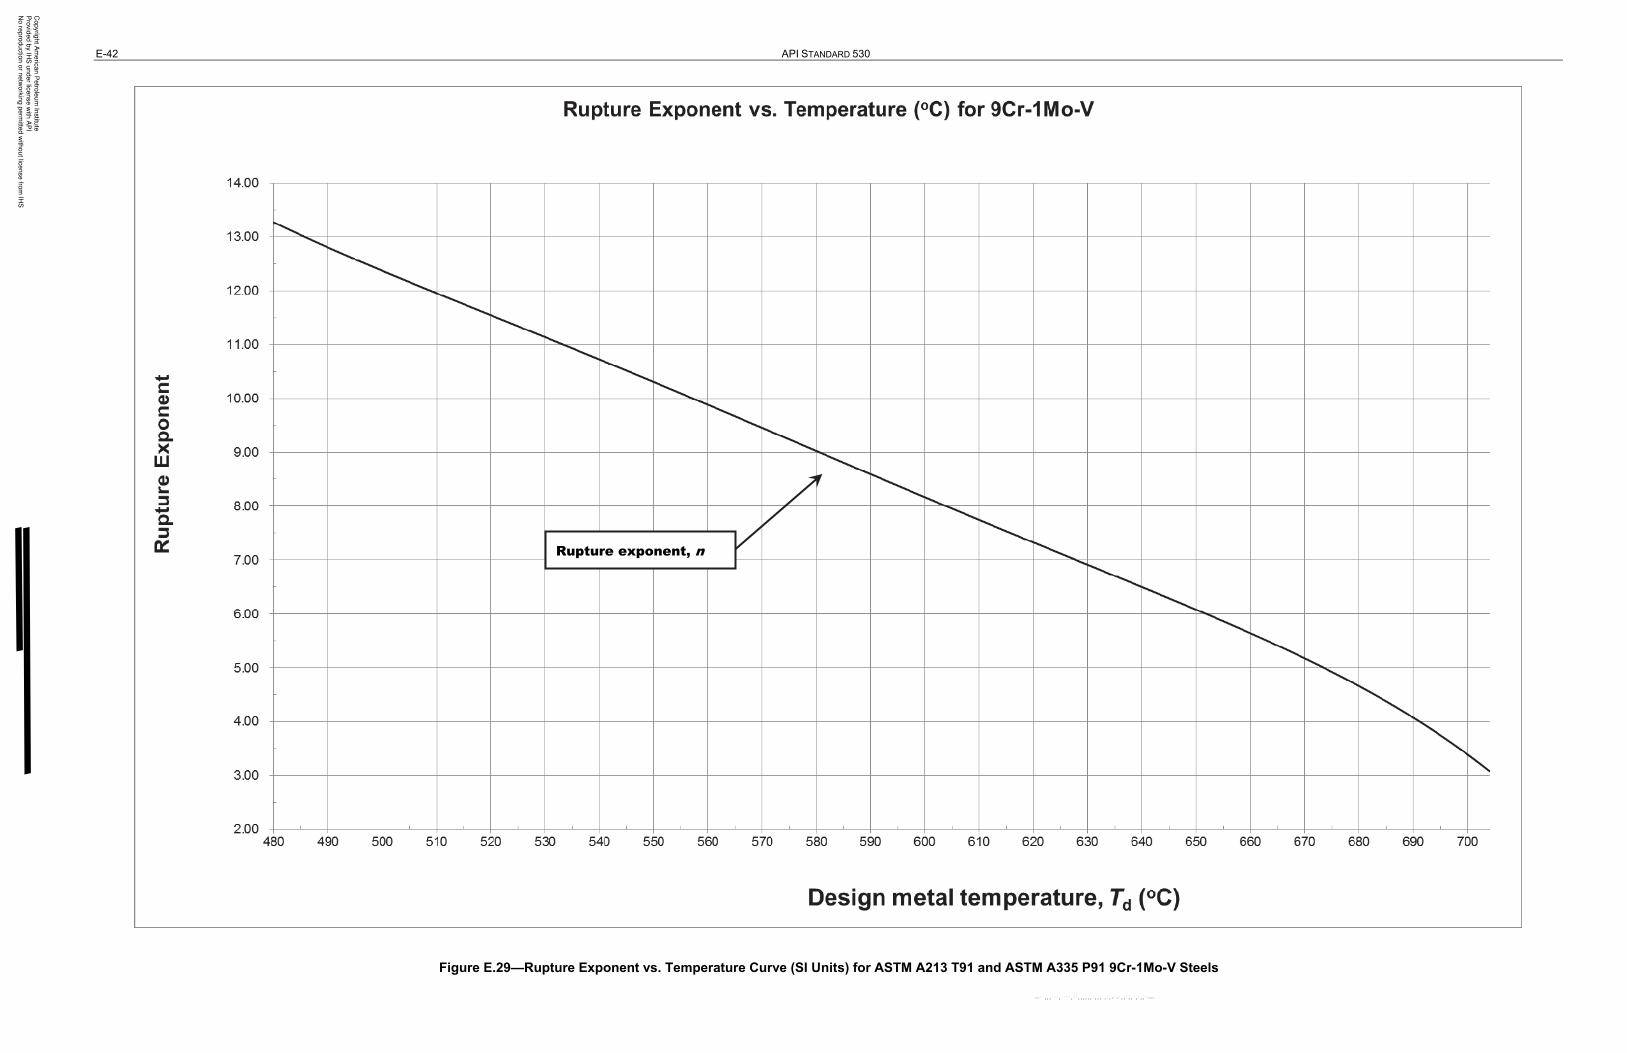
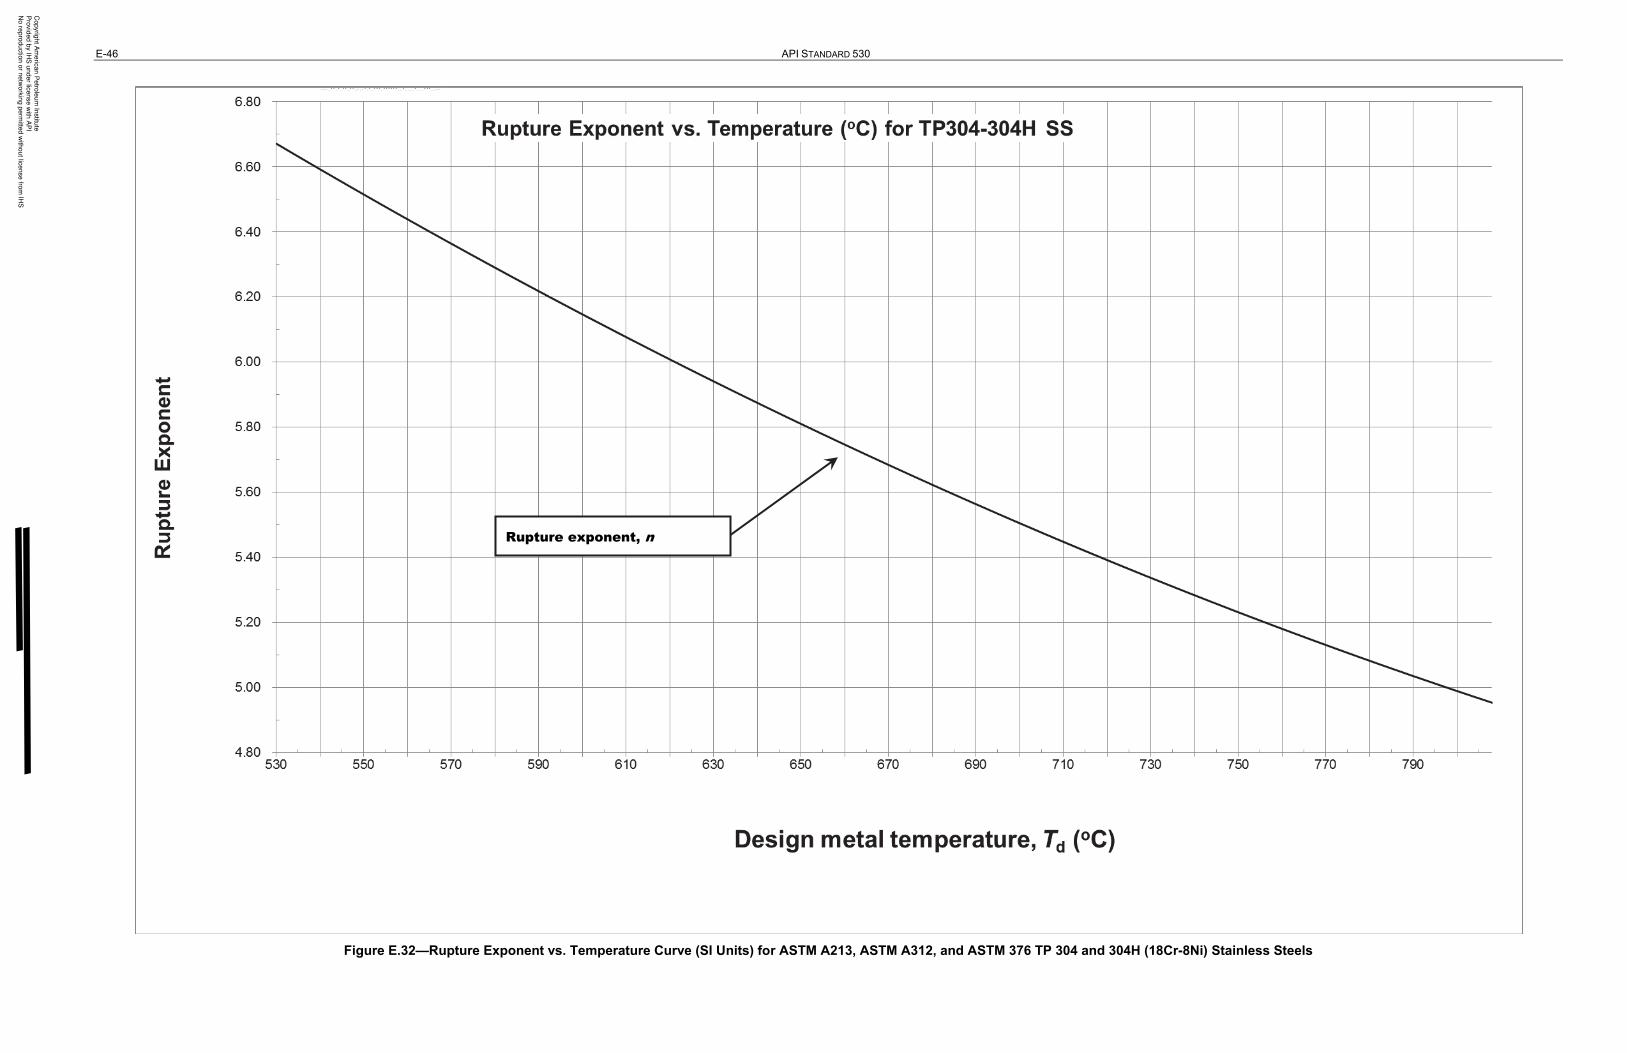
Figures E.2 to E.65 and Figures F.2 to F.65 show the rupture exponent, n, as a function of the design metal temperature. The rupture exponent is used for design in the creep-rupture range (see 5.4). The meaning of the rupture exponent is discussed in H.7. The rupture exponent values for each material are also listed in tabular format in Tables E.1 to E.22 and Tables F.1 to F.22.
6.5 Yield and Tensile Strengths
Figures E.1 to E.64 and Figures F.1 to F.64 in Annex F also show the yield and tensile strengths. These curves are included for reference only. Their sources are given in Annex H.
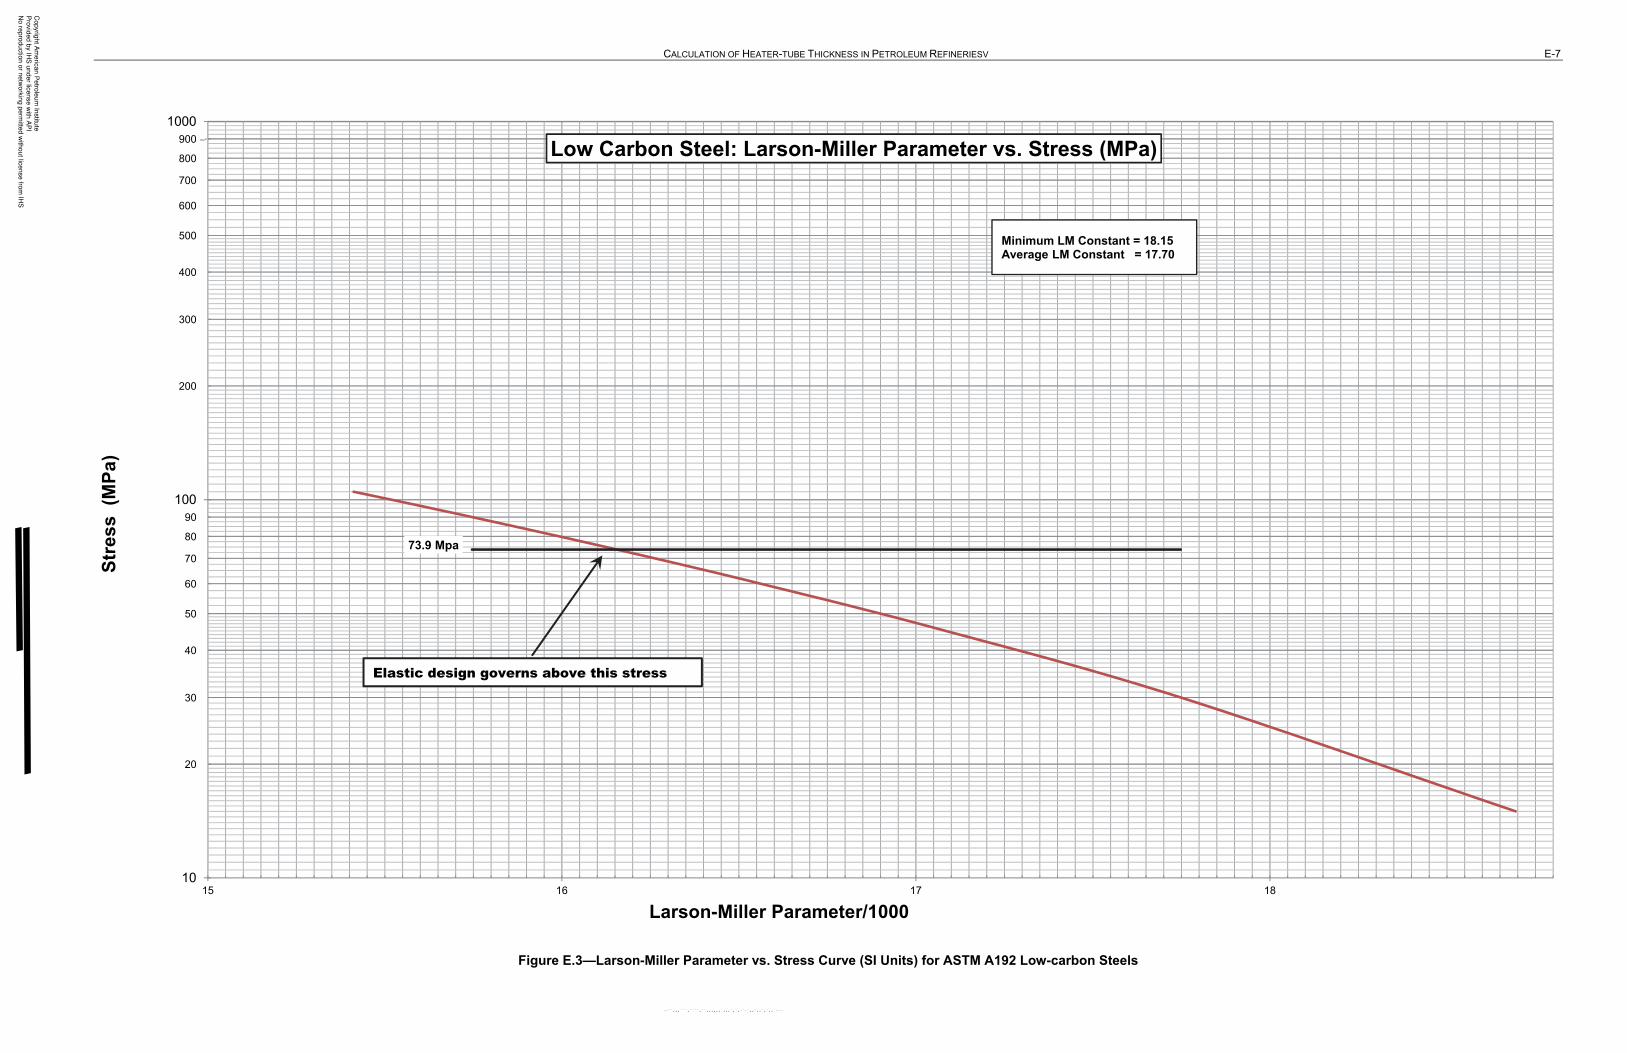
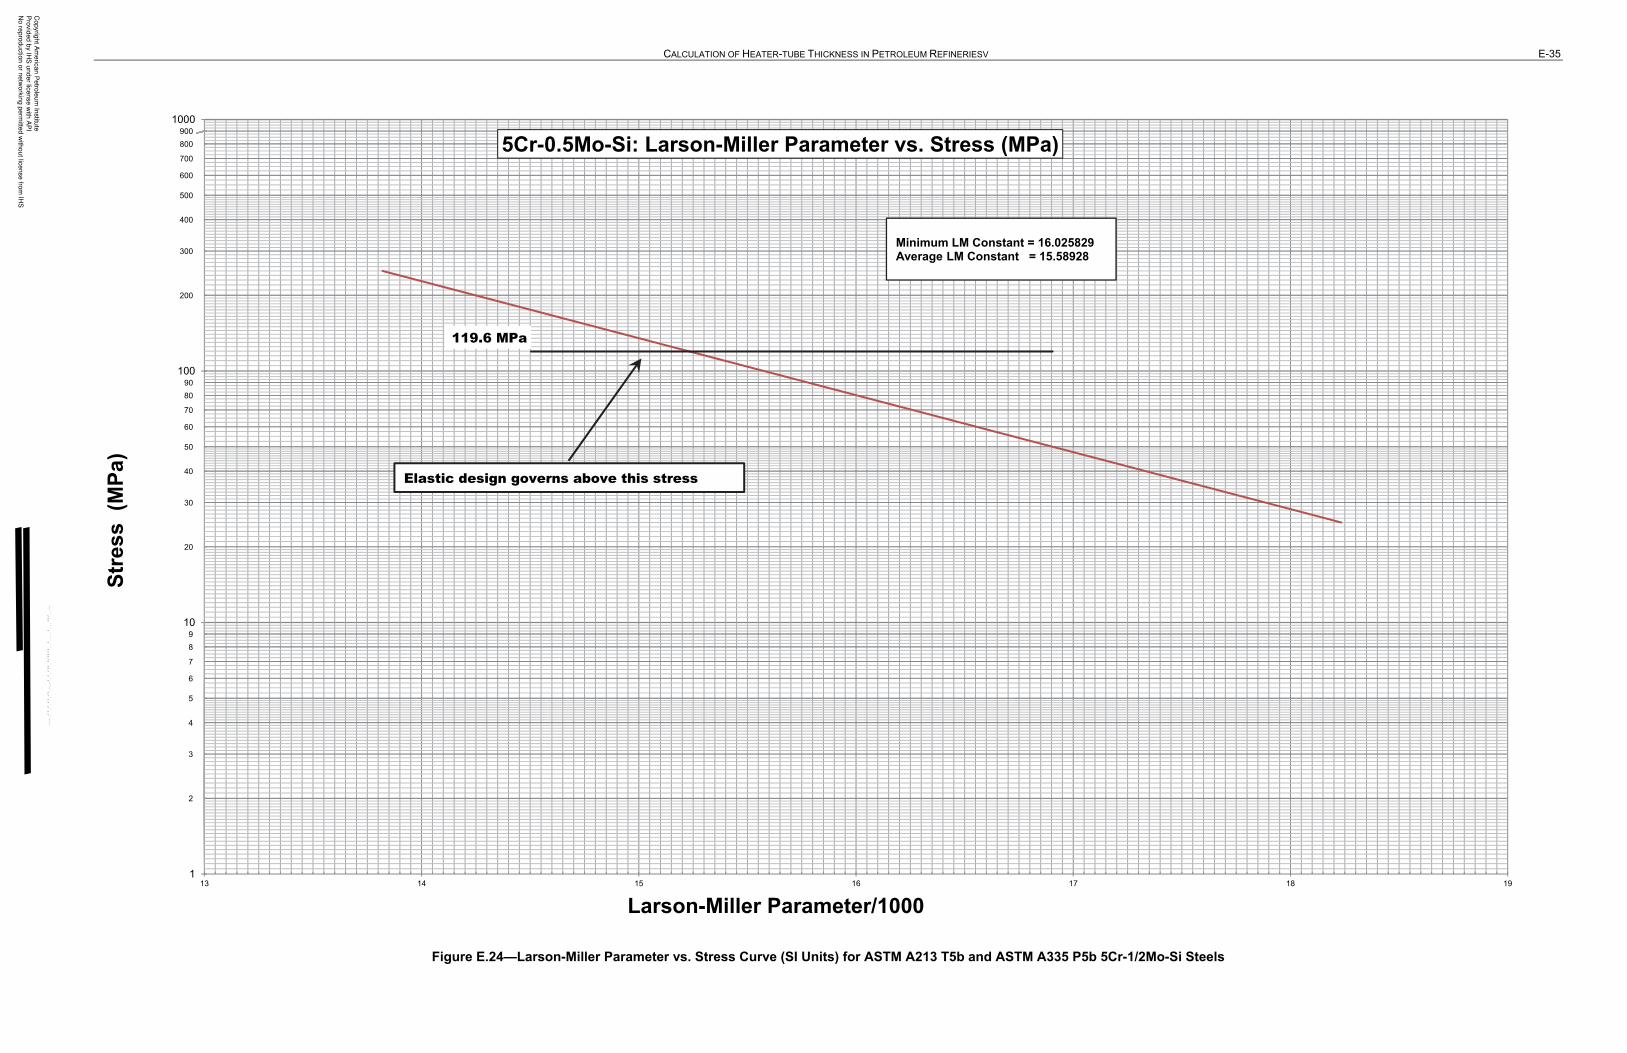
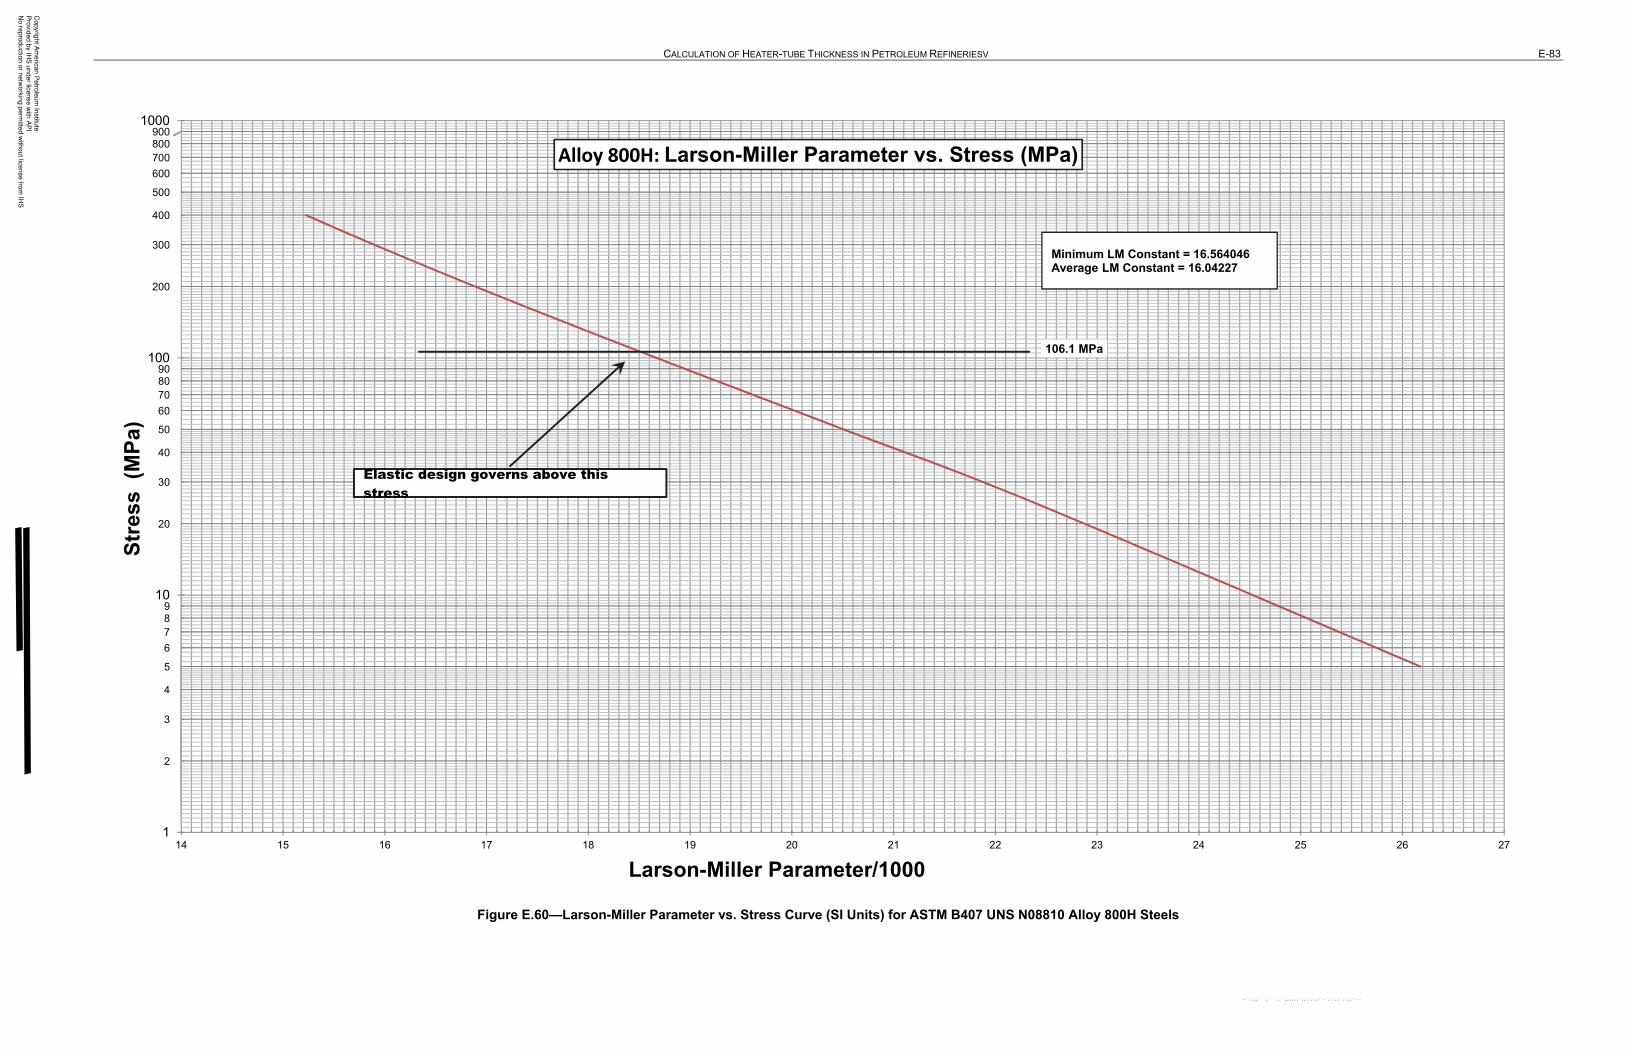
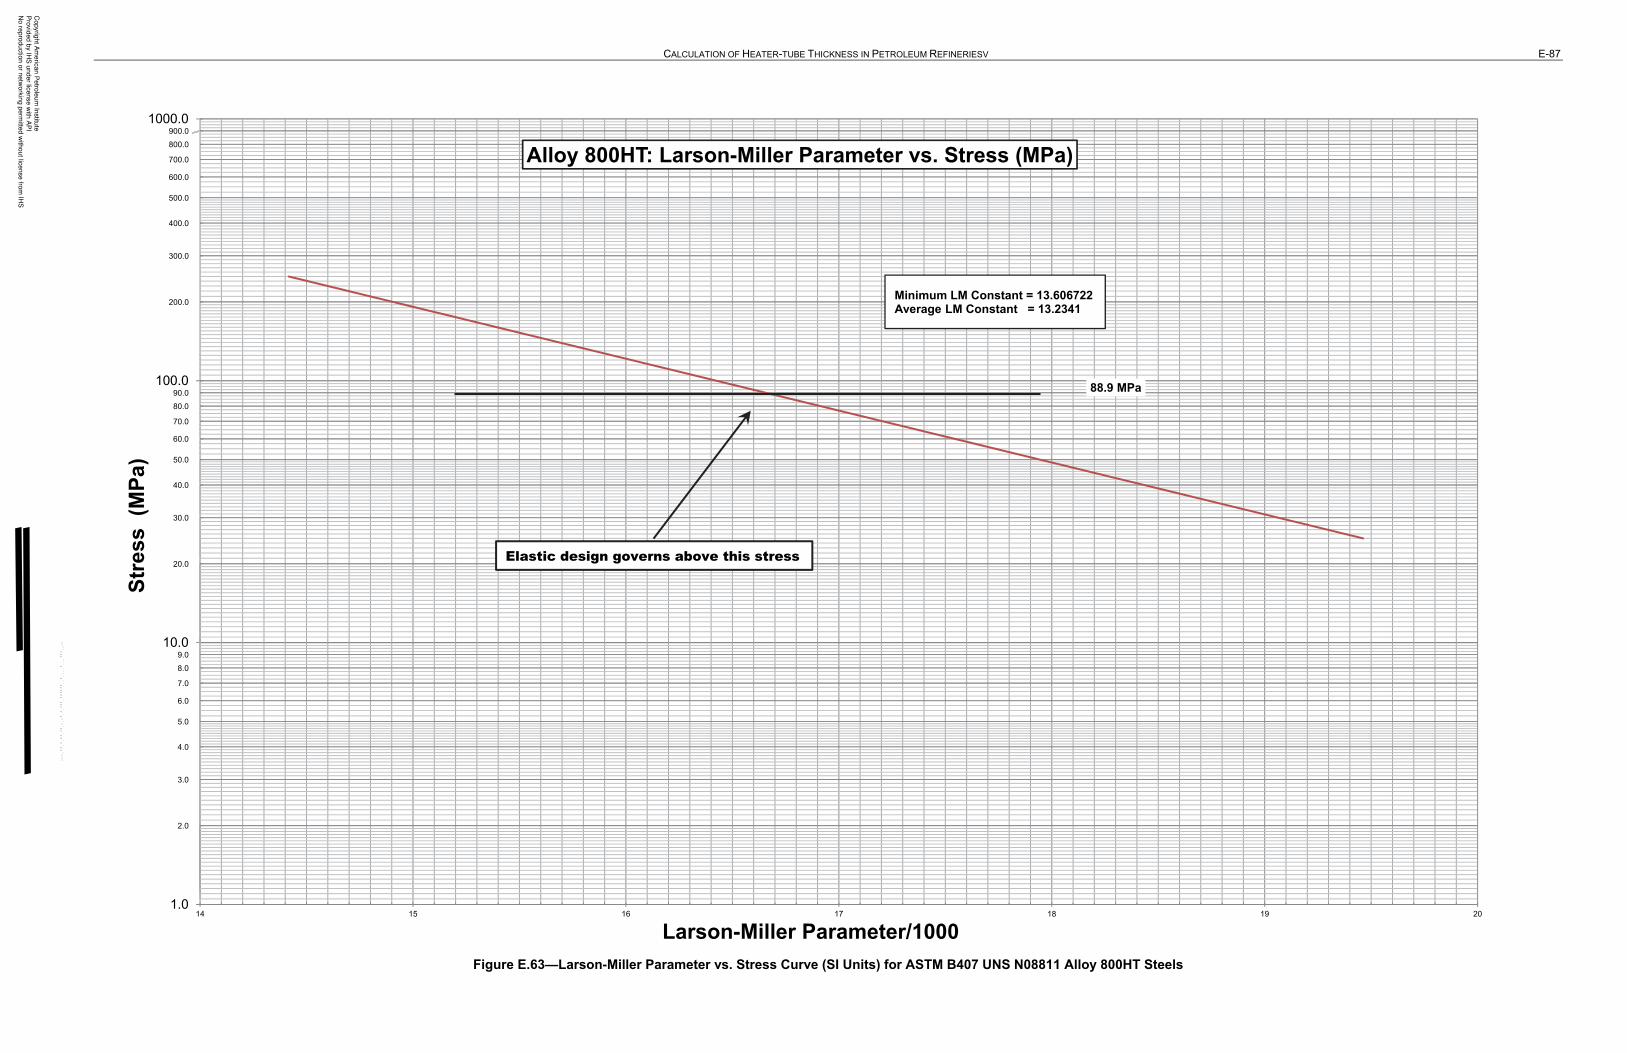
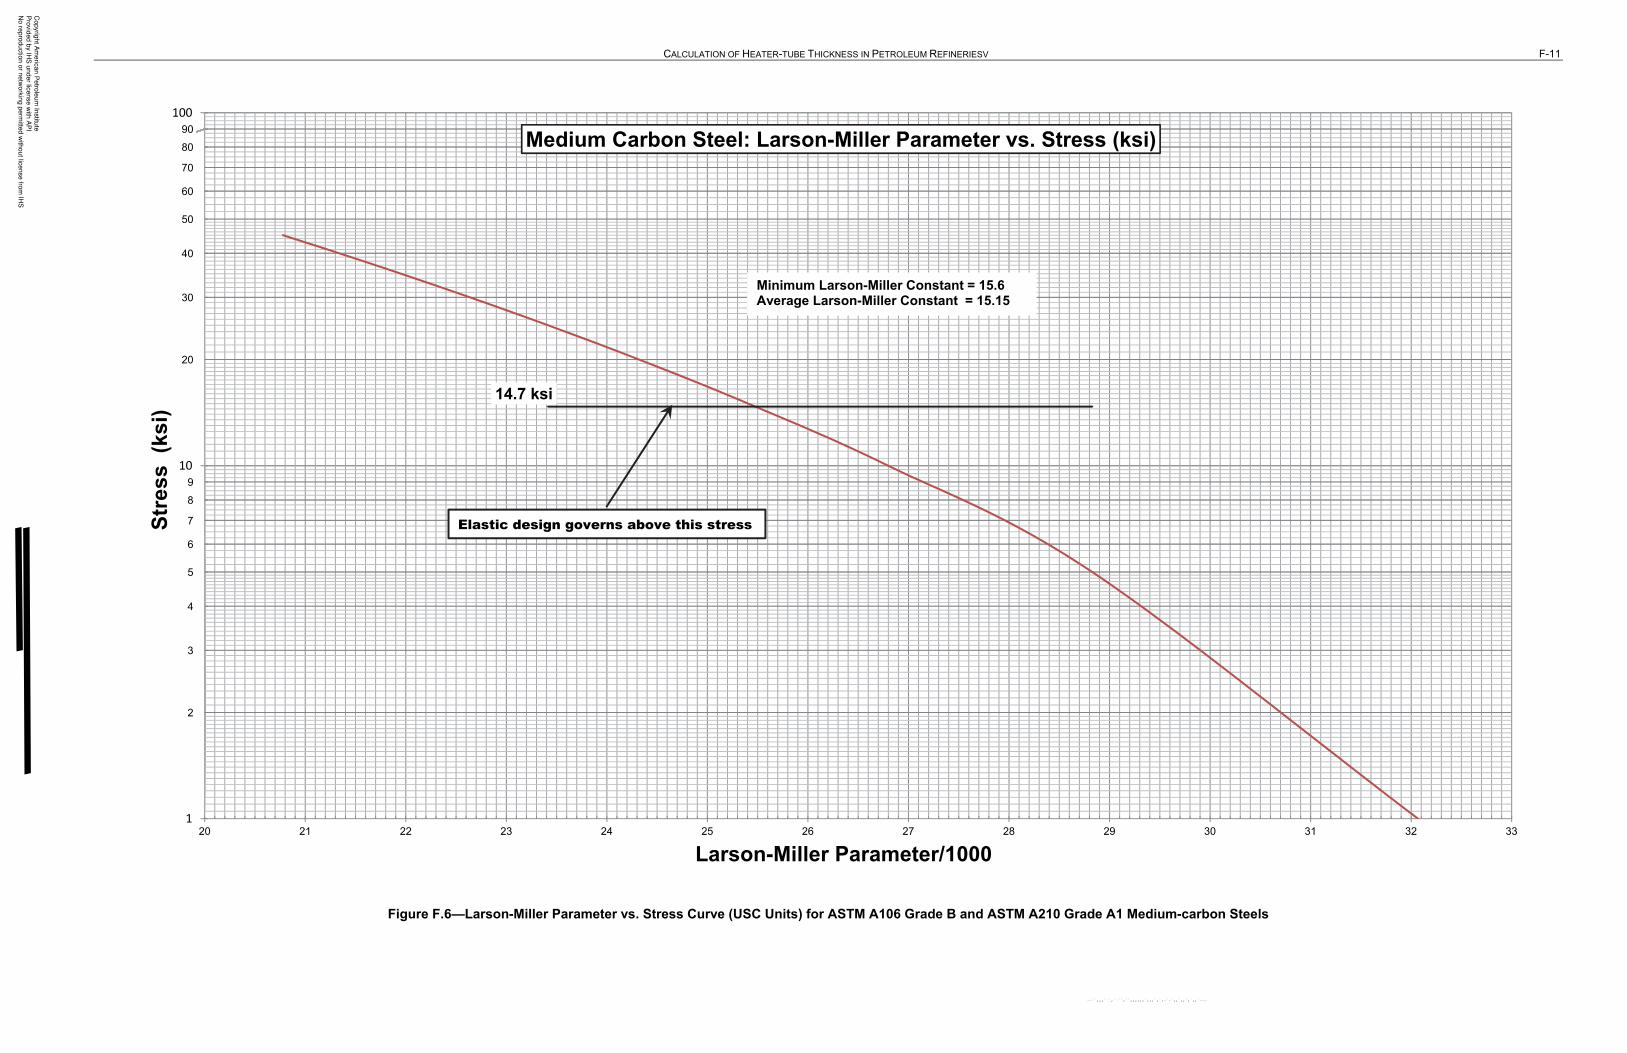
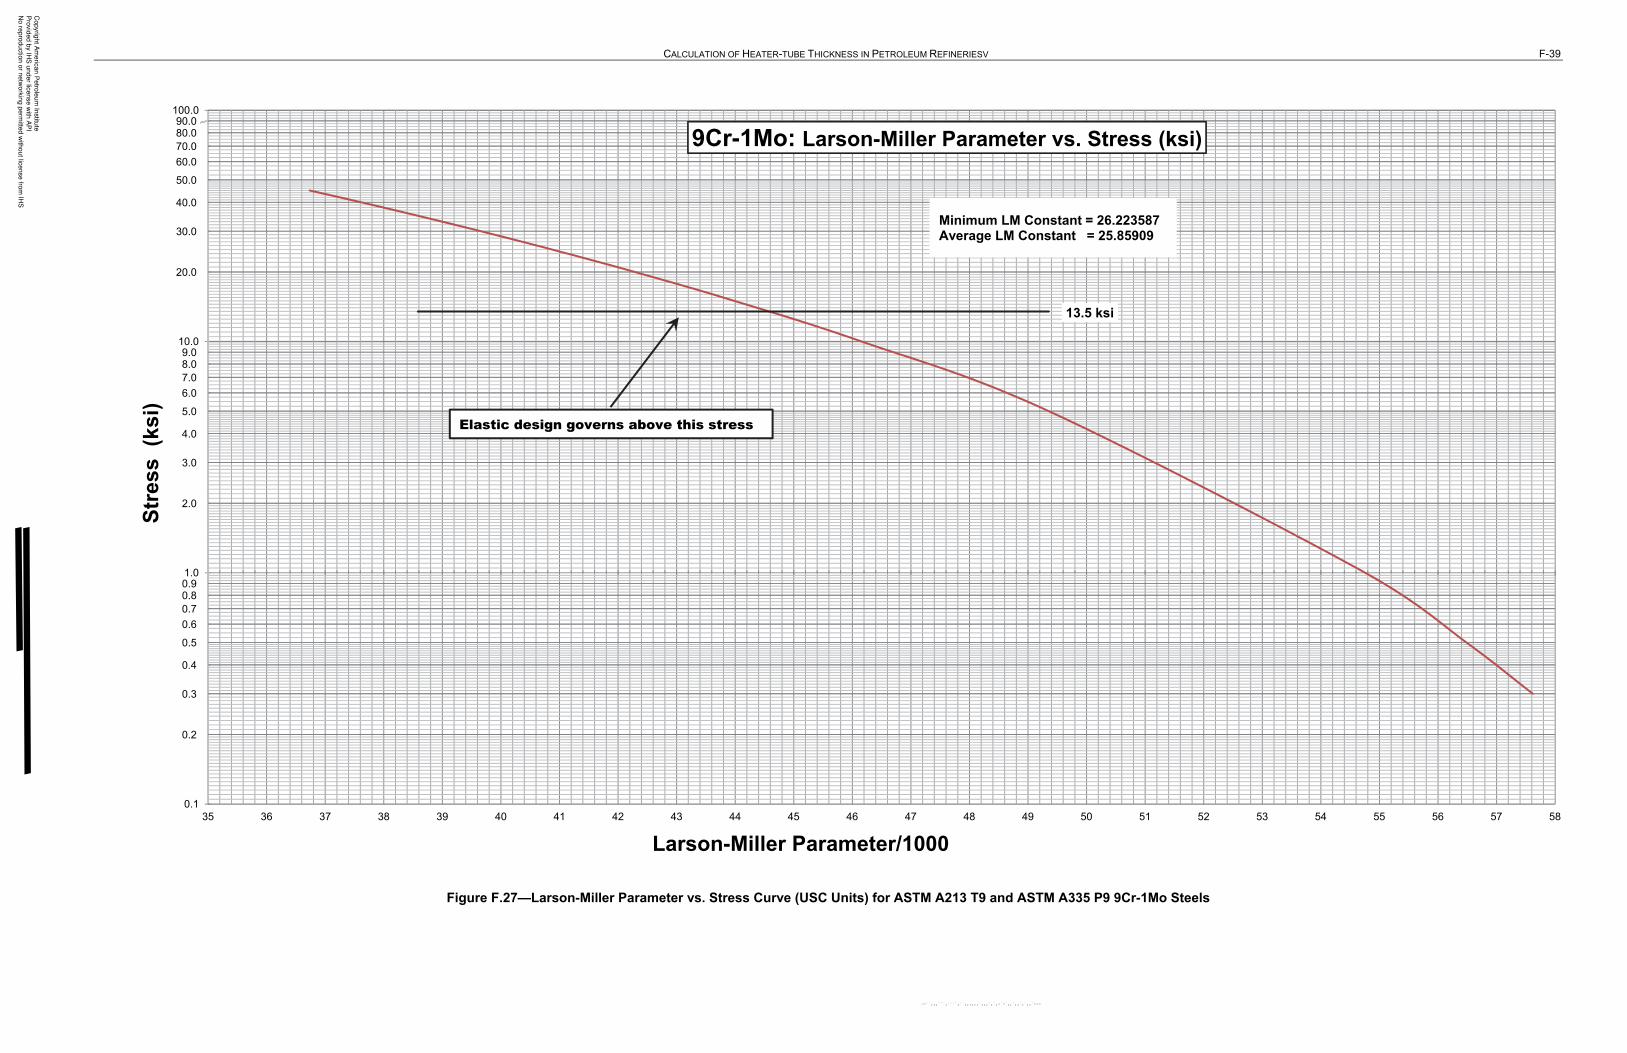
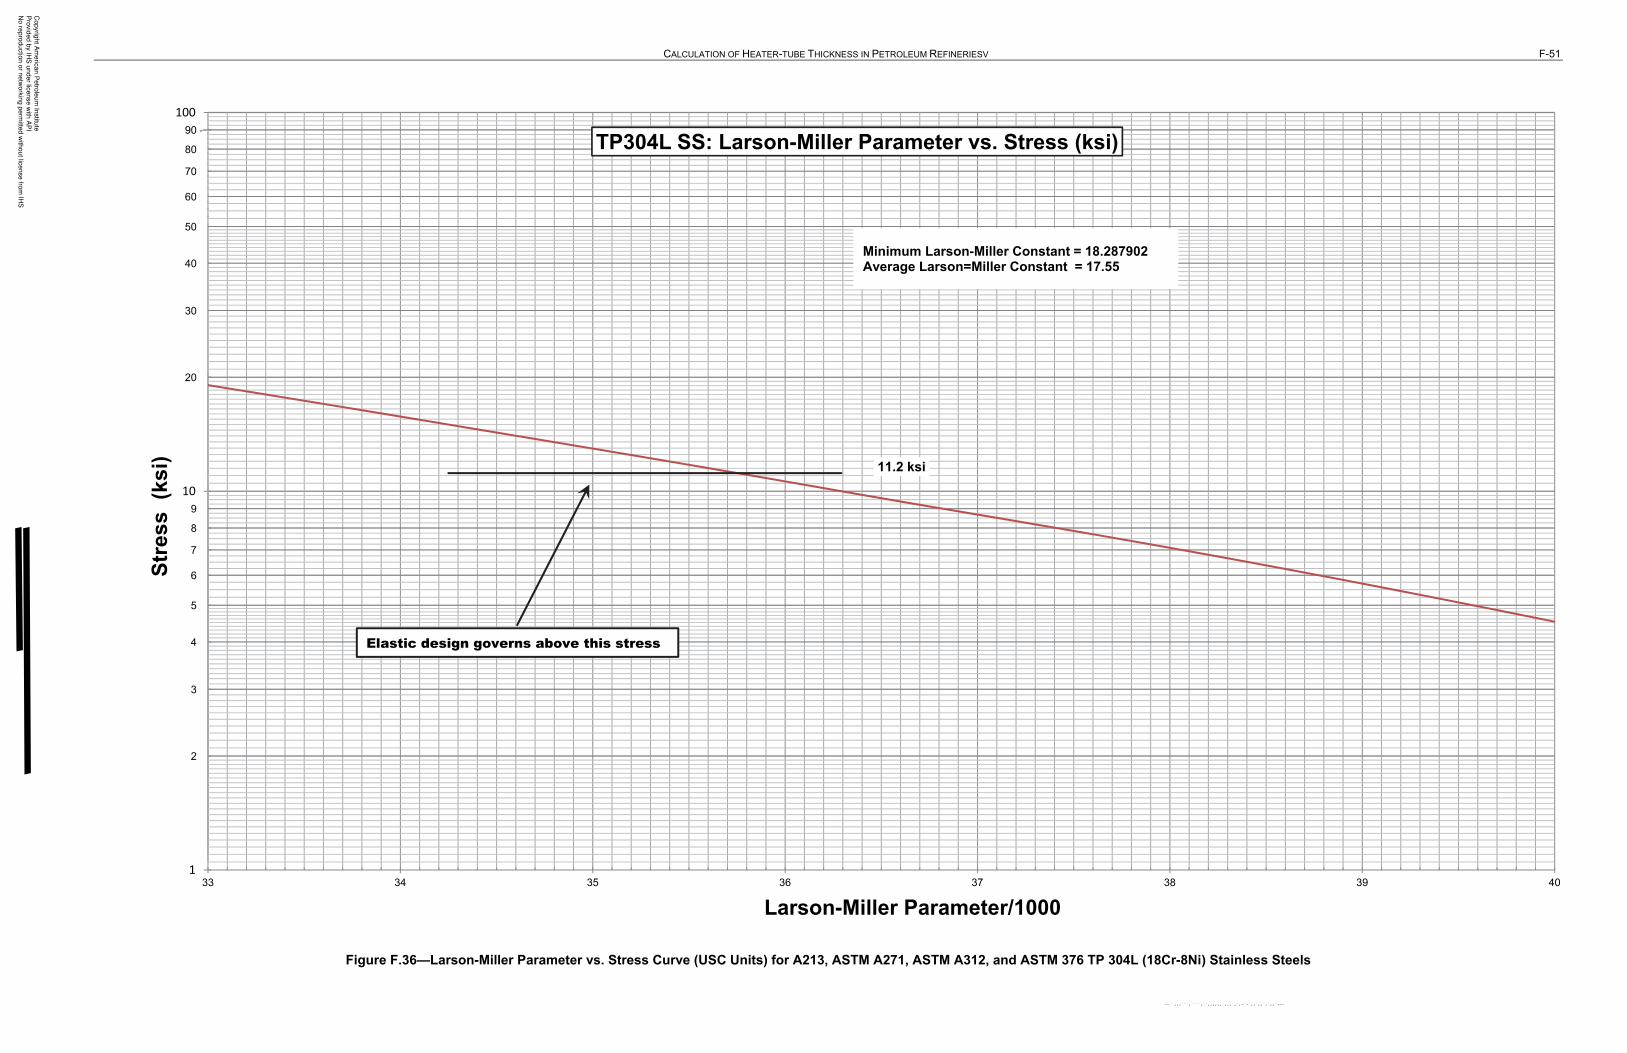
6.6 Larson-Miller Parameter Curves
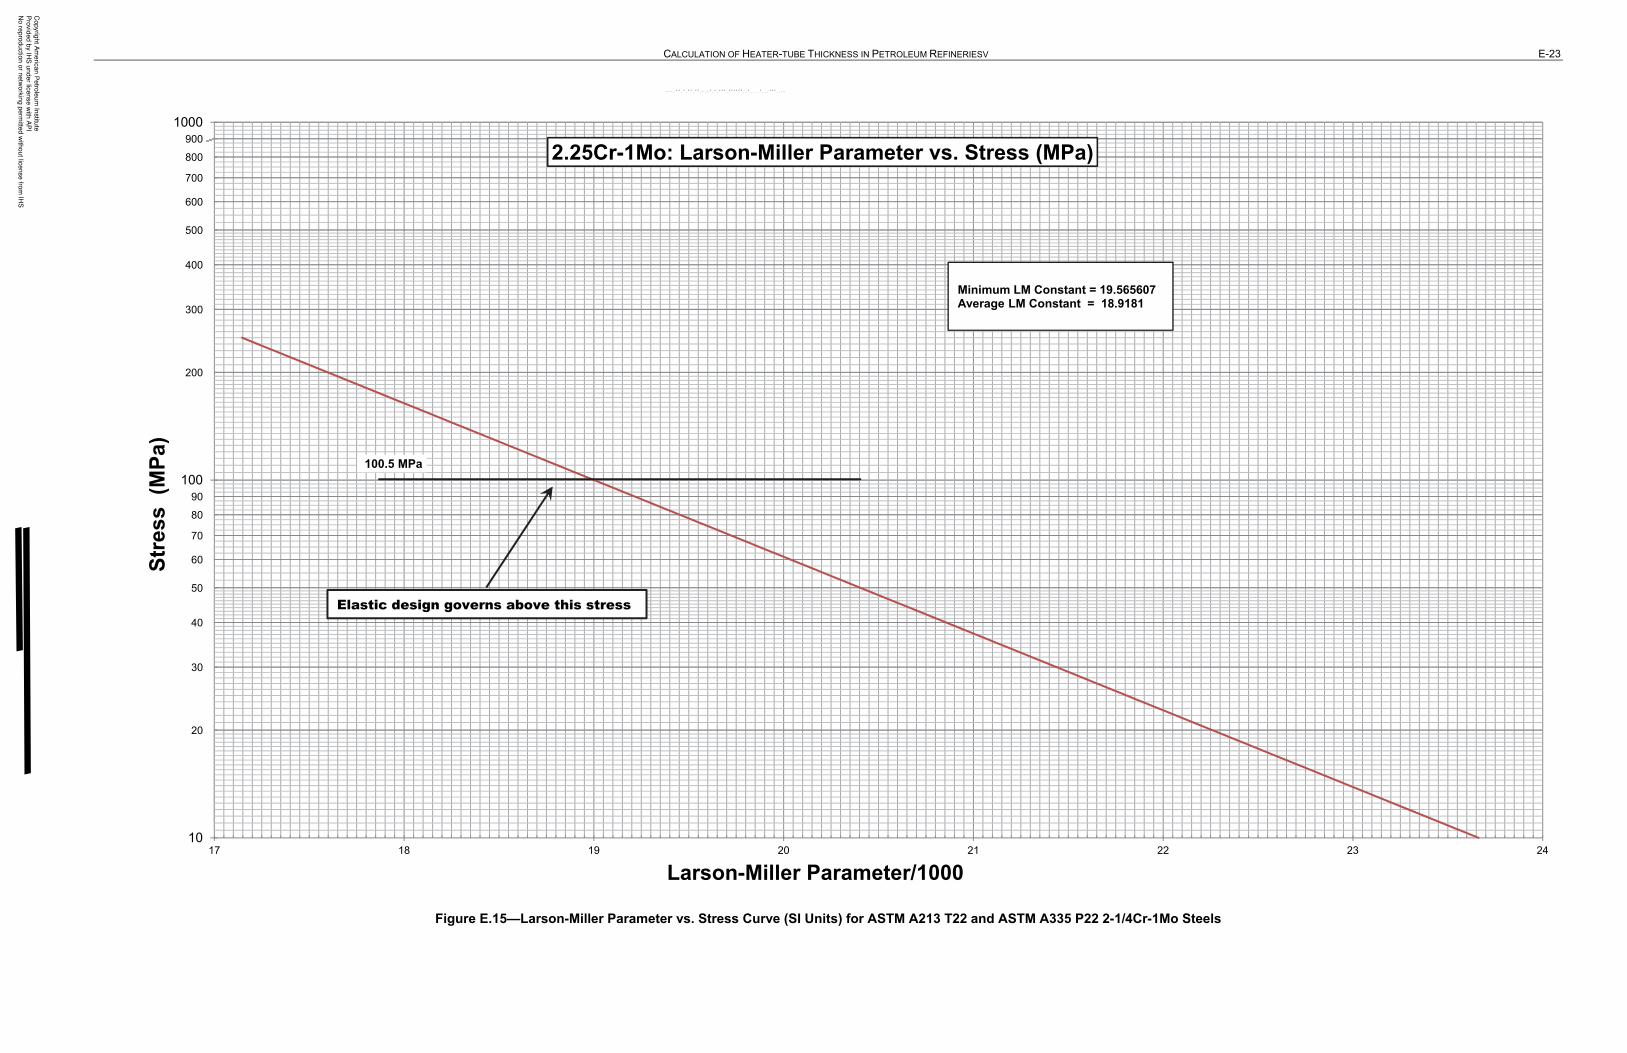
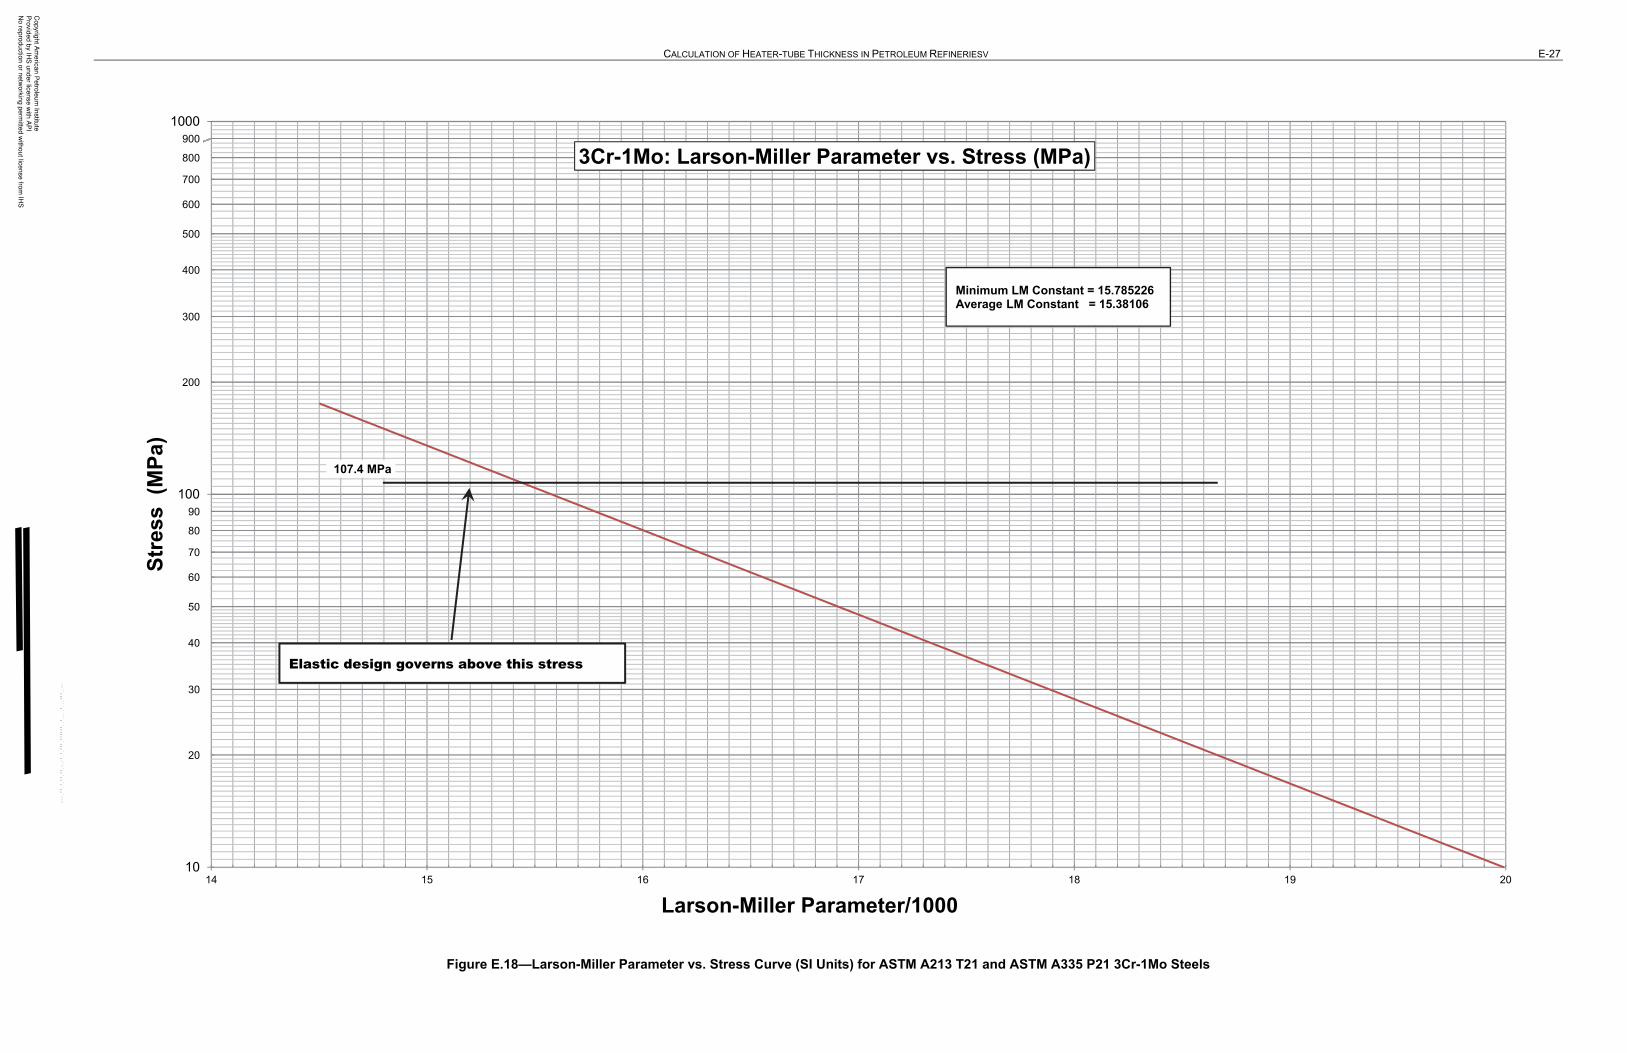
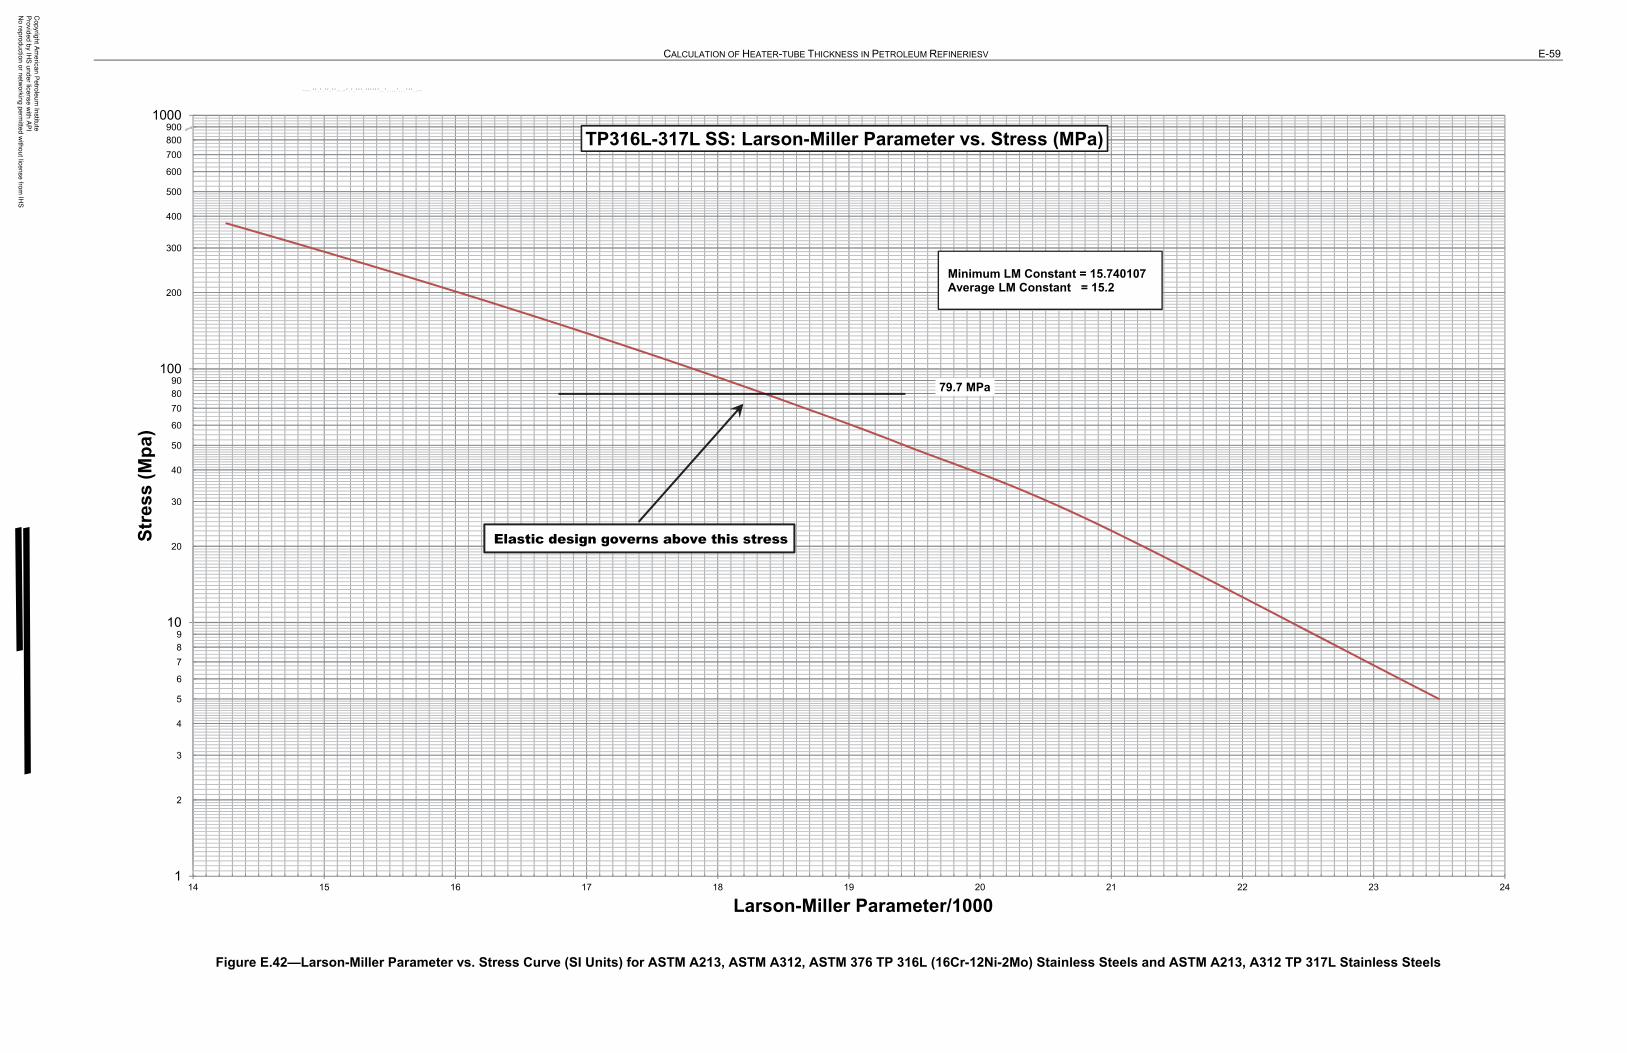
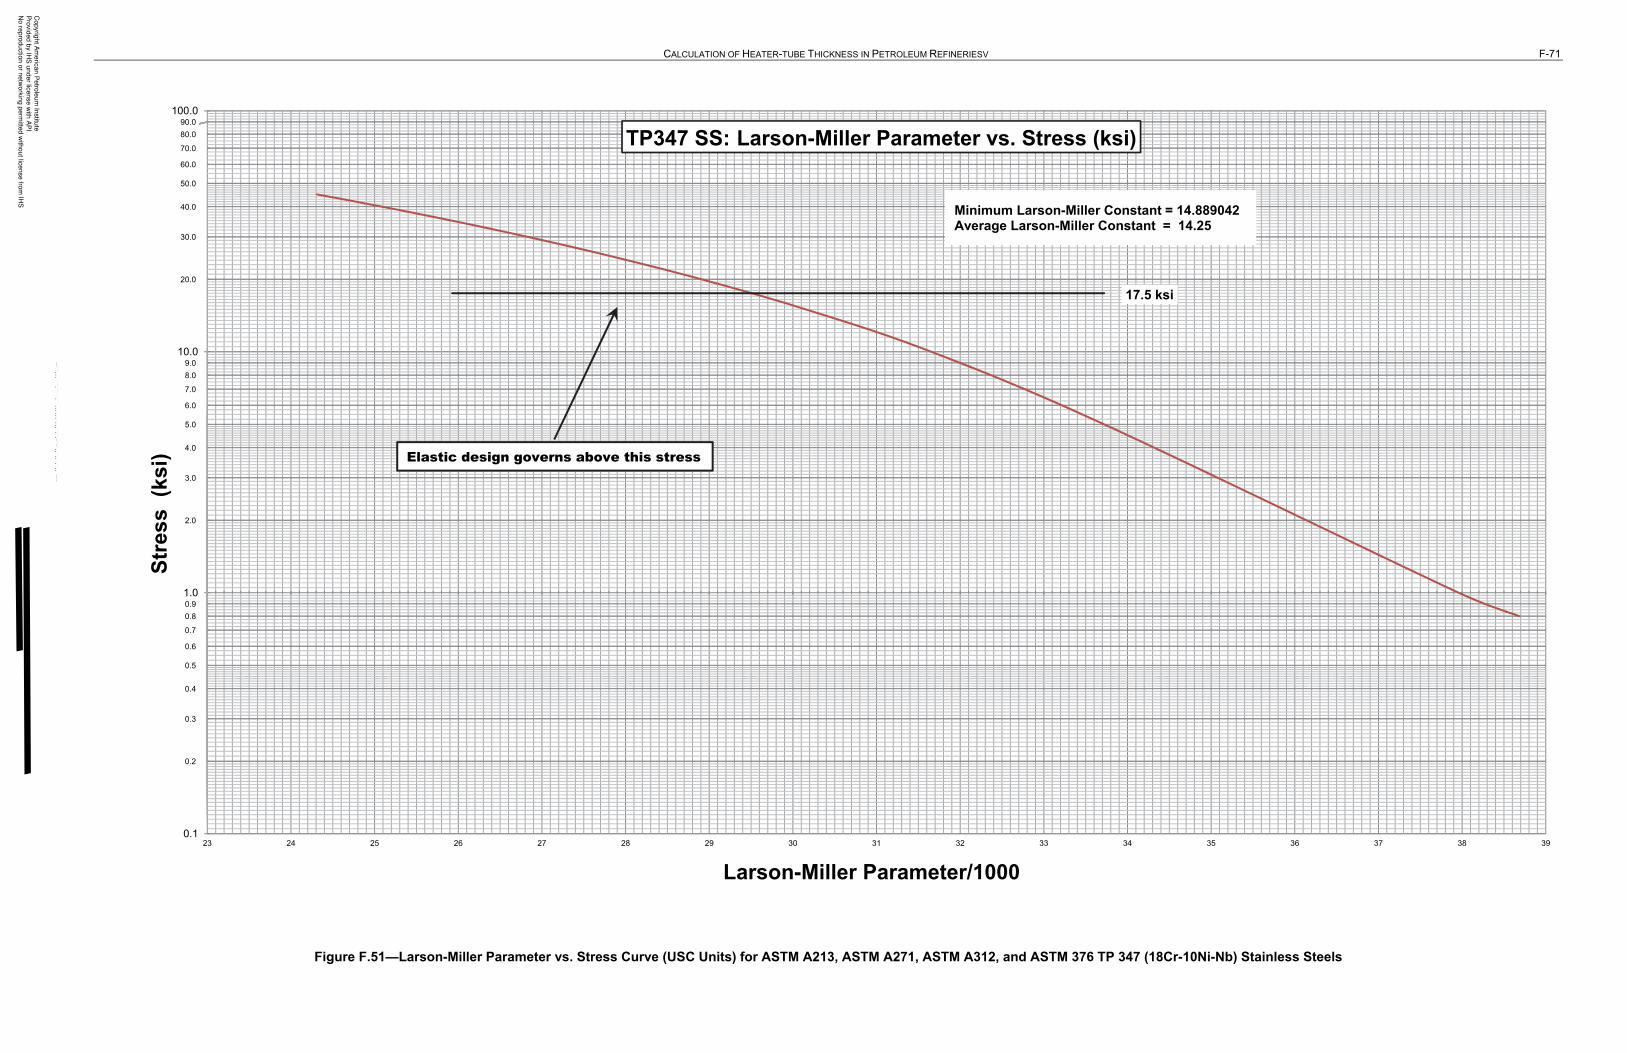
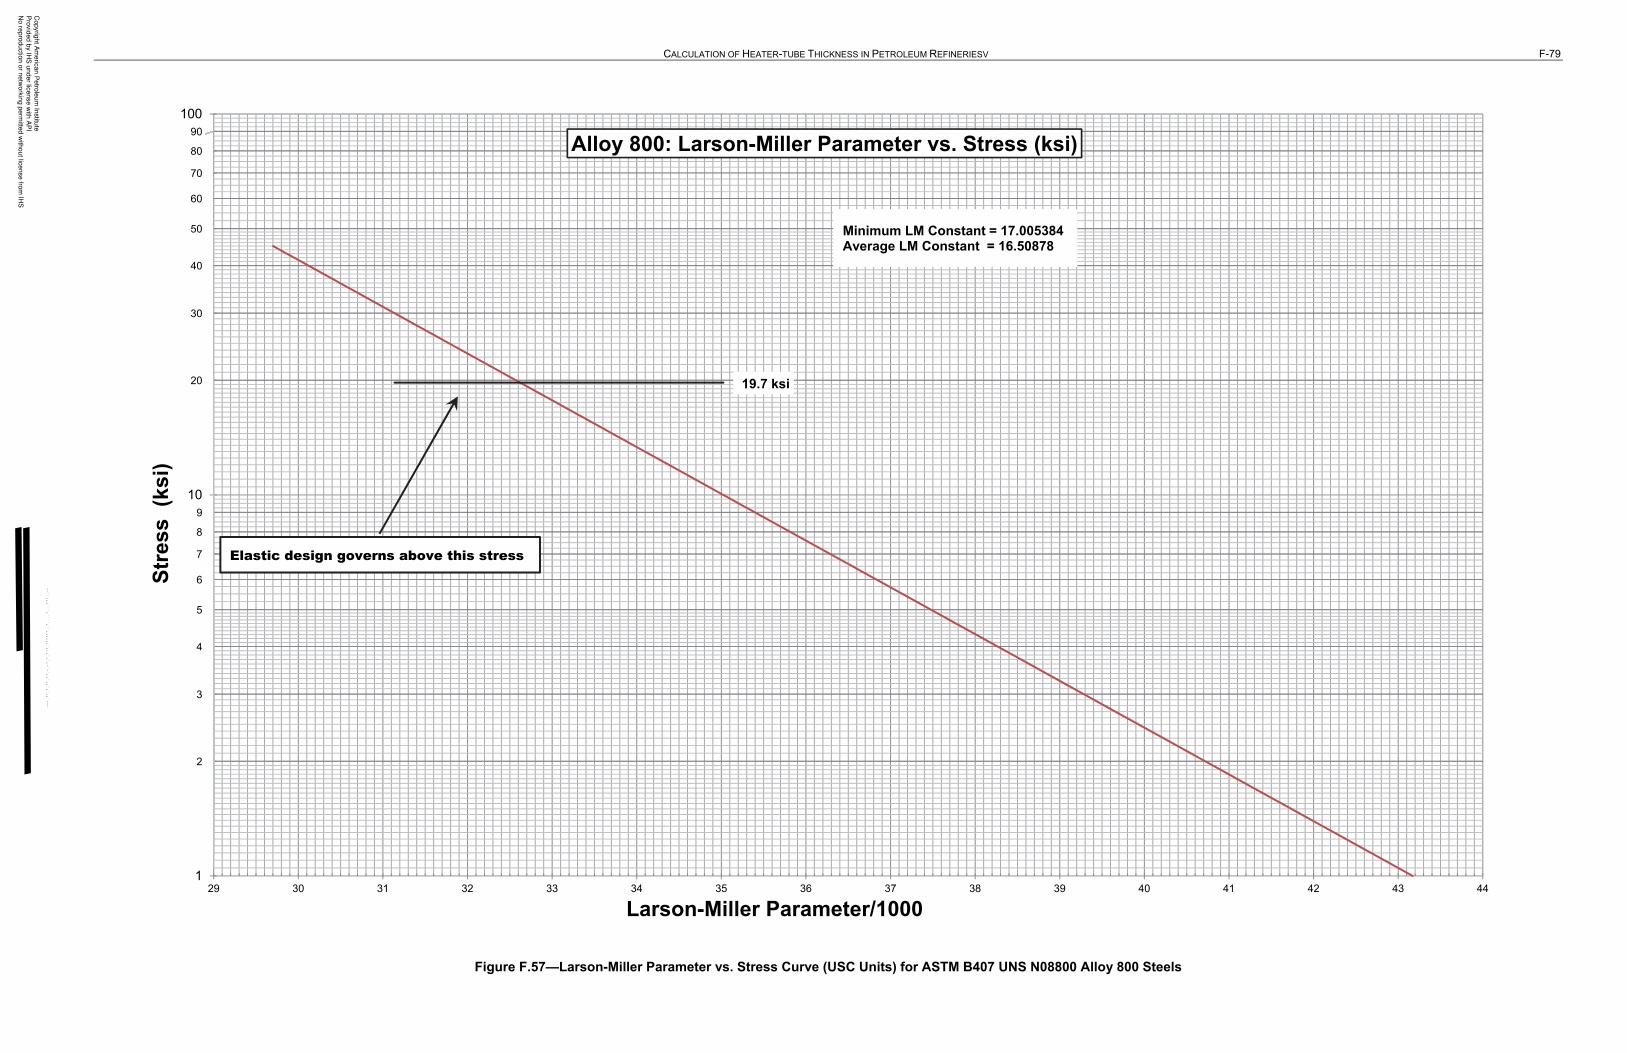
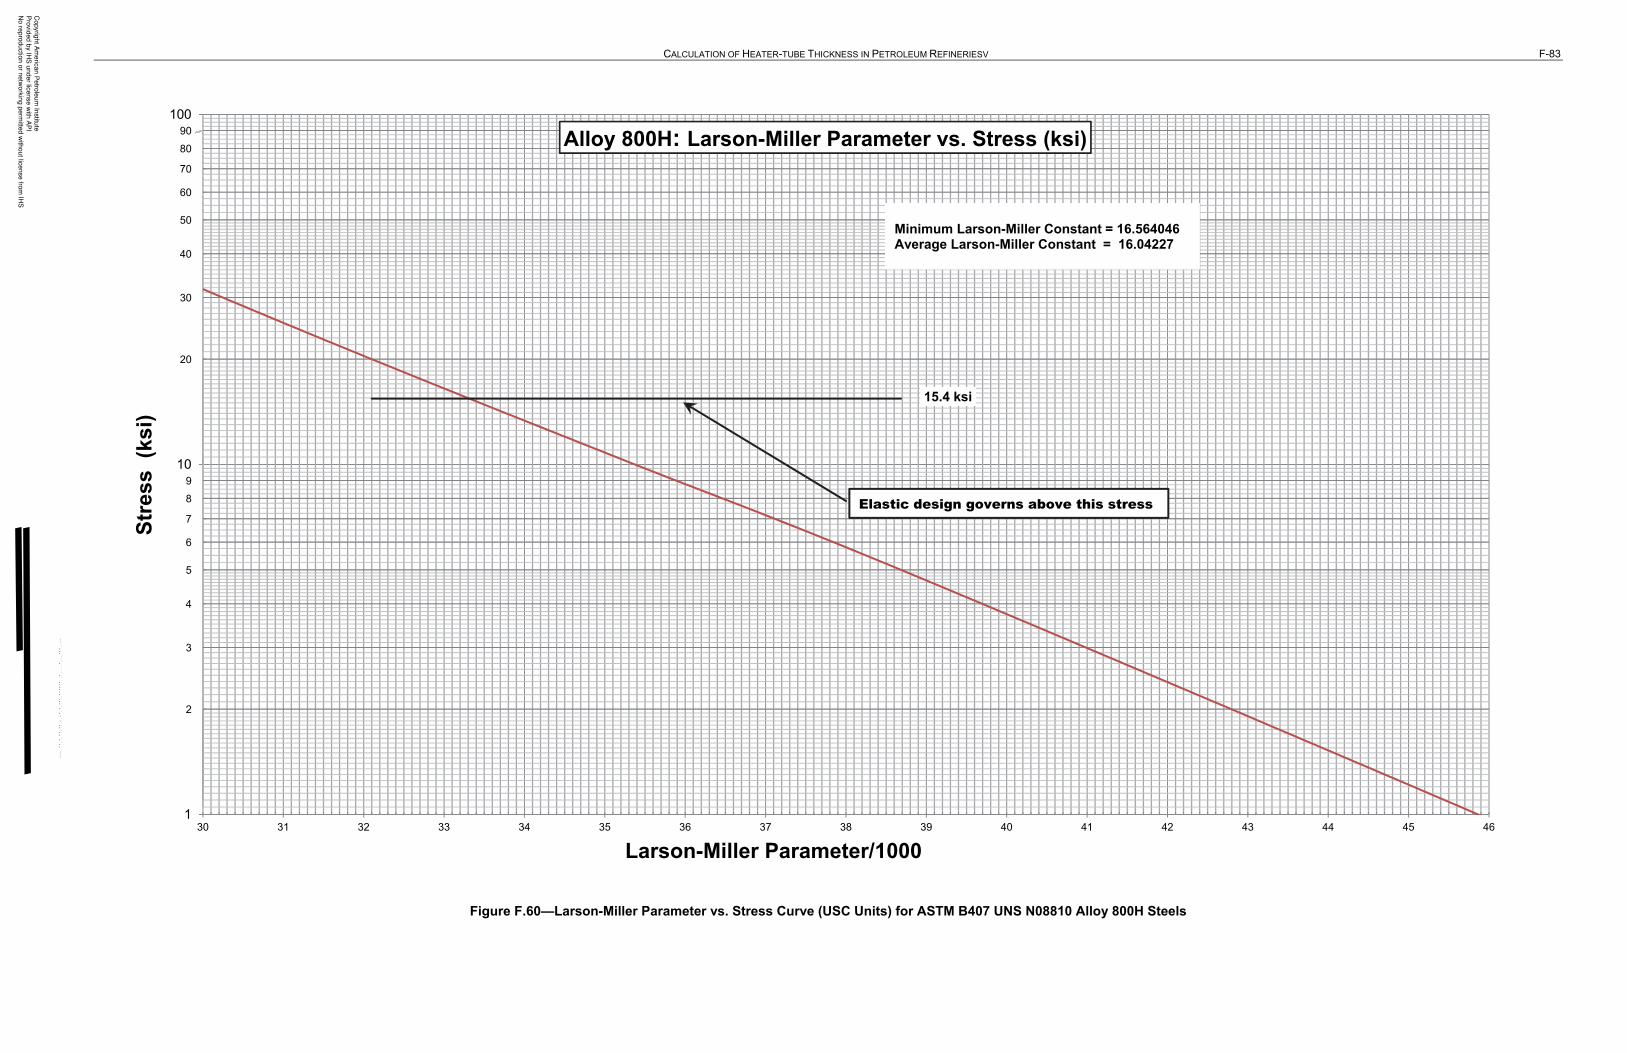
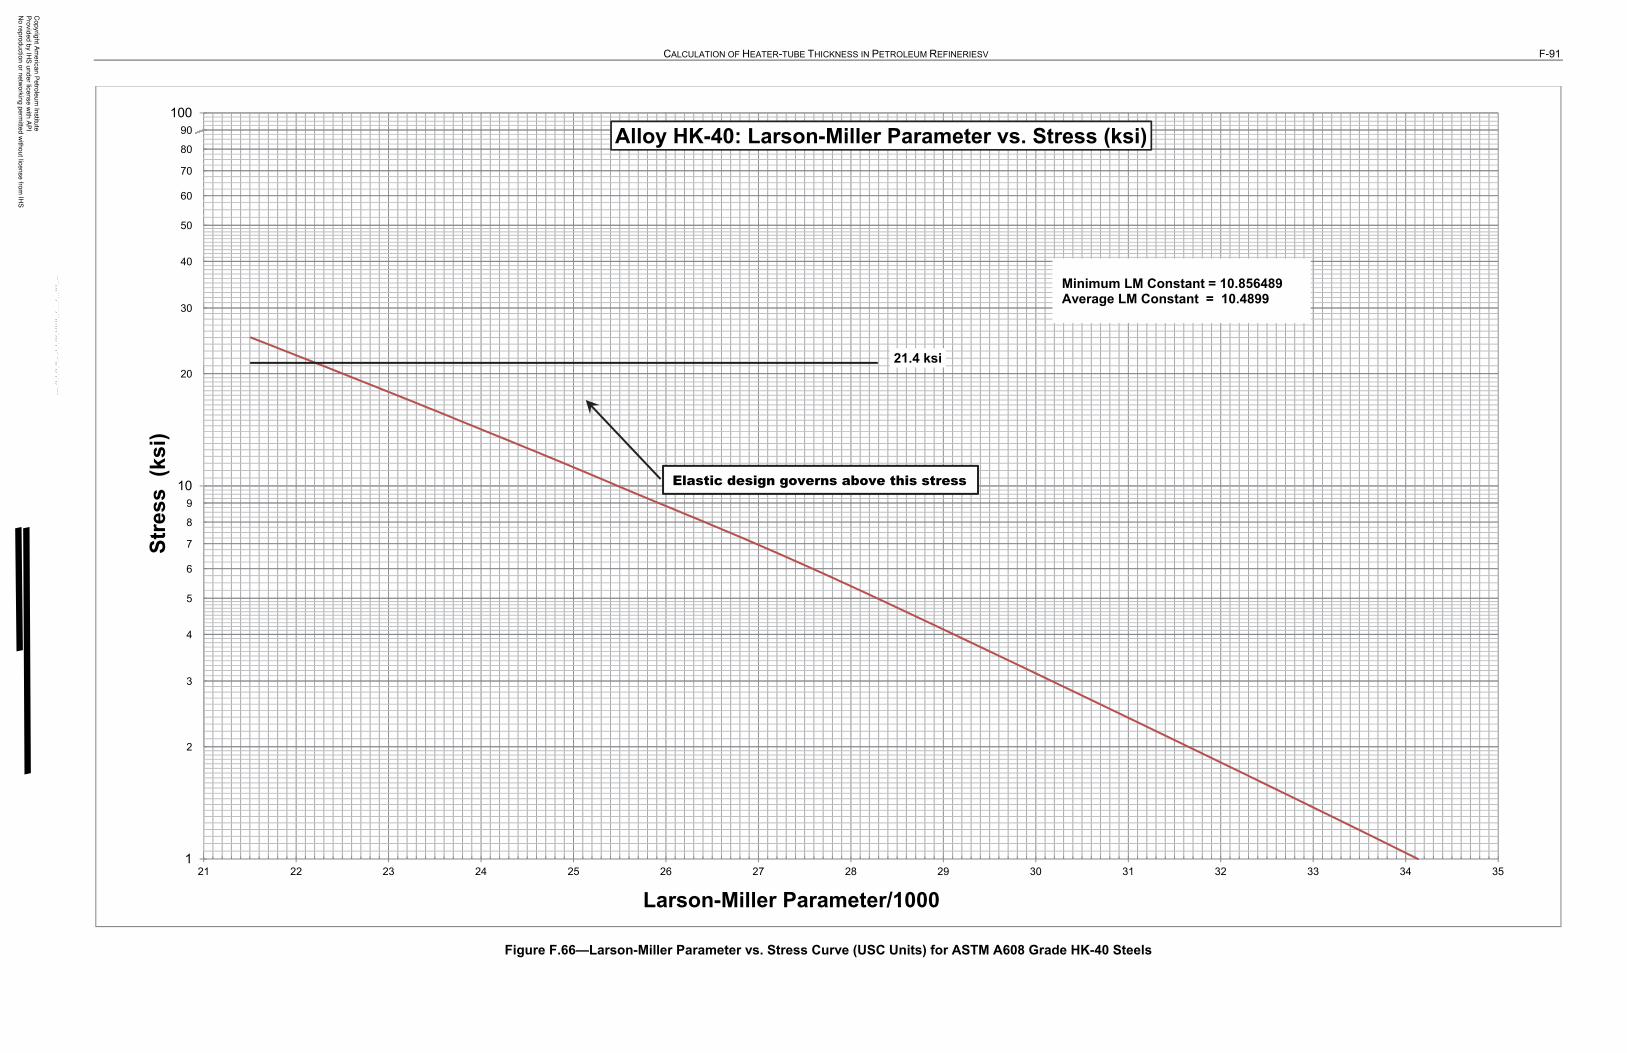
Figures E.3 to E.66 and Figures F.3 to F.66 show the Larson-Miller Parameter as a function of stress. The Larson-Miller Parameter as a function of stress [LMP(σ)] is calculated from the design metal temperature, Td, and the design life, tDL, as given in Equations (15) and (16). LMP dimensions are not specified in this document.
Copyright American Petroleum Institute
Provided by IHS under license with API
No reproduction or networking permitted without license from IHS
CALCULATION OF HEATER-TUBE THICKNESS IN PETROLEUM REFINERIES 17
When Td is expressed in degrees Celsius:
LMP(σ) = (Td + 273) (CLM + log10 tDL) (15)
When Td is expressed in degrees Fahrenheit:
LMP(σ) = (Td + 460) (CLM + log10 tDL) (16)
In past editions of this document, the Larson-Miller constant, CLM, used was a single value used for broad material groups [i.e. CLM = 20 for ferrous materials and CLM = 15 for high alloy and nonferrous (high-nickel) materials].
However, in this document, the Larson-Miller constant have been optimized, specific for each individual material group. Table 4 lists the Larson-Miller Constants for minimum and average properties for each alloy. These values were obtained from Table 3 and Table 3M of WRC Bull 541. Refer to H.5 for a detailed description of how these curves were derived.
The Larson-Miller Parameter versus rupture strength curve are shown as Figures E.3 through E.66 and Figures F.3 through F.66 for each individual material. These curves may be used to calculate remaining tube life, as described in Annex A.
The plot of the minimum rupture strength against the Larson-Miller Parameter is included so that the rupture allowable stress can be determined for any design life. The curves shall not be used to determine rupture allowable stresses for temperatures higher than the limiting design metal temperatures shown in Table 5. Furthermore, the curves can give inaccurate rupture allowable stresses for a tube life of less than 20,000 hours or greater than 200,000 hours (refer to H.5).
6.7 Limiting Design Metal Temperature
The limiting design metal temperature for each heater-tube alloy is given in Table 5. The limiting design metal temperature is the upper limit of the reliability of the rupture strength data. Higher temperatures, i.e. up to 30 °C (50 °F) below the lower critical temperature, are permitted for short-term operating conditions, such as those that exist during steam-air decoking or regeneration. Operation at higher temperatures can result in changes in the alloy’s microstructure. Lower critical temperatures for ferritic steels are shown in Table 5. Austenitic steels do not have lower critical temperatures. Other considerations can require lower operating-temperature limits, such as oxidation, graphitization, carburization, and hydrogen attack. These factors shall be considered when furnace tubes are designed.
6.8 Allowable Stress Curves
The rupture allowable stress curves were developed from the information found in Section 6 of WRC Bull 541 and reflect the mechanical property data obtained from tubes manufactured using modern techniques. The figure number for set of curves for each alloy is shown in Table 6 below.
Copyright American Petroleum Institute
Provided by IHS under license with API
No reproduction or networking permitted without license from IHS
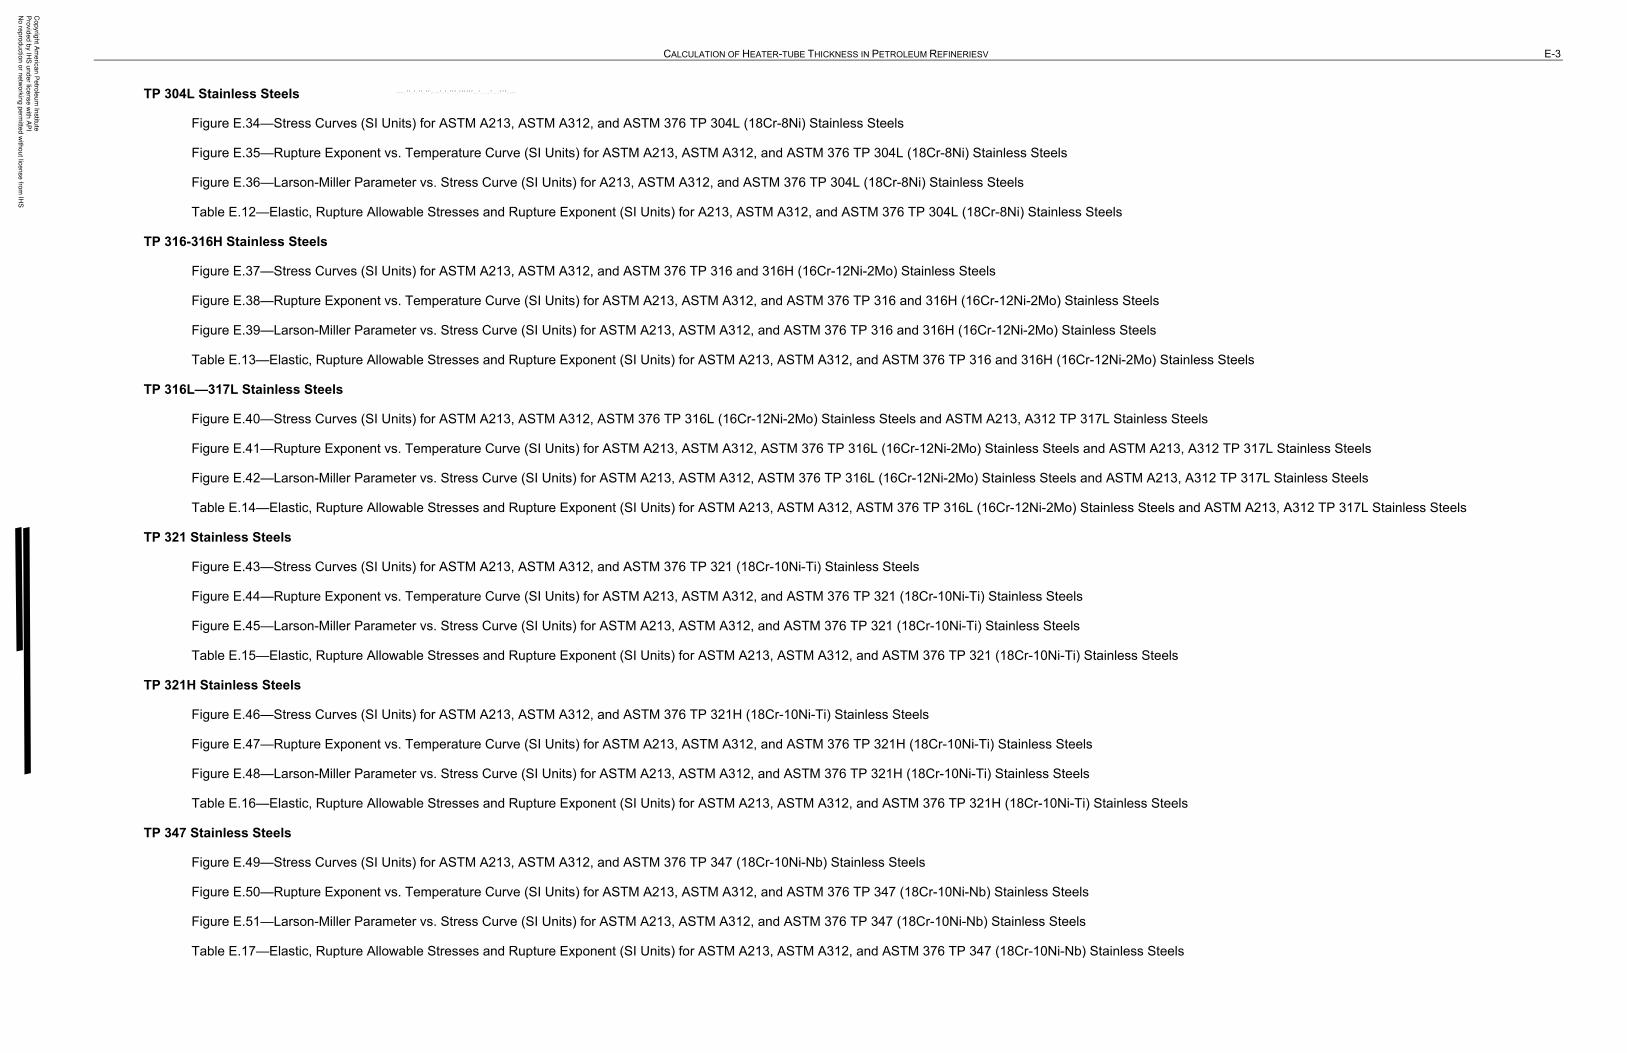
E.31 (F.31) 18Cr-8Ni (304 and 304H) Stainless Steel
E.34 (F.34) 18Cr-8Ni (304L) Stainless Steel
E.37 (F.37) 16Cr-12Ni-2Mo (316 and 316H) Stainless Steel
E.40 (F.40) 16Cr-12Ni-2Mo (316L) Stainless Steel
E.40 (F.40) 16Cr-12Ni-3Mo (317L) Stainless Steel
E.43 (F.43) 18Cr-10Ni-Ti (321) Stainless Steel
E.46 (F.46) 18Cr-10Ni-Ti (321H) Stainless Steel
E.49 (F.49) 18Cr-10Ni-Nb (347) Stainless Steel
E.52 (F.52) 18Cr-10Ni-Nb (347H) Stainless Steel
E.55 (F.55) Ni-Fe-Cr (Alloy 800)
E.58 (F.58) Ni-Fe-Cr (Alloy 800H)
E.61 (F.61) Ni-Fe-Cr (Alloy 800HT)
E.64 (F.64) 25Cr-20Ni (HK-40)
7 Sample Calculations
7.1 Elastic Design
The following example illustrates the use of design equations for the elastic range. Suppose the following information is given (the USC unit conversions in parentheses are approximate):
Material = 18Cr-10Ni-Nb, type 347 stainless steel
Do = 168.3 mm (6.625 in.)
pel = 6.2 MPa gauge (900 psig)
Td = 425 °C (800 °F)
δCA = 3.2 mm (0.125 in.)
Copyright American Petroleum Institute
Provided by IHS under license with API
No reproduction or networking permitted without license from IHS
The thermal stress, σT, in the tube designed in accordance with 7.1 shall be checked using the following values for the variables in the equations given in Annex C:
α = 1.81 × 10⁻⁵ K−1 (10.05 × 10⁻⁶ R−1) (thermal expansion coefficient taken from ASME B31.3, Process Piping Code);
E = 1.66 × 10⁵ MPa (24.1 × 10⁶ psi) (modulus of elasticity taken from ASME B31.3, Process Piping Code);
v = 0.3 (Poisson’s ratio value commonly used for steels);
The thickness calculated in 7.1 is the minimum. The average thickness shall be used in the thermal-stress calculation. The average thickness (see 5.7) is calculated as follows:
In SI units:
(7.2) (1 + 0.14) = 8.2 mm
In USC units:
(0.284) (1 + 0.14) = 0.324 in.
The actual inside diameter is calculated as follows:
In SI units:
Di = 168.3 − 2(8.2) = 151.9 mm
y = 168.3/151.9 = 1.108
where y is the ratio of outside diameter to actual inside diameter, Do/Di.
Copyright American Petroleum Institute
Provided by IHS under license with API
No reproduction or networking permitted without license from IHS
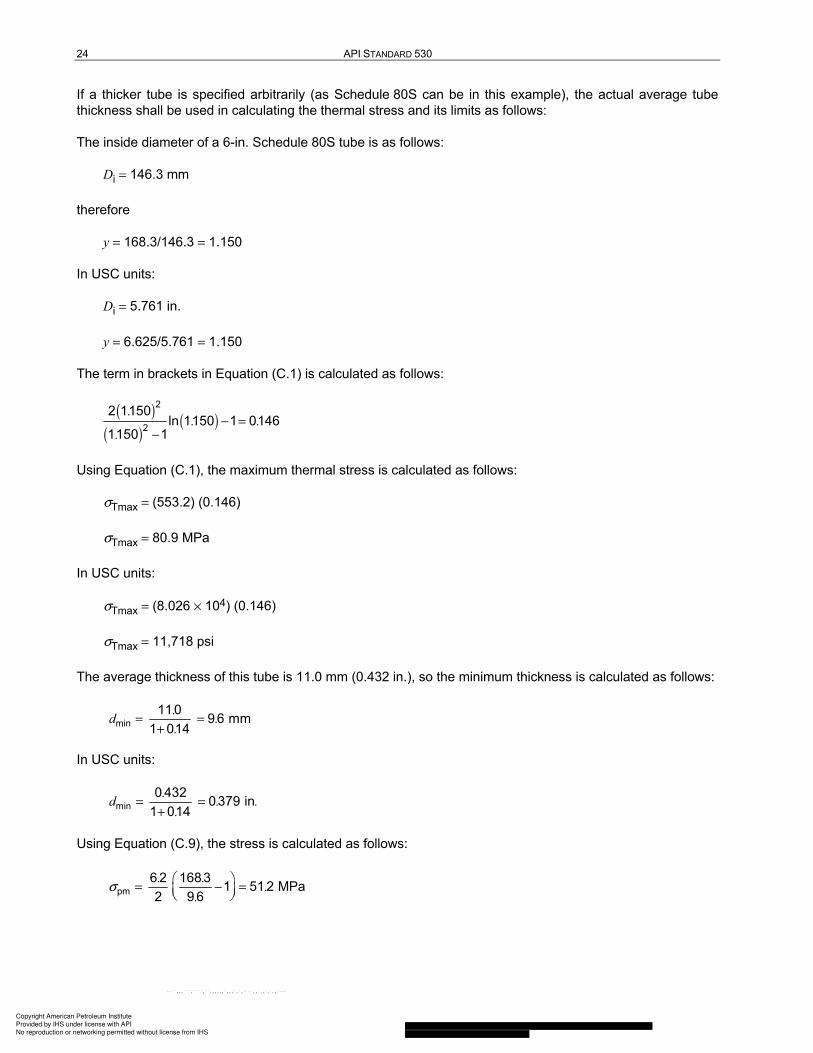
If a thicker tube is specified arbitrarily (as Schedule 80S can be in this example), the actual average tube thickness shall be used in calculating the thermal stress and its limits as follows:
The inside diameter of a 6-in. Schedule 80S tube is as follows:
Di = 146.3 mm
therefore
y = 168.3/146.3 = 1.150
In USC units:
Di = 5.761 in.
y = 6.625/5.761 = 1.150
The term in brackets in Equation (C.1) is calculated as follows:
( )
( )( )
2
2
2 1150ln 1150 1 0146
1150 1
.. .
.− =
−
Using Equation (C.1), the maximum thermal stress is calculated as follows:
σTmax = (553.2) (0.146)
σTmax = 80.9 MPa
In USC units:
σTmax = (8.026 × 10⁴) (0.146)
σTmax = 11,718 psi
The average thickness of this tube is 11.0 mm (0.432 in.), so the minimum thickness is calculated as follows:
min110 9 6 mm
1 014.
d ..
= =+
In USC units:
min0 432 0379 in
1 014.
d . ..
= =+
Using Equation (C.9), the stress is calculated as follows:
pm6 2 1683 1 51 2 MPa2 9 6. .
..
σ
= − =
Copyright American Petroleum Institute
Provided by IHS under license with API
No reproduction or networking permitted without license from IHS
CALCULATION OF HEATER-TUBE THICKNESS IN PETROLEUM REFINERIES 25
In USC units:
pm900 6 625 1 7416 psi
2 0379.
.σ
= − =
The thermal-stress limit based on the primary plus secondary stress intensity is calculated using Equation (C.14). Using the values above, this limit is calculated as follows:
σT,lim1 = (2.7 × 139) − (1.15 × 51.2)
σT,lim1 = 316.4 MPa
In USC units:
σT,lim1 = (2.7 × 20,000) − (1.15 × 7416)
σT,lim2 = 45,470 psi
The thermal-stress ratchet limit is calculated using Equation (C.19). In this case, the limit is as follows:
σT,lim2 = 4[(1.35 × 139) − 51.2]
σT,lim2 = 540.4 MPa
In USC units:
σT,lim2 = 4[(1.35 × 20,000) − 7416]
σT,lim2 = 78,340 psi
The thermal stress in the thicker tube is well below these limits.
7.3 Rupture Design with Constant Temperature
A modification of the example in 7.1 illustrates how the design equations are used for the creep-rupture range. Suppose the tube described in 7.1 is designed for the following conditions:
Td = 705 °C (1300 °F)
tDL = 100,000 hours
pr = 5.8 MPa gauge (840 psig)
From Figure E.49 (SI units) or Figure F.49 (USC units):
σr = 20.7 MPa (3000 psi)
Copyright American Petroleum Institute
Provided by IHS under license with API
No reproduction or networking permitted without license from IHS
From Figure E.50 (SI units) or Figure F.50 (USC units):
n = 3.5
With these values for B and n. use Figure 1 to obtain the following corrosion fraction:
fcorr = 0.53
Hence, using Equation (5):
In SI units:
δmin = 20.7 + (0.53 × 3.2)
δmin = 22.4 mm
In USC units:
δmin = 0.81 + (0.53 × 0.125)
δmin = 0.876 in.
To confirm that this is an appropriate design, the elastic design is checked using the elastic design pressure instead of the rupture design pressure. Using Equations (2) and (3) with the conditions given above:
In SI units:
σel = 117 MPa
Copyright American Petroleum Institute
Provided by IHS under license with API
No reproduction or networking permitted without license from IHS
7.4 Rupture Design with Linearly Changing Temperature
Suppose the tube described in 7.3 operates in a service for which the estimated tube metal temperature varies from 635 °C (1175 °F) at the start of run to 690 °C (1275 °F) at the end of run. Assume that the run lasts a year, during which the thickness changes by about 0.33 mm (0.013 in.).
Assume that the initial minimum thickness is 8.0 mm (0.315 in.); therefore, using Equation (1), the initial stress is as follows:
In SI units:
oo 1
2Dp
σδ
= −
o58 1683 1 581 MPa2 80. .
..
σ
= − =
In USC units:
o840 6 625 1 8413 psi
2 0315.
.σ
= − =
At the start-of-run temperature, n0 = 4.96. From Table 3, A is 3.74 × 10⁵ MPa (5.43 × 10⁷ psi). The parameters for the temperature fraction are, therefore, as follows:
In SI units:
o *osor
ln*T A
V nT
Δ
σ
=
oo
N nΔδ
δ
=
555 374 1 0 496 ln 2 64908 581
. V . .
.
× = =
0 33 4 96 0 28 0.
N . ..
= =
In USC units:
7100 5 43 1 0 496 ln 2 641635 8413
.V . .
× = =
0013 496 0 20315
.N . .
.
= =
Copyright American Petroleum Institute
Provided by IHS under license with API
No reproduction or networking permitted without license from IHS
CALCULATION OF HEATER-TUBE THICKNESS IN PETROLEUM REFINERIES 29
From Figure 2, fT = 0.62, and the equivalent temperature is calculated using Equation (6) as follows:
In SI units:
Teq = 635 + (0.62 × 55) = 669 °C
In USC units:
Teq = 1175 + (0.62 × 100) = 1237 °F
A temperature allowance of 15 °C (25 °F) is added to yield a design temperature of 684 °C (1262 °F), which is rounded up to 685 °C (1265 °F). Using this temperature to carry out the design procedure illustrated in 6.3 yields the following:
In SI units:
δσ = 9.9 mm
δmin = 9.9 + (0.572 × 3.2)
δmin = 11.7 mm
In USC units:
δσ = 0.388 in.
δmin = 0.388 + (0.572 × 0.125)
δmin = 0.460 in.
This thickness is different from the 8.0 mm (0.315 in.) thickness that was initially assumed. Using this thickness, the initial stress is calculated as follows:
In SI units:
o58 1 683 1 388 MPa2 117. .
..
σ
= − =
In USC units:
o840 6 625σ 1 5629 psi
2 0 460.
.
= − =
Copyright American Petroleum Institute
Provided by IHS under license with API
No reproduction or networking permitted without license from IHS
With this stress, the temperature-fraction parameters V and N become the following:
In SI units:
655 1 23 10 4 96 ln 311908 388
.V . .
.
× = =
0 334 96 01411 7
.N . .
.
= =
In USC units:
7100 5 43 1 0 496 ln 2 781635 5629
. V . .
× = =
0013496 0140 460
.N . .
.
= =
Using these values in Figure 2, ƒT = 0.62, the value that was determined in the first calculation. Since the temperature fraction did not change, further iteration is not necessary. This design calculation is summarized in the calculation sheet in Figure 6.
Copyright American Petroleum Institute
Provided by IHS under license with API
No reproduction or networking permitted without license from IHS
Figures E.1 to E.66 (in Annex E) and Figures F.1 to F.66 (in Annex F) have applications other than for the design of new tubes. They may also be used to help establish operating skin tube metal temperature (TMT) limits and answer rerating and retirement questions about operating tubes. This annex will first discuss how operating limits may be set that provide conservative upper bound on operating skin TMT. The second part of the annex will discuss how to estimate tube remaining life by determining an operating retirement wall thickness that may then be directly compared with measured thickness data. Finally, the third part of this annex will discuss in more detail how to estimate lifetime creep damage, including the considerations made in Annex G.
This annex describes how tube damage and remaining life may be estimated. This assessment of inspection data is collected in accordance with API 573 [10] and API 570 [11] and, assuming the normal or worst case conditions, may be used to quickly assess the fitness for service of individual tubes. It is recommended that tubes, return bends, or coil sections that fail the fitness for service assessment be further evaluated by performing a rigorous Level 1 or 2 assessment of metal loss and/or creep damage following the standard provided in Parts 4, 5, and 10 of API 579-1/ASME FFS-1 [12]. Tubes that pass this evaluation approach should also pass the rigorous API 579-1 assessment.
A.2 Establishment of Operating Skin TMT Limits
Once the fired heater is put into service, the design criteria may or may not apply to the actual operating conditions. However, the capability of the heater is limited by the design conditions. As discussed in API 584 [13], it is essential to define, monitor, and maintain Integrity Operating Windows (IOWs) as a vital component of mechanical equipment integrity. The essence of this section is to provide a process to establish IOW limits for fired heater tubes that will ensure the long-term reliability and short-term safe operation of the fired heater.
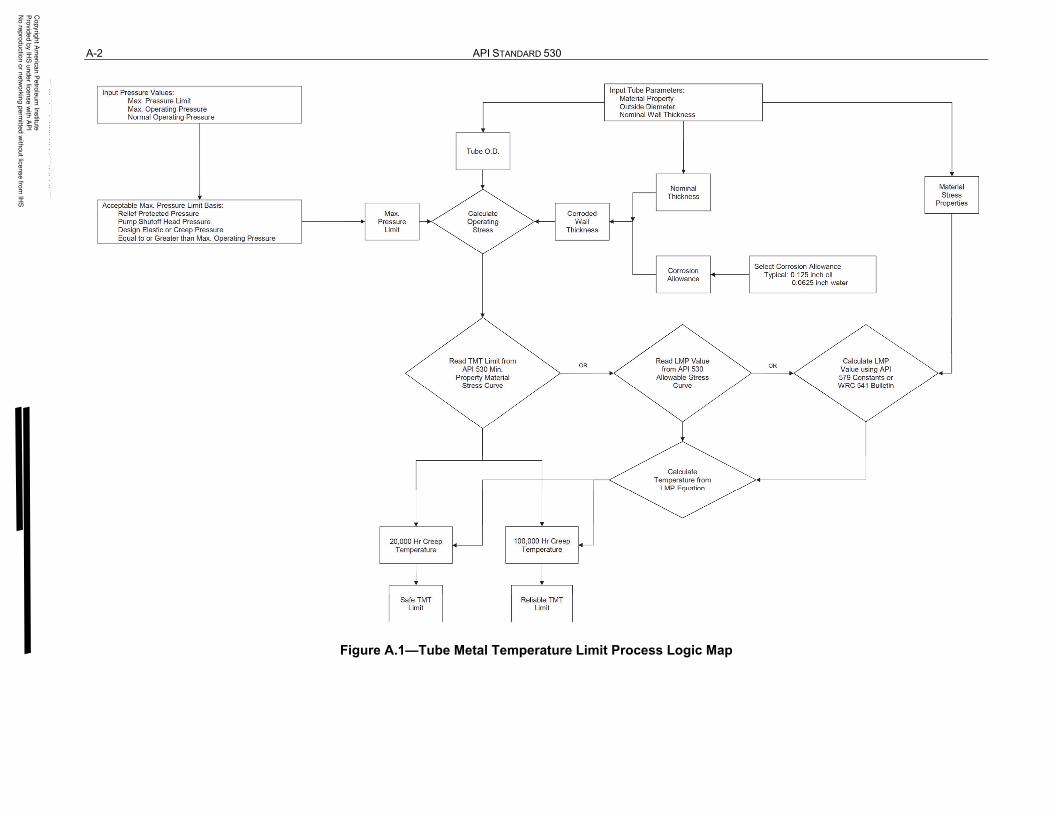
The following process may be used to set TMT operating limits. The operating stress based on the maximum pressure limit and the design corroded thickness is calculated using the standard equations for hoop stress. Using the material’s creep properties and the calculated stress, the long-term and short-term TMT operating limit is selected. The recommended procedure is shown in the process logic diagram, Figure A.1, appearing on the next page.
The key point is establishing the IOWs and ensuring that the responsible parties understand the basis and are prepared to act if the limit is reached. For most heaters, these limits will not normally be reached without a change in operating conditions, e.g. internal fouling. The limits may be conservatively determined by selecting worst case conditions or less so, but still effective, by applying local knowledge of the operating process.
For fired heaters that routinely operate in the creep regime the selection of the creep material strength is an important consideration. It should be appropriate for these heaters to use the average creep material strength to provide sufficient operating margin between the normal condition and the limit. It may also be necessary to divide the heater into operating zones, e.g. high, medium, and low pressure, to provide further clarity to the operating limit.
Copyright American Petroleum Institute
Provided by IHS under license with API
No reproduction or networking permitted without license from IHS
CALCULATION OF HEATER-TUBE THICKNESS IN PETROLEUM REFINERIES A-3
A.3 Estimation of Retirement Thickness and Remaining Life
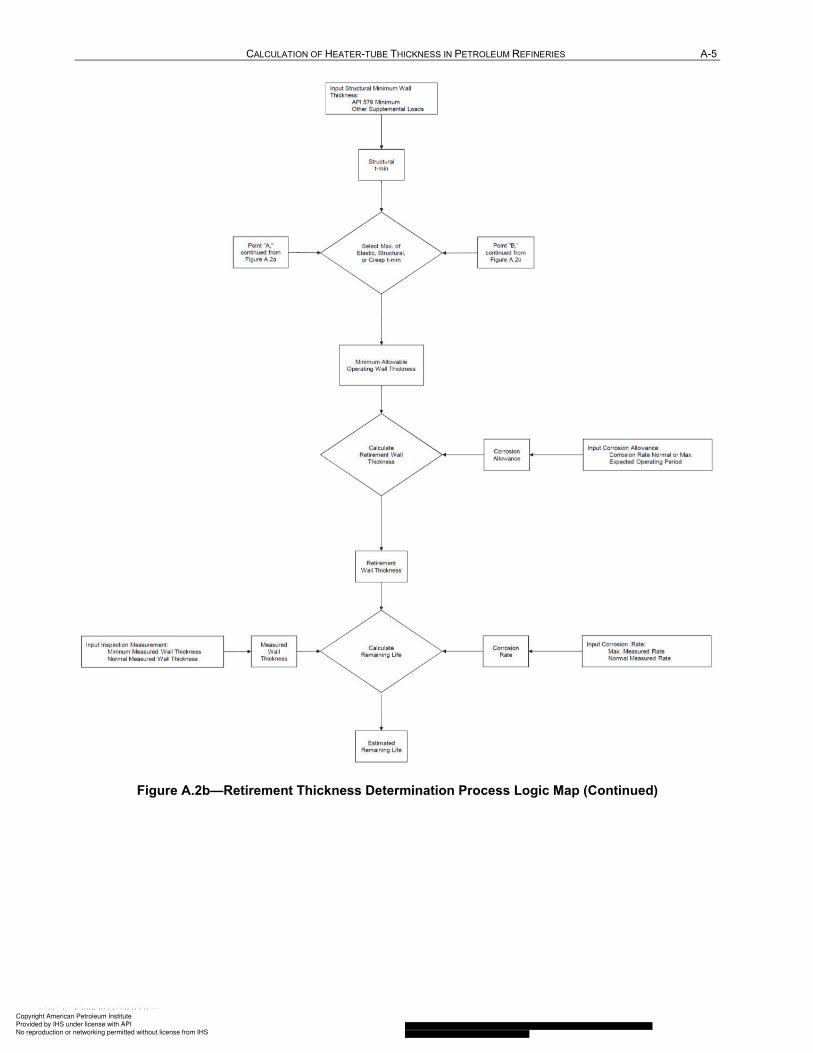
A fitness-for-service assessment for metal loss and creep damage should be performed utilizing the allowable stress properties provided in this standard. The essence of this assessment procedure may be outlined as follows. The allowable (or required) minimum wall thickness (δmin) to handle the existing operating conditions is calculated using the standard equations for hoop stress. Based on expected operating time to the next inspection and measured damage rate, the allowable minimum wall thickness is increased to account for future metal loss, resulting in an estimate of retirement thickness. Finally, the remaining life, i.e. time to reach allowable minimum wall thickness, should be estimated based on the minimum measured wall thickness and measured damage rate. The assessment procedure is shown in the process logic diagram, Figures A.2a to A.2c, appearing on the next three pages.
As shown in Table A.1, a retirement wall thickness for a 40,000-hour (approximately five-year) run for the convection and radiant coils has been calculated. This approach is used to quickly assess the fitness for service of individual tubes in each coil section. The results of the assessment are reported as either pass or fail. Each tube is evaluated for fitness for service by comparing the minimum measured wall thickness (δmm) to the retirement wall thickness (δretire). The pass determination is based on satisfying the following criterion for minimum measured wall thickness:
δmm > δretire = δmin + FCA (A.1)
Satisfying this criterion indicates that the tube is fit for service based on the observed damaged and provided heater specifications, operating conditions and scheduled turnaround time. The assumption being made is that future operating conditions will be consistent with the past conditions and future damage is adequately captured in the future corrosion allowance (FCA). The time to reach the minimum allowable wall thickness may be estimated as follows:
Remaining life = (δmm – δmin)/corrosion damage rate (A.2)
Note this assessment is based on heaters that have not operated in the creep regime, i.e. no existing creep damage. If creep damage (as indicated by measured strain damage) has been observed, further fitness for service assessment should be done. The extent of creep damage may be estimated as described in the next section of this annex.
The input conditions for this approach are broken into two basic operating regimes: normal average operation and normal maximum operation. “Normal” term refers to operation that follows defined best practice or typical practices. Transient, or other nontypical, events are not captured in the assessment, since these events are obviously not normal practice, not planned and impossible to predict. Note for this reason design maximum parameters are not used in the assessment, only actual maximum operations are considered relevant to the assessment. If a significant event does occur, such as hot-spot on an individual tube, the event would need to be accounted for, in a reassessment, to capture the impact on the individual tube’s remaining life.
In determining the allowable minimum wall thickness, possible combinations of (long-term and short-term) temperature and pressure should be defined and evaluated. For the most conservative assessment, the maximum operating conditions could be used, i.e. maximum pressure and tube metal temperature, to determine the elastic and creep allowable minimum wall thickness. For the least conservative assessment, the normal operating conditions could be used, i.e. normal pressure and tube metal temperature. For a moderately conservative assessment, the normal operating pressure and maximum tube metal temperature could be used for creep assessment and the maximum operating pressure and normal tube metal temperature could be used for elastic assessment.
For example, the most conservative assessment, i.e. maximum pressure and tube metal temperature, is used for Figure A.2 in determining allowable minimum wall thickness. A blank calculation sheet may be found in Annex D.
Copyright American Petroleum Institute
Provided by IHS under license with API
No reproduction or networking permitted without license from IHS
CALCULATION OF HEATER-TUBE THICKNESS IN PETROLEUM REFINERIES A-7
Table A.1—Retirement Wall Thickness
Parameter Convection Radiant Unit Reference
Pressure, P Normal 1.83 (265) 1.83 (265) MPa.g (psig) Maximum 2.41 (350) 2.41 (350) MPa.g (psig) Tube metal temperature, TMT Normal 303 (578) 414 (778) °C (°F) Maximum 370 (698) 482 (900) °C (°F) Operating plan Time to next inspection 40,000 40,000 hours Time to tube retirement Unknown Unknown hours Future corrosion allowance, FCA 1.02 (0.040) 1.07 (0.042) mm (inch) Allowance for supplemental load(s) None None mm (inch) Tube parameters Outside diameter, D 127 (5.000) 127 (5.000) mm (inch) Nominal wall thickness, δnom 9.52 (0.375) 9.52 (0.375) mm (inch)
Material specification Medium
carbon steel Medium
carbon steel —
Creep material strength property Minimum Minimum — Creep life fraction consumed None None — Allowable stress, S Elastic 109.0 (15,805) 89.4 (12,969) MPa (psi) API 530 Creep 109.0 (15,805) 55.6 (8,065) MPa (psi) API 530 Minimum required thickness, δmin Value 2.54 (0.100) 2.69 (0.106) mm (inch) API 579 Basis Structural Creep — API 579 Retirement wall thickness, δretire 3.56 (0.140) 3.76 (0.148) mm (inch) Equation (1) Minimum measured thickness, δmm 8.13 (0.320) 8.18 (0.322) mm (inch) Remaining life >20 >20 years Equation (2)
A.4 Estimation of Accumulated Creep Damage
A.4.1 General
The information presented in this section and considerations made in Annex G may be used to estimate life-time creep damage for heaters operating in the creep regime. Because of the uncertainties involved in these calculations, decisions about tube retirement should not be based solely on the results of these calculations. Other factors such as tube thickness or diameter-strain measurements should be primary considerations in decisions about tube retirement.
The essence of this calculation procedure may be outlined as follows. The operating history is divided into periods of time during which the pressure, metal temperature, and corrosion rate are assumed constant. For each of these periods, the life fraction used up is calculated. The sum of these calculated life fractions is the total accumulated tube damage. The fraction remaining is calculated by subtracting this sum from unity. Finally, the remaining life fraction is transformed into an estimate of the expected life at specified operating conditions.
There are three primary areas of uncertainty in these calculations. First, it is necessary to estimate the accumulated tube damage (the life fraction used up) based on the operating history, i.e. the influence from the operating pressure, the tube-metal temperature, and the corrosion rate, of the tube. The uncertainties in these factors, particularly the temperature, may have a significant effect on the estimate. Second, knowledge of the actual rupture strength of a given tube is not precise. The example calculation in A.4 demonstrates the effects of this uncertainty. Finally, it is necessary to consider the tube-damage rule as described in G.2.
Copyright American Petroleum Institute
Provided by IHS under license with API
No reproduction or networking permitted without license from IHS
However, as mentioned in G.2, the limitations of this hypothesis are not well understood. In spite of all these uncertainties, the estimation that is made using the procedure described in this annex may provide information that assists in making decisions about tube rerating and retirement.
A more detailed life-assessment evaluation for heater tubes operating in the creep-rupture range may be found in API 579.
Since the concepts required to estimate damage are developed elsewhere in this standard, they are not repeated here. The calculation procedure may be explained by working through an example. For this example, the following conditions are assumed:
It is also assumed that the operating history of the tube may be approximated as shown in Table A.2. (The SI conversions are approximate.)
It is not necessary that the operating periods be of uniform length. In an actual heater, neither the operating pressure nor the metal temperature is uniform. Nonetheless, for this calculation, they are assumed to be uniform during each period. The values chosen for each period should represent typical values. The choice of the length of the operating period depends on the extent of the variation of the pressure and temperature.
It is necessary to approximate the operating history for the tube thickness. This history may usually be developed from thickness measurements made before the initial start-up and during routine heater-tube inspections. For all of these estimates, it is assumed that the outside diameter remains constant.
a “a” is the international unit symbol for “year.”
This information may be used to calculate the life fractions shown in Table A.3.
For tubes undergoing corrosion, an equation similar to Equation (G.17) may be developed for the life fraction; however, this is not necessary since sufficient accuracy may be achieved for this calculation by using the average stress for each period (i.e. the average of the stress at the beginning and at the end of the operating period).
The minimum and average Larson-Miller values in Table A.3 are determined from the average stress using the Larson-Miller Parameter curves for minimum and average rupture strength in Figures E.3 to E.66 (SI units) or Figures F.3 to F.66 (USC units). For this example, Figure F.39 was used.
Copyright American Petroleum Institute
Provided by IHS under license with API
No reproduction or networking permitted without license from IHS
CALCULATION OF HEATER-TUBE THICKNESS IN PETROLEUM REFINERIES A-9
With these Larson-Miller values and the metal temperature for each period, the expression for the Larson-Miller Parameter was solved for the rupture time. These expressions are shown in Equations (H.2) (in USC units) and (H.3) (in SI units). Since this expression gives the rupture time in hours, the value needs converting to years. The resulting times based on the minimum rupture strength and the average rupture strength are shown in Table A.3.
The following example illustrates how to calculate the minimum-strength rupture time, tDL, for the first operating period from the equations for δσ,AVE, the average stress thickness, and σr, the rupture allowable stress. The equations to be solved are as follows:
In SI units:
σ AVE681 6 40 6 605 mm
2,
. ..δ
+= =
In USC units:
σ AVE0 268 0 252 0 260 in
2,
. .. .δ
+= =
In SI units:
r or r
AVE
1 1 3 96 1 68 3σ 3 96 48 47 MPa2 2 6 605,
p D . .p . .
.σδ
× = − = − =
In USC units:
r or r
AVE
1 1 575 6 625σ 575 7038 psi2 2 0 260,
p D .p
.σδ
× = − = − =
At 48.47 MPa, using the minimum rupture strength, the Larson-Miller Parameter, CLM, equals 20.53 in SI units.
At 7038 psi, using the minimum rupture strength, the Larson-Miller Parameter, CLM, equals 36.95 in USC units.
To determine the rupture time using minimum strength, in USC units:
CLM = (Td + 460) (16.76 + lg tDL) × 10−3
Therefore:
36.95 = (1200 + 460) (16.76 + lg tDL) × 10−3
lg tDL = 5.5
tDL = 316,225 hours
tDL = 36.1 years
Copyright American Petroleum Institute
Provided by IHS under license with API
No reproduction or networking permitted without license from IHS
To determine the rupture time using average strength, in USC units:
CLM = (Td + 460) (16.31 + lg tDL) × 10−3
Therefore:
36.95 = (1200 + 460) (16.31 + lg tDL) × 10−3
lg tDL = 5.95
tDL = 891,250 hours
tDL = 101.7 years
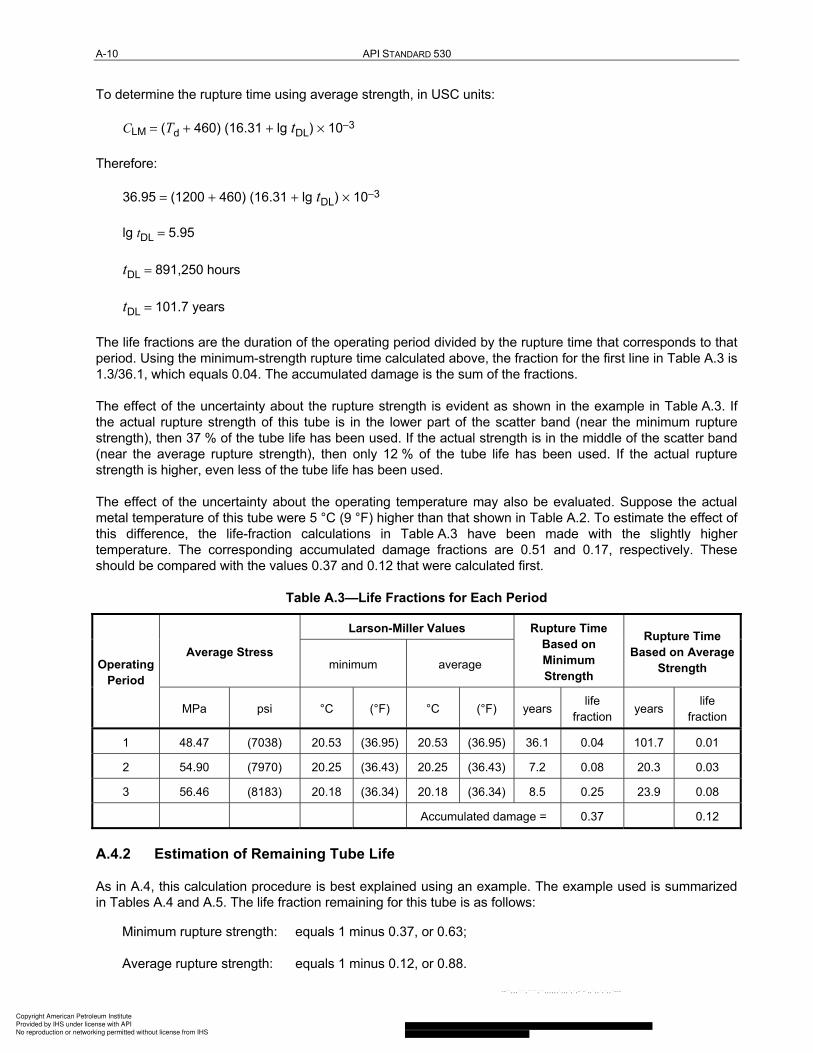
The life fractions are the duration of the operating period divided by the rupture time that corresponds to that period. Using the minimum-strength rupture time calculated above, the fraction for the first line in Table A.3 is 1.3/36.1, which equals 0.04. The accumulated damage is the sum of the fractions.
The effect of the uncertainty about the rupture strength is evident as shown in the example in Table A.3. If the actual rupture strength of this tube is in the lower part of the scatter band (near the minimum rupture strength), then 37 % of the tube life has been used. If the actual strength is in the middle of the scatter band (near the average rupture strength), then only 12 % of the tube life has been used. If the actual rupture strength is higher, even less of the tube life has been used.
The effect of the uncertainty about the operating temperature may also be evaluated. Suppose the actual metal temperature of this tube were 5 °C (9 °F) higher than that shown in Table A.2. To estimate the effect of this difference, the life-fraction calculations in Table A.3 have been made with the slightly higher temperature. The corresponding accumulated damage fractions are 0.51 and 0.17, respectively. These should be compared with the values 0.37 and 0.12 that were calculated first.
As in A.4, this calculation procedure is best explained using an example. The example used is summarized in Tables A.4 and A.5. The life fraction remaining for this tube is as follows:
Minimum rupture strength: equals 1 minus 0.37, or 0.63;
Average rupture strength: equals 1 minus 0.12, or 0.88.
Copyright American Petroleum Institute
Provided by IHS under license with API
No reproduction or networking permitted without license from IHS
CALCULATION OF HEATER-TUBE THICKNESS IN PETROLEUM REFINERIES A-11
These fractions should be converted to the expected life under the specified operating conditions.
The following related questions may be asked at this point.
a) What is the estimated life at a given operating pressure, metal temperature, and corrosion rate?
b) For a specified operating pressure and corrosion rate, what temperature limit should be imposed for the tube to last a minimum period of time?
c) How much should the operating pressure or metal temperature be reduced to extend the expected life by a given percentage?
Not all of these questions are answered in this annex, but the method used to develop the answers should be clear from the following example.
For this example, the expected operating conditions are as follows:
Operating gauge pressure: 4.27 MPa (620 psi);
Metal temperature: 660 °C (1220 °F);
Corrosion rate: 0.33 mm/year (0.013 in./year).
From these values, a table of future-life fractions may be developed as shown in Table A.4 for the minimum rupture strength and in Table A.5 for the average rupture strength. As before, the average stress is the average of the stresses at the beginning and end of each operating period.
Since the tube in the example is undergoing corrosion, the life estimation should be calculated in steps. For this example, a 1-year step was used. As may be seen from the two tables, the estimated life of this tube is less than 1.2 years (for minimum rupture strength) and less than 3 years (for average rupture strength). If the rupture strength were in the upper part of the scatter band (above the average rupture strength), the estimated life would be even longer.
For tubes that are not undergoing corrosion, estimating the life is easier. The rupture life is calculated, as above, from the anticipated stress and temperature. The estimated remaining life is the fraction remaining multiplied by the rupture life. In these cases, tables such as Tables A.4 and A.5 are not required.
The example given above describes a way to answer Question a), posed at the beginning of this subsection: What is the estimated life for a specified set of operating conditions? Question b), concerning the temperature limit that should be imposed for a specified pressure, corrosion rate, and minimum life, may be answered as follows. The pressure and corrosion rate may be used to calculate an average stress from which a Larson-Miller value may be found using the curves in Figures E.3 through E.66 and F.3 through F.66. With this value and a rupture life calculated by dividing the required life by the remaining life fraction, the Larson-Miller Parameter equation may be solved for the maximum temperature. The other questions may be answered in similar ways.
Table A.4—Future Life Fractions, Minimum Rupture Strength
Time Minimum Thickness Average Stress Minimum Larson-
Calculation of Maximum Radiant Section Tube Skin Temperature
B.1 General
This annex provides a procedure for calculating the maximum radiant section tube metal (skin) temperature. Correlations for estimating the fluid-film heat-transfer coefficient are given in B.2. A method for estimating the maximum local heat flux is given in B.3. The equations used to calculate the maximum tube skin temperature and the temperature distribution through the tube wall are described in B.4. The sample calculation in B.5 demonstrates the use of these equations.
The maximum tube metal temperature (TMT) might or might not be located towards the process outlet of a fired heater. Factors including inside film coefficient, radiant heat flux, heater/tube geometry, internal fouling, and fluid flow regime all influence the maximum TMT calculation. In some cases, such as with vacuum heaters, a tube-by-tube analysis from the fluid outlet to before the initial boiling point (IBP) should be performed.
B.2 Heat-transfer Coefficient
A value necessary for calculating the maximum tube metal temperature is the fluid heat-transfer coefficient at the inside wall of the tube. Although the following correlations are extensively used and accepted in heater design, they have inherent inaccuracies associated with all simplified correlations that are used to describe complex relationships.
For single-phase fluids, the heat-transfer coefficient is calculated by one of the two equations below, where Re is the Reynolds number and Pr is the Prandtl number. No correlation is included for the heat-transfer coefficient in laminar flow, since this flow regime is rare in process heaters. There is inadequate information for reliably determining the inside coefficient in laminar flow for oil in tube sizes that are normally used in process heaters.
The heat-transfer coefficient, Kl, expressed in W/(m2⋅K) [Btu/(h⋅ft2⋅°F)], for the liquid flow with Re > 10,000 is calculated using Equation (B.1) from Reference [14]:
014f,Tbf Tb 0 8 033
li f,Tw
0023 Re Pr.
, . .K .D
µλ
µ
=
(B.1)
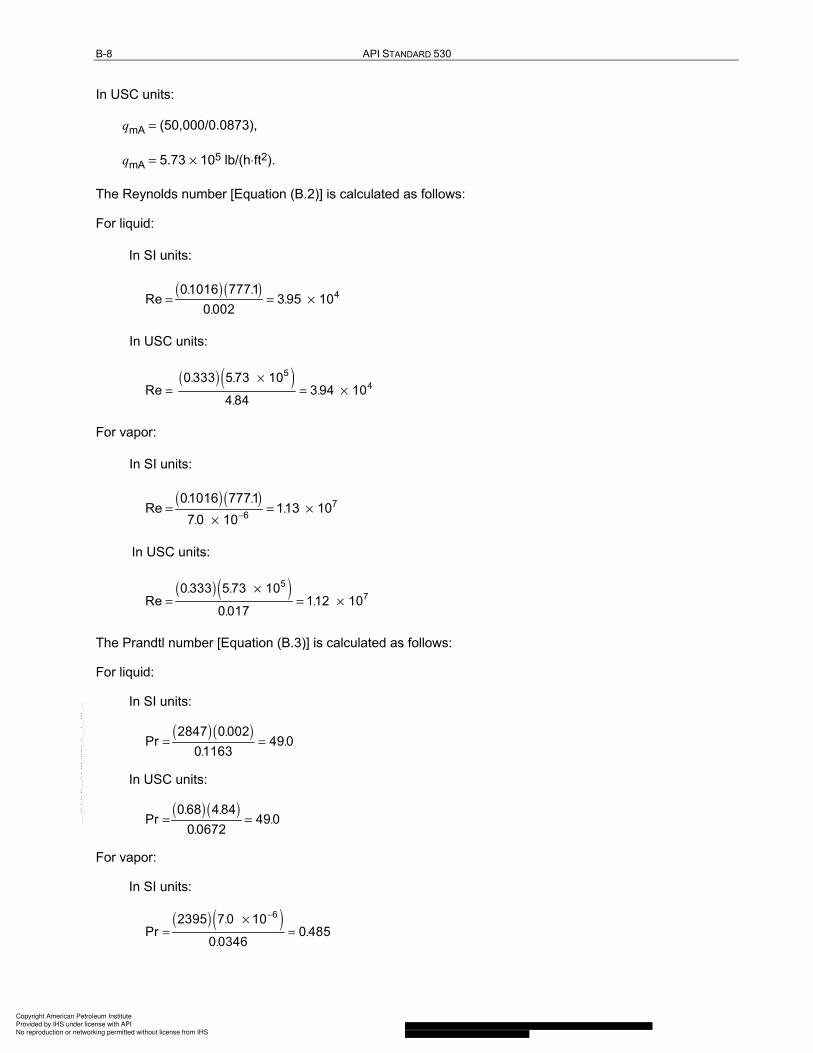
where
i mA
f,TbRe
D q
µ= (B.2)
p f,Tb
f,TbPr
c µ
λ= (B.3)
qmA is the mass flow rate, in kg/(m2⋅s) [lb/(ft2⋅h)], of the fluid;
cp is the specific heat capacity, in J/(kg⋅K) [Btu/(lb⋅°R)], of the fluid at bulk temperature;
Copyright American Petroleum Institute
Provided by IHS under license with API
No reproduction or networking permitted without license from IHS
λ f,Tb is the thermal conductivity, expressed in W/(m⋅K) [Btu/(h⋅ft⋅°F)], of the fluid at bulk temperature;
Di is the inside diameter, expressed in meters (feet), of the tube;
µ f,Tb is the absolute viscosity, in Pa⋅s [lb/(ft⋅h)], of the fluid at bulk temperature;
µ f,Tw is the absolute viscosity, in Pa⋅s [lb/(ft⋅h)], of the fluid at wall temperature.
The heat-transfer coefficient, Kv, expressed in W/(m2⋅K) [Btu/(h⋅ft2⋅°F)], for the vapor flow with Re > 15,000 is calculated using Equation (B.4) from Reference [15]:
0 5f Tb 0 8 0 4 b
vi w
0 021 Re Pr.
, . . TK .
D T
λ =
(B.4)
where
Tb is the absolute bulk temperature, expressed in Kelvin (degrees Rankine), of the vapor;
Tw is the absolute wall temperature, expressed in Kelvin (degrees Rankine), of the vapor.
All of the material properties except µ f,Tw are evaluated at the bulk fluid temperature. To convert absolute viscosity in millipascal-seconds or centipoise to pounds per foot per hour, multiply µ f,Tw by 2.42.
For two-phase flows, the heat-transfer coefficient may be approximated using Equation (B.5):
K2p = Klwl + Kvwv (B.5)
where
K2p is the heat-transfer coefficient, expressed in W/(m2⋅K) [Btu/(h⋅ft2⋅°F)], for two phases;
wl is the mass fraction of the liquid;
wv is the mass fraction of the vapor.
The liquid and vapor heat-transfer coefficients, Kl and Kv, should be calculated using the mixed-phase mass flow rate and using the liquid and the vapor material properties, respectively.
NOTE In two-phase flow applications where dispersed-flow or mist-flow regimes occur due to entrainment of tiny liquid droplets in the vapor (e.g. towards the outlet of vacuum heaters), the heat-transfer coefficient may be calculated using the correlation for the vapor phase using Equation (B.4), based on the total flow rate, rather than being approximated by Equation (B.5). In vertical tube two-phase flow applications where annular flow regimes occur upflow and downflow have been noted as having different heat transfer coefficients. The downflow coefficient tends to be lower than upflow. Many default calculations methods are good at predicting upflow coefficients.
B.3 Maximum Local Heat Flux
The average heat flux in the radiant section of a heater (or in a zone of the radiant section) is equal to the duty in the section or zone divided by the total outside surface area of the coil in the section or zone. The maximum local heat flux at any point in the coil may be estimated from the average heat flux. The maximum local heat flux is used with the equations in B.4 to calculate the maximum tube metal temperature.
Copyright American Petroleum Institute
Provided by IHS under license with API
No reproduction or networking permitted without license from IHS
CALCULATION OF HEATER-TUBE THICKNESS IN PETROLEUM REFINERIES B-3
Local heat fluxes vary considerably throughout a heater because of nonuniformities around and along each tube. Circumferential variations result from variations in the radiant heat flux produced by shadings of other tubes or from the placement of the tubes next to a wall. Conduction around the tubes and convection flows of flue gases tend to reduce the circumferential variations in the heat flux. The longitudinal variations result from the proximity to burners and variations in the radiant firebox and the bulk fluid temperatures. In addition to variations in the radiant section, the tubes in the shock section of a heater may have a high convective heat flux.
The maximum radiant heat flux, qR,max, expressed in W/m2 [Btu/(h⋅ft2)], for the outside surface at any point in a coil may be estimated from Equation (B.6):
qR,max = Fcir FLFTqR,ave + qconv (B.6)
where
Fcir is the factor accounting for circumferential heat flux variations;
FL is the factor accounting for longitudinal heat flux variations;
FT is the factor accounting for the effect of tube metal temperature on the radiant heat flux;
qR,ave is the average radiant heat flux, in W/m2 [Btu/(h⋅ft2)], for the outside surface;
qconv is the average convective heat flux, in W/m2 [Btu/(h⋅ft2)], for the outside surface.
The circumferential variation factor, Fcir, is given as a function of tube spacing and coil geometry in Figure B.1. The factor given by this figure is the ratio of the maximum local heat flux at the fully exposed face of a tube to the average heat flux around the tube. This figure was developed from considerations of radiant heat transfer only. As mentioned above, influences such as conduction around the tube and flue-gas convection act to reduce this factor. Since these influences are not included in this calculation, the calculated value is somewhat higher than the actual maximum heat flux.
The longitudinal variation factor, FL is used to account for the variation in heat flux along the flame path, from the burner to the firebox exit. The longitudinal variation factor, is not easy to quantify. Values between 1.0 and 1.5 are most often used. In a firebox that has a very uniform distribution of heat flux, a value of 1.0 may be appropriate. Depending on firebox and flame aspect ratios, this factor may be higher than 1.5 at the peak heat flux elevation (typically 2/3 of flame length) and as low as 0.7 at the floor and 0.5 at the roof. For new or existing heaters, this factor may be estimated with CFD modeling methods that have been field checked for burner type, fuels and heater configuration. In existing heaters, infrared measurement of tubes or tube supports along the flame path may be used to estimate the heat flux profile.
The tube metal temperature factor, FT, is less than 1.0 near the coil outlet or in areas of maximum tube metal temperature. It is greater than 1.0 in areas of lower tube metal temperatures. For most applications, the factor may be approximated as given in Equation (B.7):
4 4g ave tm
T 4 4g ave tm ave
* * ,
* * , ,
T TF
T T
−=
− (B.7)
where
is the average flue-gas temperature, expressed in Kelvin (degrees Rankine), in the radiant
section; g,aveT ∗
Copyright American Petroleum Institute
Provided by IHS under license with API
No reproduction or networking permitted without license from IHS
is the tube metal temperature, expressed in Kelvin (degrees Rankine), at the point under consideration;
is the average tube metal temperature, expressed in Kelvin (degrees Rankine), in the radiant section.
The convective heat flux in most parts of a radiant section is usually small compared with the radiant heat flux. In the shock section, however, the convective heat flux may be significant; it should therefore be added to the radiant heat flux when the maximum heat flux in the shock section is estimated. Note that frequently the location of maximum convective heat flux does not coincide with maximum radiant heat flux.
B.4 Maximum Tube Metal Temperature
In addition to the heat-transfer coefficient and the maximum heat flux, the temperature profile of the fluid in the coil is necessary for calculating the maximum tube metal temperature in the radiant section of the heater. This profile, which is often calculated by the heater supplier, defines the variation of the bulk fluid temperature through the heater coil. For operation at or near design, the design profile may be used. For operation significantly different from design, a bulk temperature profilemay be developed.
Once the bulk fluid temperature is known at any point in the coil, the maximum tube metal temperature, Tmax, expressed in degrees Celsius (Fahrenheit), can be calculated from Equations (B.8) to (B.12):
max bf ff f twT T T T TΔ Δ Δ= + + + (B.8) where
Tbf is the bulk fluid temperature, expressed in degrees Celsius (Fahrenheit);
ΔTf is the temperature difference across any internal fouling, expressed in degrees Celsius (Fahrenheit);
ΔTf f is the temperature difference across the fluid film, expressed in degrees Celsius (Fahrenheit);
ΔTtw is the temperature difference across the tube wall, expressed in degrees Celsius (Fahrenheit).
R,max off
ff i
q DT
K DΔ
=
(B.9)
where
Kf f is the fluid-film heat-transfer coefficient, expressed in W/(m2) [Btu/(h⋅ft2)];
qR,max is the maximum radiant heat flux, expressed in W/m2 [Btu/h⋅ft2], for the outside surface;
Do is the outside diameter, expressed in meters (feet), of the tube;
Di is the inside diameter, expressed in meters (feet), of the tube.
of R,max f
i f
DT q R
DΔ
δ
= −
(B.10)
tmT ∗
tm,aveT ∗
Copyright American Petroleum Institute
Provided by IHS under license with API
No reproduction or networking permitted without license from IHS
CALCULATION OF HEATER-TUBE THICKNESS IN PETROLEUM REFINERIES B-5
where
δ f is the coke and/or scale thickness, expressed in meters (feet);
Rf is the fouling factor inside the tube due to the presence of any internal fouling, coke or scale, expressed in m2⋅K/W (h⋅ft2 ºF/Btu).
oo
itw R,max
tm
ln
2
DD
DT qΔ
λ
=
(B.11)
where
λ tm is the thermal conductivity, expressed in W/(m⋅K) [Btu/(h⋅ft⋅°F)], of the tube metal.
The effect of internal fouling on the tube metal temperature can be calculated if a fouling factor rather than coke thickness has been provided on the fired heater datasheets (see API 560). The fouling factor, Rf, may also be expressed as a function of coke or scale thickness and thermal conductivity, as given in Equation (B.12), if only coke or scale thickness is provided:
ff
fR
δ
λ= (B.12)
where
δ f is the coke and/or scale thickness, expressed in meters (feet);
λ f is the thermal conductivity of coke or scale, expressed in W/(m2⋅K) [Btu/h⋅ft⋅°F].
If a thickness for a layer of coke or scale is specified, the effective inside diameter of the tube is adjusted as noted in Equation (B.10). The effects of internal fouling, coke or scale on tube metal temperature can be calculated using Equations (B.8) and (B.10).
Equation (B.13) should be used to calculate the maximum fluid-film temperature coincident with maximum radiant heat flux, Tfm, expressed in degrees Celsius (Fahrenheit).
fm bf ffT T TΔ= + (B.13)
In the absence of thermal conductivity data provided by the Purchaser, the following range of values may be used. Petroleum coke: 4.91 W/m⋅K to 5.89 W/m⋅K (2.8 Btu/h⋅ft⋅°F to 3.4 Btu/h⋅ft⋅°F) and iron oxide scale: 0.87 W/m⋅K to 1.05 W/m⋅K (0.5 Btu/h⋅ft⋅°F to 0.6 Btu/h⋅ft⋅°F).
The thermal conductivity of the tube material, λ tm, used in Equation (B.11), should be evaluated at the average tube wall temperature.
See Figure B.1 depicting the ratio of maximum local to average heat flux based on centerline nominal tube spacing and tube diameter.
Copyright American Petroleum Institute
Provided by IHS under license with API
No reproduction or networking permitted without license from IHS
CALCULATION OF HEATER-TUBE THICKNESS IN PETROLEUM REFINERIES B-7
B.5 Sample Calculation
The following sample calculation demonstrates how to use the equations given in B.2 to B.4.
NOTE Differences in results between calculations in SI and USC units for dimensionless numbers are due to the significant figures used in the dimension conversions.
In the heater under consideration, the medium-carbon-steel tubes are in a single row against the wall. Other aspects of the heater configuration are as follows:
Tube spacing is 203.2 mm (= 0.667 ft = 8.0 in.).
Do = 114.3 mm (= 0.375 ft = 4.5 in.);
δ t,ave = 6.4 mm (= 0.020 8 ft = 0.25 in.);
Di = 101.6 mm (= 0.333 ft = 4.0 in.);
δ f = 0 mm (0 in);
λ tm = 42.2 W/(m⋅K) [24.4 Btu/(h⋅ft⋅°F)] at an assumed tube metal temperature of 380 °C (720 °F).
The flow in the tubes is two-phase with 10 % mass vapor. Other operating conditions are as follows:
Flow rate (total liquid plus vapor) is 6.3 kg/s (50,000 lb/h).
Tb = 271 °C (520 °F);
qR,ave = 31,546 W/m2 [10,000 Btu/(h⋅ft2)].
The properties of the liquid at the bulk temperature are as follows:
µ f,T b = 2.0 × 10⁻³ Pa⋅s [4.84 lb/(h⋅ft)];
λ f, Tb = 0.1163 W/(m⋅K) [0.0672 Btu/(h⋅ft⋅°F)];
cp,f = 2.847 J/(kg⋅K) [0.68 Btu/(lb⋅°F)].
The properties of the vapor at the bulk temperature are as follows:
µv,Tb = 7.0 × 10⁻⁶ Pa⋅s [0.017 lb/(ft⋅h)];
λv,Tb = 0.0346 W/(m⋅K) [0.020 Btu/(h⋅ft⋅°F)];
cp,v = 2.394 J/(kg⋅K) [0.572 Btu/(lb⋅°F)].
From the inside diameter, the flow area is equal to 8.107 × 10⁻³ m2 (0.0873 ft2). Using the total flow rate:
qmA = 6.3/(8.107 × 10−3),
qmA = 777.1 kg/(m2⋅s).
Copyright American Petroleum Institute
Provided by IHS under license with API
No reproduction or networking permitted without license from IHS
The two-phase heat-transfer coefficient can then be calculated using Equation (B.5):
In SI units:
K2p = (0.90)Kl + (0.10)Kv
= (0.90)(497) + (0.10)(2126)
= 659.9 W/(m2⋅K)
In USC units:
K2p = (0.90)(87.5) + (0.10)(375)
= 116.3 Btu/(h⋅ft2 °F)
The ratio of tube spacing to tube diameter is as follows:
In SI units:
203.2=1.78
114.3
In USC units:
8.0=1.78
4.5
From Figure B.1, Fcir = 1.91. Assume that for this heater, FL = 1.1, FT = 1.0, and qconv = 0 (i.e., there is no convective heat flux at this point). Using Equation (B.6):
In SI units:
qR,max = (1.91)(1.1)(1.0)(31,546)
= 66,278 W/m2
In USC units:
qR,max = (1.91)(1.1)(1.0)(10,000)
= 21,010 Btu/(h⋅ft2)
The temperature difference through each part of the system can now be calculated from Equation (B.9) for the fluid film:
In SI units:
ff66 278 114 3 113 K6599 101 6
, .T
. .Δ
= =
In USC units:
off
21 010 0375 203 R1163 0333
, .T
. .Δ
= =
Copyright American Petroleum Institute
Provided by IHS under license with API
No reproduction or networking permitted without license from IHS
CALCULATION OF HEATER-TUBE THICKNESS IN PETROLEUM REFINERIES B-11
From Equation (B.11) for the tube wall:
In SI units:
( )3
tw
114 3114 3ln101 666 278 1 0 11 K
2 42 2
..
.T ,
.Δ −
= × =
In USC units:
( )o
tw
0 3750 375ln0 33321 028 19 R
2 24 4
..
.T ,
.Δ
= =
Using Equation (B.8), the maximum tube metal temperature is as follows:
In SI units:
Tmax = 271 + 113 + 11 = 395 °C
In USC units:
Tmax = 520 + 203 + 19 = 742 °F
Checking the assumed viscosity ratio, at the oil-film temperature calculated above, 271 + 113 = 384 °C (520 + 203 = 723 °F), the viscosity is 1.1 mPa⋅s (2.66 lb/ft-h). So, for the liquid:
In SI units:
( )014 014
014f, Tb
f, Tw
0002 182 1090 0011
. ...
. ..
µ
µ
= = =
In USC units:
( )014 014
014f, Tb
f, Tw
4 84 182 1 092 66
. ...
. ..
µ
µ
= = =
For the vapor:
In SI units:
( )0 5 0 5
0 5b
w
270 273 0 83 0 91384 273
. ..T
. .T
+ = = = +
In USC units:
( )0 5 0 5
0 5b
w
520 460 0 83 0 91723 460
. ..T
. .T
+ = = = +
Copyright American Petroleum Institute
Provided by IHS under license with API
No reproduction or networking permitted without license from IHS
In heater tubes, the thermal stress of greatest concern is the one developed by the radial distribution of temperature through the thickness. This stress can become particularly significant in thick stainless steel tubes exposed to high heat fluxes.
There are two limits for thermal stress; both are described in Section 5.5.6 of ASME Section VIII, Division 2 Code. These limits apply only in the elastic range; in the rupture range, an appropriate limit for thermal stress has not been established.
In addition to the above limitations, it should be noted that the applicability of the following thermal stress methodologies are limited to “thin wall” tubes (e.g. tubes with a thickness-to-outside diameter ratio of less than 0.15).
C.2 Equation for Thermal Stress
The following equation gives the maximum thermal stress, σTmax, in a tube:
2
T max 22 ln 1
1y
X yy
σ
= − −
(C.1)
where
( ) ( )o o
s2 1 ln 4 1q DE T E
Xy
α Δ α
ν ν λ
= = − −
(C.2)
α is the coefficient of thermal expansion;
E is the modulus of elasticity;
ν is Poisson's ratio;
ΔT is the temperature difference across the tube wall;
y is Do /Di, ratio of outside diameter to actual inside diameter;
qo is the heat flux on the outside surface of the tube;
λs is the thermal conductivity of the steel.
The material properties α , E, v, and λs shall be evaluated at the mean temperature of the tube wall. The average wall thickness shall also be used in this equation (see 5.7). Poisson’s ratio at elevated temperature is not readily available. However, E and G (modulus of rigidity) at high temperature can be found in numerous references and used to calculate ν with the equation: ν = (E/2G) – 1.
Copyright American Petroleum Institute
Provided by IHS under license with API
No reproduction or networking permitted without license from IHS
The limitation, σT,lim1, on primary plus secondary stress intensity of Mandatory Appendix 4 of ASME Section VIII, Division 2 Code (2004 Edition), Paragraph 4-134, can be approximated for thermal stress as given in Equations (C.3) and (C.4) (see Section C.4 for the derivation).
For ferritic steels:
σT,lim1 = (2.0 − 0.67y) σy (C.3)
For austenitic steels:
σ T,lim1 = (2.7 − 0.90y) σy (C.4)
where σy is the yield strength.
The thermal-stress ratchet limit, σT,lim2, of Mandatory Appendix 5 of ASME Section VIII, Division 2 Code (2004 Edition), Paragraph 5-130, can be approximated for thermal stress as given in Equations (C.5) and (C.6) (see Section C.5 for derivation).
For ferritic steels:
σT,lim2 = 1.33σy (C.5)
For austenitic steels:
σ T,lim2 = 1.8σy (C.6)
Both the primary plus secondary stress limit (σT,lim1) and the thermal-stress ratchet limit (σT,lim2) shall be met if the tube is designed for the elastic range.
C.4 Derivation of Limits on Primary Plus Secondary Stress Intensity
The limit on primary plus secondary stress intensity can be expressed symbolically as given by the inequality in Equation (C.7):
σ pl + σ pb + σ cir,max < 3 σ m (C.7)
where
σ cir,max is the maximum circumferential thermal stress which, for this application, is the maximum thermal stress given by equation (C.1);
σ pl is the local primary membrane stress;
σ pb is the primary bending stress.
From ASME BPVC Section VIII, Division 2, for tubes with an internal pressure:
2
pl pb el 22
1y
py
σ σ
+ = −
(C.8)
where
pel is the elastic design pressure;
y is the ratio of outside to actual inside diameter, equal to Do /Di.
Copyright American Petroleum Institute
Provided by IHS under license with API
No reproduction or networking permitted without license from IHS
CALCULATION OF HEATER-TUBE THICKNESS IN PETROLEUM REFINERIES C-3
If the primary membrane stress intensity, σpm, is given by Equation (C.9),
el o elpm
1 1 2 2 1p D p y
yσ
δ
+ = − = −
(C.9)
it can, then, be easily shown that Equation (C.10) gives a first approximation and provides an upper bound:
σ pl + σ pb ≅ yσpm (C.10)
In ASME Section VIII, Division 2 Pressure Vessel Code (2004 Edition)], σm is the allowable membrane stress intensity. For ferritic steels above about 340 °C (650 °F), σm is equal to two-thirds of the yield strength, σy, as given in Equation (C.11):
3 σm = 2 σy (C.11)
For austenitic steels above about 260 °C (500 °F), σm is 90 % of σy, as given in Equation (C.12):
3 σm = 2.7 σy (C.12)
Heater tubes usually operate above these temperatures.
Combining all of this, the primary plus secondary stress intensity limit on thermal stress can be expressed as given in Equations (C.13) and (C.14):
For ferritic steels:
σT,lim1 = 2σy − yσpm (C.13)
For austenitic steels:
σT,lim1 = 2.7σy − yσpm (C.14)
where σT,lim1 is the maximum value permitted for the thermal stress, σT.
For ferritic-steel and austenitic-steel heater tubes designed according to this standard, the inequalities in Equations (C.15) and (C.16), respectively, hold:
σpm < 0.67σy (C.15)
σpm < 0.90σy (C.16)
The thermal-stress limit, σT,lim1, can therefore be approximated as given in Equations (C.17) and (C.18):
For ferritic steels:
σT,lim1 = (2.0 – 0.67y)σy (C.17)
For austenitic steels:
σT,lim1 = (2.7 – 0.90y)σy (C.18)
Copyright American Petroleum Institute
Provided by IHS under license with API
No reproduction or networking permitted without license from IHS
The limits expressed by these equations are simple and appropriate. If the thermal stress is less than this limit, the design is appropriate. If the thermal stress exceeds the limit given by these equations, then, the more exact form of Equation (C.13) or (C.14) shall be used with the primary membrane stress intensity given by Equation (C.9). Also, if the tube thickness is arbitrarily increased over the thickness calculated in 5.3, then the primary membrane stress intensity shall be calculated using the actual average thickness, and Equation (C.13) or Equation (C.14) shall be used to calculate the thermal-stress limit.
C.5 Derivation of Limits on Thermal-stress Ratchet
The limit, σT,lim2, set to avoid thermal-stress ratchet can be expressed as given in Equation (C.19):
σ T,lim2 = 4(σ − σpm) (C.19)
For ferritic steels:
σ = σy (C.20)
For austenitic steels above about 260 °C (500 °F):
σ = 1.5 (0.9 σy) = 1.35 σy (C.21)
As before, σpm is derived from Equation (C.9). Using the inequalities in Equation (C.15) or Equation (C.16), this limit can be approximated as given in Equations (C.22) and (C.23):
For ferritic steels:
σT,lim2 = 1.33 σy (C.22)
For austenitic steels:
σT,lim2 = 1.8 σy (C.23)
As with the limits developed in Section C.4, these limits are approximate. If the thermal stress exceeds this limit or if the tube thickness is arbitrarily increased, the exact limit expressed by Equation (C.19) shall be used with the primary membrane stress intensity given by Equation (C.9).
Copyright American Petroleum Institute
Provided by IHS under license with API
No reproduction or networking permitted without license from IHS
This annex contains calculation sheets that are useful in aiding and documenting the calculation of minimum thickness and equivalent tube metal temperature. Individual sheets are provided for calculations in SI units or in USC units. These calculation sheets may be reproduced.
API Std 530
CALCULATION SHEET
SI Units
Heater _________________________ Unit _____________________ Item No. ___________________________
Coil Material ASTM Spec
Calculation of Minimum Thickness Elastic Design Rupture Design
Outside diameter, mm Do = Do =
Design pressure, MPa (gauge) pel = pr =
Maximum or equivalent metal temperature, °C Tmax = Tmax =
Temperature allowance, °C TA = TA =
Design metal temperature, °C Td = Td =
Design life, h — tDL =
Allowable stress at Td, Figures E.1 to E.64, MPa σel = σr =
Stress thickness, Equation (2) or (4), mm δσ = δσ =
Corrosion allowance, mm δCA = δCA =
Corrosion fraction, Figure 1, n = ; B = — fcorr =
Minimum thickness, Equation (3) or (5), mm δmin = δmin =
Calculation of Equivalent Tube Metal Temperature
Duration of operating period, years top =
Metal temperature, start of run, °C Tsor =
Metal temperature, end of run, °C Teor =
Temperature change during operating period, K ΔT =
CALCULATION OF HEATER-TUBE THICKNESS IN PETROLEUM REFINERIES D-3
API Std 530—Retirement Wall Thickness
CALCULATION SHEET
Parameter Convection Radiant Unit Reference
Pressure, P Normal Maximum Tube metal temperature, TMT Normal Maximum Operating plan Time to next inspection Time to tube retirement Future corrosion allowance, FCA Allowance for supplemental load(s) Tube parameters Outside diameter, D
Nominal wall thickness, δnom Material specification Creep material strength property Creep life fraction consumed Allowable stress, S Elastic Creep Minimum required thickness, δmin
Value Basis Retirement wall thickness, δretire Equation (1) Minimum measured thickness, δmm Remaining life Equation (2)
Copyright American Petroleum Institute
Provided by IHS under license with API
No reproduction or networking permitted without license from IHS
Figure F.16—Stress Curves (USC Units) for ASTM A213 T21 and ASTM A335 P21 3Cr-1Mo Steels
Figure F.17—Rupture Exponent vs. Temperature Curve (USC Units) for ASTM A213 T21 and ASTM A335 P21 3Cr-1Mo Steels
Figure F.18—Larson-Miller Parameter vs. Stress Curve (USC Units) for ASTM A213 T21 and ASTM A335 P21 3Cr-1Mo Steels
Table F.6—Elastic and Rupture Allowable Stresses (USC Units) for ASTM A213 T21 and ASTM A335 P21 3Cr-1Mo Steels
5Cr-1/2Moly Steels
Figure F.19—Stress Curves (USC Units) for ASTM A213 T5 and ASTM A335 P5 5Cr-1/2Mo Steels
Figure F.20—Rupture Exponent vs. Temperature Curve (USC Units) for ASTM A213 T5 and ASTM A335 P5 5Cr-1/2Mo Steels
Figure F.21—Larson-Miller Parameter vs. Stress Curve (USC Units) for ASTM A213 T5 and ASTM A335 P5 5Cr-1/2Mo Steels
Table F.7—Elastic, Rupture Allowable Stresses and Rupture Exponent (USC Units) for ASTM A213 T5 and ASTM A335 P5 5Cr-1/2Mo Steels
5Cr-1/2Moly-Si Steels
Figure F.22—Stress Curves (USC Units) for ASTM A213 T5b and ASTM A335 P5b 5Cr-1/2Mo-Si Steels
Figure F.23—Rupture Exponent vs. Temperature Curve (USC Units) for ASTM A213 T5b and ASTM A335 P5b 5Cr-1/2Mo-Si Steels
Figure F.24—Larson-Miller Parameter vs. Stress Curve (USC Units) for ASTM A213 T5b and ASTM A335 P5b 5Cr-1/2Mo-Si Steels
Table F.8—Elastic, Rupture Allowable Stresses and Rupture Exponent (USC Units) for ASTM A213 T5b and ASTM A335 P5b 5Cr-1/2Mo-Si Steels
9Cr-1Moly Steels
Figure F.25—Stress Curves (USC Units) for ASTM A213 T9 and ASTM A335 P9 9Cr-1Mo Steels
Figure F.26—Rupture Exponent vs. Temperature Curve (USC Units) for ASTM A213 T9 and ASTM A335 P9 9Cr-1Mo Steels
Figure F.27—Larson-Miller Parameter vs. Stress Curve (USC Units) for ASTM A213 T9 and ASTM A335 P9 9Cr-1Mo Steels
Table F.9—Elastic, Rupture Allowable Stresses and Rupture Exponent (USC Units) for ASTM A213 T9 and ASTM A335 P9 9Cr-1Mo Steels
9Cr-1Moly-V Steels
Figure F.28—Stress Curves (USC Units) for ASTM A213 T91 and ASTM A335 P91 9Cr-1Mo-V Steels
Figure F.29—Rupture Exponent vs. Temperature Curve (USC Units) for ASTM A213 T91 and ASTM A335 P91 9Cr-1Mo-V Steels
Figure F.30—Larson-Miller Parameter vs. Stress Curve (USC Units) for ASTM A213 T91 and ASTM A335 P91 9Cr-1Mo-V Steels
Table F.10—Elastic, Rupture Allowable Stresses and Rupture Exponent (USC Units) ASTM A213 T91 and ASTM A335 P91 9Cr-1Mo-V Steels
TP 304-304H Stainless Steels
Figure F.31—Stress Curves (USC Units) for ASTM A213, ASTM A271, ASTM A312, and ASTM 376 TP 304 and 304H (18Cr-8Ni) Stainless Steels
Figure F.32—Rupture Exponent vs. Temperature Curve (USC Units) for ASTM A213, ASTM A271, ASTM A312, and ASTM 376 TP 304 and 304H (18Cr-8Ni) Stainless Steels
Figure F.33—Larson-Miller Parameter vs. Stress Curve (USC Units) for A213, ASTM A271, ASTM A312, and ASTM 376 TP 304 and 304H (18Cr-8Ni) Stainless Steels
Table F.11—Elastic, Rupture Allowable Stresses and Rupture Exponent (USC Units) for A213, ASTM A271, ASTM A312, and ASTM 376 TP 304 and 304H (18Cr-8Ni) Stainless Steels
CALCULATION OF HEATER-TUBE THICKNESS IN PETROLEUM REFINERIESV F-3
TP 304L Stainless Steels
Figure F.34—Stress Curves (USC Units) for ASTM A213, ASTM A271, ASTM A312, and ASTM 376 TP 304L (18Cr-8Ni) Stainless Steels
Figure F.35—Rupture Exponent vs. Temperature Curve (USC Units) for ASTM A213, ASTM A271, ASTM A312, and ASTM 376 TP 304L (18Cr-8Ni) Stainless Steels
Figure F.36—Larson-Miller Parameter vs. Stress Curve (USC Units) for A213, ASTM A271, ASTM A312, and ASTM 376 TP 304L (18Cr-8Ni) Stainless Steels
Table F.12—Elastic, Rupture Allowable Stresses and Rupture Exponent (USC Units) for A213, ASTM A271, ASTM A312, and ASTM 376 TP 304L (18Cr-8Ni) Stainless Steels
TP 316-316H Stainless Steels
Figure F.37—Stress Curves (USC Units) for ASTM A213, ASTM A271, ASTM A312, and ASTM 376 TP 316 and 316H (16Cr-12Ni-2Mo) Stainless Steels
Figure F.38—Rupture Exponent vs. Temperature Curve (USC Units) for ASTM A213, ASTM A271, ASTM A312, and ASTM 376 TP 316 and 316H (16Cr-12Ni-2Mo) Stainless Steels
Figure F.39—Larson-Miller Parameter vs. Stress Curve (USC Units) for ASTM A213, ASTM A271, ASTM A312, and ASTM 376 TP 316 and 316H (16Cr-12Ni-2Mo) Stainless Steels
Table F.13—Elastic, Rupture Allowable Stresses and Rupture Exponent (USC Units) for ASTM A213, ASTM A271, ASTM A312, and ASTM 376 TP 316 and 316H (16Cr-12Ni-2Mo) Stainless Steels
Figure F.43—Stress Curves (USC Units) for ASTM A213, ASTM A271, ASTM A312, and ASTM 376 TP 321 (18Cr-10Ni-Ti) Stainless Steels
Figure F.44—Rupture Exponent vs. Temperature Curve (USC Units) for ASTM A213, ASTM A271, ASTM A312, and ASTM 376 TP 321 (18Cr-10Ni-Ti) Stainless Steels
Figure F.45—Larson-Miller Parameter vs. Stress Curve (USC Units) for ASTM A213, ASTM A271, ASTM A312, and ASTM 376 TP 321 (18Cr-10Ni-Ti) Stainless Steels
Table F.15—Elastic, Rupture Allowable Stresses and Rupture Exponent (USC Units) for ASTM A213, ASTM A271, ASTM A312, and ASTM 376 TP 321 (18Cr-10Ni-Ti) Stainless Steels
TP 321H Stainless Steels
Figure F.46—Stress Curves (USC Units) for ASTM A213, ASTM A271, ASTM A312, and ASTM 376 TP 321H (18Cr-10Ni-Ti) Stainless Steels
Figure F.47—Rupture Exponent vs. Temperature Curve (USC Units) for ASTM A213, ASTM A271, ASTM A312, and ASTM 376 TP 321H (18Cr-10Ni-Ti) Stainless Steels
Figure F.48—Larson-Miller Parameter vs. Stress Curve (USC Units) for ASTM A213, ASTM A271, ASTM A312, and ASTM 376 TP 321H (18Cr-10Ni-Ti) Stainless Steels
Table F.16—Elastic, Rupture Allowable Stresses and Rupture Exponent (USC Units) for ASTM A213, ASTM A271, ASTM A312, and ASTM 376 TP 321H (18Cr-10Ni-Ti) Stainless Steels
TP 347 Stainless Steels
Figure F.49—Stress Curves (USC Units) for ASTM A213, ASTM A271, ASTM A312, and ASTM 376 TP 347 (18Cr-10Ni-Nb) Stainless Steels
Figure F.50—Rupture Exponent vs. Temperature Surve (USC Units) for ASTM A213, ASTM A271, ASTM A312, and ASTM 376 TP 347 (18Cr-10Ni-Nb) Stainless Steels
Figure F.51—Larson-Miller Parameter vs. Stress Curve (USC Units) for ASTM A213, ASTM A271, ASTM A312, and ASTM 376 TP 347 (18Cr-10Ni-Nb) Stainless Steels
Table F.17—Elastic, Rupture Allowable Stresses and Rupture Exponent (USC Units) for ASTM A213, ASTM A271, ASTM A312, and ASTM 376 TP 347 (18Cr-10Ni-Nb) Stainless Steels
Rupture Exponent vs. Temperature (oF) for TP304-304H SS
Rupture exponent, n
Figure F.32—Rupture Exponent vs. Temperature Curve (USC Units) for ASTM A213, ASTM A271, ASTM A312, and ASTM 376 TP 304 and 304H (18Cr-8Ni) Stainless Steels
Figure F.38—Rupture Exponent vs. Temperature Curve (USC Units) for ASTM A213, ASTM A271, ASTM A312, and ASTM 376 TP 316 and 316H (16Cr-12Ni-2Mo) Stainless Steels
Figure F.50—Rupture Exponent vs. Temperature Surve (USC Units) for ASTM A213, ASTM A271, ASTM A312, and ASTM 376 TP 347 (18Cr-10Ni-Nb) Stainless Steels
Derivation of Corrosion Fraction and Temperature Fraction
G.1 General
The 1958 edition of API 530 [16] contained a method for designing tubes in the creep-rupture range. The method took into consideration the effects of stress reductions produced by the corrosion allowance. In developing this design method, the following ideas were used.
At temperatures in the creep-rupture range, the life of a tube is limited. The rate of using up the life depends on temperature and stress. Under the assumption of constant temperature, the rate of using up the life increases as the stress increases. In other words, the tube lasts longer if the stress is lower.
If the tube undergoes corrosion or oxidation, the tube thickness will decrease over time. Therefore, under the assumption of constant pressure, the stress in the tube increases over time. As a result, the rate of using up the rupture life also increases in time.
An integral of this effect over the life of the tube was solved graphically in the 1988 edition of API 530 [17] and developed using the linear-damage rule (see G.2). The result is a nonlinear equation that provides the initial tube thickness for various combinations of design temperature and design life.
The concept of corrosion fraction used in 5.4 and derived in this annex is developed from the same ideas and is a simplified method of achieving the same results.
Suppose a tube has an initial thickness, δσ , calculated using Equation (4). This is the minimum thickness required to achieve the design life without corrosion. If the tube does not undergo corrosion, the stress in the tube will always equal the minimum rupture strength for the design life, σr. This tube will probably fail after the end of the design life.
If this tube were designed for use in a corrosive environment and had a corrosion allowance of δCA, the minimum thickness, δmin, can be set as given in Equation (G.1):
δmin = δσ + δCA (G.1)
The stress is initially less than σr. After operating for its design life, the corrosion allowance is used up, and the stress is only then equal to σr. Since the stress has always been lower than σr, the tube still has some time to operate before it fails.
Suppose, instead, that the initial thickness were set as given in Equation (G.2):
δmin = δσ + fcorrδCA (G.2)
In this equation, ƒcorr is a fraction less than unity. The stress is initially less than σr, and the rate of using up the rupture life is low. At the end of the design life, the tube thickness is as given in Equation (G.3):
δmin − δCA = δσ − (1 − fcorr)δCA (G.3)
This thickness is less than δσ ; therefore, at the end of the design life, the stress is greater than σr, and the rate of using up the rupture life is high. If the value of fcorr is selected properly, the integrated effect of this changing
Copyright American Petroleum Institute
Provided by IHS under license with API
No reproduction or networking permitted without license from IHS
rate of using up the rupture life yields a rupture life equal to the design life. The corrosion fraction, fcorr, given in Figure 1 is such a value.
The curves in Figure 1 were developed by solving the nonlinear equation that results from applying the linear-damage rule. Figure 1 can be applied to any design life, provided only that the corrosion allowance, δCA, and rupture allowable stress, σr, are based on the same design life.
G.2 Linear-damage Rule
Consider a tube that is operated at a constant stress, σ, and a constant temperature, T, for a period of time, Δt. Corresponding to this stress and temperature is the rupture life, tr, as given in Equation (G.4):
tr = tr(σ,T) (G.4)
The fraction, Δt/t, is then the fraction of the rupture life used up during this operating period. After j operating periods, each with a corresponding fraction as given in Equation (G.5),
r 1,2,3,....i j
t
t
Δ
=
(G.5)
the total fraction, F (also known as the life fraction), of the rupture life used up would be the sum of the fractions used in each period, as given in Equation (G.6):
( ) 1r
j
ii
tF j
t
Δ=
= (G.6)
In developing this equation, no restrictions were placed on the stress and temperature from period to period. It was assumed only that during any one period the stress and temperature were constant. The life fraction, therefore, provides a way of estimating the rupture life used up after periods of varying stress and temperature.
The linear-damage rule asserts that creep rupture occurs when the life fraction totals unity, that is, when F( j) = 1.
The limitations of this rule are not well understood. Nevertheless, the engineering utility of this rule is widely accepted, and this rule is frequently used in both creep-rupture and fatigue analysis [18], [19], [20], and [21].
G.3 Derivation of Equation for Corrosion Fraction
With continually varying stress and temperature, the life fraction can be expressed as an integral as given in Equation (G.7):
( ) opop 0
r
dt tF t
t= (G.7)
where
top is the operating life;
tr is tr (σ,Τ ), i.e. the rupture life at stress, σ, and temperature, Τ ;
t is the time.
Copyright American Petroleum Institute
Provided by IHS under license with API
No reproduction or networking permitted without license from IHS
CALCULATION OF HEATER-TUBE THICKNESS IN PETROLEUM REFINERIES G-3
In general, both the stress, σ , and the temperature, Τ, are functions of time.
The rupture life, tr, can be related to the stress as given in Equation (G.8), at least over limited regions of stress or time (see H.4):
tr = mσ−n (G.8)
where
m is a material parameter which is a function of temperature;
n is the rupture exponent, which is a function of temperature and is related to the slope of the stress-rupture curve.
For a specified design life, tDL, and corresponding rupture strength, σr, Equations (G.9) through (G.11) hold:
tDL = mσr−n (G.9)
So:
m = tDLσrn (G.10)
Hence:
rr DL
n
t tσ
σ
=
(G.11)
Substituting Equation (G.11) into Equation (G.7), the life fraction can be expressed as given in Equation (G.12):
( )( )OP
OP 0r DL
dn
t t yF t
t
σ
σ
=
(G.12)
where σ (t) is the stress expressed as a function of time.
This integral can be calculated once the temperature and stress history are known, but in general this calculation is difficult to perform. For the purposes of this development for tube design, the temperature is assumed to be constant. (This assumption is not made in G.5.) The remaining variable is, therefore, the stress as a function of time, σ (t), which is given by the mean-diameter equation for stress as in Equation (G.13):
( )( )0r 1
2Dp
t t
σδ
= −
(G.13)
where
pr is the rupture design pressure;
Do is the outside diameter;
δ (t) is the thickness expressed as a function of time.
Copyright American Petroleum Institute
Provided by IHS under license with API
No reproduction or networking permitted without license from IHS
In general, the rupture design pressure (operating pressure) is also a function of time; however, like temperature, it is assumed to be constant for the purposes of tube design. The thickness is determined from Equation (G.14):
δ (t) = δ0 − φcorr t (G.14)
where
δ0 is the initial thickness;
φcorr is the corrosion rate.
Calculating F(top) is then simply a matter of substituting Equations (G.13) and (G.14) into Equation (G.12) and integrating. This integration cannot be done in closed form; a simplifying assumption is needed.
Let δσ be the thickness calculated from σr as given in Equation (G.15):
r oσ
r r2p D
pδ
σ=
+ (G.15)
To a first approximation, Equation (G.16) holds:
( )( )σtt
δσ
δ≅ (G.16)
Substituting Equations (G.13), (G.14), and (G.16) into Equation (G.12) and integrating results in Equation (G.17):
1 1σ
opcorr DL 0 corr op 0
1 1( )( 1)
nn n
F tn t t
δ
φ δ φ δ
− − = − − − (G.17)
At t = tDL, F(tDL) should equal unity; that is, the accumulated damage fraction should equal unity at the end of the design life. Using F(t) = 1 and t = tDL in Equation (G.17) results in Equation (G.18):
1 1σ
corr DL 0 corr DL 0
1 11( 1)
n n n
n t t
δ
ϕ δ ϕ δ
− − = − − −
(G.18)
Now let δ0 = δσ + fcorrδCA and B = δCA/δσ, where δCA = φcorr tDL; that is, the corrosion allowance is defined as being equal to the corrosion rate times the design life. With these changes, Equation (G.18) reduces to an equation as a function of the corrosion fraction, fcorr, as given in Equation (G.19):
1 1
corr corr
1 1 11( 1) 1 1
n n
n B f B B f B
− − = − − + − +
(G.19)
For given values of B and n, Equation (G.19) can be solved for the corrosion fraction, fcorr. The solutions are shown in Figure 1.
Copyright American Petroleum Institute
Provided by IHS under license with API
No reproduction or networking permitted without license from IHS
CALCULATION OF HEATER-TUBE THICKNESS IN PETROLEUM REFINERIES G-5
G.4 Limitations of the Corrosion Fraction
In addition to the limitations of the linear-damage rule mentioned in G.2, the corrosion fraction has other limitations. For the derivation, the temperature, pressure, and corrosion rate were assumed to be constant throughout the operating life. In an operating heater, these factors are usually not constant; nevertheless, the assumptions of constant pressure, temperature and corrosion rate are made for any tube design. The assumptions are, therefore, justified in this case, since the corrosion fraction is part of the rupture design procedure. (The assumption of constant temperature is not made in G.5.)
The derivation of the corrosion fraction also relies on the relationship between rupture life and stress expressed in Equation (G.11). For those materials that show a straight-line Larson-Miller Parameter curve in Figures E.3 to E.66 in Anxex E [in metric (SI) units] and Figures F.3 to F.66 in Annex F [in U.S. customary (USC) units], this representation is exact. For those materials that show a curvilinear Larson-Miller Parameter curve, using Equation (G.11) is equivalent to making a straight-line approximation of the curve. To minimize the resulting error, the values of the rupture exponent shown in Figures E.3 to E.66 and in Figures F.3 to F.66 were developed from the minimum 60,000-hour and 100,000-hour rupture strengths (see H.4). In effect, this applies the straight-line approximation to a shorter segment of the curved line and minimizes the error over the usual range of application.
Finally, the mathematical approximation of Equation (G.16) was used. A more accurate approximation is available; however, when it is used, the resulting graphical solution for the corrosion fraction is more difficult to use. Furthermore, the resulting corrosion fraction differs from that given in Figure 1 by less than 0.5 %. This small error and the simplicity of using Figure 1 justify the approximation of Equation (G.16).
G.5 Derivation of Equation for Temperature Fraction
Since tube design in the creep-rupture range is very sensitive to temperature, special consideration should be given to cases in which a large difference exists between start-of-run and end-of-run temperatures. In the derivation of the corrosion fraction in G.3, the temperature was assumed to remain constant. The corrosion fraction can be applied to cases in which the temperature varies if an equivalent temperature can be calculated. The equivalent temperature should be such that a tube operating at this constant equivalent temperature sustains the same creep damage as a tube operating at the changing temperature. Equation (G.6) can be used to calculate an equivalent temperature for a case in which the temperature changes linearly from start of run to end of run.
Equation (G.11) was developed to relate the rupture life, tr, to the applied stress, σ. A comparable equation is needed to relate the rupture life to both stress and temperature. This equation can be derived by means of the Larson-Miller Parameter plot. When this plot is a straight line (or when the curve can be approximated by a straight line), the stress, σ, can be related to the Larson-Miller Parameter, Γ, as given in Equation (G.20):
σ = a × 10−bΓ (G.20)
where
a, b are curve-fit constants;
Γ = *T (CLM + lgtr) × 10−3;
is the absolute temperature, expressed in Kelvin;
CLM is the Larson-Miller constant;
tr is the rupture time, expressed in hours.
T ∗
Copyright American Petroleum Institute
Provided by IHS under license with API
No reproduction or networking permitted without license from IHS
CALCULATION OF HEATER-TUBE THICKNESS IN PETROLEUM REFINERIES G-7
where
or0
01
2
Dp σ
δ
= −
(G.28)
If a linear change in temperature occurs during the time top, then the temperature, T*, can be expressed as a function of time, t, as given in Equation (G.29):
( ) 0 0op 0 op
1* * *T T tT t T t T
t T t
Δ Δ = + = +
(G.29)
where
is the initial absolute temperature, expressed in Kelvin;
ΔT is the temperature change in operating time period, top, expressed in Kelvin.
Let
0*
T
T
Δγ = (G.30)
Using Equations (G.25) and (G.30), the equation for temperature becomes as given in Equation (G.31):
(G.31)
Using Equations (G.27) and (G.31), Equation (G.22) can be written as given in Equation (G.32):
0LM
/(1 )10
op op0
1( ) 10 d
1
nC
F t tBa
γρσ
ρρ
+
= − (G.32)
where
00
1000*
nbT
=
n0 is the rupture exponent at the initial temperature, .
The aim of this analysis is to find a constant equivalent temperature, , between and ( + ΔT) such
that the life fraction at the end of the period top with the linearly changing temperature is equal to the life fraction with the equivalent temperature. This equivalent temperature can be expressed as given in Equation (G.33):
( )* *eq 0 1 , 0 < < 1T T γϖ ϖ= + (G.33)
From Equation (G.32), the resulting life fraction is as given in Equation (G.34):
( )( )0
LM1 0
op op 0
1110 d1
/
C n
F t ta B
γ ϖσρ
ρ
+ = − (G.34)
0T ∗
0( ) (1 )T t T γρ∗= +
0T ∗
eqT ∗0T ∗
0T ∗
Copyright American Petroleum Institute
Provided by IHS under license with API
No reproduction or networking permitted without license from IHS
Equating Equations (G.32) and (G.34) and dividing out common terms yields an integral equation for the parameter ϖ :
( ) ( )0 01 10 00 0
1 11 1d d1 1
/ /
n n
a B a B
γρ γ ϖσ σρ ρ
ρ ρ
+ + = − −
(G.35)
For given values of σ0, a, n0, b, and γ, Equation (G.35) can be solved numerically for ϖ. Using ϖ and Equations (G.30) and (G.33), the equivalent temperature is calculated as given in Equation (G.36):
eq 0 00
1* * *
*
TT T T T
T
Δϖ ϖΔ
= + = +
(G.36)
The parameter ϖ is the temperature fraction, fT, in 4.8.
The solutions to Equation (G.35) can be approximated by a graph if the given values are combined into two parameters as given in Equations (G.37) and (G.38):
0 00 00
ln ln*
a T aV n n
T
Δγ
σ σ
= =
(G.37)
0 00
N n B nΔσ
σ
= =
(G.38)
Using these two parameters, the solutions to Equation (G.35) are shown in Figure 2.
The constant A in Table 3 is one of the least-squares curve-fit constants, a and b, in the equation
σ = a × 10−bΓ, where Γ is the Larson-Miller Parameter and σ is the minimum rupture strength. For materials that have a linear Larson-Miller Parameter curve, A can be calculated directly from any two points on the curve. For all other materials, a least-squares approximation of the minimum rupture strength is calculated in the stress region below the intersection of the rupture and elastic allowable stresses, since this is the region of most applications. For the purpose of calculating the temperature fraction, this accuracy is sufficient.
Copyright American Petroleum Institute
Provided by IHS under license with API
No reproduction or networking permitted without license from IHS
The American Petroleum Institute [through the API Committee on Refining Equipment (CRE) Subcommittee on Heat Transfer Equipment (SCHTE) Standard 530 Task Group] contracted the Materials Property Council (MPC) to gather new mechanical property data for heater tube alloys and analyze this data using modern parametric data analysis methods to derive equations suitable for incorporation into API 530. The alloys analyzed by the MPC are used for petroleum refinery heater applications and reflect modern steel making practices.
The data collections for prior editions of API 530 were limited to alloys produced in the United States. The new data gathered and analyzed by the MPC included materials test results produced and tested at facilities outside of the United States. For heater tube design calculations per this standard, the material data required include the yield strength, ultimate tensile strength, stress-rupture exponent, and minimum and average stress rupture properties (as described using Larson-Miller Parameter equations). The aforementioned material data is used to calculate the (time-independent) elastic allowable stress and the (time-dependent) rupture allowable stress for the specified design service life and design temperature.
WRC Bull 541 details and outlines the results of the material data review performed by MPC. The scope of this work is summarized in a paper titled Development of a Material Databook for API Std 530
[22].
The yield-, tensile-, and rupture-strength data displayed in Figures E.1 to E.64 and Figures F.1 to F.64 originated in WRC Bull 541.
WRC Bull 541 provides mechanical property data for alloys that have been gathered and analyzed using systematic computerized statistical data fitting methods. Detailed descriptions of the data are not repeated in this annex. The material that follows is limited to a discussion of the deviations from published data and of data that have been used, but are not generally available.
H.2 Yield Strength
Equation (1) in WRC Bull 541 is used to calculate the yield strength as a function of temperature for all materials listed in Table 4. Additionally, the material coefficients for use with this equation are listed in Table 1 (in USC units) and Table 1M (in SI units) of WRC Bull 541. Figures E.1 to E.64 and Figures F.1 to F.64 graphically depict the material yield strength for a range of temperatures in both SI and USC units, respectively.
H.3 Ultimate Tensile Strength
Equation (2) in WRC Bull 541 is used to calculate the ultimate tensile strength as a function of temperature for all materials listed in Table 4. Additionally, the material coefficients for use with this equation are listed in Table 1 (in USC units) and Table 1M (in SI units) of WRC Bull 541. Figures E.1 to E.64 and Figures F.1 to F.64 graphically depict the materials’ ultimate tensile strength for a range of temperatures, in both SI and USC units, respectively.
The use of Figures E.1 to E.64 and Figures F.1 to F.64 or Tables E.1 to E.22 and Tables F.1 to F.22 is equally acceptable. When using the tables, semi-log interpolation can be used to determine rupture allowable stresses at intermediate temperatures.
Copyright American Petroleum Institute
Provided by IHS under license with API
No reproduction or networking permitted without license from IHS
The elastic allowable stress (time-independent stress) for all materials listed in Table 4 is directly proportional to the materials yield strength over the specific range of temperatures as calculated using the following:
Se = Fed * σys (H.1)
where
Se is the Elastic Allowable Stress (time-independent);
Fed is the Elastic Allowable Stress Factor; for ferritic steels, Fed = 0.66; for austenitic steels, Fed = 0.90 (refer to Table 2 of WRC Bull 541);
σys is the material yield strength at temperature.
Figures E.1 to E.64 and Figures F.1 to F.64 graphically depict the materials’ elastic allowable stresses for a range of temperatures, in both SI and USC units, respectively. Additionally, Tables E.1 to E.22 and Tables F.1 to F.22 list the materials’ elastic allowable stresses for a range of temperatures, in both SI and USC units.
The use of Figures E.1 to E.64 and Figures F.1 to F.64 or Tables E.1 to E.22 and Tables F.1 to F.22 is equally acceptable. When using the tables, semi-log interpolation can be used to determine rupture allowable stresses at intermediate temperatures.
H.5 Larson-Miller Parameter
The relationship between temperature, T, design life, Ld, expressed in hours, and stress is provided by the Larson-Miller Parameter (LMP). Equations (H.2) and (H.3), below, give the basic expression for the Larson-Miller Parameter. The term LMP(σ) is evaluated using Equation (H.4).
The coefficient CLM in Equations (H.2) and (H.3) is the Larson-Miller Constant. As explained in Section 5 of WRC Bull 541, the Larson-Miller Constant for each heater tube alloy has been optimized by the parametric analysis (Lot-Centered Analysis) of test results from various sources or lots. The log stress and the reciprocal of the absolute temperature were used as the independent variables, while the log time was used as the dependent variable. As a result of the analysis, a value of CLM is obtained for each lot of material studied in the data set, and minimum and average values computed.
The LMP for each heater tube alloy is presented as a polynomial in log10 of stress in the form given by Equation (H.3). Refer to Table 3 of WRC Bull 541 for the list of coefficients (i.e. A0, A 1, etc.), the applicable Larson-Miller Constant, CLM, (for the average and minimum properties for each material) and the applicable temperature range. Additionally, it is important to note that the equations for the Larson-Miller Parameter should not be used for temperatures outside of the limiting metal design temperatures shown in Table 3 of WRC Bull 541. The minimum constant entries shown in the aforementioned Table 3 are appropriate to represent the variance expected at a 95 % confidence interval.
Figures E.3 to E.66 and Figures F.3 to F.66 graphically depict the materials’ Larson-Miller Parameters for a range of stresses, in both SI and USC units, respectively. Additionally, the Larson-Miller Constants for the minimums and averages of the materials’ properties are listed as well.
Copyright American Petroleum Institute
Provided by IHS under license with API
No reproduction or networking permitted without license from IHS
CALCULATION OF HEATER-TUBE THICKNESS IN PETROLEUM REFINERIES H-3
H.6 Rupture Allowable Stress
The rupture allowable stress, σ, (time-dependent stress) and rupture strength for all materials listed in Table 4, may be determined from the Larson-Miller Parameter calculated from Equation (H.4). The solution is given by the following equation:
St = σ = 10X
where
St is rupture Allowable Stress (time-dependent);
σ is rupture strength at temperature;
X is exponent computed based on the values of the coefficients in Equation (H.4). A thorough explanation of the calculation for X is detailed in Section 6 of WRC Bull 541.
Figures E.1 to E.64 and Figures F.1 to F.64 graphically depict the materials’ rupture allowable stresses for a range of temperatures, in both SI and USC units, respectively, for 20,000-hour, 40,000-hour, 60,000-hour, and 100,000-hour design lives. Additionally, Tables E.1 to E.22 and Tables F.1 to F.22 list the material rupture allowable stress for a range of temperatures in both SI and USC units for each of the design life values listed above in tabular form.
The use of Figures E.1 to E.64 and Figures F.1 to F.64 or Tables E.1 to E.22 and Tables F.1 to F.22 is equally acceptable. When using the tables, semi-log interpolation can be used to determine rupture allowable stresses at intermediate temperatures.
H.7 Rupture Exponent
The rupture exponent can be obtained from the first derivative of log time with respect to stress at any temperature. The rupture exponents used in this document were determined between 60,000 hours and 100,000 hours for the minimum rupture strengths determined from the Larson-Miller Parameter curves.
[ ] [ ]10 10
10 100,000 10 60,000
log 100,000 log 60,000log log
nS S
−=
− (H.5)
where
n is the rupture exponent, at the desired temperature;
S100,000 is the rupture allowable stress at 100,000 hours at the desired temperature;
S60,000 is the rupture allowable stress at 60,000 hours at the desired temperature.
The values of the rupture exponents obtained were fitted with up to a fifth order polynomial as shown in Equation (H.6). The resulting coefficients are presented in Table 4 of WRC Bull 541.
n = C0 + C1T + C2T2 + C3T3 + C4T4 + C5T5 (H.6)
Figures E.2 to E.65 and Figures F.2 to F.65 graphically depict the materials’ rupture exponents for a range of temperatures, in both SI and USC units, respectively. Additionally, Tables E.1 to E.22 and Tables F.1 to F.22 list the materials’ rupture exponents for a range of temperatures, in both SI and USC units.
Copyright American Petroleum Institute
Provided by IHS under license with API
No reproduction or networking permitted without license from IHS
H.8 Modification of, and Additions to, Published Data
The data and equations used to generate the curves exhibited and Annex F were obtained from WRC Bull 541. The Tables listing all of the coefficients used to calculate the Annex E and F curves are provided in Section 14 of WRC Bull 541; additionally, notes addressing the data group studied for each material is explained in Section 15 of WRC Bull 541. A summary of several material notes are provided in H.9.
H.9 Steels
H.9.1 5Cr-0.5Mo-Si Steel
Since there are no new data sources for this material, the material parameters developed for the 5Cr-0.5Mo steels were used.
H.9.2 9Cr-1Mo-V Steel
For this material, new data was obtained primarily from Japan.
H.9.3 Type 304L Stainless Steel
Very little rupture testing of Type 304L materials is intentionally conducted; therefore, the performance of this alloy was estimated from data for Type 304 stainless steel with a carbon content in the range of 0.04 %. Note that the limiting design metal temperature for this low-carbon stainless alloy was established at 677 °C (1250 °F).
H.9.4 Type 304/304H Stainless Steel
Only data from tube materials from overseas sources was utilized in this study; more than 450 heats were included in the final database. The high carbon grade and the normal grade materials were grouped together. The minimum was about the same, but the resulting scatter band was less than the current curves.
H.9.5 Type 316L/317L Stainless Steel
The data analysis indicates that the differences in the yield and ultimate tensile strength trend curves for Type 316L and Type 317L materials are indistinguishable; therefore, the material parameters for these two alloys are identical. Note that the limiting design metal temperature for these low-carbon stainless alloys was established at 704 °C (1300 °F).
H.9.6 Type 347 Stainless Steel
New data analyzed for this material was obtained primarily from Japan. Microstructural changes at higher temperatures associated with carbide precipitation or dissolution/formation of sigma phase cause the rupture exponent plot to increase slightly with increasing temperatures (see curve deflection in Figures E.50 and F.50). Thus, for this alloy, the minimum value is noted on the rupture exponent curves.
The owner/user should specify whether their Type 347 stainless steel heater tubes should be optimized for corrosion resistance (fine grained practice) or for creep resistance (coarse grained practice).
H.9.7 Type 347H Stainless Steel
New data analyzed for this material was obtained primarily from Japan. Microstructural changes at higher temperatures associated with carbide precipitation or dissolution/formation of sigma phase cause the rupture exponent plot to increase slightly with increasing temperatures (see curve deflection in Figures E.53 and F.53). Thus, for this alloy, the minimum value is noted on the rupture exponent curves.
Copyright American Petroleum Institute
Provided by IHS under license with API
No reproduction or networking permitted without license from IHS
CALCULATION OF HEATER-TUBE THICKNESS IN PETROLEUM REFINERIES H-5
H.9.8 Alloy 800
Material results from heats that do not take advantage of the heat treating and compositional controls imposed to obtain the Alloy 800H and Alloy 800HT grades were excluded from the analysis. Thus, this unrestricted material is not usually used for creep service and the database is relatively small.
H.9.9 Alloy 800H
Tubular product data for yield and ultimate tensile strength was obtained for this alloy. A broad international material database is represented in the stress rupture data shown and is generally in conformance with prior estimates. Some test results lasted in excess of 100,000 hours.
H.9.10 Alloy 800HT
More recent material data from tubular products from overseas sources was combined with the original database. Due to the strengthening nickel-aluminum-titanium compounds and redissolving of carbides, the improvement of Alloy 800HT, over Alloy 800H, is not expected to be very large at intermediate temperatures, and it disappears at very high temperatures.
H.9.11 Alloy HK-40
Material properties (elevated temperature yield and ultimate tensile strength) from high carbon content Alloy HK-40 castings were evaluated. The analysis showed an increase in yield strength in the 1200 °F to 1300 °F range due to precipitation. Lower minimums are shown, as compared to the existing ANSI/API 530 curves, from this large database collected.
Copyright American Petroleum Institute
Provided by IHS under license with API
No reproduction or networking permitted without license from IHS
[1] ASTM A234/A234M, Standard Specification for Piping Fittings of Wrought Carbon Steel and Alloy Steel
for Moderate and High Temperature Service
[2] ASTM A403/A403M, Standard Specification for Wrought Austenitic Stainless Steel Piping Fittings
[3] ASTM B366, Standard Specification for Factory-Made Wrought Nickel and Nickel Alloy Fittings
[4] API 941, Steels For Hydrogen Service at Elevated Temperatures and Pressures in Petroleum Refineries
and Petrochemical Plants
[5] Tucker J.T., Coulter E.E., and Kouistra L.F. Effects of wall thickness on stress-rupture life of tubular specimens, Transactions of the American Society of Mechanical Engineers, Series D, Journal of Basic
Engineering, Vol. 82, June 1960, pp. 465–476
[6] Carlson W.B. and Duval D. Rupture data and pipe design formulae, Engineering, Vol. 193, June 22, 1962, pp. 829–831
[7] Chitty A. and Duval D. The creep-rupture properties of tubes for a high temperature steam power plant, Paper presented at the Joint International Conference on Creep, New York and London, 1963
[8] Yoshida S., Tancha C., Ichino I., and Vematsu K. Creep and creep-rupture properties of Type 316 stainless steel cladding tubes for the experimental fast breeder reactor JOYO, Paper presented at the International Conference on Creep and Fatigue in Elevated Temperature Applications, Philadelphia, September 1973
[10] API Recommended Practice 573, Inspection of Fired Boilers and Heaters
[11] API Standard 570, Piping Inspection Code: In-Service Inspection, Rating, Repair, and Alteration of
Piping Systems
[12] API Recommended Practice 579-1/ASME FFS-1, Fitness for Service, 2nd Edition, 2007
[13] API Recommended Practice 584, Integrity Operating Windows
[14] McAdams W.H. Heat Transmission, 3rd ed., McGraw-Hill, New York, 1954
[15] McEligot D.M., Magee P.M., and Leppart G., Effect of large temperature gradients on convective heat transfer, the downstream region, Transactions of the American Society of Mechanical Engineers, Series
C, Journal of Heat Transfer, Vol. 87, February 1965, pp. 67–76
[16] API Recommended Practice 530, Calculation of Heater Tube Thickness in Petroleum Refineries, 1st Ed., 1958
[17] API Recommended Practice 530, Calculation of Heater Tube Thickness in Petroleum Refineries, 3rd Ed., 1988
[18] Finnie I. Design of furnace tubes for the creep rupture range (Paper 62-WA-272), American Society of Mechanical Engineers, New York, November 1962
Copyright American Petroleum Institute
Provided by IHS under license with API
No reproduction or networking permitted without license from IHS
[19] Freeman J.W. and Voorhees H.R. Literature survey on creep damage in metals (Special Technical
Publication No. 391), American Society for Testing and Materials, Philadelphia, June 1965
[20] Randall P.N. Cumulative damage in creep rupture tests of a carbon steel, Transactions of the American
Society of Mechanical Engineers, Series D, Journal of Basic Engineering, Vol. 84, June 1962, pp. 239-242
[21] Voorhees H.R., Freeman J.W., and Herzog J.A. Trends and implications of data on notched-bar creep-rupture, Transactions of the American Society of Mechanical Engineers, Series D, Journal of Basic
Engineering, Vol. 84, June 1962, pp. 207–213
[22] Prager, M., Osage, D.A., Panzarella, C.H., and Brown, R.G., Development of a Material Databook for
API Std 530, Paper Number PVP2014-28538, Proceedings of the ASME 2014 Pressure Vessels & Piping Conference, July 20–24, 2014, Anaheim, CA
Copyright American Petroleum Institute
Provided by IHS under license with API
No reproduction or networking permitted without license from IHS