CALCULATION OF STEADY AND UNSTEADY PRESSURES AT SUPERSONIC SPEEDS WITH CAP-TSD Robert M. Bennett, Samuel R. Bland, and John T. Batina Unsteady Aerodynamics Branch NASA Langley Research Center Hampton, Virginia Michael D. Gibbons Planning Research Corp. Hampton, Virginia and Dennis G. Mabey Bedford, England Ro ya I Aircraft Est ab I ishment 117
Transcript
CALCULATION OF STEADY AND UNSTEADY PRESSURES AT SUPERSONIC SPEEDS WITH CAP-TSD
Robert M. Bennett, Samuel R. Bland, and John T. Batina
Unsteady Aerodynamics Branch NASA Langley Research Center
Hampton, Virginia
Michael D. Gibbons Planning Research Corp.
Hampton, Virginia
and
Dennis G. Mabey
Bedford, England Ro ya I Aircraft Est ab I ish m en t
117
INTRODUCTION
Currently there is considerable interest in the development of methods for calculating supersonic unsteady aerodynamics for application to advanced configurations. Although flutter is oftentimes critical at transonic speeds, critical conditions can also be encountered at both low and high supersonic speeds depending upon configuration and operating envelopes. Linear theory has been the primary analytical tool for analyzing flutter in the low supersonic region with recent efforts directed towards refining the potential gradient methods. In linear theory the loading on a wing is determined by the relationship of the Mach lines to the planform which can lead to complex logic for configurations. In this study a finite-difference technique is used to solve the transonic small-disturbance flow equation making use of shock-capturing to treat wave discontinuities. Thus the nonlinear effects of thickness and angle of attack are considered. Such an approach is made feasible by the development of an efficient new code by the Unsteady Aerodynamics Branch of the NASA Langley Research Center. The new code is called CAP-TSD for Computational Aeroelastlcity Program - Transonic Small Disturbance and is based on a fully lmpllclt approximate-factorizatlon (AF) finite-dlfference method to solve the time-dependent transonlc small-dlsturbance equation and has been descrlbed by Batina' In an earlier presentation at this workshop. This paper presents the appllcatlon of the CAP-TSD code to the caiculatlon of low to moderate supersonlc steady and unsteady flows. in partlcular, comparisons wlth exact llnear theory solutlons are made for steady and unsteady cases to evaluate the shock capturing and other features of the current method. in addition, steady solutlons obtained from an Euler code are used to evaluate the small disturbance aspects of the code. Steady and unsteady pressure comparisons are made with measurements for an F-5 wing model and for the RAE tailplane model. (Fig. 1 .).
+Batina et al., NASA CP- 3022,, 1989, Paper No. 4.
INTRODUCTION
0 Significant interest in unsteady supersonic aerodynamics Configurations can be flutter critical at supersonic speeds New configurations are under development
Linear theory currently used Mach box, potential gradient, etc Treats mach lines and mach cones explicitly = complex logic for configurations
0 Present study applies CAP-TSD to wings 0 Computational Aeroelasticity Program - Lransonic Small Disturbance
Previous presentation'described application to configurations Comparisons presented: Linear theory, F-5 model, and RAE tailplane model +Pitt , this CP
Figure 1
CAP-TSD
As previously indicated, CAP-TSD is based on a fully implicit approximate-factorization (AF) algorithm. The program solves the modified transonic small disturbance (TSD) equation including the +tt term. The program has been developed for configurations and is highly vectorized. A TSD code called XTRAN3S has been previously developed and used extensively: however, the partially-explicit alternating direction implicit algorithm used in XTRAN3S was unstable for swept and tapered wings at supersonic speeds. The AF algorithm used in CAP-TSD is stable for such cases. The finite-difference method treats discrete waves by shock capturing.
For all the cases presented here, a finite-difference grid was used that consisted of 90 x 30 x 60 points in the x-y-z directions giving a total of 162,000 grid points. The grid extended 10 root chord lengths ahead and aft of the wing, nearly 13 chord lengths above and below, and one sernispan outboard of the tip. On the wihg, 50 points were used along each chord and 20 points along the span. This grid is one that would be used for a subsonic freestream and extends further than may be necessary for the supersonic cases. The outer boundary conditions for the cases considered herein are the "reflecting" outer boundary conditions, but care has been taken to ensure that the wing is located within the "Mach diamond" such that waves do not reflect from the outer boundaries back onto the wing surface. For the oscillating wings the calculations were made at 360 steps per cycle which corresponds to a time step of the order of 0.1. Only two cycles of motion were calculated because the flow field converges rapidly for supersonic flow. The second cycle was used for Fourier analysis. One Newton iteration per step was used for flow field convergence. (Fig. 2.)
CAP - TSD
0 Fu I I y i m p I i ci t ap p r ox i m ate- f acto r iz at i o n (A F) algor i t h m
Solves general frequency modified transonic small disturbance (TSD) equation
Developed for configurations
0 Vectorized
Stable for supersonic flow
0 Treats discontinuous waves by shock-capturing
0 Reflecting outer boundary conditions and large grid extent used for supersonic flow
0 Fine grid: 90x30~60 (x-y-z) 162,000 points Figure 2
119
COMPARISON OF CAP-TSD AND EXACT LINEAR THEORY RECTANGULAR WING, AR = 4, M = 1.30
6 -
The first comparison with linear theory is for tip loading on a wing in steady flow. The loading within the tip Mach line for a wing with a supersonic leading edge has an exact conical flow solution. A typical result is shown in figure 3 and is compared with a corresponding CAP-TSD calculation for a rectangular wing. For this case the loading has a discontinuous slope at the Mach line which is smeared by the finite-difference scheme but the overall trend of the loading is reproduced.
A c P a -
2 -
-- - 1 = 0.77
~
0 0.2 0.4 0.6 0.8 1.0
xic
Figure 3
120
COMPARISON OF CAP-TSD AND EXACT LINEAR THEORY L.E. SWEEP = 40°, TAPER RATIO = 0.5, M = 1.12
The next comparison is for a more complex situation. For a wing with a subsonic leading edge, the loading at the tip Mach line has a jump. A loading of this type is shown in figure 4 for a hexagonal wing planform of 40" leading-edge sweep, taper ratio of 0.50, and at M = 1.1 2. The over-all trend of the loading again is given by CAP-TSD but there is considerable smearing of the jump discontinuity. For this severe test case further development of the finite differencing is desirable, but the agreement of the overall trend is encouraging.
Exact
- 1 = 0.77
I I I
0 .2 .4 .6 .8 1.0
xlc
Figure 4
121
COMPARISON OF CAP-TSD AND EXACT LINEAR THEORY 2-D FLAT PLATE PITCHING ABOUT 41.3% C, M = 1.30
For unsteady flow, exact solutions for a two-dimensional flat plate airfoil are given in NACA Report 846 by Garrick and Rubinow (1946). Solutions for a rectangular wing of aspect-ratio- 4 oscillating in pitch at M = 1.30 about the 41.3% chord are presented in NACA TN 3076 by Nelson, et ai. (1954). Several cases have been run with CAP-TSD for the rectangular wing. Since the inboard portion of the wing has two dimensional flow, the inboard solutions can be compared to the 2-0 results of Garrick. and Rubinow. . The comparison for unsteady lift is shown in figure 5. The agreement with the exact solution up to k = 1.0 is excellent.
0 C
'a 2 -
-2 O 3 I mag inar y
0 .2 .4 .6 .a 1.0
k
Figure 5
122
COMPARISON OF CAP-TSD AND EXACT LINEAR THEORY FLAT PLATE WING, PITCHING ABOUT 41.3% C, M = 1.30, K = 0.111
For the oscillating rectangular wing of aspect ratio 4 at M = 1.30, the spanwise distribution of lift magnitude and phase over the wing for K = 0.116 is shown in figure 6. Good agreement is evident with some slight overprediction at the tip. Note that the phase angle is shown with a highly expanded scale. These cases indicate that the overall loading is well reproduced by CAP- TSD in supersonic unsteady flows.
5
4
3
P1.1 1
2
0
- 2
-6
-8
I I I I .2 .4 .6 .a 1.0 0 .2 .4 .6 .8 1.0
- ii
0 rl
Figure 6
123
COMPARISON OF CAP-TSD AND EXPERIMENT F-5 MODEL, STEADY FLOW, M = 1.10, a o = 0"
The first comparisons with experimental data are for an F-5 wing model tested by the Dutch NLR. The F-5 wing model is a typical supersonic wing with a panel aspect ratio of 1.58, a leading edge sweep angle of 31.9" and a taper ratio of 0.28. The airfoil section is a modified NACA 65A004.8 which has a slightly drooped nose and is symmetric aft of 40% chord. Subsonic and transonic calculations for this model have been made previously by several investigators using TSD codes and have been in generally good agreement with the experimental data. Calculations with CAP-TSD are compared with steady flow data for a0 = 0" and for Mach numbers of 1.1 0 in figure 7. Generally good agreement is demonstrated. There is a shock on the lower surface near the leading edge which is swept aft slightly more than the leading edge. Some deviation of the results obtained with CAP-TSD from the data in this region is noted.
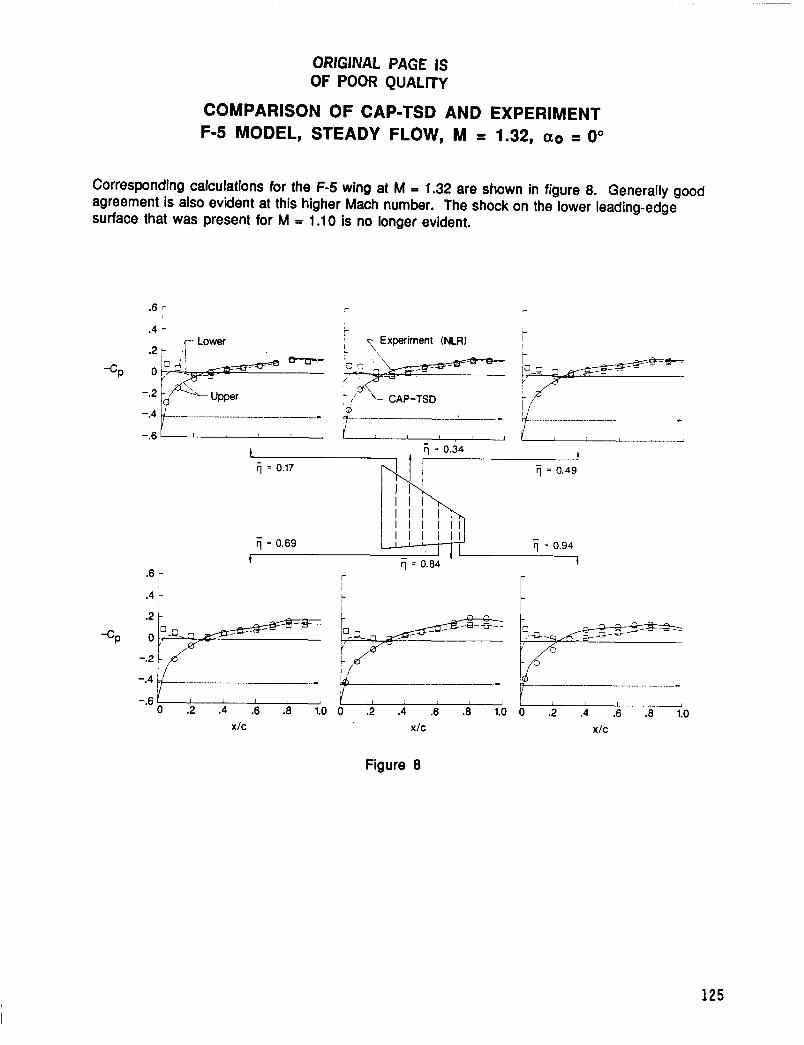
COMPARISON OF CAP-TSD AND EXPERIMENT F-5 MODEL, STEADY FLOW, M = 1.32, a o = 0"
Corresponding calculations for the F-5 wing at M = 1.32 are shown in figure 8. Generally good agreement is also evident at this higher Mach number. The shock on the lower leading-edge surface that was present for M = 1.1 0 is no longer evident.
Figure 8
125
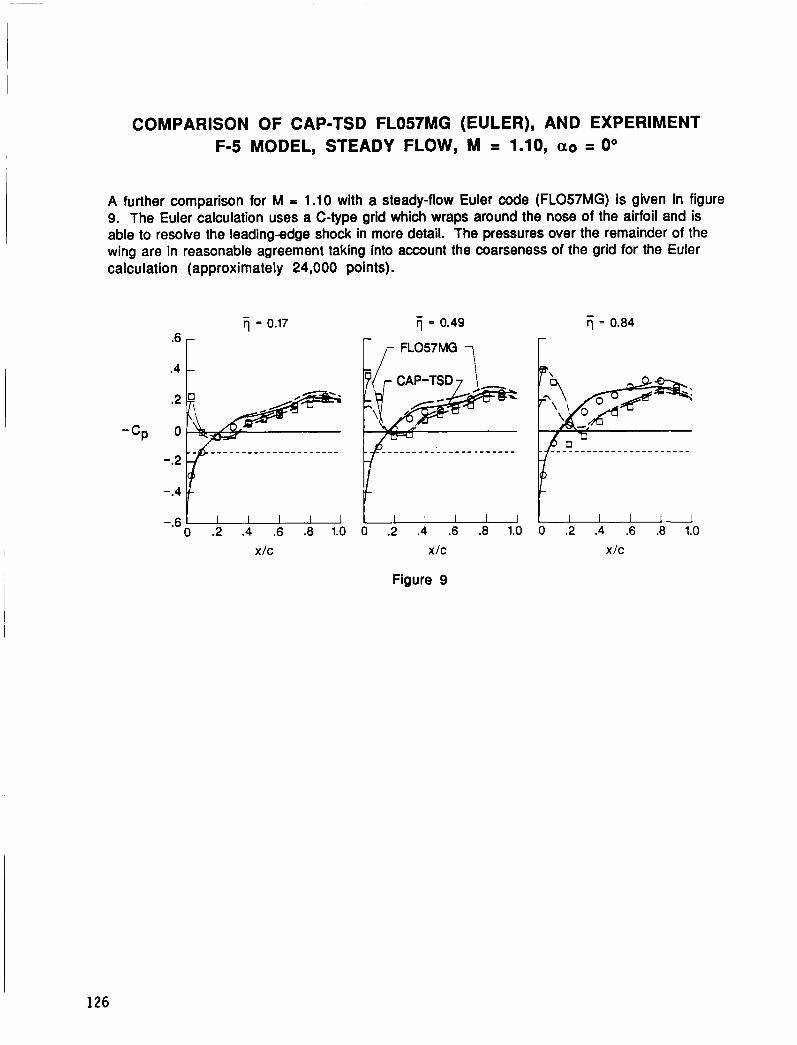
COMPARISON OF CAP-TSD FL057MG (EULER), AND EXPERIMENT F-5 MODEL, STEADY FLOW, M = 1.10, uo = 0"
A further comparison for M 5 1.1 0 with a steady-flow Euler code (FL057MG) is given in figure 9. The Euler calculation uses a C-type grid which wraps around the nose of the airfoil and is able to resolve the leading-edge shock in more detail. The pressures over the remainder of the wing are in reasonable agreement taking into account the coarseness of the grid for the Euler calculation (approximately 24,000 points).
- 1 = 0.49 r ,- FL057MG
.2
-cp 0
0 .2 .4 .6 .8 1.0
x Jc
- 1 = 0.84
r
0 .2 .4 .6 .8 1.0
x Jc x Jc
Figure 9
126
COMPARISON OF CAP-TSD AND EXPERIMENT F-5 MODEL OSCILLATING IN PITCH ABOUT 50% Cr
M = 1.10, k = 0.116, a o = O", a1 = 0.267' UPPER SURFACE
Unsteady pressures are calculated with CAP-TSD for one reduced frequency for each of these two Mach numbers for the F-5 model wing. Upper and lower surface pressures are compared with experiment separately. The upper surface pressures for M = 1.1 0 and k = 0.1 16 are shown in figure 10. There is generally good agreement with the data. A typical supersonic loading is evident with only modest variations along the chord.
COMPARISON OF CAP-TSD AND EXPERIMENT F-5 MODEL OSCILLATING IN PITCH ABOUT 50Ym Cr
LOWER SURFACE M = 1.10, k = 0.116, a o = 0', a1 = 0.267'
The lower surface pressures corresponding to the upper surface results of the previous figure are shown in figure 11. In the region of the lower surface shock, a large peak in unsteady loading is apparent which appears to be due to an embedded transonic flow region. CAP-TSD gives reasonable trends for this'case even for the very large unsteady loading at the tip station.
COMPARISON OF CAP-TSD AND EXPERIMENT F-5 MODEL OSCILLATING IN PITCH ABOUT 50% Cr
UPPER SURFACE M = 1.32, k = 0.198, a o = Oo, a1 = 0.222O
Unsteady pressures for the upper surface of the F-5 model oscillating in pitch at M = 1.32 are shown in figure 12. Again there is generally good agreement with the data in a similar manner to the agreement for M = 1.1 0 for the upper surface.
COMPARISON OF CAP-TSD AND EXPERIMENT F-5 MODEL OSCILLATING IN PITCH ABOUT 50% Cr
LOWER SURFACE M = 1.32, k = 0.198, cco = Oo, CCI = 0.222O
The lower surface pressures for the F-5 model at M = 1.32 are presented in figure 13. The large peak near the leading edge that was evident at M = l.10 does not appear in these results. Generally good agreement with the data is again obtained.
COMPARISON OF CAP-TSD AND EXPERIMENT RAE TAILPLANE MODEL, STEADY FLOW, M = 1.20, a o = 0.0"
The RAE tailplane model was built and tested by the British RAE. The tailplane is a planform that is typical of a tailplane for a supersonic fighter. It has a panel aspect ratio of 1.20, a taper ratio of 0.27, and a leading-edge sweep angle of 50.2". The airfoil is approximately a NACA 64A010.2 which is thicker (10.2% thick) than is typical for supersonic wings. Only upper surface pressures were measured for this model.
Calculated steady results from CAP-TSD for ao = 0' and M = 1.20 are compared with measured pressures in figure 14. The measured pressures shown are the mean values measured at 3 Hz (k < 0.015) as steady pressures were not measured for these Mach numbers. The agreement is quite good at all five span stations.
r .8 r I [ Experiment (RAE) t
-cp . 2 L Lower
CAP-TSD -.2 t
I -- I---- -.4 1 I 1 I
?I = 0.84 A j T ri =
fi = 0.42
1
-c,
.8 r I 1 .8
.6
.4
.2
0
-.2
-.4 I
__ .. I
0 .2 .4 .6 .8 1.0
.6
.4
.2
0
-.2
-.4 I
__ .. I
0 .2 .4 .6 .8 1.0 I I -11 0 .2 .4 .6 .8 1.0
x IC
Figure 14
xlc
131
COMPARISON OF CAP-TSD AND EXPERIMENT RAE TAILPLANE MODEL, STEADY FLOW, M = 1.71, (XO = 0.14'
i .6
Experiment (RAE) i I
The calculated steady results for M = 1.32 are compared with the experimental results in figure 15. Here the agreement is good inboard, but some deviation is shown near the tip.
-
-cP
.e
.6
.4
.2
0
-.2
-.4
c
= 0.14
o .2 .4 .6 .a 1.0 xlc
i' ' I 1
1 = 0.96 -l<yyl -
o .2 .4 .6 .8 1.0
xlc
Figure 15
I 132
COMPARISON OF CAP-TSD, FL057MG (EULER) AND EXPERIMENT RAE TAILPLANE MODEL, .STEADY FLOW, M I 1.71, a o = 0.14'
Corresponding calculations for M = 1.71 with FL057MG using the Euler equations are presented in figure 16. The results from CAP-TSD and the Euler results are in close agreement. The results from FL057MG also show the deviation from the data near the tip.
COMPARISON OF CAP-TSD AND EXPERIMENT RAE TAILPLANE MODEL OSCILLATING IN PITCH ABOUT 68% Cr
M = 1.20, K = 0.346, 010 = O", 011 = .378"
Unsteady pressures for pitching oscillations of the RAE tailplane model at M = 1.20 and 70 Hz are presented in figure 17. Good overall agreement for the in phase (or real) data is obtained but the out-of-phase components (imaginary) are under predicted somewhat. As previously indicated, pressures were measured only on one surface.
.4 Experiment (RAE)
- .2
0
-.2
-%
- . 4 1 I , , , , , 1. 6 = 0.66 f 6 = 0.42 ?I = 0.84 A
r r
.4 1
-.4 - 0 .2 .4 .6 .8 1.0
x lc
0 .2 .4 .6 .8 1.0 x l c
Figure 17
COMPARISON OF CAP-TSD AND EXPERIMENT RAE TAILPLANE MODEL OSCILLATING IN PITCH ABOUT 68% Cr
M = 1.71, K = .270, a o = .14O, = ,570'
The unsteady results for the tailplane oscillating at 70 Hz at M = 1.71 are shown in figure 18. The agreement is comparable to that of M = 1.20. The unsteady loading has less of a peak near the leading edge for M = 1.71 than for M = 1.20.
.4 Experiment (RAE)
- .2
0 -cP
-.2
-.4 ' I 1 I I I 1 1 1 1 1 1
I fi = 0.66 fi = 0.84 1 I I
t ij = 0.42
.6
.4
- .2
0 -cP
-.2
-.4 1-1
o .2 .4 .6 .a 1.0 I,,,,, 0 .2 .4 .6 .8 1.0
x l c X I C
Figure 18
135
COMPARISON OF CAP-TSD AND EXPERIMENT RAE TAILPLANE MODEL M = 1.71, a0 = 5.14, STEADY FLOW
I
Some measurements were made at 5" mean angle of attack for this model. Pressures on the lower surface were obtained by testing the upper surface at the corresponding negative angle of attack. The steady pressures for ao = 5" and M = 1.71 are compared with results from CAP- TSD in figure 19. Both the thickness loading and the pressure difference are reasonably well predicted even at this large angle of attack and Mach number. Again some deviation of the results from the data is evident on the upper surface ne'ar the tip.
L ! , , 0 .2 .4 .6 .8 1.0
x l c x l c
Figure 19
136
7
CONCLUDING REMARKS
A transonic unsteady aerodynamic and aeroelastic analysis code called CAP-TSD has been developed for application to realistic aircraft configurations. The new code now permits the calculation of unsteady flows about complete aircraft configurations for aeroelastic analysis in the flutter critical transonic speed range. It uses an AF algorithm that has been shown to be very efficient for steady or unsteady transonic flow problems including supersonic freestream flows.
Results were presented for several wings that demonstrate the applicability of CAP-TSD for supersonic flows including embedded transonic flows. Comparisons with known exact analytical solutions from linear theory demonstrated that CAP-TSD gives reasonably good fidelity to approximating weak shock waves, but with smearing of strong discontinuities. Unsteady lift was well predicted for a two-dimensional flat plate airfoil and for an oscillating rectangular wing. CAP-TSD results for the thin F-5 wing were in good overall agreement with experimental steady and unsteady pressures and with a steady flow Euler code. One case with an embedded swept shock near the lower surface leading edge indicated that embedded transonic flows can be treated. Results for the RAE tailplane model were in good agreement with the measured data for both steady and unsteady cases, and with a steady calculation with an Euler code. Good agreement was also found for a steady flow case at a Mach number of 1.71 and five degrees mean angle of attack. The present study has demonstrated the applicability of the CAP- TSD code to flows with supersonic freestream with favorable comparisons of selected cases. Improvements to the shock capturing characteristics and the supersonic outer boundary conditions for supersonic flows are desirable. (Fig. 20.)
CONCLUDING REMARKS
a
a
0
0
CAP-TSD applied to wings in supersonic flow
Results compare favorably with exact linear theory solutions
Generally good agreement with experiment for F-5 and tailplane models
Improvements needed in shock capturing and outer boundary conditions