Page 1
1
CALEDONIA MINING CORPORATION PLC MARCH 18, 2020
Management’s Discussion and Analysis
This management’s discussion and analysis (“MD&A”) of the consolidated operating results and financial
position of Caledonia Mining Corporation Plc (“Caledonia” or the “Company”) is for the quarter ended
December 31, 2019 (“Q4 2019” or the “Quarter” and the year ended December 31, 2019 (the “Year”) and
the period ended March 18, 2020). It should be read in conjunction with the Audited Consolidated Financial
Statements of Caledonia for the Year (“the Consolidated Financial Statements”) which are available from
the System for Electronic Data Analysis and Retrieval at www.sedar.com or from Caledonia’s website at
www.caledoniamining.com. The Consolidated Financial Statements and related notes have been prepared
in accordance with International Financial Reporting Standards (“IFRS”) as issued by the International
Accounting Standards Board. In this MD&A, the terms “Caledonia”, the “Company”, the “Group”, “we”,
“our” and “us” refer to the consolidated operations of Caledonia Mining Corporation Plc and its
subsidiaries unless otherwise specifically noted or the context requires otherwise.
Note that all currency references in this document are to US Dollars, unless otherwise stated.
Page 2
2
TABLE OF CONTENTS
1. Overview
2. Highlights
3. Summary Financial Results
4. Operations at the Blanket Gold Mine, Zimbabwe
4.1. Safety, Health and Environment
4.2. Social Investment and Contribution to the Zimbabwean Economy
4.3. Gold Production
4.4. Underground
4.5. Metallurgical Plant
4.6. Production Costs
4.7. Capital Projects
4.8. Indigenisation
4.9. Zimbabwe Commercial Environment
4.10. Opportunities and Outlook
4.11. Sale of Eersteling
5. Exploration
6. Investing
7. Financing
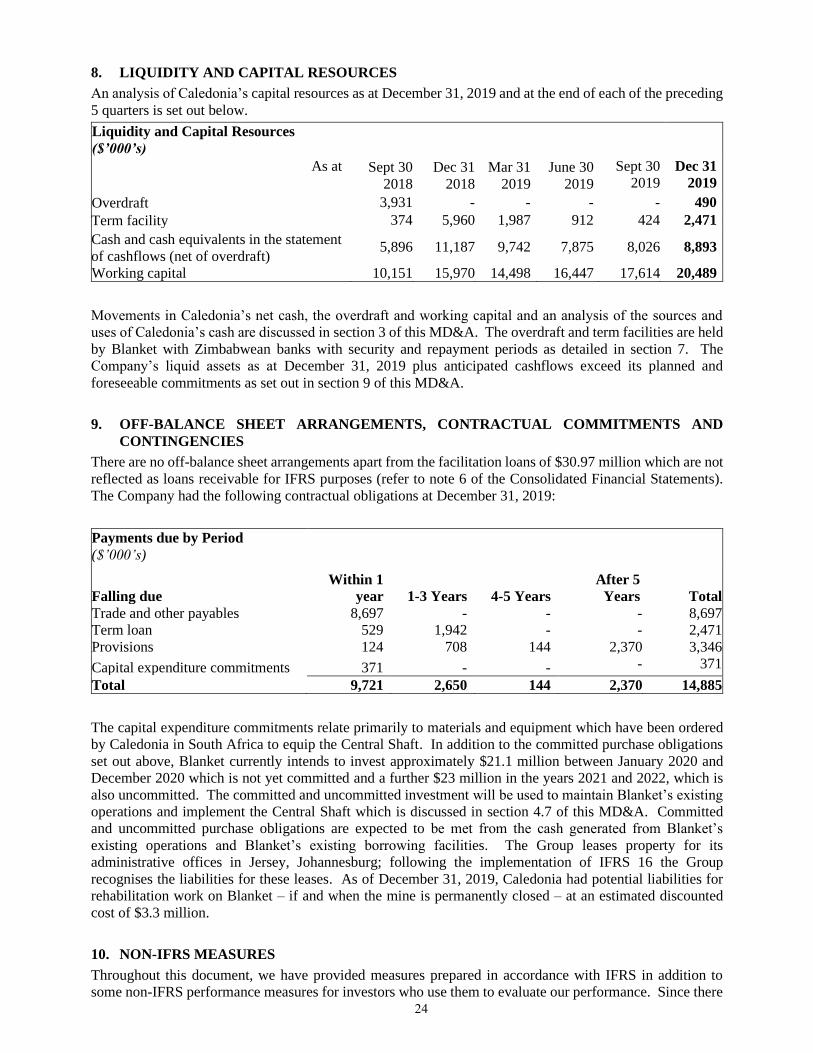
8. Liquidity and Capital Resources
9. Off-Balance Sheet Arrangements, Contractual Commitments and Contingencies
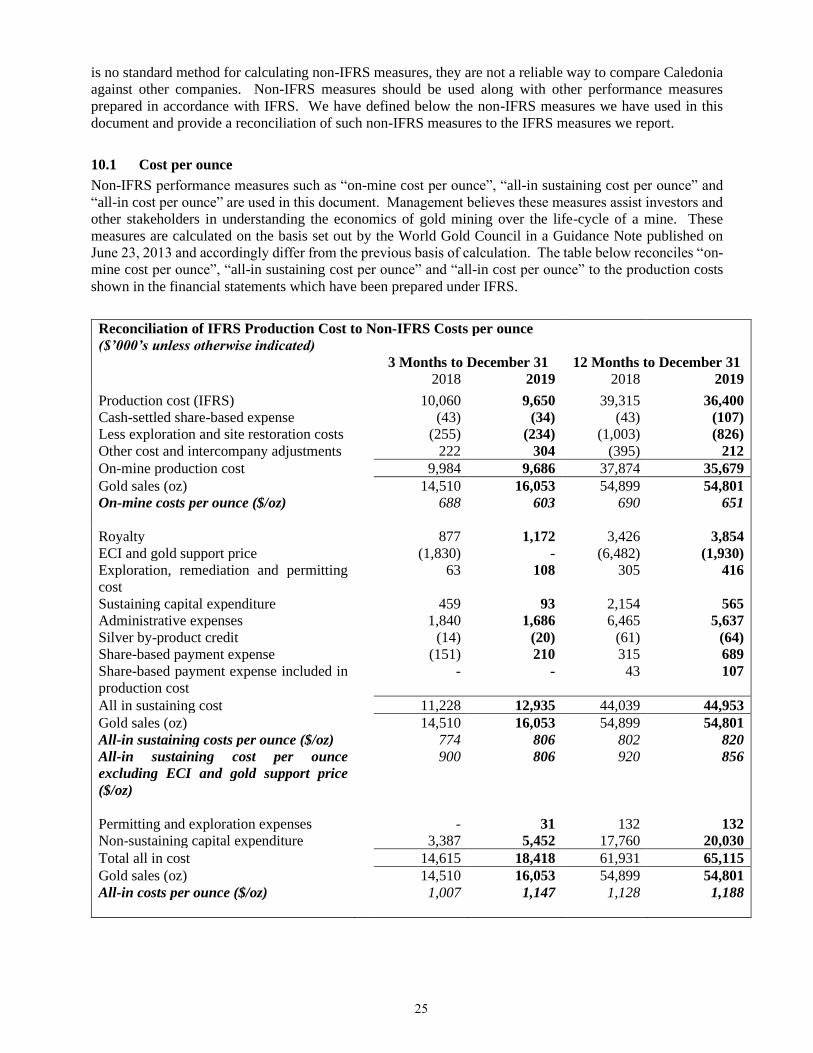
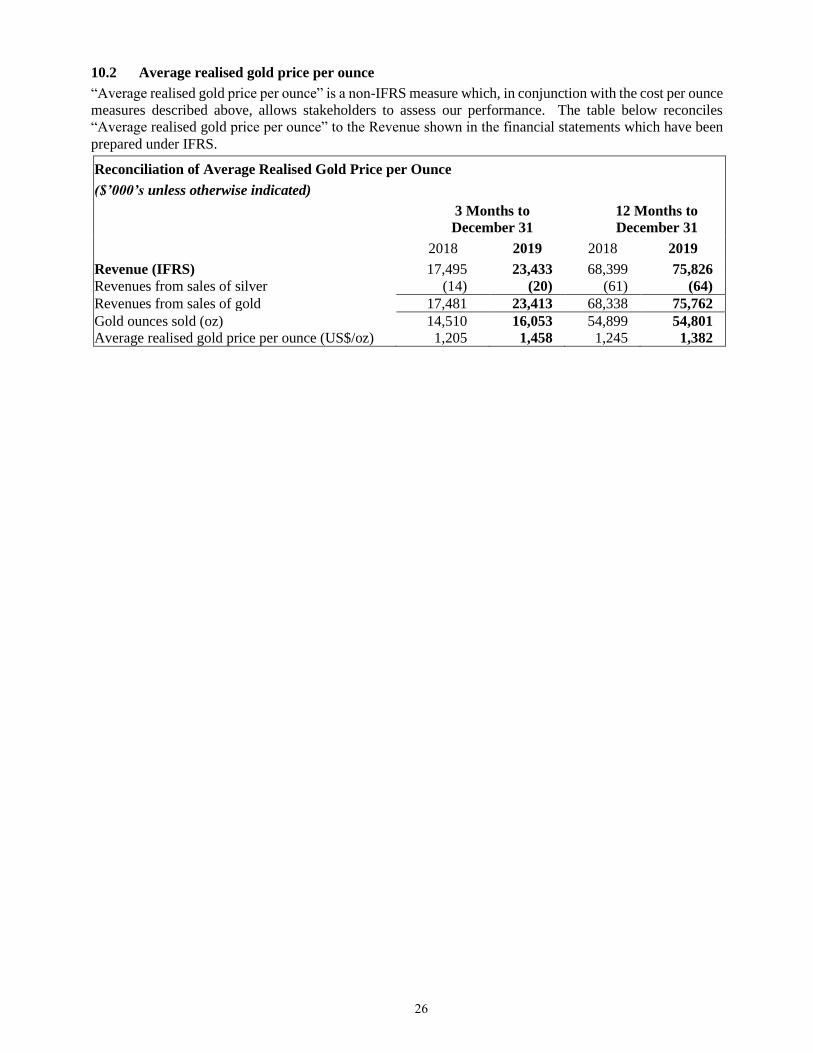
10. Non-IFRS Measures
11. Related Party Transactions
12. Critical Accounting Estimates
13. Financial Instruments
14. Dividend Policy
15. Management and Board
16. Securities Outstanding
17. Risk Analysis
18. Forward-Looking Statements
19. Controls
20. Qualified Person
Page 3
3
1. OVERVIEW
Caledonia is an exploration, development and mining corporation focused on Zimbabwe. Caledonia’s
primary asset in the Year was a 49% ownership in Blanket Mine (“Blanket”), an operating gold mine in
Zimbabwe. Caledonia consolidates Blanket into the Consolidated Financial Statements; accordingly,
operational and financial information set out in this MD&A is on a 100% basis, unless otherwise specified.
In January 2020, Caledonia increased its shareholding in Blanket to 64% as discussed further below.
Caledonia’s shares are listed on the NYSE American stock exchange (symbol - “CMCL”) and on the Toronto
Stock Exchange (symbol - “CAL”). Depositary interests in Caledonia’s shares are admitted to trading on
AIM of the London Stock Exchange plc (symbol - “CMCL”).
2. HIGHLIGHTS
3 months ended
December 31
12 months ended
December 31
Comment
2018 2019 2018 2019
Gold produced (oz) 14,952 16,876 54,511 55,182
Gold production for the Quarter was
12.9% higher than the last quarter of
2018 (the “comparable quarter”); gold
production for the Year was 1.2% higher
than in 2018. The higher production was
mainly due to increased grade and higher
recovery.
On-mine cost per
ounce ($/oz)1 688 603 690 651
The on-mine cost per ounce of gold sold
was lower due to the higher grade and
higher recovery and lower costs of
electricity and on-mine administration
costs.
All-in sustaining cost
($/oz)1 (“AISC”)
774 806 802 820
AISC increased slightly; however, after
reversing the effect of the Export Credit
Incentive (“ECI”) scheme and its
replacement (the gold support price)
AISC per ounce in the Quarter and the
Year was approximately 10% and 7%
lower respectively due to lower on-mine
costs, administration expenses and
sustaining capex and, in the Quarter, the
effect of higher sales ounces which
meant that fixed costs were spread
across a higher number of ounces sold.
Average realised gold
price ($/oz)1 1,205 1,458 1,245 1,382
The average realised gold price was
higher and reflects the increased price of
gold.
Gross profit 2 5,374 11,336 21,587 31,138
Gross profit was higher due to higher
sales ounces, a higher gold price and
lower unit costs.
Net profit attributable
to shareholders 2,784 2,390 10,766 42,018
Net profit for the Year was higher due to
the higher gross profit and foreign
exchange gains of $29.7 million arising
from the devaluation of the Zimbabwe
currency. Profit for the Quarter was
adversely affected by a $4.7m deferred
tax charge.
1 Non-IFRS measures such as “On-mine cost per ounce”, “AISC” and “average realised gold price” are used throughout this
document. Refer to section 10 of this MD&A for a discussion of non-IFRS measures. 2 Gross profit is after deducting royalties, production costs and depreciation but before administrative expenses, other income,
interest and finance charges and taxation.
Page 4
4
3 months ended
December 31
12 months ended
December 31
Comment
2018 2019 2018 2019
IFRS earnings per
share (“EPS”) (cents) 25 22 99 382
EPS for the Year and the Quarter reflects
the net profit attributable to
shareholders.
Net cash and cash
equivalents 11,187 8,893 11,187 8,893 Net cash remains strong.
Net cash from
operating activities 5,079 4,794 17,667 18,060
Net cash flows from operating activities
remain robust.
Substantial improvement in profitability
Gross profit for the Year was $31.1 million – 44% higher than the $21.6 million achieved in 2018 and the
gross margin for the Year was 41% compared to 32% in 2018. The increase in gross profit was due to lower
production costs and a higher realised gold price. The ounces of gold sold were broadly unchanged.
Completion of shaft sinking at Central Shaft
As announced on July 24, 2019 the Central Shaft has reached its target depth of 1,204 metres. Work on
equipping the shaft has commenced and is expected to be completed in the fourth quarter of 2020, after which
production from Central Shaft can commence. Production in 2020 is expected to be between 53,000 ounces
and 56,000 ounces; production in 2021 is expected to be approximately 75,000 ounces, increasing to the
target rate of approximately 80,000 ounces in 2022.
Completion of the shaft-sinking phase at Central Shaft is a significant milestone and substantially de-risks
the remainder of the project.
Production challenges have been resolved
Mine production in the first part of the Year was adversely affected by Zimbabwe’s economic difficulties
and technical problems: mine production was lower than planned due to mining dilution, low employee
morale because of Zimbabwe’s deteriorating economic climate and delays in procuring equipment and
consumables because of the shortage of foreign exchange. Production in July and early August was
hampered by sustained interruptions to the electricity supply and sporadic shortages of diesel.
The second half of the Quarter saw a substantial improvement in production due to the following factors:
• a new electricity tariff resulted in a cheaper and more reliable supply of imported electricity;
• workers’ remuneration was revised so that they are better protected from inflation;
• a revised bonus structure was implemented to incentivize individual teams;
• new controls were introduced to minimize mining dilution and increase transparency in the daily
targets for production teams;
• on-mine supervision was strengthened; and
• underhand stoping in narrow reef areas was re-introduced to reduce dilution with improved support
in certain areas so that safety is not compromised.
Blanket’s improved operating performance resulted in a record level of production in the Quarter which in
conjunction with a stronger gold price, resulted in a substantial improvement in gross profit. The strong
operational performance achieved in the Quarter has continued into 2020 and gives grounds for confidence
for future performance.
Zimbabwe commercial environment – difficult but stabilising
Zimbabwe has a severe shortage of foreign exchange which, in the first 8 months of the Year, hampered
Blanket’s procurement of consumables and services and restricted the ability to remit funds from Zimbabwe.
In recent months, the situation has stabilised and Blanket has not experienced the same degree of difficulty
in accessing foreign exchange that it encountered earlier in 2019. Investors should recognize that Blanket’s
Page 5
5
ability to implement the investment programme and Caledonia’s ability to sustain its operations outside
Zimbabwe and pay future dividends depends, inter alia, on the ability to continue to externalise cash from
Zimbabwe.
Zimbabwe’s rate of inflation has increased, which had a major effect on Blanket’s operations in the early
part of the Year due to the adverse effect on worker morale. After the introduction of the interbank exchange
mechanism in February 2019, Blanket re-structured workers’ remuneration to protect them better from the
adverse effects of inflation.
In July and early August, Blanket (in common with other industrial users) suffered extensive interruptions
to its electricity supply due to a worsening in the supply and demand balance for electricity in Zimbabwe.
After intensive discussions with all relevant parties, this matter was rapidly resolved and a new power supply
agreement was put in place whereby participating gold producers pay for dedicated imported power. The
electricity supply was again disrupted in October due to a supply deficit in South Africa which resulted in
reduced electricity exports to Zimbabwe. Additional generators were installed at Blanket in the Quarter
which is now completely insulated from further disruptions to power supply. However, the use of diesel
generators is not a long-term solution due to the cost and difficulty in obtaining diesel to run the generators
for extended periods. Management is well-advanced in evaluating a possible solar project which should
reduce Blanket’s dependence on grid power and improve the quality and security of Blanket’s electricity
supply.
Caledonia welcomes the recent changes which reduced the burden of the royalty regime from January 1,
2020 (as discussed in section 4.9 of this MD&A).
Devaluation of the Zimbabwe currency results in substantial net foreign exchange gains
The financial results for the Year and the second and third quarters include substantial net foreign exchange
gains due to the re-introduction of a Zimbabwe local currency (referred to in this MD&A as the “RTGS$”)
and its devaluation against the US Dollar (which is the functional currency for Blanket Mine and Caledonia).
The net foreign exchange gain in the Year was $29.7 million, the largest components of which relate to un-
realised gains on the reduced US Dollar values of the deferred tax liability and the term loan and a realised
gain on an amount that was payable to Blanket’s electricity supplier. If the Zimbabwe currency remains at
the current level against the US Dollar the un-realised gains will be realised when the underlying liability
falls due for settlement. The rate of the devaluation of the local currency slowed towards the end of the
Year and resulted in a smaller net foreign exchange gain of $1.4 million for the Quarter.
The net foreign exchange gain resulted in Caledonia reporting a significantly higher attributable profit and
earnings per share on an IFRS basis. Earnings per share on an IFRS basis were 382 cents compared to 99
cents in 2018. After adjusting for the foreign exchange gains (and before other adjustments) Caledonia’s
earnings per share were 152 cents (No adjustment was made to IFRS earnings per share in 2018 in respect
of foreign exchange gains because they were not significant). Adjusted earnings per share after elimination
of all unusual and non-cash items (the principal adjustments being in respect of the profit on the sale of
Eersteling and the elimination of deferred tax) were 144 cents (2018; 132 cents). A reconciliation of
adjusted earnings to IFRS earnings is included in section 10 of this MD&A.
Increased Dividend
On January 3, 2020 the Company announced a 9.1% increase from the previous quarterly dividend of 6.875
cents per share to 7.5 cents per share. The increased dividend was due to:
• the Company’s improved financial performance due to Blanket’s improved operational
performance;
• the continued higher gold price;
• the improving prospects for the Company as we approach the completion of the Central Shaft
towards the end of 2020 and a resultant anticipated increase in production; and
• a general improvement in the operating environment in Zimbabwe.
The Board will consider future increases in the dividend as appropriate in line with its prudent approach to
risk management.
Page 6
6
Increased shareholding in Blanket
On January 21, 2020 the Company announced the completion of a transaction to acquire an additional 15%
of Blanket from Fremiro Investments (Private) Limited (“Fremiro”), one of Blanket’s indigenous
Zimbabwean shareholders, for a gross consideration of $16.7 million which was settled through a
combination of the cancellation of the loan between the two entities and the issue of 727,266 new shares in
Caledonia. As a result of this transaction Caledonia has a 64% shareholding in Blanket and Fremiro holds
approximately 6.3% of Caledonia’s enlarged issued share capital.
Appointment of a new non-executive director
On September 23, 2019 the Company announced that Nick Clarke had joined the board of directors of the
Company as an independent non-executive director with immediate effect. Mr Clarke, who is Chairman of
Central Asia Metals PLC, is a highly experienced Chartered Engineer with 45 years’ experience in the
mining industry. He has held senior positions in several resource companies and is well known as a
successful executive in the sector having been involved in the construction of major mining projects and
conducted several fund raisings on AIM and TSX.
Strategy and Outlook
Caledonia’s strategic focus is the implementation of the investment programme at Blanket, the main
component of which is the Central Shaft project, which is outlined in section 4.7. Caledonia’s board and
management believe the successful completion of the Central Shaft is in the best interests of all stakeholders
because it is expected to result in increased production, reduced operating costs and increased flexibility to
undertake further exploration and development, thereby safeguarding and enhancing Blanket’s long-term
future. Caledonia continues to evaluate further investment opportunities in Zimbabwe that would not fall
underneath Blanket’s ownership.
Page 7
7
3. SUMMARY FINANCIAL RESULTS
The table below sets out the consolidated profit and loss for the three months ended December 31, 2019 and
2018 and the years ended December 31, 2019, 2018 and 2017 prepared under IFRS.
Condensed Consolidated Statement of Profit or Loss and Other Comprehensive Income
($’000’s) 3 months ended
December 31
12 months ended
December 31 2018 2019 2017 2018 2019
Revenue 17,495 23,433 69,762 68,399 75,826
Royalty (877) (1,172) (3,498) (3,426) (3,854)
Production costs (10,060) (9,650) (36,180
)
(39,315
)
(36,400
) Depreciation (1,184) (1,275) (3,763) (4,071) (4,434)
Gross profit 5,374 11,336 26,321 21,587 31,138
Other income 2,317 231 2,594 7,101 2,274
Other expenses (316) (184) (14) (336) (666)
Impairment loss on trade receivables - - (181) - -
Administrative expenses (1,840) (1,686) (5,911) (6,465) (5,637)
Profit on sale of subsidiary - - - - 5,409
Net foreign exchange gain/(loss) 338 1,391 (380) 223 29,661
Cash-settled share-based payment 135 (283) (976) (315) (689)
Equity-settled share-based payment - - (835) (14) -
Gold hedge expense - (277) - (360) (601)
Operating profit 6,008 10,528 20,618 21,421 60,889
Net finance cost (78) (162) (31) (220) (198)
Profit before tax 5,930 10,366 20,587 21,201 60,691
Tax expense (2,344) (7,136) (8,691) (7,445) (10,290
) Profit for the period 3,586 3,230 11,896 13,756 50,401
Other comprehensive income
Items that are or may be reclassified to profit or loss Exchange differences on translation of foreign
operations
(167) 402 373 (676) 49
Reversal of foreign currency translation
differences on disposal of subsidiary - - - - (2,109)
Total comprehensive income for the period 3,419 3,632 12,269 13,080 48,341
Profit attributable to:
Shareholders of the Company 2,784 2,390 9,384 10,766 42,018
Non-controlling interests 802 840 2,512 2,990 8,383
Profit for the period 3,586 3,230 11,896 13,756 50,401
Total comprehensive income attributable to:
Shareholders of the Company 2,617 2,792 9,757 10,090 39,958
Non-controlling interests 802 840 2,512 2,990 8,383
Total comprehensive income for the period 3,419 3,632 12,269 13,080 48,341
Earnings per share (cents)3
Basic 25.1 21.5 86.5 98.9 382.0
Diluted 25.2 21.3 86.3 98.9 381.5
3 Earnings per share (“EPS”) and dividends per share for 2017 have been adjusted to reflect the effective 1-for-5
share consolidation which was effected on June 26, 2017.
Page 8
8
Condensed Consolidated Statement of Profit or Loss and Other Comprehensive Income (cont.)
3 months ended
December 31
12 months ended
December 31
2018 2019 2017 2018 2019
Dividends declared per share (cents)3 6.875 6.875 27.5 27.5 27.5
Revenue in the Quarter was 34% higher than in the comparable quarter due to a 21% increase in the average
realised price of gold and a 11% increase in the quantity of gold sold. Sales in the Quarter excluded 840
ounces of gold (2018; 442 ounces) which is included as work-in-progress and was sold in early January 2020.
Revenue in the Year was 11% higher than in 2018 (the “previous year”) due to an 11% increase in the average
realised price of gold and a 0.2% reduction in the quantity of gold sold. The average realised price of gold
is a non-IFRS measure which is discussed in section 10.2 of this MD&A. Gold production is discussed in
section 4.3 of this MD&A.
The royalty rate payable to the Zimbabwe Government was unchanged at 5% in the Quarter and the Year.
Production costs in the Quarter decreased by 4.1% compared to the comparable quarter mainly due to a lower
electricity charge for the Quarter following the agreement in August 2019 of a new power supply agreement
and the devaluation of certain costs in Zimbabwe that are denominated in local currency. Production costs
for the Year were 7.4% lower than in the previous year and benefitted from the one-off effect of a substantial
reduction in the US Dollar-denominated cost of electricity in the first half of the year which was in addition
to the lower electricity costs realised in the Quarter. Costs are discussed further in section 4.6 of this MD&A.
Depreciation was higher in the Quarter and in the Year compared to the comparable quarter and the previous
year due to more items of property, plant and equipment being brought into use and depreciated.
Other income in the Quarter and the Year mainly comprises income arising from a government grant in
respect of a gold support price and was substantially lower than in the comparable quarter and the previous
year due to the cessation of the gold support price from June 2019 onwards because the international gold
price exceeded the support price. The gold support price is discussed in section 4.9 of this MD&A.
Other expenses in the Quarter and the Year include the costs of evaluating a potential solar power project.
Administrative expenses comprise the costs of Caledonia’s offices in Johannesburg, St. Helier and Harare,
and the costs of Caledonia’s board and executives, the finance and procurement teams based in Johannesburg,
investor relations, corporate development, legal and secretarial costs. Administrative expenses were 8.4%
lower than the comparable quarter and 12.8% lower than in the previous year due to continued efforts to
reduce costs. Administrative expenses are detailed in note 13 to the Consolidated Financial Statements.
Net foreign exchange movements relate to gains and losses arising on monetary assets and liabilities that are
held in currencies other than the US Dollar. Foreign exchange movements principally arose due to the
devaluation of the Zimbabwe currency against the US Dollar which is discussed in section 4.9 of this MD&A.
The largest components of the net gain in the Quarter and the Year were unrealised gains on borrowings
denominated in Zimbabwe currency and the deferred tax liability, offset by a loss on Zimbabwe currency
denominated cash and receivables, the most significant of which is the VAT recoverable.
The cash-settled share-based payment expense reflects an accrual for a payment which is expected to arise
from the long-term incentive plan (“LTIP”) awards under the Company’s 2015 Omnibus Equity Incentive
Compensation Plan (the “Plan”) to certain executives in the form of Restricted Share Units (“RSUs”) and
Performance Units (“PUs”). LTIP awards may be settled in cash, shares or a combination of both at the
discretion of the award holder. The LTIP expense (other than the small amount which is included in
production cost) in the Quarter was $689 (2018: $315) and reflects a combination of factors including the
change in the Company’s share price and the effluxion of the time period until vesting. Further information
on the calculation of the charge is set out in note 26 to the Consolidated Financial Statements.
The gold hedge expense in the Quarter relates to a hedging arrangement which Caledonia entered into during
the Quarter over 4,600 ounces of gold per month for the period from January 1, 2020 to June 30, 2020. The
hedge comprises the purchase of out-of-the money put options which guarantees that Caledonia will receive
a minimum price of $1,400 in respect of the ounces hedged but retain full exposure to the gold price. The
Page 9
9
hedge is not for speculative purposes but is intended to protect Caledonia’s cashflows during a period when
capital expenditure on the Central Shaft remains high. The cash cost of the hedge was a once-off amount of
$380 however the accounting charge also recognises mark-to-market loss arising on the instruments.
The tax expense comprises the following:
Analysis of Consolidated Tax expense for the Year ($’000’s)
Zimbabwe South Africa GMS UK Total
Income tax 6,171 660 - 6,831
Withholding tax
Management Fee - 128 - 128
Deemed Dividend 224 - - 224
GMS UK Dividend - - 128 128
Deferred tax 2,942 37 - 2,979
9,337 825 128 10,290
The overall effective taxation rate in the Year was 17% compared to 35% in the previous year. Direct
comparison of the effective tax rate in the Year compared to the previous year is complicated by the change
in the basis of the calculation of taxation for Blanket. In 2018, Blanket’s tax was calculated in US dollars
using Blanket’s US Dollar-denominated accounting records (the US Dollar being Blanket’s functional
currency). In 2019, as explained in section 4.9, Blanket’s taxation charge is calculated using RTGS$-
denominated accounts, the resulting charge is then translated into US Dollars for the purposes of financial
reporting. As set out in note 17 to the Consolidated Financial Statements, the requirement to calculate tax
in RTGS$ reduced the taxation charge by $8,526. If the actual tax expense for the Year of $10,290 million
is adjusted to reflect the effect of calculation in RTGS$, the overall effective taxation rate for the Year was
37%, compared to 35% in the previous year.
The largest component of the total taxation charge is Zimbabwe income tax on profits arising at Blanket.
The income tax charge for the Year and the Quarter was higher than in 2018 and the comparable quarter due
to higher taxable profits at Blanket which is broadly reflected in the increase in gross profit.
Zimbabwean deferred tax reflects inter alia the difference between the accounting and tax treatments of
capital investment. 100% of capital expenditure is deductible in the year in which it is incurred for the
purposes of calculating Zimbabwean income tax, whereas for accounting purposes depreciation commences
when the project enters production. In the Quarter the deferred tax expense increased due to the large capital
purchases made in the Quarter and as a result of changes in realised and unrealized foreign exchange
differences.
Withholding tax is Zimbabwean withholding tax on dividends remitted to the UK, management fees and tax
on the deemed dividend arising on management fees paid to Caledonia’s wholly owned subsidiary in South
Africa for technical services rendered.
For the Year non-controlling interests shared in 16.2% of Blanket’s net profit as explained in note 6 of the
Consolidated Financial Statements.
Risks that may affect Caledonia’s future financial condition are discussed in sections 4.9 and 17.
Page 10
10
The table below sets out the consolidated statements of cash flows for the years ended December 31, 2019,
2018 and 2017 prepared under IFRS.
Cash generated from operating activities is detailed in note 30 to the Consolidated Financial Statements.
Cash flows in the Year from operations before working capital were $28.1 million compared to $25.8 million
in the previous year. The increase was mainly due to the higher gross profit which is due to the higher gold
price and lower production costs the effect of which was offset by the lower revenues arising from the gold
support price. Working capital increased in the Year by $4.2 million which was mainly due to an increase in
inventories and prepayments. Inventories increased due the increased stocks of relatively high value spare
parts for the enlarged fleet of underground trackless equipment; the higher level of prepayments reflects the
requirement to prepay for some consumables as Zimbabwean suppliers have reduced their credit terms due
to the high level of inflation; Blanket also prepaid for consignments of diesel to be delivered in January 2020.
Net investment in property, plant and equipment remains high due to the continued investment on the Central
Shaft project, which is discussed further in section 4.7 of this MD&A and in sustaining capital investment.
Net investment also included an unbudgeted amount of approximately $1.5 million to buy additional
generators in response to the power outages experienced in July and early August.
Proceeds from the disposal of a subsidiary relates to the consideration received in the quarter ended March
Condensed Consolidated Statement of Cash Flows
($’000’s)
12 months ended December 31
2017 2018 2019
Cash flows from operating activities
Cash generated from operations 28,885 21,119 23,885
Net interest paid (161) (108) (308)
Tax paid (4,212) (3,344) (5,517)
Net cash from operating activities 24,512 17,667 18,060
Cash flows used in investing activities
Acquisition of property, plant and equipment (21,639) (20,192) (20,024)
Proceeds on sale of subsidiary - - 1,000
Net cash used in investing activities (21,639) (20,192) (19,024)
Cash flows from financing activities
Dividends paid (3,310) (3,497) (3,395)
Repayment of term loan facility (1,500) (1,500) -
Term loan proceeds - 6,000 2,340
Term loan – transaction cost - (60) (46)
Share issue 246 - -
Payment of lease liabilities - - (124)
Share repurchase (146) - -
Net cash used in financing activities (4,710) 943 (1,225)
Net decrease in cash and cash equivalents (1,837) (1,582) (2,189)
Effect of exchange rate fluctuations on cash held 258 13 (105)
Net cash and cash equivalents at beginning of the period 14,335 12,756 11,187
Net cash and cash equivalents at end of the period 12,756 11,187 8,893
Page 11
11
31, 2019 in respect of the sale of Eersteling Gold Mining Company Limited (“Eersteling”) as discussed in
section 4.11 of this MD&A.
The dividends paid relate to the dividend paid by Caledonia and the portion of dividends paid by Blanket that
accrued to the indigenous shareholders after retentions to repay the facilitation loans.
The proceeds of term loans relate to the drawing of further facilities denominated in local currency by Blanket
for working capital purposes. Due to the rapid devaluation of the Zimbabwean currency (as discussed in
section 4.9 of this MD&A) the US Dollar value of Blanket’s debt facilities has continued to erode. However,
as most of Blanket’s expenditures are denominated in US Dollars and South African Rands, Blanket needs to
increase its RTGS$-denominated borrowings to maintain its working capital in US Dollar terms. Blanket’s
debt facilities are discussed in section 7 of this MD&A.
The effect of exchange rate fluctuations on cash held predominantly reflects the losses on cash balances held
in RTGS$ due to the devaluation of RTGS$ against the US dollar. The adverse effect on cash balances forms
part of an overall foreign exchange gain arising on the devaluation of all affected financial assets and
liabilities.
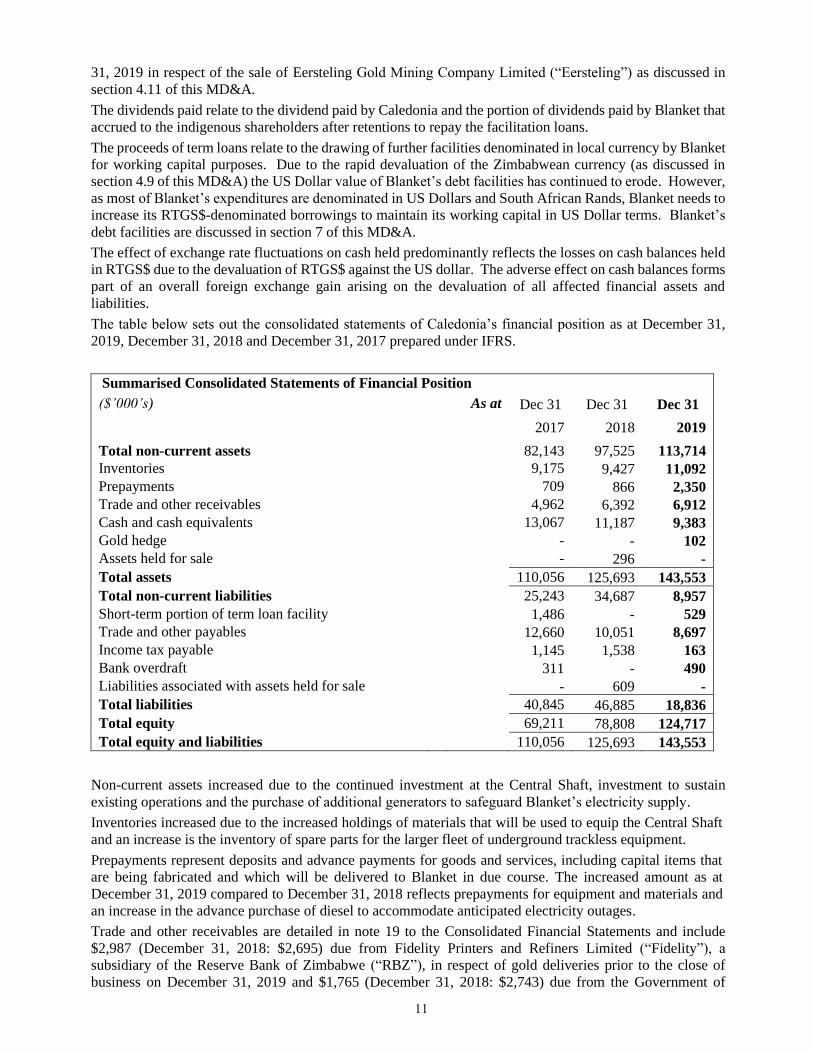
The table below sets out the consolidated statements of Caledonia’s financial position as at December 31,
2019, December 31, 2018 and December 31, 2017 prepared under IFRS.
Summarised Consolidated Statements of Financial Position
($’000’s) As at Dec 31 Dec 31 Dec 31
2017 2018 2019
Total non-current assets 82,143 97,525 113,714
Inventories 9,175 9,427 11,092
Prepayments 709 866 2,350
Trade and other receivables 4,962 6,392 6,912
Cash and cash equivalents 13,067 11,187 9,383
Gold hedge - - 102
Assets held for sale - 296 -
Total assets 110,056 125,693 143,553
Total non-current liabilities 25,243 34,687 8,957
Short-term portion of term loan facility 1,486 - 529
Trade and other payables 12,660 10,051 8,697
Income tax payable 1,145 1,538 163
Bank overdraft 311 - 490
Liabilities associated with assets held for sale - 609 -
Total liabilities 40,845 46,885 18,836
Total equity 69,211 78,808 124,717
Total equity and liabilities 110,056 125,693 143,553
Non-current assets increased due to the continued investment at the Central Shaft, investment to sustain
existing operations and the purchase of additional generators to safeguard Blanket’s electricity supply.
Inventories increased due to the increased holdings of materials that will be used to equip the Central Shaft
and an increase is the inventory of spare parts for the larger fleet of underground trackless equipment.
Prepayments represent deposits and advance payments for goods and services, including capital items that
are being fabricated and which will be delivered to Blanket in due course. The increased amount as at
December 31, 2019 compared to December 31, 2018 reflects prepayments for equipment and materials and
an increase in the advance purchase of diesel to accommodate anticipated electricity outages.
Trade and other receivables are detailed in note 19 to the Consolidated Financial Statements and include
$2,987 (December 31, 2018: $2,695) due from Fidelity Printers and Refiners Limited (“Fidelity”), a
subsidiary of the Reserve Bank of Zimbabwe (“RBZ”), in respect of gold deliveries prior to the close of
business on December 31, 2019 and $1,765 (December 31, 2018: $2,743) due from the Government of
Page 12
12
Zimbabwe in respect of VAT refunds. The increased amount due from Fidelity reflects the extension of the
payment cycle following the implementation of the monetary policy announced by the RBZ on February 20,
2019 (as discussed in section 4.9) and the higher gold price, which increases the value of each delivery made
to Fidelity. The amounts due from Fidelity were received in full after the end of the Year. The amount due
in respect of VAT refunds mainly comprises RTGS$-denominated VAT refunds. Increased delays in the
processing of VAT refunds by the Government of Zimbabwe has resulted in an increase in the amount
receivable in RTGS$ terms, however the outstanding balance has reduced in US Dollar terms due to the
devaluation of the RTGS$. The long-outstanding balances have either been repaid after the end of the Year
or have been recovered by way of offset against other tax payables due to the Government of Zimbabwe.
Trade receivables include $1,991 (2018: nil) in respect of deferred consideration due on the disposal of
Eersteling, the sale of which was concluded in the first quarter of 2019 and is discussed in section 4.11 of this
MD&A.
Non-current liabilities reduced from $34,687 as at December 31, 2018 to $9,486 at the end of the Year
mainly due to the conversion of a RTGS$ 6 million term facility and deferred tax liability into US Dollars
as these balances are denominated in RTGS$.
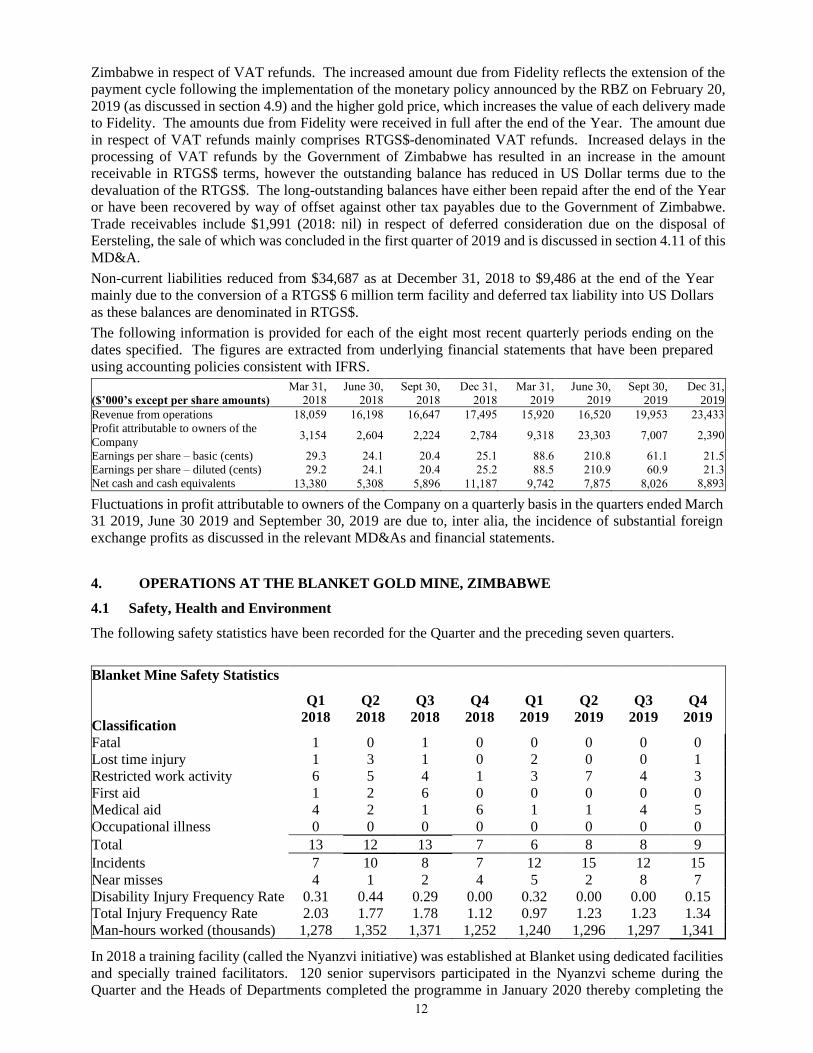
The following information is provided for each of the eight most recent quarterly periods ending on the
dates specified. The figures are extracted from underlying financial statements that have been prepared
using accounting policies consistent with IFRS.
($’000’s except per share amounts)
Mar 31,
2018
June 30,
2018
Sept 30,
2018
Dec 31,
2018
Mar 31,
2019
June 30,
2019
Sept 30,
2019
Dec 31,
2019
Revenue from operations 18,059 16,198 16,647 17,495 15,920 16,520 19,953 23,433
Profit attributable to owners of the
Company 3,154 2,604 2,224 2,784 9,318 23,303 7,007 2,390
Earnings per share – basic (cents) 29.3 24.1 20.4 25.1 88.6 210.8 61.1 21.5
Earnings per share – diluted (cents) 29.2 24.1 20.4 25.2 88.5 210.9 60.9 21.3
Net cash and cash equivalents 13,380 5,308 5,896 11,187 9,742 7,875 8,026 8,893
Fluctuations in profit attributable to owners of the Company on a quarterly basis in the quarters ended March
31 2019, June 30 2019 and September 30, 2019 are due to, inter alia, the incidence of substantial foreign
exchange profits as discussed in the relevant MD&As and financial statements.
4. OPERATIONS AT THE BLANKET GOLD MINE, ZIMBABWE
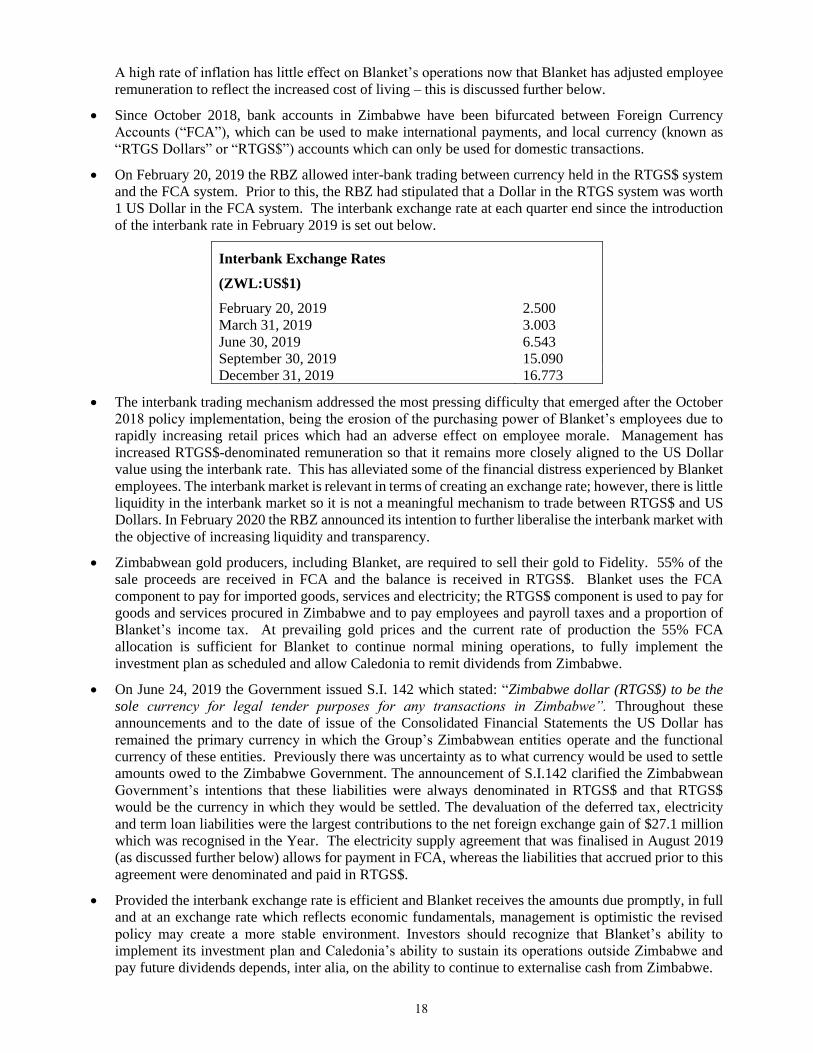
4.1 Safety, Health and Environment
The following safety statistics have been recorded for the Quarter and the preceding seven quarters.
Blanket Mine Safety Statistics
Classification
Q1
2018
Q2
2018
Q3
2018
Q4
2018
Q1
2019
Q2
2019
Q3
2019
Q4
2019
Fatal 1 0 1 0 0 0 0 0
Lost time injury 1 3 1 0 2 0 0 1
Restricted work activity 6 5 4 1 3 7 4 3
First aid 1 2 6 0 0 0 0 0
Medical aid 4 2 1 6 1 1 4 5
Occupational illness 0 0 0 0 0 0 0 0
Total 13 12 13 7 6 8 8 9
Incidents 7 10 8 7 12 15 12 15
Near misses 4 1 2 4 5 2 8 7
Disability Injury Frequency Rate 0.31 0.44 0.29 0.00 0.32 0.00 0.00 0.15
Total Injury Frequency Rate 2.03 1.77 1.78 1.12 0.97 1.23 1.23 1.34
Man-hours worked (thousands) 1,278 1,352 1,371 1,252 1,240 1,296 1,297 1,341
In 2018 a training facility (called the Nyanzvi initiative) was established at Blanket using dedicated facilities
and specially trained facilitators. 120 senior supervisors participated in the Nyanzvi scheme during the
Quarter and the Heads of Departments completed the programme in January 2020 thereby completing the
Page 13
13
training of Blanket’s entire workforce. As a result of this increased focus on safety training, there were no
fatal accidents and the number of accidents reduced from 45 in 2018 to 31 in the Year. Safety training is an
ongoing exercise and it will remain an area of focus for management.
4.2 Social Investment and Contribution to the Zimbabwean Economy
Blanket’s investment in community and social projects which are not directly related to the operation of the
mine or the welfare of Blanket’s employees, the payments made to the Gwanda Community Share Ownership
Trust (“GCSOT”) in terms of Blanket’s indigenisation, and payments of royalties, taxation and other non-
taxation charges to the Government of Zimbabwe and its agencies are set out in the table below.
Payments to the Community and the Zimbabwe Government
($’000’s)
Period Year
Community
and Social
Investment
Payments to
GCSOT
Payments to
Zimbabwe
Government
Total
Year 2013 2,147 2,000 15,354 19,501
Year 2014 35 - 12,319 12,354
Year 2015 50 - 7,376 7,426
Year 2016 12 - 10,637 10,649
Year 2017 5 - 11,988 11,993
Year 2018 4 - 10,140 10,144
Q1 2019 14 - 2,567 2,581
Q2 2019 27 - 2,360 2.387
Q3 2019 11 - 3,344 3,355
Q4 2019 - - 2,086 2,086
Year 2019 47 - 10,357 10,404
There is no legal requirement in Zimbabwe for mining companies to implement corporate and social
responsibility (“CSR”), but there is an increasing expectation from stakeholders in Zimbabwe and from
international investors that mining companies should do more to address social and environmental issues.
For many years Blanket has engaged in ad hoc CSR activities. In October 2019 Blanket’s board of directors
approved a formal CSR programme which is set out on Caledonia’s website. One aspect of Blanket’s CSR
activities is the employment of students on secondment from tertiary institutions. At any one time there are
up to 25 students on attachment at Blanket at a cost of $506 for the Year, such costs being included in
production costs.
Page 14
14
4.3 Gold Production
Tonnes milled, average grades, recoveries and gold produced during the Quarter, the preceding 11 quarters,
the Year, the years 2017, 2018 and 2019 and January and February 2020 are shown in the table below.
Blanket Mine Production Statistics
Year
Tonnes Milled
(t)
Gold Head
(Feed) Grade (g/t
Au)
Gold Recovery
(%)
Gold Produced
(oz)
Year 2016 510,661 3.30 93.0 50,351
Quarter 1 2017 124,225 3.42 93.7 12,794
Quarter 2 2017 136,163 3.08 92.8 12,518
Quarter 3 2017 136,064 3.52 93.6 14,396
Quarter 4 2017 150,755 3.62 93.6 16,425
Year 2017 547,207 3.41 93.4 56,133
Quarter 1 2018 123,628 3.48 93.4 12,924
Quarter 2 2018 132,585 3.19 92.8 12,657
Quarter 3 2018 151,160 3.12 92.6 13,978
Quarter 4 2018 153,540 3.27 92.8 14,952
Year 2018 560,913 3.26 92.9 54,511
Quarter 1 2019 122,389 3.26 93.4 11,948
Quarter 2 2019 135,847 3.11 93.2 12,712
Quarter 3 2019 142,706 3.19 93.2 13,646
Quarter 4 2019 155,389 3.61 93.8 16,876
Year 2019 556,331 3.31 93.4 55,182
January 2020 43,774 3.42 93.9 4,509
February 2020 46,311 3.29 93.5 4,579
Gold production for the Quarter was 13% higher than the comparable quarter and 24% higher than the
previous quarter. Gold production for the Year was 1.2% higher than in 2018. The higher production for
the Quarter and the Year was mainly due to increased grade and higher recovery; higher production in the
Quarter was also due to higher tonnes milled. Tonnes milled and grade are discussed in section 4.4 of this
MD&A; gold recoveries are discussed in section 4.5 of this MD&A.
Production in January and February showed a continuation of the higher daily tonnes mined, improved grade
and recovery compared to the first three quarter of 2018.
4.4 Underground
Tonnes milled in the Quarter were 1.2% higher than the comparable quarter and 8.9% higher than the
preceding quarter. Tonnes milled in the Year were 0.8% lower than the previous year.
In the early part of the Year, production was affected by excessive breakdowns on equipment due to a
shortage of foreign currency to buy the necessary spares and low employee morale due to the reduction in
workers’ spending power due to the high level of inflation. Low morale manifested itself in more
unauthorised employee absences and desertions which affected production due to the resulting lost shifts.
Low morale was addressed by adjusting worker’s remuneration as discussed in section 4.9. Employee morale
was further improved by the introduction of a new production incentive scheme in the Quarter which rewards
more directly those production teams that perform to the required level. Production in the Quarter also
benefited from improved management attention to enforce daily targets and production standards.
Production in the period July to the middle of August 2019 was adversely affected by electricity outages; the
electricity supply situation improved from mid-August although there were further power interruptions in
October 2019. The electricity supply situation in Zimbabwe is discussed further in section 4.9 of this MD&A.
During the Quarter, Blanket commissioned a further 6MW of diesel generators. Blanket now has 18MW of
installed diesel generators which is sufficient to maintain production and allow work to continue on the
Central Shaft. However, diesel generators are not a long-term solution to the electricity problem: diesel
power is expensive and requires large quantities of diesel which may not always be available. Management
Page 15
15
is evaluating a range of solutions to this problem as discussed in section 4.9 of this MD&A.
The grade in the Quarter was 10.4% higher than the comparable quarter and 13.2% higher than the preceding
quarter. Grade in the Year was 1.5% higher than in 2018. Grade improved following the re-introduction of
underhand stoping in the narrow stopes along with additional measures to enhance safety which reduced
mining dilution. Mining dilution was also reduced by the improved training of drill operators, intensified
geological control, reviewing blasting techniques and technology and reducing the sublevel vertical spacing
from 15 meters to 10 meters.
The improved level of daily ore production and the achievement of planned grades compared to the first three
quarters of 2018 has continued into January and February 2020. The new bonus system that was introduced
in July 2019 encourages workers to fulfil their daily development target as well as their production target.
Primary development advanced in the Quarter by 3,392 meters compared to 2,662 meters in the previous
quarter and 1,911 in the comparable quarter.
4.5 Metallurgical Plant
Plant throughput in the Quarter was 73.1 tonnes per hour (“tph”) compared to 72.3 tph in the previous quarter.
Recoveries in the Quarter were 93.8% compared to 93.2% in the previous quarter.
Recoveries improved following the commissioning of the new oxygen plant in October 2019. A full
assessment of the effect of the new oxygen plant can only be made after the introduction of an upgraded
oxygen sparging system in the first quarter of 2020. The new oxygen plant has already resulted in a reduction
in cyanide consumption from 0.88kg per tonne milled before the plant was commissioned to 0.79 kg per
tonne milled by the end of the Quarter.
4.6 Production Costs
A narrow focus on the direct costs of production (mainly labour, electricity and consumables) does not fully
reflect the total cost of gold production. Accordingly, cost per ounce data for the Quarter and the comparable
quarter have been prepared in accordance with the Guidance Note issued by the World Gold Council on June
23, 2013 and is set out in the table below on the following bases:
i. On-mine cost per ounce4, which shows the on-mine costs of producing an ounce of gold and includes
direct labour, electricity, consumables and other costs that are incurred at the mine including insurance,
security and on-mine administration;
ii. All-in sustaining cost per ounce4, which shows the on-mine cost per ounce plus royalty paid, additional
costs incurred outside the mine (i.e. at offices in Harare, Johannesburg, London and Jersey), costs
associated with maintaining the operating infrastructure and resource base that are required to maintain
production at the current levels (sustaining capital investment), the share-based expense (or credit)
arising from the LTIP awards less silver by-product revenue. The all-in sustaining cost also includes as
a credit (i.e. as a deduction from costs) the gold support price (or its predecessor); and
iii. All-in cost per ounce4, which shows the all-in sustaining cost per ounce plus the costs associated with
activities that are undertaken with a view to increasing production (expansion capital investment).
Cost per Ounce of Gold Sold
(US$/ounce)
3 Months to December 31 12 Months to December 31
2018 2019 2018 2019
On-mine cost4 688 603 690 651
All-in sustaining cost4 774 806 802 820
All-in cost4 1,007 1,147 1,128 1,188
4 On-mine cost per ounce, all-in sustaining cost per ounce and all-in cost per ounce are non-IFRS measures. Refer to
section 10 for a reconciliation of these amounts to IFRS
Page 16
16
Per-ounce costs are calculated based on gold ounces sold and not produced, so that an accurate value can be
ascribed to the royalty and the ECI. A reconciliation of costs per ounce to IFRS production costs is set out
in section 10.
On-Mine costs
On-mine cost comprises labour, electricity, consumables and other costs such as security and insurance.
Production costs are detailed in note 9 to the Consolidated Financial Statements. The on-mine cost per ounce
of gold sold in the Quarter decreased by 12.3% compared to the comparable quarter due to the higher grade
and higher recovery and lower costs of electricity and other costs, the combined effect of which was offset
somewhat by higher labour and consumable costs.
As discussed in section 4.4, the grade in the Quarter was higher than the comparable quarter. A higher grade
reduces the on-mine cost per ounce which is generally related to tonnes of production – if each tonne mined
and processed contains more gold, a higher grade will result in a lower cost per ounce even if costs remain
unchanged.
Labour costs in the Quarter and the Year were higher than the comparable periods due to production bonuses;
labour costs per ounce of gold produced were lower than the comparable quarter due to the higher production
which offset the effect of the higher monetary value.
Consumable costs for the Quarter and the Year were higher than in the comparable periods due to the
increased cost of maintaining the underground trackless equipment; consumable costs for the Year also
increased due to the increased consumption rate for cyanide before the commissioning of the new oxygen
plant in October 2019 as discussed in section 4.5.
The electricity cost in the Quarter and the Year was lower due to the implementation of the new power supply
arrangements from mid-August as outlined in section 4.9. The lower cost for the Year was also the result of
the low US-Dollar denominated cost of power arising in the first half of 2019 when the cost of Blanket’s grid
power was denominated in local currency which depreciated substantially against the US Dollar.
Other costs comprise a small component of on-mine costs; these costs were reduced in the Quarter and the
Year as they are largely denominated in local currency which depreciated substantially against the US Dollar.
All-in sustaining costs
All-in sustaining costs for the previous year and for the comparable quarter were reduced by $6.5 million and
$1.8 million respectively due to other income received in terms of the ECI which is discussed in section 4.9
of this MD&A. On a cost per ounce basis, the benefit of the ECI was $118 per ounce for 2018 and $126 per
ounce for the comparable quarter. After adjusting for the benefit arising from the ECI, all-in sustaining costs
for the Year and the Quarter were approximately 7% and 10% lower respectively than the previous year and
the comparable quarter. The reduction is due to lower on-mine costs as discussed above, lower administrative
expenses and lower sustaining capital expenditure. Administrative expenses which are detailed in note 13 to
the Consolidated Financial Statements were reduced due to inter alia lower expenditure on investor relations
and reduced costs associated with Eersteling following its sale as discussed in section 4.11 of this MD&A.
All-in costs
All-in costs include investment in expansion projects which remained at a high level in the Quarter due to
the continued investment at Blanket, as discussed in section 4.7 of this MD&A.
4.7 Capital Projects
The main capital development project is the Central Shaft which will allow for three new production levels
below the current operations; a fourth level is intended to be added in due course via a decline construction.
Shaft sinking commenced in early 2015 and the shaft reached its target depth of 1,204 metres (approx. 4,000
feet) in July 2019. Work on equipping the shaft has commenced and it is expected to be commissioned in
the last quarter of 2020 after which production ramp up can commence: production in 2021 is expected to
be approximately 75,000 ounces, increasing to the target rate of 80,000 ounces in 2022.
Work on underground development was hampered by the unstable electricity supply which has caused
frequent power interruptions and by systemic power outages due to the general lack of electricity in
Page 17
17
Zimbabwe as discussed in section 4.9. In the Quarter further diesel generators were installed so that work at
Central shaft can continue uninterrupted throughout any interruptions to the electricity supply from the grid.
In addition to the Central shaft, work continued on decline developments at the AR South, AR Main and
Eroica ore bodies, preparations commenced for a further decline at the Blanket orebody and work continued
on haulages on the 870m level. In total 417 meters of development were achieved in the Quarter compared
to 267 meters in the comparable quarter; 1,504 meters were achieved in the Year compared to 1,745 meters
in 2018.
4.8 Indigenisation
Transactions that implemented the indigenisation of Blanket (which expression in this section and in certain
other sections throughout this MD&A refers to the Zimbabwe company that owns Blanket Mine) were
completed on September 5, 2012 following which Caledonia owned 49% of Blanket and received a
Certificate of Compliance from the Government of Zimbabwe which confirms that Blanket is fully compliant
with the Indigenisation and Economic Empowerment Act.
Following the appointment of the new President in late 2017 the requirement for gold mining companies to
be indigenised was removed by a change in legislation with effect from March 2018. On November 6, 2018,
the Company announced that it had entered into a sale agreement with Fremiro to purchase Femiro’s 15%
shareholding in Blanket for a gross consideration of $16.7 million which was to be settled through a
combination of the cancellation of the loan between the two entities which stood at $11.5 million as at June
30, 2018 and the issue of 727,266 new shares in Caledonia at an issue price of $7.15 per share. This
transaction was completed on January 20, 2020 as a result of which Caledonia has a 64% shareholding in
Blanket and Fremiro holds approximately 6.3% of Caledonia’s enlarged issued share capital.
As a 64% shareholder, Caledonia receives 64% of Blanket’s dividends plus the repayment of vendor
facilitation loans which were extended by Blanket to certain of the indigenous shareholders. The outstanding
balance of the facilitation loans as at December 31, 2019 was $31.0 million (December 31, 2018: $31.0
million). On completion of the Fremiro transaction (described above) the outstanding facilitation loans were
reduced by the cancellation of the loan due from Fremiro. The facilitation loans (including interest thereon)
are repaid by way of dividends from Blanket; 80% of the dividends declared by Blanket which are attributable
to the beneficiaries of the facilitation loans are used to repay such loans and the remaining 20%
unconditionally accrues to the respective indigenous shareholders. Blanket declared dividends which
resulted in a small reduction on the outstanding balance of the facilitation loans after accrued interest. The
dividends attributable to GCSOT, which holds 10% of Blanket, are withheld by Blanket to repay the advance
dividends which were paid to GCSOT in 2012 and 2013 and which had an outstanding balance of $1.63
million at December 31, 2019 (December 31, 2018; $2.19 million). In February 2020, Blanket agreed to a
request from GCSOT that the terms of the debt relating to the repayment of the advance dividend be amended
so that GCSOT might receive 20% of its attributable dividend and the balance of 80% will be applied to
repay the advance dividend.
The facilitation loans are not shown as receivables in Caledonia’s financial statements in terms of IFRS.
These loans are effectively equity instruments as their only means of repayment is via dividend distributions
from Blanket. Caledonia continues to consolidate Blanket for accounting purposes. Further information on
the accounting effects of indigenisation at Blanket is set out in note 6 to the Consolidated Financial
Statements and in a Frequently Asked Questions page which is available on Caledonia’s website.
4.9 Zimbabwe Commercial Environment
Monetary Conditions
The current situation in Zimbabwe can be summarized as follows:
• There continues to be a shortage of foreign currency in Zimbabwe, although in recent months Blanket
has had satisfactory access to foreign exchange due to the higher gold price and increased production.
• The rate of annual inflation increased from 5% in September 2018 to approximately 500% by December
2019. The Zimbabwe Government no longer releases annualised inflation data, but it is widely accepted
that the rate of inflation although still high has moderated to approximately 80% per annum in early 2020.
Page 18
18
A high rate of inflation has little effect on Blanket’s operations now that Blanket has adjusted employee
remuneration to reflect the increased cost of living – this is discussed further below.
• Since October 2018, bank accounts in Zimbabwe have been bifurcated between Foreign Currency
Accounts (“FCA”), which can be used to make international payments, and local currency (known as
“RTGS Dollars” or “RTGS$”) accounts which can only be used for domestic transactions.
• On February 20, 2019 the RBZ allowed inter-bank trading between currency held in the RTGS$ system
and the FCA system. Prior to this, the RBZ had stipulated that a Dollar in the RTGS system was worth
1 US Dollar in the FCA system. The interbank exchange rate at each quarter end since the introduction
of the interbank rate in February 2019 is set out below.
Interbank Exchange Rates
(ZWL:US$1)
February 20, 2019 2.500
March 31, 2019 3.003
June 30, 2019 6.543
September 30, 2019 15.090
December 31, 2019 16.773
• The interbank trading mechanism addressed the most pressing difficulty that emerged after the October
2018 policy implementation, being the erosion of the purchasing power of Blanket’s employees due to
rapidly increasing retail prices which had an adverse effect on employee morale. Management has
increased RTGS$-denominated remuneration so that it remains more closely aligned to the US Dollar
value using the interbank rate. This has alleviated some of the financial distress experienced by Blanket
employees. The interbank market is relevant in terms of creating an exchange rate; however, there is little
liquidity in the interbank market so it is not a meaningful mechanism to trade between RTGS$ and US
Dollars. In February 2020 the RBZ announced its intention to further liberalise the interbank market with
the objective of increasing liquidity and transparency.
• Zimbabwean gold producers, including Blanket, are required to sell their gold to Fidelity. 55% of the
sale proceeds are received in FCA and the balance is received in RTGS$. Blanket uses the FCA
component to pay for imported goods, services and electricity; the RTGS$ component is used to pay for
goods and services procured in Zimbabwe and to pay employees and payroll taxes and a proportion of
Blanket’s income tax. At prevailing gold prices and the current rate of production the 55% FCA
allocation is sufficient for Blanket to continue normal mining operations, to fully implement the
investment plan as scheduled and allow Caledonia to remit dividends from Zimbabwe.
• On June 24, 2019 the Government issued S.I. 142 which stated: “Zimbabwe dollar (RTGS$) to be the
sole currency for legal tender purposes for any transactions in Zimbabwe”. Throughout these
announcements and to the date of issue of the Consolidated Financial Statements the US Dollar has
remained the primary currency in which the Group’s Zimbabwean entities operate and the functional
currency of these entities. Previously there was uncertainty as to what currency would be used to settle
amounts owed to the Zimbabwe Government. The announcement of S.I.142 clarified the Zimbabwean
Government’s intentions that these liabilities were always denominated in RTGS$ and that RTGS$
would be the currency in which they would be settled. The devaluation of the deferred tax, electricity
and term loan liabilities were the largest contributions to the net foreign exchange gain of $27.1 million
which was recognised in the Year. The electricity supply agreement that was finalised in August 2019
(as discussed further below) allows for payment in FCA, whereas the liabilities that accrued prior to this
agreement were denominated and paid in RTGS$.
• Provided the interbank exchange rate is efficient and Blanket receives the amounts due promptly, in full
and at an exchange rate which reflects economic fundamentals, management is optimistic the revised
policy may create a more stable environment. Investors should recognize that Blanket’s ability to
implement its investment plan and Caledonia’s ability to sustain its operations outside Zimbabwe and
pay future dividends depends, inter alia, on the ability to continue to externalise cash from Zimbabwe.
Page 19
19
Gold support price
Blanket sells gold to Fidelity and is contractually entitled to receive a price which is 98.75% of the price
fixed by the London Bullion Market Association (the “LBMA price”). 55% of Blanket’s proceeds are
received in US Dollars and the remainder is received in RTGS$ using the interbank exchange rate for
RTGS$ and US Dollars.
Prior to February 20, 2019, Blanket in common with the other gold producers, received the ECI which was
a 10% premium to the LBMA price. On February 27, 2019 Caledonia announced the termination of the
ECI programme and the financial effect thereof.
From March 6, 2019 it became apparent that Blanket’s sales proceeds received from Fidelity were
calculated at a gross price of $44,000 per kilogram ($1,368.58 per ounce), which exceeded the prevailing
LBMA price. On May 12, 2019 the Company received confirmation from Fidelity of this arrangement,
called the “gold support price”, which was implemented to incentivize gold producers to increase gold
production. The gold support price had not been increased as the LBMA gold price has subsequently
increased above $1,368.58 per ounce; Caledonia has no information whether the gold support price would
be re-introduced if the LBMA price fell below $1,368.58 per ounce.
As the LBMA gold price exceeded the gold support price on each delivery date since early June 2019 there
was no income in respect of the gold support price for the remainder of the Year. The income arising from
the ECI and the gold support price in previous quarters was included as “Government Grant - Other
Income”.
Electricity supply
Zimbabwe’s electricity generation is mainly from the Kariba hydro station on the Zambezi and the Hwange
coal-fired station with several other much smaller coal-fired power stations. Even if Zimbabwe’s installed
generating capacity is fully operational, it cannot generate enough electricity to meet its requirements and
therefore Zimbabwe imports electricity from Mozambique and South Africa. Since 2010 Blanket Mine,
along with most other gold producers, had a supply agreement with the Zimbabwe Electricity Supply
Authority (“ZESA”) in terms of which the consumers paid a premium rate in return for un-interrupted
power. This agreement expired on December 31, 2018 and was not renewed as ZESA demanded that
payment should be in US Dollars, which was neither practical (due to insufficient access to US Dollars)
nor permissible in terms of the prevailing Zimbabwean foreign exchange controls.
The generating capacity at the Kariba hydro generating station has been significantly reduced due to low
water levels caused by insufficient rain in the catchment area. In addition, in July and early August 2019,
South Africa reduced its deliveries of electricity to Zimbabwe due to non-payment for historic deliveries.
In October 2019 the export of electricity from South Africa was further interrupted due to a lack of
generating capacity in South Africa.
The combined effect of these factors is that Zimbabwe experiences a severe electricity shortage and has
resorted to “load-shedding” whereby electricity consumers experience prolonged power outages. Initially
the load-shedding targeted domestic consumers; however, from early July 2019, Blanket and other
industrial users experienced substantial interruptions to their electricity supply. In the case of Blanket which
has a maximum demand of 18MW, in July and early August 2019 it was regularly required to reduce its
consumption by up to 8 MW for periods of up to 16 hours each day. As a result of load-shedding, Blanket’s
use of diesel for generating electricity increased from approximately 30,000 litres per month in 2018 to
265,000 litres in July 2019. The recurrence of load-shedding in October was less severe and Blanket was
required to reduce consumption by up to 4MW for periods of up to 10 hours per day.
Blanket and Caledonia management had constructive engagement with the relevant authorities both directly
and via the Chamber of Mines to find an urgent resolution to this matter. All parties understand that without
sufficient power, Zimbabwe’s gold production and hence its ability to earn foreign exchange, will be very
severely affected if the gold industry does not receive sufficient power to maintain production.
Although it is hoped that power production from Kariba will increase when water levels return to normal,
it is likely that Zimbabwe will continue to experience severe electricity shortages due to the continued
difficulties experienced by the South African state-owned electricity generator, which has been a
substantial supplier to Zimbabwe.
Page 20
20
An additional difficulty, which Blanket has experienced for many months, is that the electricity supply
from the grid is highly unstable and is subject to frequent surges and dips in voltage. Power surges, if not
controlled, cause severe damage to Blanket’s electrical equipment. Blanket has therefore installed its own
equipment to regulate the incoming power; however, this equipment was itself damaged by the incoming
supply although it was repaired and re-installed in the previous quarter.
Caledonia’s approach to the electricity situation is threefold:
i. continue to engage constructively with ZESA with the objective of securing cheap, reliable and
stable power from the grid. This includes agreeing a realistic electricity pricing formula in the
context of the current monetary conditions; assisting ZESA to repair and maintain its own
equipment and participating in an industry-wide scheme to import power. On August 9, 2019
Blanket signed a new power supply agreement in terms of which Blanket will receive un-
interrupted power in return for an FCA-denominated tariff which, although cheaper than the tariff
which prevailed until December 31, 2018, is still sufficient to allow ZESA to import power so
that (subject to the availability of power in neighbouring countries) it can keep its supply
commitment to the participants in the scheme. This arrangement has worked reasonably well,
although Blanket continues to experience less severe outages during periods when South Africa’s
own electricity system has come under pressure;
ii. increase Blanket’s stand-by diesel generating capacity. Blanket commissioned a further 6MW of
diesel generators in the Quarter and it now has 18MW of installed diesel generators which is
sufficient to maintain production and allow work to continue on the Central Shaft. However,
diesel generators are not a long-term solution to the electricity problem: diesel power is expensive
and requires large quantities of diesel which is environmentally damaging and is not always easily
available; and
iii. explore the installation of a solar power plant to supply some or all of Blanket’s requirements.
Management is currently completing financial and technical evaluations of a solar project and has
received a generating licence so that it can move quickly if the evaluations indicate that a solar
project will be cost effective. Caledonia ran a tender process during the Quarter to identify a
party either to build and sell the solar plant to Caledonia or to own and operate the solar plant and
sell the power to Blanket. Caledonia and its advisers are currently evaluating the proposals it has
received from interested parties and is considering various funding options.
Water supply
Blanket uses water in the metallurgical process, some of which is pumped from the deeper levels of the
mine but most of which is obtained from the “Blanket dam” (which, despite its name, is neither owned nor
managed by Blanket Mine) which also supplies water to the nearby town of Gwanda. Blanket is situated
in a semi-arid region and rainfall typically only occurs in the period November to February. The 2018/19
rainy season was very poor and the 2019/2020 rainy season was somewhat late but has improved in recent
weeks. Water levels in the dam are lower than usual and the water authority has released water from an
upstream dam to replenish the Blanket dam. Management believes that, with careful management, there is
enough water in the Blanket dam to maintain normal operations until the start of the next rainy season in
late 2020. As a precautionary measure, Blanket intends to resuscitate existing boreholes and determine
their yield; conduct hydrological surveys to identify potential new boreholes; recycle water from the lower
levels of unused workings and construct a pond to store water that is pumped from current workings.
Taxation
The main elements of the Zimbabwe tax regime insofar as it affects Blanket Mine and Caledonia are as
follows:
• A royalty is levied on gold revenues at a rate of 5%. Historically, the royalty has not been an
allowable deduction for the purposes of calculating taxable profits. In the Mid-Year Budget
Review, published on August 1, 2019 it was announced that with effect from January 1, 2020 the
royalty would be allowable as a deductible expense. It was also announced that from September
1, 2019 the royalty rate would be calculated on a sliding scale based on gold prices: a royalty rate
Page 21
21
at 3% will apply if the gold price is below $1,200 and a royalty of 5% will apply if the gold price
is over $1,200 per ounce. This proposal will reduce the royalty and tax burden on Blanket:
illustratively, the effect of these changes for each 10,000 ounces per annum of gold production at
an assumed gold price of $1,450 per ounce would be a post-tax benefit of approximately $186.
• Income tax is levied at 25.75% on profits as adjusted for tax purposes. The main adjustments to
profit for the purposes of calculating tax are the add-back of depreciation, most of the management
fees paid by Blanket to Caledonia’s subsidiary in South Africa and the royalty on gold sales. 100%
of all capital expenditure incurred in the year of assessment is allowed as a deductible expense. As
noted above, the Zimbabwe Government proposed that the royalty would be deductible for income
tax purposes with effect from January 1, 2020.
• Withholding tax is levied on certain remittances from Zimbabwe i.e. dividend payments from
Zimbabwe to the UK and payments of management fees from Blanket to Caledonia in South
Africa.
• In June 2019 the Zimbabwe Revenue Authority (“ZIMRA”) issued Public Notice 26 (“PN26”)
effective from February 22, 2019. PN26 provided clarity on the interpretation of Section 4 (a) of
the Finance Act [Chapter 23.04] of Zimbabwe, that requires a company earning taxable income to
pay tax in the same or other specified currency that the income is earned. PN 26 clarifies that the
calculation of taxable income be performed in RTGS$ and that the payment of the taxable payable,
determined in RTGS$, be paid in the ratio of turnover earned in FCA and RTGS$. The application
of PN26 resulted in a significant reduction in the deferred tax liability at December 31, 2019 and
the Group recorded the best estimate of the tax liability.
4.10 Opportunities and Outlook
Central Shaft Project to Increase Production and Extend Mine Life
As discussed in section 4.7 the Company has sunk a new shaft to a depth of 1,204 meters. Once
commissioned, the shaft should allow production to increase to the targeted rate of approximately 80,000
ounces per annum from 2022 onwards. Subject to the continued availability of foreign currency (as discussed
in section 4.9), Caledonia intends to continue to implement the Central Shaft project.
Production Guidance
Production for the Year was 55,182 ounces, which exceeded the guidance range of 50,000 to 53,000 ounces
due mainly to the improved grade which was achieved in the Quarter for the reasons set out in Section 4.4 of
the MD&A. Production guidance for 2020 is between 53,000 and 56,000 ounces. This is forward looking
information as defined by National Instrument 51-102. Refer to section 18 of this MD&A for further
information on forward looking statements.
Cost Guidance
The estimated on-mine cost for 2019 was in the range of $735 to $817 per ounce and the estimated AISC for
2019 was a range of $933 to $1,022 per ounce. The actual on-mine cost per ounce for the Year was $651
and actual AISC per ounce for the Year was $820 - lower than guidance. Costs are discussed further in
section 4.6 but were generally better than guidance due to higher than expected production (particularly
arising from improved grade), a lower electricity cost and continued close attention to controlling costs.
On-mine cost guidance for 2020 is in the range of $693 to $767 per ounce; guidance for AISC is $951 to
$1,033 per ounce. The guidance for on-mine cost per ounce is higher than the on-mine cost per ounce in
2019 because costs in early 2019 benefitted from a one-time reduction in the cost of electricity as a result of
the depreciation of the local currency. On mine costs in 2020 are also expected to be higher than in 2019 due
to higher maintenance costs for the underground fleet of trackless equipment which is used in the declines.
The guidance for AISC per ounce in 2020 is higher than AISC per ounce in 2019 – the increase is largely
due to the projected increase in on-mine costs and the removal of the gold support price as discussed in
section 4.9
This is forward looking information as defined by National Instrument 51-102. Refer to section 18 of this
MD&A for further information on forward looking statements.
Page 22
22
Earnings Guidance
Guidance for adjusted earnings per share for 2019 was in the range of 86 to 117 cents per share. This guidance
was issued in the MD&A published on March 20, 2019 and reflected the Company’s production and cost
guidance cost and assumed a gold price for the Year of $1,300 per ounce.
On January 30, 2020 the Company issued guidance for earnings per share for the Year on an IFRS basis of
between 380 to 400 cents per share and for earnings per share adjusted to remove net realized and unrealized
foreign exchange profits of 155 to 175 cents per share. Actual earnings per share for the Year on an IFRS
basis were 382 cent per share and were towards the bottom end of the guidance range due to a revision in the
calculation of the taxation charge, primarily relating to the appropriate exchange rate to apply in the
calculation of the annual tax charge. Actual IFRS earnings per share adjusted to exclude foreign net realized
and unrealised foreign exchange profits were 151 cents per share - slightly lower than the bottom end of the
guidance range issued on January 30, 2021 due to the revision in the taxation charge noted above. Adjusted
earnings per share for the Year excluding all foreign exchange gains and inter alia, deferred tax and the
proceeds of the sale of Eersteling were 146 cents. The calculation of adjusted earnings per share is set out in
section 10.3 of the MD&A.
Strategy
Caledonia’s strategic focus is on implementing the Central Shaft project at Blanket on schedule and within
budget. Subject to the continued availability of foreign currency, Caledonia’s board and management believe
the successful implementation of the Central Shaft remains in the best interests of all stakeholders because it
is expected to result in increased production, reduced operating costs and greater flexibility to undertake
further exploration and development, thereby safeguarding and enhancing Blanket’s long-term future.
Caledonia will also evaluate further investment opportunities in Zimbabwe that would not fall underneath
Blanket’s ownership.
4.11 Sale of Eersteling
On May 31, 2018 the Group entered into an amended share sale agreement to sell the shares and claims of
Eersteling, a South African subsidiary which was previously consolidated as part of the Group and was on
care and maintenance since 1997. The amended share sale agreement allowed for a purchase price of $3
million to be settled by three payments of $1 million payable on the completion date, 12 and 18 months after
the completion date. On January 31, 2019 all suspensive conditions for the sale were met, ZAR13.9 million
($1 million) was received as payment towards the purchase price and the Group transferred the registered
and beneficial ownership of Eersteling to the purchaser.
The disposal of Eersteling gave rise to a profit of $5,409 in the first quarter of 2019, which comprises the fair
value of the consideration (including the deferred consideration) of $1,953, a reversal of $2,109 of cumulative
foreign currency translation reserves and net liabilities derecognised of $347.
As at December 31, 2019 there was a deferred consideration receivable $1,953 which is due in two tranches
on January 31, 2020 and July 30, 2020.
5 EXPLORATION
Caledonia’s exploration activities are focussed on the growth and development of Blanket Mine.
There was no deep exploration drilling in the Quarter as all the available drilling sites had been drilled out in
accordance with the annual budget. 9,824 meters were drilled in the Year compared to 18,551 meters in the
previous year. Deep level exploration drilling will re-commence after the Central Shaft and the related
development has been completed to provide access to new drilling positions.
As discussed in section 15 of this MD&A, in January 2020 Ms Janet Hobkirk joined Caledonia as Group
Mineral Resource Manager. Ms Hobkirk will be responsible for driving Caledonia’s exploration activities
both at Blanket and any new properties.
Page 23
23
6. INVESTING
An analysis of investment in the Quarter, the preceding quarters and the years 2017 and 2018 is set out below.
($’000’s) 2017
Year
2018
Year
2019
Q1
2019
Q2
2019
Q3
2019
Q4
2019
Year
Total Investment 20,949 19,915 5,209 4,208 5,636 5,542 20,595
Blanket 20,939 19,900 5,045 4,203 5,636 5,416 20,300
Other 10 15 164 5 0 126 295
Investment at Blanket is in terms of the investment plan that was announced in October 2014 and which is
discussed in section 4.7 of this MD&A. Investment that takes place other than at Blanket largely comprises
capital items that are purchased by Caledonia in South Africa which will be sold on to Blanket in due course.
All further investment at Blanket is expected to be funded from Blanket’s internal cash flows and its
Zimbabwean borrowing facilities.
7. FINANCING
Caledonia financed all its operations using funds on hand and those generated by its operations. No equity
financing took place in the Quarter or the Year. The Company currently has no plans to raise equity. The
Company has no debt other than loan facilities which are held by Blanket and which were as set out below
as at December 31, 2019:
Blanket Debt facilities
Lender Date drawn Principal
value
Balance drawn
at December
31, 2019
Repayment
terms
Security
Term Facilities
Stanbic Bank
Zimbabwe Limited
December
2018
RTGS$ 6
million
RTGS$ 6
million
Single bullet in
December 2021
Unsecured
First Capital Bank
Limited
October
2019
RTGS$ 35
million
RTGS$ 35
million
4 equal
quarterly
installments
commencing
December 2020
Unsecured
Overdraft facilities
Stanbic Bank
Zimbabwe Limited
August 2019 RTGS15
million
Nil On demand Unsecured
First Capital Bank
Limited
October
2019
RTGS$10
million
RTGS$ 8.2
million
On demand Unsecured
Due to the continued devaluation of the RTGS$, loan facilities denominated in RTGS$ have substantially
reduced in US Dollar terms which has eroded Blanket’s working capital. Blanket continues efforts to
maintain its RTGS$ denominated borrowing facilities
Page 24
24
8. LIQUIDITY AND CAPITAL RESOURCES
An analysis of Caledonia’s capital resources as at December 31, 2019 and at the end of each of the preceding
5 quarters is set out below.
Liquidity and Capital Resources
($’000’s)
As at Sept 30
2018
Dec 31
2018
Mar 31
2019
June 30
2019
Sept 30
2019
Dec 31
2019
Overdraft 3,931 - - - - 490
Term facility 374 5,960 1,987 912 424 2,471
Cash and cash equivalents in the statement
of cashflows (net of overdraft) 5,896 11,187 9,742 7,875 8,026 8,893
Working capital 10,151 15,970 14,498 16,447 17,614 20,489
Movements in Caledonia’s net cash, the overdraft and working capital and an analysis of the sources and
uses of Caledonia’s cash are discussed in section 3 of this MD&A. The overdraft and term facilities are held
by Blanket with Zimbabwean banks with security and repayment periods as detailed in section 7. The
Company’s liquid assets as at December 31, 2019 plus anticipated cashflows exceed its planned and
foreseeable commitments as set out in section 9 of this MD&A.
9. OFF-BALANCE SHEET ARRANGEMENTS, CONTRACTUAL COMMITMENTS AND
CONTINGENCIES
There are no off-balance sheet arrangements apart from the facilitation loans of $30.97 million which are not
reflected as loans receivable for IFRS purposes (refer to note 6 of the Consolidated Financial Statements).
The Company had the following contractual obligations at December 31, 2019:
Payments due by Period
($’000’s)
Falling due
Within 1
year 1-3 Years 4-5 Years
After 5
Years Total
Trade and other payables 8,697 - - - 8,697
Term loan 529 1,942 - - 2,471
Provisions 124 708 144 2,370 3,346
Capital expenditure commitments 371 - - - 371
Total 9,721 2,650 144 2,370 14,885
The capital expenditure commitments relate primarily to materials and equipment which have been ordered
by Caledonia in South Africa to equip the Central Shaft. In addition to the committed purchase obligations
set out above, Blanket currently intends to invest approximately $21.1 million between January 2020 and
December 2020 which is not yet committed and a further $23 million in the years 2021 and 2022, which is
also uncommitted. The committed and uncommitted investment will be used to maintain Blanket’s existing
operations and implement the Central Shaft which is discussed in section 4.7 of this MD&A. Committed
and uncommitted purchase obligations are expected to be met from the cash generated from Blanket’s
existing operations and Blanket’s existing borrowing facilities. The Group leases property for its
administrative offices in Jersey, Johannesburg; following the implementation of IFRS 16 the Group
recognises the liabilities for these leases. As of December 31, 2019, Caledonia had potential liabilities for
rehabilitation work on Blanket – if and when the mine is permanently closed – at an estimated discounted
cost of $3.3 million.
10. NON-IFRS MEASURES
Throughout this document, we have provided measures prepared in accordance with IFRS in addition to
some non-IFRS performance measures for investors who use them to evaluate our performance. Since there
Page 25
25
is no standard method for calculating non-IFRS measures, they are not a reliable way to compare Caledonia
against other companies. Non-IFRS measures should be used along with other performance measures
prepared in accordance with IFRS. We have defined below the non-IFRS measures we have used in this
document and provide a reconciliation of such non-IFRS measures to the IFRS measures we report.
10.1 Cost per ounce
Non-IFRS performance measures such as “on-mine cost per ounce”, “all-in sustaining cost per ounce” and
“all-in cost per ounce” are used in this document. Management believes these measures assist investors and
other stakeholders in understanding the economics of gold mining over the life-cycle of a mine. These
measures are calculated on the basis set out by the World Gold Council in a Guidance Note published on
June 23, 2013 and accordingly differ from the previous basis of calculation. The table below reconciles “on-
mine cost per ounce”, “all-in sustaining cost per ounce” and “all-in cost per ounce” to the production costs
shown in the financial statements which have been prepared under IFRS.
Reconciliation of IFRS Production Cost to Non-IFRS Costs per ounce
($’000’s unless otherwise indicated)
3 Months to December 31
12 Months to December 31
2018 2019 2018 2019
Production cost (IFRS) 10,060 9,650 39,315 36,400
Cash-settled share-based expense (43) (34) (43) (107)
Less exploration and site restoration costs (255) (234) (1,003) (826)
Other cost and intercompany adjustments 222 304 (395) 212
On-mine production cost 9,984 9,686 37,874 35,679
Gold sales (oz) 14,510 16,053 54,899 54,801
On-mine costs per ounce ($/oz) 688 603 690 651
Royalty 877 1,172 3,426 3,854
ECI and gold support price (1,830) - (6,482) (1,930)
Exploration, remediation and permitting
cost
63 108 305 416
Sustaining capital expenditure 459 93 2,154 565
Administrative expenses 1,840 1,686 6,465 5,637
Silver by-product credit (14) (20) (61) (64)
Share-based payment expense (151) 210 315 689
Share-based payment expense included in
production cost
- - 43 107
All in sustaining cost 11,228 12,935 44,039 44,953
Gold sales (oz) 14,510 16,053 54,899 54,801
All-in sustaining costs per ounce ($/oz) 774 806 802 820
All-in sustaining cost per ounce
excluding ECI and gold support price
($/oz)
900 806 920 856
Permitting and exploration expenses - 31 132 132
Non-sustaining capital expenditure 3,387 5,452 17,760 20,030
Total all in cost 14,615 18,418 61,931 65,115
Gold sales (oz) 14,510 16,053 54,899 54,801
All-in costs per ounce ($/oz) 1,007 1,147 1,128 1,188
Page 26
26
10.2 Average realised gold price per ounce
“Average realised gold price per ounce” is a non-IFRS measure which, in conjunction with the cost per ounce
measures described above, allows stakeholders to assess our performance. The table below reconciles
“Average realised gold price per ounce” to the Revenue shown in the financial statements which have been
prepared under IFRS.
Reconciliation of Average Realised Gold Price per Ounce
($’000’s unless otherwise indicated)
3 Months to
December 31
12 Months to
December 31
2018 2019 2018 2019
Revenue (IFRS) 17,495 23,433 68,399 75,826
Revenues from sales of silver (14) (20) (61) (64)
Revenues from sales of gold 17,481 23,413 68,338 75,762
Gold ounces sold (oz) 14,510 16,053 54,899 54,801
Average realised gold price per ounce (US$/oz) 1,205 1,458 1,245 1,382
Page 27
27
10.3 Adjusted earnings per share
“Adjusted earnings per share” is a non-IFRS measure which management believes assists investors in
understanding the Company’s underlying performance. The table below reconciles “adjusted earnings per
share” to the Profit/Loss attributable to owners of the Company shown in the financial statements which have
been prepared under IFRS.
11. RELATED PARTY TRANSACTIONS
There were no related party transactions in the Quarter or for the Year.
Reconciliation of Adjusted Earnings per Share (“Adjusted EPS”) to IFRS Profit Attributable to
Owners of the Company
($’000’s unless otherwise indicated)
3 Months to
December 31
12 Months to
December 31
*2018 2019 *2018 2019
Profit for the period (IFRS) 3,586 3,230 13,756 50,401
Non-controlling interest share of profit for the period (802) (840) (2,990) (8,383)
Profit attributable to owners of the Company 2,784 2,390 10,766 42,018
Blanket Mine Employee Trust adjustment (120) (55) (280) (986)
Earnings (IFRS) 2,664 2,335 10,486 41,032
Weighted average shares in issue* 10,603 10,742 10,603 10,742
IFRS EPS (cents) 25 22 99 382
Add back/(deduct) amounts in respect of foreign
exchange gains and losses:
Realised net foreign exchange (gains)/losses 45 (846) 5 1,648
- less tax (12) 228 (1) (414)
- less non controlling interest (5) 108 (1) (198)
Unrealised net foreign exchange gains (382) (546) (230) (31,309)
- less tax 94 9 55 519
- less non controlling interest 33 98 16 5,000
Adjusted IFRS profit excl. foreign exchange 2,437 1,386 10,330 16,278
Weighted average shares in issue* 10,603 10,742 10,603 10,742
Adjusted IFRS EPS excl foreign exchange (cents) 23 13 97 152
Add back/(deduct) amounts in respect of:
Reversal of Blanket Mine Employee Trust
adjustment
120 55 280 986
Deferred tax 83 4,716 3,607 2,460
Deferred tax net of non controlling interest (21) (768) (601) (477)
Hedge loss - 277 360 601
Equity-settled share-based expense 14 - 14 -
Profit on sale of subsidiary - (4,409) - (4,409)
Adjusted profit 2,633 1,257 13,990 15,439
Weighted average shares in issue (m)* 10,603 10,742 10,603 10,742
Adjusted EPS (cents) 25 12 132 144
*Restated period and numbers for the reversal of realised foreign exchange and the reversal of Blanket Mine
Employee Trust adjustment.
Page 28
28
12. CRITICAL ACCOUNTING ESTIMATES
Caledonia's accounting policies are set out in the Consolidated Financial Statements which have been
publicly filed on SEDAR at www.sedar.com. In preparing the Consolidated Financial Statements,
management is required to make estimates and assumptions that affect the amounts represented in the
Consolidated Financial Statements and related disclosures. Use of available information and the application
of judgement are inherent in the formation of estimates. Estimates and underlying assumptions are reviewed
on an on-going basis. Revisions to accounting estimates are recognised in the period in which the estimates
are revised and in any future periods affected. Discussion of recently issued accounting pronouncements is
set out in note 4 of the Consolidated Financial Statements.
Information about critical judgements in applying accounting policies that have the most significant effect
on the amounts recognised in the Consolidated Financial Statements is included in the following notes:
i) Indigenisation transaction
The directors of Caledonia Holdings Zimbabwe (Private) Limited (“CHZ”), a wholly owned subsidiary of
the Company, performed an assessment, using the requirements of IFRS 10: Consolidated Financial
Statements (IFRS 10), and concluded that CHZ should continue to consolidate Blanket and accounted for the
transaction as follows:
• Non-controlling interests (“NCI”) are recognised on the portion of shareholding upon which dividends
declared by Blanket accrue unconditionally to equity holders as follows:
(a) 20% of the 16% shareholding of National Indigenisation and Economic Empowerment Fund
(“NIEEF”);
(b) 20% of the 15% shareholding of Fremiro; and
(c) 100% of the 10% shareholding of GCSOT.
• This effectively means that NCI is recognised at Blanket at 16.2% of its net assets.
• The remaining 80% of the shareholding of NIEEF and Fremiro is recognised as non-controlling interests
to the extent that their attributable share of the net asset value of Blanket exceeds the balance on the
facilitation loans including interest. At December 31, 2019 the attributable net asset value did not exceed
the balance on the respective loan accounts and thus no additional NCI was recognised.
The transaction with Blanket Employee Trust Services (Private) Limited (“BETS”) is accounted for in
accordance with IAS 19 Employee Benefits (profit sharing arrangement) as the ownership of the shares does
not ultimately pass to the employees. The employees are entitled to participate in 20% of the dividends
accruing to the 10% shareholding in Blanket if they are employed at the date of such distribution. To the
extent that 80% of the attributable dividends exceed the balance on BETS’ facilitation loan they will accrue
to the employees at the date of such declaration.
The Employee Trust and BETS are structured entities which are effectively controlled and consolidated by
Blanket. Accordingly, the shares held by BETS are effectively treated as treasury shares in Blanket and no
NCI is recognised.
ii) Site restoration provisions
The site restoration provision has been calculated for the Blanket Mine based on an independent analysis of
the rehabilitation costs as performed in 2018. Estimates and assumptions are made when determining the
inflationary effect on current restoration costs and the discount rate to be applied in arriving at the present
value of the provision. Assumptions, based on the current economic environment, have been made which
management believes are a reasonable basis upon which to estimate the future liability. These estimates take
into account any material changes to the assumptions that occur when reviewed by management. Estimates
are reviewed annually and are based on current regulatory requirements. Significant changes in estimates of
contamination, restoration standards and techniques will result in changes to provisions from period to period.
Actual rehabilitation costs will ultimately depend on future market prices for the rehabilitation costs which
will reflect the market condition at the time the rehabilitation costs are incurred. The final cost of the
currently recognized site rehabilitation provisions may be higher or lower than currently provided for.
Page 29
29
iii) Exploration and evaluation (“E&E”) expenditure
The Group makes estimates and assumptions regarding the possible impairment of E&E properties by
evaluating whether it is likely that future economic benefits will flow to the Group, which may be based on
assumptions about future events or circumstances. Estimates and assumptions made may change if new
information becomes available. If information becomes available suggesting that the recovery of
expenditures is unlikely, the amount capitalized is written off in profit or loss in the period the new
information becomes available. The recoverability of the carrying amounts of exploration and evaluation
assets depends upon the availability of sufficient funding to bring the properties into commercial production,
the price of the products to be recovered and the undertaking of profitable mining operations. As a result of
these uncertainties, the actual amount recovered may vary significantly from the carrying amount.
iv) Income taxes
Significant estimates and assumptions are required in determining the provision for income taxes. There are
many transactions and calculations undertaken during the ordinary course of business for which the ultimate
tax determination is uncertain. Caledonia records its best estimate of the tax liability including any related
interest and penalties in the current tax provision. In addition, Caledonia applies judgement in recognizing
deferred tax assets relating to tax losses carried forward to the extent that there are sufficient taxable
temporary differences (deferred tax liabilities) relating to the same taxation authority and the same taxable
entity against which the unused tax losses can be utilized or sufficient estimated taxable income against
which the losses can be utilized.
v) Share-based payment transactions
The fair value of the amount payable to employees in respect of share-based awards, which are settled in
cash, is recognised as an expense with a corresponding increase in liabilities, over the period over which the
employee becomes unconditionally entitled to payment. The liability is re-measured at each reporting date.
Any changes in the fair value of the liability are recognised as a personnel expense in profit or loss.
Additional information about significant judgements and estimates and the assumptions used to estimate fair
value for cash settled share-based payment transactions are disclosed in note 26 to the Consolidated Financial
Statements.
vi) Impairment
At each reporting date, Caledonia determines if impairment indicators exist and, if present, performs an
impairment review of the non-financial assets held in Caledonia. The exercise is subject to various
judgemental decisions and estimates. Financial assets are also reviewed regularly for impairment.
vii) Depreciation
Depreciation on mine development, infrastructure and other assets in the production phase is computed on
the units-of-production method over the life-of-mine based on the estimated quantities of reserves (proven
and probable) and resources (measured, indicated and inferred), which are planned to be extracted in the
future from known mineral deposits. Where items have a shorter useful life than the life-of-mine, the mine
development, infrastructure and other assets are depreciated over their useful life. Confidence in the
existence, commercial viability and economical recovery of reserves and resources included in the life-of-
mine may be based on historical experience and available geological information. This is in addition to the
drilling results obtained by the Group and management’s knowledge of the geological setting of the
surrounding areas, which would enable simulations and extrapolations to be done with a sufficient degree of
accuracy. In instances where management is able to demonstrate the economic recovery of resources with a
high level of confidence, such additional resources, are included in the calculation of depreciation.
Page 30
30
viii) Mineral reserves and resources
Mineral reserves and resources are estimates of the amount of product that can be economically and legally
extracted. In order to calculate the reserves and resources, estimates and assumptions are required about a
range of geological, technical and economic factors, including but not limited to quantities, grades,
production techniques, recovery rates, production costs, transport costs, commodity prices and exchange
rates. Estimating the quantity and grade of mineral reserves and resources requires the size, shape and depth
of orebodies to be determined by analysing geological data such as the logging and assaying of drill samples.
This process may require complex and difficult geological assumptions and calculations to interpret the data.
Estimates of mineral reserves and resources may change due to the change in economic assumptions used to
estimate mineral reserves and resources and due to additional geological data becoming available during the
course of operations.
The Group estimates its reserves (proven and probable) and resources (measured, indicated and inferred)
based on information compiled by a Qualified Person in terms of the Canadian National Instrument 43-101
– Standards of Disclosure for Mineral Projects (“NI 43-101”) relating to geological and technical data of the
size, depth, shape and grade of the ore body and suitable production techniques and recovery rates. Such an
analysis requires geological and engineering assumptions to interpret the data. These assumptions include:
• correlation between drill-holes intersections where multiple reefs are intersected;
• continuity of mineralisation between drill-hole intersections within recognised reefs; and
• appropriateness of the planned mining methods.
The Group estimates and reports reserves and resources in accordance with NI 43-101 and the Canadian
Institute of Mining, Metallurgy and Petroleum (the “CIM”) - CIM Definition Standards for Mineral
Resources and Mineral Reserves. Complying with the CIM code, NI 43-101 requires the use of reasonable
assumptions to calculate the recoverable resources. These assumptions include:
• the gold price based on current market price and the Group’s assessment of future prices;
• estimated future on-mine costs, sustaining and non-sustaining capital expenditures;
• cut-off grade;
• dimensions and extent, determined both from drilling and mine development, of ore bodies; and
• planned future production from measured, indicated and inferred resources.
Changes in reported reserves and resources may affect the Group’s financial results and position in a number
of ways, including the following:
• asset carrying values may be affected due to changes in the estimated cash flows;
• depreciation and amortisation charges to profit or loss may change as these are calculated on the unit-
of-production method or where useful lives of an asset change; and
• decommissioning, site restoration and environmental provisions may change in ore reserves and
resources which may affect expectations about the timing or cost of these activities.
13. FINANCIAL INSTRUMENTS
i) Commodity risk
Caledonia is exposed to fluctuations in the price of gold because Blanket produces and sells gold doré and
receives the prevailing spot price for the gold contained therein. In January 2019 Caledonia entered into
hedging arrangements for the 5 months from February 2019 until June 2019 for 22,500 ounces of production
through the purchase of put options with a strike price of $1,250 per ounce. The hedge ensured that
Caledonia received a minimum price of $1,250 per ounce of gold for the duration of the contracts whilst
maintaining full upside participation. During the Quarter, Caledonia entered into hedging arrangements over
4,600 ounces of gold per month for the period from January 1, 2020 to June 30, 2020 which guarantees that
Caledonia will receive a minimum price of $1,400 in respect of the ounces hedged. Caledonia retains full
exposure if the gold price exceeds $1,400 per ounce. Caledonia will continue to assess the requirement for
Page 31
31
further hedging in the context of, inter alia, the prevailing gold price and Blanket’s production and capital
expenditure programme.
ii) Credit risk
The carrying amount of financial assets as disclosed in the statements of financial position and related notes
represents the maximum credit exposure. The trade receivable relates to gold bullion sold before the end of
the Quarter, VAT receivables and deferred consideration due in respect of the sale of Eersteling. The amount
due in respect of bullion sales was settled in January 2019. Certain of the VAT receivables were outside the
agreed terms of such refunds as at December 31, 2019 such amounts have since been recovered by way of
cash receipts or offset against other amounts of tax payable.
iii) Impairment losses
None of the trade and other receivables is past due at the period-end date other than certain of the VAT
receivables which have subsequently been recovered in full.
iv) Liquidity risk
All trade payables and the bank overdraft have maturity dates that are expected to mature in under 6 months.
The term loans are repayable as set out in section 7.
v) Currency risk
A proportion of Caledonia’s assets, financial instruments and transactions are denominated in currencies
other than the US Dollar. The financial results and financial position of Caledonia are reported in US Dollars
in the Consolidated Financial Statements.
The fluctuation of the US Dollar in relation to other currencies will consequently have an impact upon the
profitability of Caledonia and may also affect the value of Caledonia’s assets and liabilities and the amount
of shareholders’ equity.
Caledonia does not use any derivative instruments to reduce its foreign currency risks. To reduce exposure
to currency transaction risk, where possible Caledonia maintains cash and cash equivalents in the currencies
used by Caledonia to meet short‐term liquidity requirements.
As discussed in section 4.9 of this MD&A, the RTGS$ is subject to variations in the exchange rate against
the US Dollar. This may result in Blanket’s assets, liabilities and transactions that are denominated in RTGS$
being subject to further fluctuations in the exchange rate between RTGS$ and US Dollars.
vi) Interest rate risk
Interest rate risk is the risk borne by an interest-bearing asset or liability as a result of fluctuations in interest
rates. Unless otherwise noted, it is the opinion of management that Caledonia is not exposed to significant
interest rate risk as it has limited debt financing. Caledonia’s cash and cash equivalents include highly liquid
investments that earn interest at market rates. Caledonia manages its interest rate risk by endeavouring to
maximize the interest income earned on excess funds while maintaining the liquidity necessary to conduct
operations on a day-to-day basis. Caledonia’s policy focuses on preservation of capital and limits the
investing of excess funds to liquid term deposits in high credit quality financial institutions.
14. DIVIDEND POLICY
Following the share consolidation on June 26, 2017, the Company announced on July 4, 2017 an increased
quarterly dividend of 6.875 United States cents which has been paid at the end of July, October, January
and April thereafter. The dividend of 6.875 US cents per share effectively maintained the dividend at the
previous level of 1.375 United States cents per share, after adjusting for the effect of the consolidation.
On January 3, 2020 the Company announced a 9.1% increase from the previous quarterly dividend of 6.875
cents to 7.5 cents per share. The increased dividend was due to the Company’s improved financial
performance due to increased production in the Quarter and improved prospects for the company as it
approaches the completion of the Central Shaft.
Page 32
32
The Board will consider future increases in the dividend as appropriate in line with its prudent approach to
risk management.
15. MANAGEMENT AND BOARD
On September 23, 2019 the Company announced that Nick Clarke had joined the board of directors of the
Company as an independent non-executive director with immediate effect. Mr Clarke, who is Chairman of
Central Asia Metals PLC, is a highly experienced Chartered Engineer with 45 years’ experience in the mining
industry. He has held senior positions in several resource companies and is well known as a successful
executive in the sector having been involved in the construction of major mining projects and conducted
several fund raisings on AIM and TSX. He has an extensive background in managing AIM and TSX listed
minerals companies including his current position as Chairman of Central Asia Metals PLC, where he was
CEO from 2009 until 2016. In January 2020 Janet Hobkirk joined the Company as Group Mineral Resource Manager. Ms Hobkirk is a
qualified geologist with broad operational experience across the mining value chain from resource delineation
to metal accounting. She holds a BSc (Hons) in Geology and Engineering Geology from the University of
Natal. Prior to joining Caledonia Janet worked for Harmony Gold Mining Company and Anglo American
Platinum. Until 2017 Janet managed the 240-member mineral resource management team at the Amandelbult
Complex which extracted 7 million tonnes per annum from a complex infrastructure of vertical and decline
shafts and from small surface pits.
16. SECURITIES OUTSTANDING
As at March 18, 2020 Caledonia had 11,515,860 common shares issued and outstanding options to purchase
common shares (“Options”) as follows:
Number of
Options
Exercise
Price Expiry Date
Canadian $
5,000 4.00 Oct 8, 2020
18,000 11.50 Oct 13, 2021
5,000 8.10 May 30, 2022
10,000 9.305 Aug 25, 2024
38,000
The Plan allows that the number of shares reserved for issuance to participants under the Plan, together with
shares reserved for issue under any other share compensation arrangements of the Company, shall not exceed
the number which represents 10% of the issued and outstanding shares from time to time. Accordingly,
Caledonia could grant Options on a further 1,113,586 shares at March 18, 2020 on the assumption that all
the LTIPs are settled in cash, at the option of the LTIP holder.
17. RISK ANALYSIS
The business of Caledonia contains significant risk due to the nature of mining, exploration and development
activities. Risks such as interest rate, foreign exchange rates and credit risks are considered in notes 7 and
30 to the Consolidated Financial Statements. Caledonia’s business contains significant additional risks due
to the jurisdictions in which it operates and the nature of mining, exploration and development. Included in
the risk factors below are details of how management seeks to mitigate the risks where this is possible.
• Liquidity risk: The Company needs to generate capital to be able to continue to invest in properties
and projects without raising further third-party financing in addition to the existing debt facilities at
5 The exercise price of CAD$9.30 per share for these options was converted into a USD amount of $7.35 at the prevailing USD/CAD exchange rate.
Page 33
33
Blanket. Caledonia currently has sufficient cash resources and debt facilities and continues to generate
sufficient cash to cover all of its anticipated investment needs.
• Availability of foreign currency: The Company needs access to foreign currency in Zimbabwe so that
it can pay for imported goods and equipment and remit funds to Group companies outside Zimbabwe.
As discussed in section 4.9, at prevailing gold prices and the current rate of production the Company
has access to sufficient foreign currency to continue normal mining operations, to fully implement the
investment plan as scheduled and allow Caledonia to remit dividends and loan repayments from
Zimbabwe. No assurance can be given that sufficient foreign currency will continue to be available.
• Exploration risk: The Company needs to identify new resources to replace ore which has been
depleted by mining activities and to commence new projects. No assurance can be given that exploration
will be successful in identifying sufficient mineral resources of an adequate grade and suitable
metallurgical characteristics that are suitable for further development or production.
• Development risk: The Company is engaged in the implementation of the Central Shaft project as set
out in section 4.7 of this MD&A. Construction and development of projects are subject to numerous
risks including: obtaining equipment, permits and services; changes in regulations; currency rate
changes; labour shortages; fluctuations in metal prices and the loss of community support. There can
be no assurance that construction will commence or continue in accordance with the current expectations
or at all.
• Production estimates: Estimates for future production are based on mining plans and are subject to
change. Production estimates are subject to risk and no assurance can be given that future production
estimates will be achieved. Actual production may vary from estimated production for a variety of
reasons including un-anticipated variations in grades, mined tonnages and geological conditions,
accident and equipment breakdown, changes in metal prices and the cost and supply of inputs and
changes to government regulations.
• Mineral rights: The Company’s existing mining claims, licences and permits are in good standing.
The Company has to pay fees etc. to maintain its claims and licences. No assurance can be given that
the Company will be able to make payments by the required date or will meet development and
production schedules that are required to protect claims and licences.
• Metal prices: The Company’s operations and exploration and development projects are heavily
influenced by the price of gold, which is particularly subject to fluctuation. Caledonia has hedging
arrangements over 4,600 ounces of gold per month for the period from January 1, 2020 to June 30, 2020
which guarantees that Caledonia will receive a minimum price of $1,400 in respect of the ounces
hedged. Management regularly reviews future cash flow forecasts in the context of the prevailing gold
price and likely downside scenarios for future gold prices.
• Increasing input costs: Mining companies generally have experienced higher costs of steel, reagents,
labour and electricity and from local and national government for levies, fees, royalties and other direct
and indirect taxes. Blanket’s planned growth should allow the fixed cost component to be absorbed
over increased production, thereby helping to alleviate somewhat the effect of any further price
increases.
• Illegal mining: There has been an increase in illegal mining activities on properties controlled by
Blanket. This gives rise to increased security costs and an increased risk of theft and damage to
equipment. Blanket has received adequate support and assistance from the Zimbabwean police in
investigating such cases.
• Electricity supply: Zimbabwe produces and imports less electricity than it requires and has insufficient
funds to adequately maintain or upgrade its distribution infrastructure. This has resulted in frequent
interruptions to the power supply at Blanket Mine. Blanket has addressed the issue of interrupted power
supply by installing stand-by generators and entering into an arrangement with the state-owned
electricity company to receive ring-fenced imported power in return for paying a US Dollar denominated
tariff. More recently, production at Blanket has been adversely affected by the instability of the
incoming electricity supply. Management is assessing the potential to install a solar project to provide
some of Blanket’s power requirements.
Page 34
34
• Water supply: Blanket uses water in the metallurgical process, most of which is obtained from a nearby
dam. Blanket is situated in a semi-arid area and rainfall typically occurs only in the period November
to February. The last rainy season was very poor and water levels in the dam are lower than usual. The
water authority has released water from an upstream dam to replenish the Blanket dam and management
believes that with careful management, there is enough water in the Blanket dam to maintain normal
operations until the next rainy season. Blanket is taking steps to access water from boreholes and to
reduce its water consumption by improved re-cycling and storage facilities.
• Succession planning: The limited availability of mining and other technical skills and experience in
Zimbabwe and the difficulty of attracting appropriately skilled employees to Zimbabwe creates a risk
that appropriate skills may not be available if, for whatever reason, the current skills base at the Blanket
Mine is depleted. The Caledonia and Blanket management teams have recently been augmented so that,
if required, it could provide appropriate support to Blanket if this was required.
• Country risk: The commercial environment in which the Company operates is unpredictable. Potential
risks may arise from: unforeseen changes in the legal and regulatory framework which means that laws
may change, may not be enforced, or judgements may not be upheld; restrictions on the movement of
currency and the availability of foreign currency to make payments from Zimbabwe; risks relating to
inflationary pressures as mentioned in section 4.9; risks relating to possible corruption, bribery, civil
disorder, expropriation or nationalisation; risks relating to restrictions on access to assets and the risk
that the Government of Zimbabwe is unable to pay its liabilities to Blanket. Management believes that
it has minimised such risks by complying fully with all relevant legislation, by obtaining all relevant
regulatory permissions and approvals and by regular and proactive engagement with the relevant
authorities.
• Gold marketing arrangements: In terms of regulations introduced by the Zimbabwean Ministry of
Finance in January 2014, all gold produced in Zimbabwe must be sold to Fidelity, a company which is
controlled by the Zimbabwean authorities. Accordingly, all of Blanket’s production has been sold to
Fidelity. Blanket has received all payments due from Fidelity in full and on time. However, the
requirement to sell to Fidelity increases Blanket’s credit risk because Fidelity failed to pay Blanket in
the period of hyper-inflation which existed prior to the adoption of the multi-currency system by
Zimbabwe in early 2009.
• Coronavirus: Reported cases of the virus in the jurisdictions in which we operate are currently very
low or nil. However, should the virus have a significant impact in those jurisdictions where we operate
or jurisdictions from which the business sources goods or services, the Group could suffer from
employee absences, a lack of supplies and consumables, failure by its contractors to perform and travel
restrictions which may affect production. The business has taken steps to increase its holdings of
consumable stocks and to mitigate its supply-chain risk; the Group will continue to monitor any further
developments.
18. FORWARD LOOKING STATEMENTS
Information and statements contained in this MD&A that are not historical facts are “forward-looking
information” within the meaning of applicable securities legislation that involve risks and uncertainties
relating, but not limited to, Caledonia’s current expectations, intentions, plans, and beliefs. Forward-looking
information can often be identified by forward-looking words such as “anticipate”, “believe”, “expect”,
“goal”, “plan”, “target”, “intend”, “estimate”, “could”, “should”, “may” and “will” or the negative of these
terms or similar words suggesting future outcomes, or other expectations, beliefs, plans, objectives,
assumptions, intentions or statements about future events or performance. Examples of forward-looking
information in this MD&A include: implementation schedules for, and other uncertainties inherent in, the
Central Shaft project; production guidance; estimates of future/targeted production rates; planned mill
capacity increases; estimates of future metallurgical recovery rates and the ability to maintain high
metallurgical recovery rates; timing of commencement of operations; plans and timing regarding further
exploration, drilling and development; the prospective nature of exploration and development targets; the
ability to upgrade and convert mineral resources to mineral reserves; capital and operating costs; our
intentions with respect to financial position and third party financing; and future dividend payments. This
forward-looking information is based, in part, on assumptions and factors that may change or prove to be
Page 35
35
incorrect, thus causing actual results, performance or achievements to be materially different from those
expressed or implied by forward-looking information. Such factors and assumptions include, but are not
limited to: failure to establish estimated resources and reserves, the grade and recovery of ore which is mined
varying from estimates, success of future exploration and drilling programs, reliability of drilling, sampling
and assay data, assumptions regarding the representativeness of mineralization being inaccurate, success of
planned metallurgical test-work, capital and operating costs varying significantly from estimates, delays in
obtaining or failures to obtain required governmental, environmental or other project approvals, changes in
government regulations, legislation and rates of taxation, inflation, changes in exchange rates, fluctuations
in commodity prices, delays in the development of projects and other factors.
Security holders, potential security holders and prospective investors should be aware that these statements
are subject to known and unknown risks, uncertainties and other factors that could cause actual results to
differ materially from those suggested by the forward-looking statements. Such factors include, but are not
limited to: risks relating to estimates of mineral reserves and mineral resources proving to be inaccurate,
fluctuations in gold price and payment terms for gold sold to Fidelity, risks and hazards associated with the
business of mineral exploration, development and mining (including environmental hazards, industrial
accidents, unusual or unexpected geological or structural formations, pressures, power outages, fire,
explosions, landslides, cave-ins and flooding), risks relating to the credit worthiness or financial condition of
suppliers, refiners and other parties with whom the Company does business, inadequate insurance, or inability
to obtain insurance, to cover these risks and hazards, employee relations, relationships with and claims by
local communities and indigenous populations, political risk, availability and increasing costs associated with
mining inputs and labour, the speculative nature of mineral exploration and development, including the risks
of obtaining or maintaining necessary licenses and permits, diminishing quantities or grades of mineral
reserves as mining occurs, global financial condition, the actual results of current exploration activities,
changes to conclusions of economic evaluations, and changes in project parameters to deal with un-
anticipated economic or other factors, risks of increased capital and operating costs, environmental, safety or
regulatory risks, expropriation, the Company’s title to properties including ownership thereof, increased
competition in the mining industry for properties, equipment, qualified personnel and their costs, risks
relating to the uncertainty of timing of events including targeted production rate increase and currency
fluctuations. Security holders, potential security holders and prospective investors are cautioned not to place
undue reliance on forward-looking information. By its nature, forward-looking information involves
numerous assumptions, inherent risks and uncertainties, both general and specific, that contribute to the
possibility that the predictions, forecasts, projections and various future events will not occur. Caledonia
reviews forward-looking information for the purposes of preparing each MD&A; however, Caledonia
undertakes no obligation to update publicly or otherwise revise any forward-looking information whether as
a result of new information, future events or other such factors which affect this information, except as
required by law.
19. CONTROLS
The Company has established and maintains disclosure controls and procedures (“DC&P”) designed to
provide reasonable assurance that material information relating to the Company is made known to the Chief
Executive Officer and the Chief Financial Officer by others, particularly during the period in which annual
filings are being prepared, and that information required to be disclosed in the Company’s annual filings,
interim filings or other reports filed or submitted by it under securities legislation is recorded, processed,
summarized and reported within the time periods specified by such securities legislation.
The Company’s management, along with the participation of the Chief Executive Officer and the Chief
Financial Officer, have evaluated the effectiveness of the Company’s DC&P as of December 31, 2019. Based
on that evaluation, the Chief Executive Officer and the Chief Financial Officer have concluded that, as at
December 31, 2019, the Company’s DC&P were effective.
The Company also maintains a system of internal controls over financial reporting (“ICFR”) designed under
the supervision of the Company’s Chief Executive Officer and Chief Financial Officer to provide reasonable
assurance regarding the reliability of financial reporting and the preparation of financial statements for
external purposes in accordance with IFRS; however, due to inherent limitations, ICFR may not prevent or
detect all misstatements and fraud. The board of directors approves the financial statements and ensures that
Page 36
36
management discharges its financial responsibilities. The Audit Committee, which is composed of
independent directors, meets periodically with management and auditors to review financial reporting and
control matters and reviews the financial statements and recommends them for approval to the board of
directors.
The Company’s management, including the Chief Executive Officer and the Chief Financial Officer, is
responsible for establishing and maintaining adequate ICFR and evaluating the effectiveness of the
Company’s ICFR as at each fiscal year end. Management has used the 2013 Internal Control–Integrated
Framework from the Committee of Sponsoring Organizations of the Treadway Commission (the “COSO”)
to evaluate the effectiveness of the Company’s ICFR as at December 31, 2019. Based on this evaluation, the
Chief Executive Officer and the Chief Financial Officer have concluded that as at December 31, 2019, the
Company’s ICFR was effective.
There have been no changes in the Company’s ICFR during the period ended December 31, 2019 that have
materially affected, or are reasonably likely to materially affect, the Company’s ICFR.
20. QUALIFIED PERSON
Paul Matthews (BSc (Hons) Geology) is the Company’s qualified person as defined by Canada’s National
Instrument 43-101. Mr. Matthews is responsible for the technical information provided in this MD&A except
where otherwise stated. Mr. Matthews has reviewed the scientific and technical information included in this
document and has approved the disclosure of this information for the purposes of this MD&A.