14 Fair & Equitable • August 2009 L ocal, state, national, and international economies are declining at record rates. Financial and real estate markets are declining as well. In many areas, even if someone wants to buy property, it is difficult for them to find adequate mortgage financing. The real estate industry, in record time for most, has traveled from the mountaintop to the valley floor. Property tax appraisals, unlike most real estate activity (mort- gages, foreclosures, real estate sales, and so on), are performed with annual regularity everywhere. Regardless of the amount or quality of available market data, all states have statutory require- ments that property tax appraisals be completed accurately and on time. Mass appraisal systems cannot be calibrated in a vacuum, void of valid market evidence (traditionally that means without sufficient numbers of real estate sales). Virtu- ally all states require market value appraisals that, by definition, are verified and defended with valid evidences of value such as bona fide real estate sales. This article suggests that unusual times require unusual paradigm shifts as assessors analyze and calibrate their CAMA systems. This article details the experience of the Volusia County (Florida) Property Appraiser’s office in preparing for the 2009 tax roll with what initially appeared to be inadequate market data. As shown in figure 1, Volusia’s 47 miles of oceanfront is home to 16 cities including Daytona, Ormond and New Smyrna Beaches. The western boundary of the county is made up of 98 miles of meandering, expensive St. John’s River frontage. In between the St. John’s (a federally designated “American Heritage River”) and the ocean are 1,200 square miles and 331,779 properties valued at $45.9 billion dollars in the upcom- ing (2009) tax roll. Last year the same property was valued at $57.8 billion (20.6 percent reduction). This is not a research paper on what “we think might be a good way” to analyze data in a difficult market. Rather, it is a hands-on “view of the rifle as it was fired from the foxhole.” Charts, processes, data, and results are based on real data that were part of the 2009 Volusia County Tax Roll. The Real Estate Bubble and Market Decline It could be called the “Bubble and Burst” market—“B-B & Beyond” so to speak. Figure 2 shows the county’s median sale prices from 1996 through the first quarter of 2009. It is easy to see the typical years, from 1996 to 2001, and the proverbial real estate bubble, from 2002 to 2006, as well as the decline since. When the line representing the rate of growth from 1996 to 2001 is extended out to 2009, actual 2009 median sale prices appear to be approaching where they would have been without the bubble; that is, sale prices have dropped to 2003 levels. Calibrating Mass Appraisal Models in Declining Markets: Evaluating “Market Evidence” Paradigms The statements made or opinions expressed by authors in Fair & Equitable do not necessarily represent a policy position of the International Association of Assessing Officers. Cover Story Figure 1. Map of Volusia County Figure 2. Median SFR sale prices in Volusia County, Florida, 1996–2009 Morgan B. Gilreath, Jr.
Transcript
14 Fair & Equitable • August 2009
Local, state, national, and international economies are declining at record rates. Financial and real estate markets are declining as well. In many areas, even if
someone wants to buy property, it is difficult for them to find adequate mortgage financing. The real estate industry, in record time for most, has traveled from the mountaintop to the valley floor.
Property tax appraisals, unlike most real estate activity (mort-gages, foreclosures, real estate sales, and so on), are performed with annual regularity everywhere. Regardless of the amount or quality of available market data, all states have statutory require-ments that property tax appraisals be completed accurately and on time. Mass appraisal systems cannot be calibrated in a vacuum, void of valid market evidence (traditionally that means without sufficient numbers of real estate sales). Virtu-ally all states require market value appraisals that, by definition, are verified and defended with valid evidences of value such as bona fide real estate sales. This article suggests that unusual times require unusual paradigm shifts as assessors analyze and calibrate their CAMA systems.
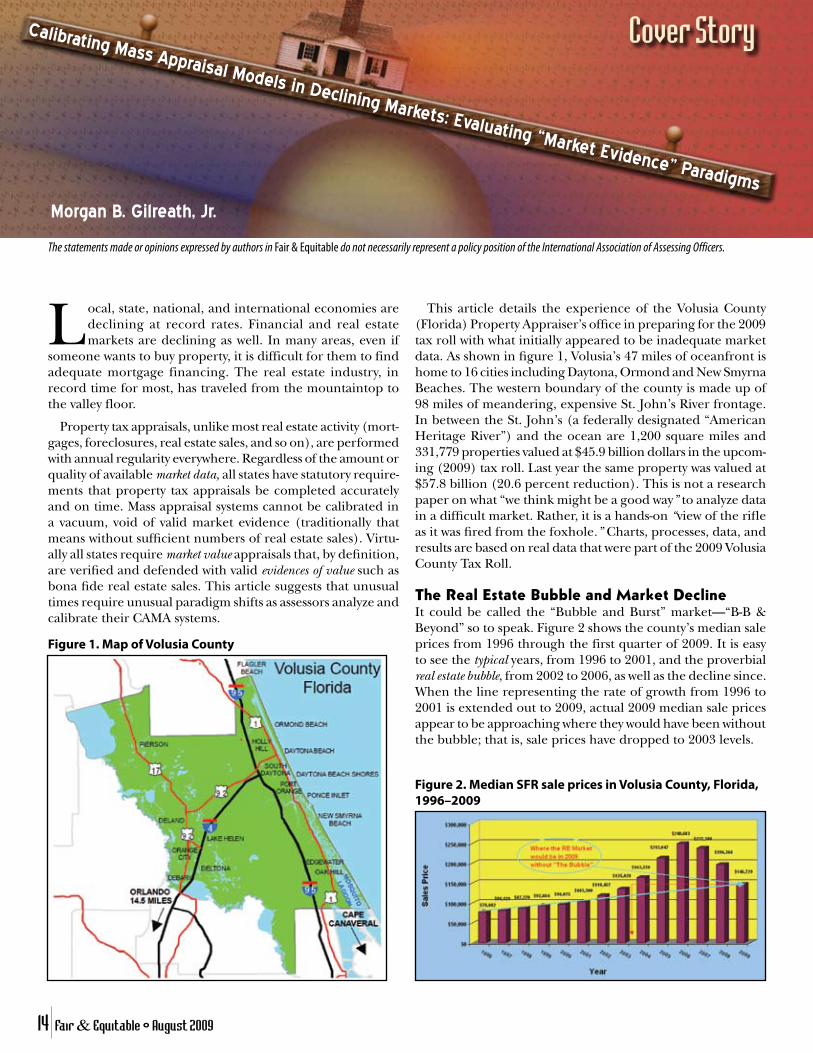
This article details the experience of the Volusia County (Florida) Property Appraiser’s office in preparing for the 2009 tax roll with what initially appeared to be inadequate market data. As shown in figure 1, Volusia’s 47 miles of oceanfront is home to 16 cities including Daytona, Ormond and New Smyrna Beaches. The western boundary of the county is made up of 98 miles of meandering, expensive St. John’s River frontage. In between the St. John’s (a federally designated “American Heritage River”) and the ocean are 1,200 square miles and 331,779 properties valued at $45.9 billion dollars in the upcom-ing (2009) tax roll. Last year the same property was valued at $57.8 billion (20.6 percent reduction). This is not a research paper on what “we think might be a good way” to analyze data in a difficult market. Rather, it is a hands-on “view of the rifle as it was fired from the foxhole.” Charts, processes, data, and results are based on real data that were part of the 2009 Volusia County Tax Roll.
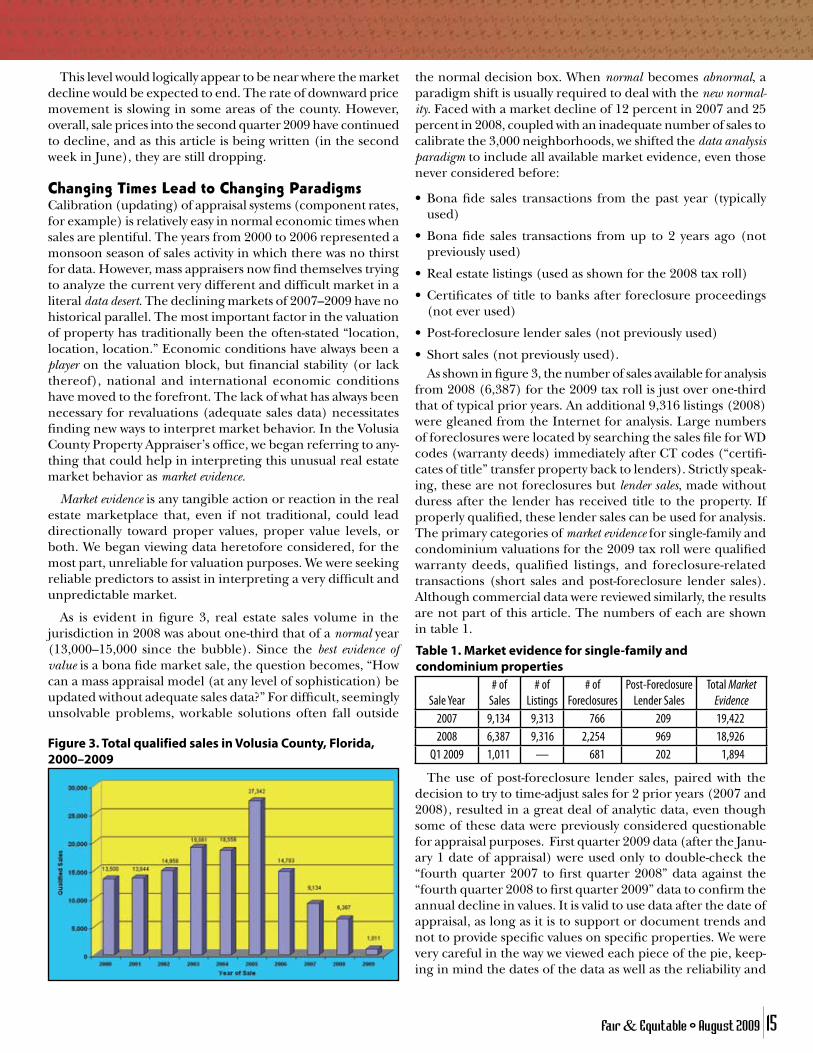
The Real Estate Bubble and Market DeclineIt could be called the “Bubble and Burst” market—“B-B & Beyond” so to speak. Figure 2 shows the county’s median sale prices from 1996 through the first quarter of 2009. It is easy to see the typical years, from 1996 to 2001, and the proverbial real estate bubble, from 2002 to 2006, as well as the decline since. When the line representing the rate of growth from 1996 to 2001 is extended out to 2009, actual 2009 median sale prices appear to be approaching where they would have been without the bubble; that is, sale prices have dropped to 2003 levels.
Calibrating Mass Appraisal Models in Declining Markets: Evaluating “Market Evidence” Paradigms
The statements made or opinions expressed by authors in Fair & Equitable do not necessarily represent a policy position of the International Association of Assessing Officers.
Cover Story
Figure 1. Map of Volusia County
Figure 2. Median SFR sale prices in Volusia County, Florida, 1996–2009
Morgan B. Gilreath, Jr.
Fair & Equitable • August 2009 15
This level would logically appear to be near where the market decline would be expected to end. The rate of downward price movement is slowing in some areas of the county. However, overall, sale prices into the second quarter 2009 have continued to decline, and as this article is being written (in the second week in June), they are still dropping.
Changing Times Lead to Changing ParadigmsCalibration (updating) of appraisal systems (component rates, for example) is relatively easy in normal economic times when sales are plentiful. The years from 2000 to 2006 represented a monsoon season of sales activity in which there was no thirst for data. However, mass appraisers now find themselves trying to analyze the current very different and difficult market in a literal data desert. The declining markets of 2007–2009 have no historical parallel. The most important factor in the valuation of property has traditionally been the often-stated “location, location, location.” Economic conditions have always been a player on the valuation block, but financial stability (or lack thereof), national and international economic conditions have moved to the forefront. The lack of what has always been necessary for revaluations (adequate sales data) necessitates finding new ways to interpret market behavior. In the Volusia County Property Appraiser’s office, we began referring to any-thing that could help in interpreting this unusual real estate market behavior as market evidence.
Market evidence is any tangible action or reaction in the real estate marketplace that, even if not traditional, could lead directionally toward proper values, proper value levels, or both. We began viewing data heretofore considered, for the most part, unreliable for valuation purposes. We were seeking reliable predictors to assist in interpreting a very difficult and unpredictable market.
As is evident in figure 3, real estate sales volume in the jurisdiction in 2008 was about one-third that of a normal year (13,000–15,000 since the bubble). Since the best evidence of value is a bona fide market sale, the question becomes, “How can a mass appraisal model (at any level of sophistication) be updated without adequate sales data?” For difficult, seemingly unsolvable problems, workable solutions often fall outside
the normal decision box. When normal becomes abnormal, a paradigm shift is usually required to deal with the new normal-ity. Faced with a market decline of 12 percent in 2007 and 25 percent in 2008, coupled with an inadequate number of sales to calibrate the 3,000 neighborhoods, we shifted the data analysis paradigm to include all available market evidence, even those never considered before:
• Bona fide sales transactions from the past year (typicallyused)
• Bona fide sales transactions from up to 2 years ago (notpreviously used)
• Shortsales(notpreviouslyused).As shown in figure 3, the number of sales available for analysis
from 2008 (6,387) for the 2009 tax roll is just over one-third that of typical prior years. An additional 9,316 listings (2008) were gleaned from the Internet for analysis. Large numbers of foreclosures were located by searching the sales file for WD codes (warranty deeds) immediately after CT codes (“certifi-cates of title” transfer property back to lenders). Strictly speak-ing, these are not foreclosures but lender sales, made without duress after the lender has received title to the property. If properly qualified, these lender sales can be used for analysis. The primary categories of market evidence for single-family and condominium valuations for the 2009 tax roll were qualified warranty deeds, qualified listings, and foreclosure-related transactions (short sales and post-foreclosure lender sales). Although commercial data were reviewed similarly, the results are not part of this article. The numbers of each are shown in table 1.
Table 1. Market evidence for single-family and condominium properties
The use of post-foreclosure lender sales, paired with the decision to try to time-adjust sales for 2 prior years (2007 and 2008), resulted in a great deal of analytic data, even though some of these data were previously considered questionable for appraisal purposes. First quarter 2009 data (after the Janu-ary 1 date of appraisal) were used only to double-check the “fourth quarter 2007 to first quarter 2008” data against the “fourth quarter 2008 to first quarter 2009” data to confirm the annual decline in values. It is valid to use data after the date of appraisal, as long as it is to support or document trends and not to provide specific values on specific properties. We were very careful in the way we viewed each piece of the pie, keep-ing in mind the dates of the data as well as the reliability and
Figure 3. Total qualified sales in Volusia County, Florida, 2000–2009
16 Fair & Equitable • August 2009
Feature Storypotential variations of each type of market evidence involved. The rest of this article details what we did.
Calibrating from Bona Fide Market Sales DataBona fide sales have always been considered the crème de la crème—the best evidence— of value for appraisers, and that standard remains unchallenged. We are finding, however, a relationship between market values and other types of market evidence, even data sources previously considered unusable. With record numbers of real estate listings, foreclosures, and short sales, we began to look for ways and means to validate and use these as market evidence in calibrating the mass appraisal model. Implicit in the analysis was an assumption that the data would not conform to the same variance standards as bona fide sales. While there is some statistical consistency between a real estate listing and the eventual sale price on a given property, the data may not reveal whether a particular listing is the first, second, or third listing. Therefore, the assumption was that statistical variation around any data other than bona fide sales would probably be greater than the typical coefficients of disper-sion (COD) of about 7–10. (Later in this article, figure 7 shows Appraisal District 2 with a COD of 7.28 and figure 8 shows a countywide COD, on a more diverse set of properties, of 10.05 on the prior-year’s sales, 10.75 on prior two years’ sales. Our analy-sis, therefore, seems to indicate that carefully qualified “market evidence” can be relied upon to produce documentable, reliable value estimates. We plan to continue experimenting with this in future years when markets return to “normal.”
In addition, when median listing prices or foreclosure-related data are used, the variation between individual listings becomes far less important; the objective is comparative price rather than specific price for a specific property. It can be instructive to look at the mean and the median, because any difference generally indicates a bias in the direction of the mean. When looking at sales ratios, for example, if the mean is above the median, expect to see more of the higher ratios than lower ratios.
The calibration process is usually filled with time-honored appraisal procedures such as market-oriented cost studies and considerable neighborhood analysis—the kinds of things mass appraisers everywhere do annually. This year the Volusia Coun-ty Property Appraiser’s office used many of the same types of analyses but with some decidedly different twists. We analyzed (1) land sales from the last 2 years (longer than usual), (2) land listings, and (3) listing to prior-year assessment ratios and statistics resulting from both. Land values are typically updated through neighborhood land rates derived from market studies per land use code and land unit type. The primary improve-ment value comes from a market-oriented cost approach that is updated each year with current construction cost data and then calibrated to land-abstracted sales of newly constructed buildings. Lastly, we usually go back through all analytic data neighborhood by neighborhood, calibrating market-adjusted ratios for each.
The big difference this year was the lack of sales information. Sales data are the fuel that fires mass appraisal engines. This year we knew we had to come up with an alternative fuel. The
inclusion of other market evidence provided what we needed. (The almost completed tax roll residential statistics are shown later in figure 8.)
Time-Adjusting Sales for Multiple YearsFigure 3 clearly illustrates the lack of sales data for 2008 and the even greater potential problem for next year’s valuation (2010)—even lower sales in 2009. In order to time-adjust sale prices, the annual percentage change must be documented. The percentage decline in the market from January 1, 2008, to January 1, 2009, was estimated as shown in table 2.
Table 2. Estimated decline in market value (%) Comparison Percentage
DeclineMedian annual sale price: 2008 compared to 2009 25%Sales: Q4 2008 compared to Q1 2009 25%Sales: Q4 2007–Q1 2008 compared to Q4 2008–Q1 2009 24%Sales: MLS median price January 2008 to January 2009 22%Listings: 2008 listings compared to prior year (2008) tax roll values 25%Sales: 2008 sales compared to prior year (2008) tax roll values 26%
The 2008 market decline was reconciled at 25 percent, or 2.1 percent per month. This was used for time-adjusting the 2008 sales to the target valuation date of January 1, 2009. There was great variance between the mean and median in all the data because, in this unusual market, extremely high priced properties did not experience the same rate of decline as lower priced properties. Only median figures were used. Also, traditional sales ratios were run geographically to de-termine whether inter-county differences warranted further adjustments. Existing neighborhood-level modifiers consider locational price changes on an intra-county basis, and their determination considered all market evidence in a separate analysis. The 25 percent (2.1 percent per month) time adjust-ment process performed well, as it was run and verified in the same sales ratio time adjustment spreadsheet (figure 5). This 25 percent decline also tracked hand-in-glove with the percentage of movement demonstrated in the listing to prior-year values tax-roll analysis described below.
Last year’s research indicated that the market declined 12 percent during 2007. Could the sales over both years be time-adjusted at 12 percent and 25 percent, respectively, on a cumulative basis to indicate what a 2007 or 2008 sale would have sold for on January 1, 2009? Logically, it is similar to com-pound interest, which works well as long as the percentages are correct. We tried it and continued checking it throughout the 5-month process to this date. Sales ratios for 2007 were shown separately; then 2007 and 2008 sales ratios combined; and lastly 2008 sales ratios by themselves. Throughout the 5 months, biweekly staff meetings reviewed progress, logic, statistics, and suggestions, and all three double-checks have been within one or two percentage points, basically verifying and document-ing the process as completely reliable. (Later, figure 7 shows these details for one of the county’s five residential appraisal districts; each district has more than 500 neighborhoods with between 45,000 and 65,000 properties.)
Fair & Equitable • August 2009 17
This has been new analytic territory for the Property Ap-praiser’s office and, we suspect, fairly new ground in calibrat-ing a mass appraisal system with this many types of market evidence. Since 1973 I have never seen two back-to-back years with sale prices declining by a total of 37 percent! This was proving to be a challenging year, and early 2009 data indicate that 2010 may be another banner year in the lack-of-market-evidence category. Last year was considered unusual. Current 2009 market evidence data indicate these analytic drills may again be used for the 2010 tax roll.
Everything was cross-checked. The indicated percentage movement was compared against the percentage of negative market price movement (25 percent); they were very close (see figure 4). Volusia County has more than 1,200 square miles of land, 16 cities, and more than 500,000 people. All these analy-ses were conducted in each of the county’s 3,000+ delineated neighborhoods. Neighborhood delineation is a topic in itself.
The analysis has been labor-intensive. Automated sales analysis was always part of the CAMA system, but listing analysis required inputting data into spreadsheets with individual par-cel numbers. Then system queries pulled data from the CAMA system as neighborhood-level performance statistics were run, namely, listing to prior assessment ratios and time-adjusted sales ratio statistics. A monthly time adjustment process was programmed into the system so sale prices from 2007 and 2008 could be analyzed and associated new time-adjusted, January 1, 2009, sale prices could be projected. This was not a trivial task. Combining the data in this manner may not have been the most sophisticated form of analysis, but every appraiser was able to utilize every piece of software (the CAMA system and Excel). In other words, it was a simple way to proceed with everyone onboard.
Figure 4 shows a January 2009 testing of the 25 percent time adjustment on the then-existing 2008 sales. Prior to recalibrating the system, the 2008 sales were run against 2008 assessments to determine the percentage increase from last year’s final tax roll values. This year’s roll will reflect values on January 1, 2009, based on all verified market evidence dur-ing 2008. In figure 4, statistics for each month are listed, and the cumulative percentage market adjustment is shown next to the month. The first ratio column is a simple calculation of the sales ratio summary statistics for the median and the mean. The second ratio column is calculated from the time
adjusted (to January 1, 2009) sale prices. The target ratio is a median assessment level of about 85 percent to meet the tax roll approval criteria of the Florida Department of Revenue. The simple sales ratio and the time-adjusted ratio were 25.96 percent and 26.87 percent higher, respectively, than the 85 percent desired level (see December medians of 1.1096 and 1.1187 less 0.85). This is calculated simply by subtracting 85 percent from each cumulative median percentage for the month of December. Both percentages again reinforced the early estimate of 25 percent as the target market decline for residential properties.
Figure 5 demonstrates, on a single property, the logic of time-adjusting sales data. It is basically a simple process, universally accepted but not universally utilized in the mass appraisal in-dustry. In my opinion, the realities of the 2007–2009 declining markets make time-adjusting sales data (perhaps for multiple years) a necessity for accurate calibration of CAMA systems.
Figure 6 shows statistics from adjusting both 2007 and 2008 sales together at 1 percent per month (12 percent annually) for 2007 sales and at 2.1 percent per month (25 percent annually) for 2008 sales. At the time, I wrote on the spreadsheet that it was “… the beginning point for planning the 2009 Tax Roll.” Since then, the process was been repeated in biweekly status reviews. As I write this, the first official report of tax-roll figures has been made, with the formal preliminary tax roll due in three more weeks. This particular run indicated that the 2008
Figure 4. Simple sales ratios and time-adjusted sales ratios
Figure 5. Example of time-adjusting sale price for a single property
18 Fair & Equitable • August 2009
final values were 27 percent behind the time-adjusted 2007 and 2008 sale prices. This spreadsheet, as others that followed, continued to reinforce the estimated market drop of 25 percent.
Calibrating from “Listing-to-Assessment Ratios”Properties rarely sell for their listing prices. Therefore, the assumptions re-garding their relationship to “appraised value” cannot be made about listings as with bona fide sale prices. Ratios of listing prices to sale prices are kept by most multiple listing services and, when used as averages, can be very useful. However, the county was suffering from a lack of sales, so although listings were plentiful, the lack of sales still limited the analysis.
Listing data were used several ways. We found reliable results when listings were used as a guide at the neighborhood level to calibrate either nearness to a current market value or percentage movement from a previous tax-roll value. The ratios used were:
• Ratiooflistingstosale and tax-roll values
• Ratio of listings to prior-year tax-roll values
• Ratioof listings to current-year tax-roll values.
The ratio of listings to sales is the statistic normally associated with listings and is usually published by multiple list-ing agencies. The 2008 monthly average listing-to-sales ratio from the Mid-Florida MLS for Volusia County was 0.9335; that is, the average listed property sold for 93.35 percent of the listing price. Prop-erty is valued at a median assessment level of approximately 85 percent, so the anticipated ratio of listing to tax-roll value would be (0.9335 × 0.85) 79.4 percent.
The ratio of listing to prior-year tax-roll value was a new one. It arose out of the necessity of trying to predict where a current-year tax roll was heading without enough sales data to get there. There were 6,387 sales, 9,316 listings, 2,254 foreclosures, and 969 post-foreclosure lender sales. The temptation to use list-ings was created by the sheer numbers involved (it was famine on sales and feast on listings at the same time). There were no new tax-roll values to apply against this potential analytic bowl of data (18,926 sales, listings, and foreclosure transac-tions), but there were the prior-year tax-roll values, which were a formal and official set of numbers.
We then began experimenting with the ratio of listing to final prior-year tax-roll values to determine whether there
was an acceptable level of predictability in comparing 2009 listings to the previ-ous (2008) final tax-roll value on the properties listed. This ratio (of listings to previous tax-roll values) had potential as an indicator of the amount of value movement needed for the upcoming tax-roll value (2009). In other words, the percentage of listing to prior-year values would be an indicator, looking backward instead of forward that would nevertheless provide a target movement forward percentage if looked at in aggre-gate terms (i.e., median percentage by neighborhood). As this listing to prior-year value percentage of change neared the same percentage that sales had de-clined, it then emerged as another (new) piece of market evidence to assist in documenting the reliability of the mass valuations. As discussed earlier, on the basis of median sale prices, countywide, the analysis indicated that the market had declined 25 percent from January 1, 2008 to January 1, 2009. Note that this use of listings was strictly limited to a guide to the amount of value movement in viewing CAMA system calibration at the neighborhood level. Specific property listings were never tied to specific prop-erty assessment valuations.
The ratio of listing to current-year tax-roll values (for 2009 assessments) ranged from 62 percent to 66 percent. Last year
Feature StoryFigure 6. Ratio of time-adjusted 2007 and 2008 sales to 2008 official final tax-roll values indicating percentage of movement needed and percentage drop in prices
Fair & Equitable • August 2009 19
that same percentage was about 10 points higher (72 percent to 75 percent). It was lower this year because of the increased rate of decline in market prices (see list-ing statistics in figure 6). Listing statistics vary widely by property type but appear most reliable on residential properties. Listing prices on many properties over the past two years have been lowered one or more times, and there was no way to know which listing it was—first, second, third, or fourth. The ratio of median list-ing to current-year tax-roll values was still, however, very useful in neighborhoods with no sales but some listings. Using this ratio, along with those from comparable neighborhoods, as an auditing tool pro-vided more comfort in making neighbor-hood adjustments without conventional sales data. In this declining economy, a neighborhood without sales should still be valued, reflecting downward market trends.
Figure 7 shows the culmination of both multiyear time-adjusted sales ratios and listing analysis in one of the county’s ap-praisal districts. It is an actual spreadsheet that was discussed biweekly as appraisers
plodded through their analysis, neighbor-hood by neighborhood. This particular one was discussed at the June 3, 2009 meeting. The spreadsheet is broken into sections, each showing analytic totals from different forms of analysis:
• Neighborhooddata
• 2008finaltax-rollvaluestatistics
• 2009preliminarytax-rollvaluestatis-tics, using 2008 time-adjusted sales
• 2009preliminarytax-rollvaluestatis-tics, using 2007 and 2008 time-adjusted sales
• Listingstatistics,beforeandaftertime-adjusting.
Neighborhood DataDistrict 2 contains 508 neighborhoods with 44,925 residential properties. Dis-trict 2 had only 1,049 residential sales in 2009 and 1,311 in 2007. Using the multiyear time-adjusted sales more than doubled the data (to 2,360 sales) for analysis and added greatly to the reli-ability of the final product (2009 tax roll values).
2008 Final Tax-Roll Value StatisticsFigure 7 illustrates the 2008 tax-roll statistics, achieving the 85 percent target assessment level on the last two time-adjusted sales. It also displays value-level and equity statistics in the form of mean, median, coefficient of variation (COV), coefficient of dispersion COD, and price-related differential (PRD). This standard set of statistics is part of the neighborhood analytic function in the CAMA system.
2009 Preliminary Tax-Roll Value Statis-tics, Using 2008 Time-Adjusted SalesThe spreadsheet contained only neigh-borhoods for which all adjustments had been finished, so at each biweekly meet-ing, this spreadsheet and the percentage completed grew. Looking at the statistics this way showed that the target levels of valuation and equity were being met. The 2009 statistics in District 2 appear very good using only 2008 sales. However, all the neighborhoods could not have been calibrated this well without the early ana-lytic tools (sales and listings). Using both 2007 and 2008 sales, as well as the early projections with listing to prior-year tax-roll values enabled us to document with confidence the decline in the market, as well as the expected movement forward from last year’s tax roll.
It also enabled us to know how much movement was needed in neighborhoods with no data at all. Neighborhood #3906, on line 503 in figure 7, with no sales and four listings, was adjusted 23.5 percent downward. Neighborhood #3906 is an at-tractive beachside location. The resulting valuation is consistent with the average listing to 2009 tax-roll value percentages in District 2. Those neighborhoods in which the percentage of increase var-ied significantly from the average were checked individually and found to have either new construction or other factors affecting their higher or lower average percentage. When there are no sales or listings, comparable neighborhoods are sought. The procedure is to list com-parable neighborhood numbers in the neighborhood files so that they can be referenced as evidence in judicial hear-ings later, as well as to help with equitable revaluation.
Figure 7. Summary of neighborhood and sales statistics for District 2 (Daytona Beach, Ormond Beach, Holly Hill), June 3, 2009
20 Fair & Equitable • August 2009
2009 Preliminary Tax-Roll Value Statistics, Using 2007 and 2008 Time-Adjusted SalesThis section demonstrates the richness of having 2,360 sales instead of 1,049 in District 2. We were amazed at the accuracy and consistency of using two years’ worth of sales instead of one. We expected to have to explain disparities between years, but the analysis in all five appraisal districts showed the separate statistics for 2008 and 2007–2008 together within one or two percentage points of each other, which validated the process.
Early in the process the 2008 and 2007–2008 sales were run against the previous (2008) tax-roll official values, as dis-cussed earlier (see figure 6). After it became evident that the movement forward percentages and market decline percent-ages were reconciling, the movement forward calculation was dropped because it was no longer necessary. It did, however, provide very valuable insight into a market, which at that time was yielding few to no pictures at all.
Listing Statistics, before and after Time-AdjustingThe listing statistics, like sales, were first calculated against the prior-year tax-roll values because we were, at that time, trying to estimate where the 2009 tax-roll valuations were headed—we knew the direction was down. Earlier biweekly versions of figure 7 contained this analysis and, as previously discussed, were deleted from the spreadsheet, because the analysis was no longer needed. That is, listing statistics, which we had never used this way prior to 2008 and expanded upon in 2009, are a very valuable tool with great usefulness in markets without adequate sales data. The listing to prior-year tax-roll values analysis provided clear (and we believe accurate) insight into the percentage of directional movement needed from the prior-year tax roll to estimate the degree of market change. The process can be useful in preparation of a current-year tax roll. We estimated this would be about 63 percent (listing-to-sale ratio × 85 percent normal assessment level = 79 percent × an early estimated market drop of 20 percent = 63 percent). Figure 7 shows the overall listing to tax-roll value ratio in Dis-trict 2 as 66.22 percent.
Rather than using these statistics as formative ones to set value, we used them initially to assist in setting direction and later as further documentation at a neighborhood level reaf-firming the value level set by the multiyear time-adjusted sales ratio analysis. Listing data provided guidance and affirmation at both ends of the valuation cycle (formative and continual stages)—all very much needed in this difficult market. Listing analysis will remain as an active part of our analytic toolbox.
Additional Paradigm Shifts Regarding Foreclosures and Short SalesForeclosures and short sales have, traditionally, been consid-ered unusable in market value levels of analysis. In 2008, how-ever, and continuing into 2009 (for next year’s 2010 process), Volusia County has entire neighborhoods where foreclosures
are the only market that exists. Can it be stated, in this mar-ket that has never shown its face before, that the only sales transactions that are occurring are not representative of the value of those properties? Some say “no”; some say “yes.” The “willing buyer and seller” part of most definitions of market value tends to discard foreclosures under any circumstances because one party would “not be willing.” However, under cur-rent economic conditions, it is possible that both parties are getting the foreclosure price as high as they can and that both want to see the transaction successfully completed.
The circumstance may not be optimum, but both parties are willing to see the property sold at the highest possible price under current economic conditions. This is certainly a point for much debate, but the Volusia County’s Property Appraiser’s office has tried to research and has “qualified” all foreclosures that appeared to be representative of the market this year. The number of foreclosures tripled in 2008 and thus far 2009 looks like a repeat performance. Our newly analyzed and qualified categories of market evidence have proven critically important in this difficult valuation year.
Short sale—an interesting term—is used to describe a dis-tressed sale in which a bank or mortgage holder has agreed to settle a mortgage (in trouble) for less than is owed. The objective is to have the property “get out from under” the debt or, simply put, to unload the property with the potential problem. Short sale as a term, however, never shows up on any document. The term refers to a general circumstance, but, to my knowledge, no sale document is identified as such. Therefore, if any short sales were used in the analysis, there was no way of knowing how many, where they were, or when they happened. If a warranty deed was processed, the buyer and seller were contacted, and if we concluded that conditions of a market sale were met, we qualified the sale.
Feature Story
Figure 8. Summary statistics for Volusia County stratum 1 for Florida Department of Revenue
Fair & Equitable • August 2009 21
Figure 8 contains the summary statistics that will be calculated from the data tape submitted to the Florida Department of Rev-enue (as of this date). The department breaks every county’s tax roll into seven strata by groupings of property class (PC) codes. PC codes 01, 02, 04, 05, and 06 contain residential-type properties including single-family, mobile homes on owned land, condominiums, duplexes, and the like. The analysis for this article was performed on single-family and condominium properties alone (but with separate spreadsheet analysis).
Included are statistics from the 2007–2008 time-adjusted sales analysis, the simple unadjusted sales ratio from 2008 sales, a fourth quarter median analysis (used by the Florida Depart-ment of Revenue), and the time-adjusted 2008 sales analysis. The time-adjusted 2007–2008 sales statistics show a median ratio of 85.21 percent, and the time-adjusted median ratio for 2008 sales is 84.98 percent. Since the target was 85 percent, as they say at the farm, “it’s about time to put this one to bed.”
The Florida Department of Revenue has tax-roll-approval “standards,” which conform to those of IAAO. With statistics like these, we anticipate no problems in the tax-roll approval process and believe strongly that our values would not be as sol-idly documented without extensive use of “market evidence,” as well as time-adjusting sales for the past two years.
SummaryThe Volusia County Property Appraiser’s office would never
have been able to produce the level of value or level of equity exhibited in figures 7 or 8 without having changed its market evidence paradigms. As I stated to senior staff as we began considering options, “We aren’t just looking at changing paradigms, we need to find two new dimes.” Calibrating mass appraisal models using 2008 sales data alone was close to a mission impossible, although, since we must produce a tax roll each year, we will do just that. Expanding our analysis into new areas made us more comfortable and confident than we would have been without it. And the 2010 tax roll is going to require the same treatment because market prices, while showing signs of slowing, are still declining. n
Morgan B. Gilreath, Jr. has been the Property Appraiser (Assessor) of Volusia County, Florida, since 1992. He is a former Senior Instructor for IAAO and has served a total of 19 years on the IAAO Education Committee, the Ad Hoc Committee on Computer-Assisted Appraisals, and the Research & Technology Committee. He has published articles in the Journal of Property Tax Assessment & Administra-tion and in F&E and has been a presenter at a number of IAAO International Conferences.
www.devnetinc.com
Call toll free 866.4.DEVNET or visit us at: www.devnetinc.com
cuttingGovernment
SoftwareSolutions
introducing!
A hip new web o�ering from DEVNET
TM
DEVNET o�ers user friendly, productive and intelligent Microsoft Windows Solutions!