Page 1
VIRGINIA CENTER FOR TRANSPORTATION INNOVATION AND RESEARCH
530 Edgemont Road, Charlottesville, VA 22903-2454
www. VTRC.net
Development of Local Calibration Factors and Design Criteria Values for Mechanistic-Empirical Pavement Design http://www.virginiadot.org/vtrc/main/online_reports/pdf/16-r1.pdf BRYAN SMITH, P.E. Pavement Engineer Virginia Department of Transportation HARIKRISHNAN NAIR, Ph.D., P.E. Research Scientist Virginia Center for Transportation Innovation and Research
Final Report VCTIR 16-R1
Page 2
Standard Title Page - Report on Federally Funded Project
1. Report No.: 2. Government Accession No.: 3. Recipient’s Catalog No.:
FHWA/VCTIR 16-R1
4. Title and Subtitle: 5. Report Date:
Development of Local Calibration Factors and Design Criteria Values for
Mechanistic-Empirical Pavement Design
August 2015
6. Performing Organization Code:
7. Author(s):
Bryan Smith, P.E., and Harikrishnan Nair, Ph.D., P.E.
8. Performing Organization Report No.:
VCTIR 16-R1
9. Performing Organization and Address:
Virginia Center for Transportation Innovation and Research
530 Edgemont Road
Charlottesville, VA 22903
10. Work Unit No. (TRAIS):
11. Contract or Grant No.:
105200
12. Sponsoring Agencies’ Name and Address: 13. Type of Report and Period Covered:
Virginia Department of Transportation
1401 E. Broad Street
Richmond, VA 23219
Federal Highway Administration
400 North 8th Street, Room 750
Richmond, VA 23219-4825
Final
14. Sponsoring Agency Code:
15. Supplementary Notes:
16. Abstract:
A mechanistic-empirical (ME) pavement design procedure allows for analyzing and selecting pavement structures based
on predicted distress progression resulting from stresses and strains within the pavement over its design life. The Virginia
Department of Transportation (VDOT) has been working toward implementing ME design by characterizing traffic and materials
inputs, training with the models and design software, and analyzing current pavement designs in AASHTOware Pavement ME
Design software.
This study compared the measured performance of asphalt and continuously reinforced concrete pavements (CRCP)
from VDOT’s Pavement Management System (PMS) records to the predicted performance in AASHTOware Pavement ME
Design. Model coefficients in the software were adjusted to match the predicted asphalt pavement permanent deformation,
asphalt bottom-up fatigue cracking, and CRCP punchout outputs to the measured values from PMS records. Values for reliability,
design life inputs, and distress limits were identified as a starting point for VDOT to consider when using AASHTOware
Pavement ME Design through consideration of national guidelines, existing VDOT standards, PMS rating formulas, typical
pavement performance at time of overlay, and the data used for local calibration.
The model calibration coefficients and design requirement values recommended in this study can be used by VDOT with
AASHTOware Pavement ME Design as a starting point to implement the software for design, which should allow for more
optimized pavement structures and improve the long-term performance of pavements in Virginia.
17 Key Words: 18. Distribution Statement:
Local calibration, ME Pavement Design, asphalt pavement,
concrete pavement, M-E design criteria
No restrictions. This document is available to the public
through NTIS, Springfield, VA 22161.
19. Security Classif. (of this report): 20. Security Classif. (of this page): 21. No. of Pages: 22. Price:
Unclassified Unclassified 45
Form DOT F 1700.7 (8-72) Reproduction of completed page authorized
Page 3
FINAL REPORT
DEVELOPMENT OF LOCAL CALIBRATION FACTORS AND DESIGN CRITERIA
VALUES FOR MECHANISTIC-EMPIRICAL PAVEMENT DESIGN
Bryan Smith, P.E.
Pavement Engineer
Virginia Department of Transportation
Harikrishnan Nair, Ph.D., P.E.
Research Scientist
Virginia Center for Transportation Innovation and Research
In Cooperation with the U.S. Department of Transportation
Federal Highway Administration
Virginia Center for Transportation Innovation and Research
(A partnership of the Virginia Department of Transportation
and the University of Virginia since 1948)
Charlottesville, Virginia
August 2015
VCTIR 16-R1
Page 4
ii
DISCLAIMER
The contents of this report reflect the views of the authors, who are responsible for the
facts and the accuracy of the data presented herein. The contents do not necessarily reflect the
official views or policies of the Virginia Department of Transportation, the Commonwealth
Transportation Board, or the Federal Highway Administration. This report does not constitute a
standard, specification, or regulation. Any inclusion of manufacturer names, trade names, or
trademarks is for identification purposes only and is not to be considered an endorsement.
Copyright 2015 by the Commonwealth of Virginia.
All rights reserved.
Page 5
iii
ABSTRACT
A mechanistic-empirical (ME) pavement design procedure allows for analyzing and
selecting pavement structures based on predicted distress progression resulting from stresses and
strains within the pavement over its design life. The Virginia Department of Transportation
(VDOT) has been working toward implementing ME design by characterizing traffic and
materials inputs, training with the models and design software, and analyzing current pavement
designs in AASHTOware Pavement ME Design software.
This study compared the measured performance of asphalt and continuously reinforced
concrete pavements (CRCP) from VDOT’s Pavement Management System (PMS) records to the
predicted performance in AASHTOware Pavement ME Design. Model coefficients in the
software were adjusted to match the predicted asphalt pavement permanent deformation, asphalt
bottom-up fatigue cracking, and CRCP punchout outputs to the measured values from PMS
records. Values for reliability, design life inputs, and distress limits were identified as a starting
point for VDOT to consider when using AASHTOware Pavement ME Design through
consideration of national guidelines, existing VDOT standards, PMS rating formulas, typical
pavement performance at time of overlay, and the data used for local calibration.
The model calibration coefficients and design requirement values recommended in this
study can be used by VDOT with AASHTOware Pavement ME Design as a starting point to
implement the software for design, which should allow for more optimized pavement structures
and improve the long-term performance of pavements in Virginia.
Page 6
1
FINAL REPORT
DEVELOPMENT OF LOCAL CALIBRATION FACTORS AND DESIGN CRITERIA
VALUES FOR MECHANISTIC-EMPIRICAL PAVEMENT DESIGN
Bryan Smith, P.E.
Pavement Engineer
Virginia Department of Transportation
Harikrishnan Nair, Ph.D., P.E.
Research Scientist
Virginia Center for Transportation Innovation and Research
INTRODUCTION
The Virginia Department of Transportation (VDOT) maintains a roadway network of
more than 126,000 lane-miles. With this large roadway network and a limited budget, it is
critical that appropriate pavement structures are constructed that can efficiently withstand traffic
loading and weathering effects over the design life.
VDOT’s current pavement design procedure (VDOT, 2008) for all new and rehabilitated
pavements is based on the 1993 American Association of State Highway and Transportation
Officials (AASHTO) Guide for Design of Pavement Structures (hereinafter 1993 AASHTO
design guide) (AASHTO, 1993). This empirical design procedure is based on the results of the
AASHO Road Test of the late 1950s in which the designed pavement thickness was found to be
primarily a function of the anticipated service life, the serviceability of the pavement, and the
number of equivalent traffic loads applied.
AASHTO has since released the Guide for the Mechanistic-Empirical Design of New &
Rehabilitated Pavement Structures (MEPDG) that uses the calculated mechanistic response
combined with empirical results from pavement test sections in the Long-Term Pavement
Performance (LTPP) Program to predict the performance of pavement structures (Applied
Research Associates, Inc. [ARA, Inc.], 2004). The mechanistic-empirical (ME) design process
presents a major change in pavement design from the 1993 AASHTO design guide. It calculates
pavement responses (stresses, strains, and deflections) based on inputs such as traffic, climate,
and materials parameters to predict the pavement damage over time for both asphalt and concrete
(Portland cement concrete) pavements. After this step, transfer functions relate computed
pavement responses (e.g., pavement damage) to observed pavement distresses. The ME design
procedure will be able to improve upon the pavement design methodology from the 1993
AASHTO design guide because of the mechanistic component; further, the pavement test
sections more closely resemble the pavements being designed and constructed in today’s
environment than those constructed for the AASHO Road Test. This ME design procedure was
incorporated into AASHTOware Pavement ME Design software (hereinafter Pavement ME
Design) to provide a functional tool for developing pavement designs using ME principles.
Page 7
2
VDOT currently uses Pavement ME Design to analyze pavement designs developed in
accordance with the 1993 AASHTO design guide, and no adjustment is being made to the
pavement structure based on the ME outcome.
VDOT developed a plan to implement ME pavement design procedures in 2007 that
outlined steps to provide a functional version for VDOT (VDOT, 2007). The tasks involved
developing traffic inputs, characterizing material properties, calibrating and validating the
models, and providing training. Researchers at the Virginia Center for Transportation Innovation
and Research (VCTIR) have conducted many studies that helped identify traffic data collection
needs and develop traffic loading inputs that can be used for design (Cottrell and Kweon, 2011;
Cottrell et al., 2003; Smith and Diefenderfer, 2010). Other studies considered various asphalt
mixtures and existing pavement to initiate a catalog of asphalt material properties for use with
ME design (Apeagyei and Diefenderfer, 2011; Diefenderfer, 2010; Flintsch et al., 2007; Loulizi
et al., 2006). Studies also characterized unbound and subgrade materials and identified test
methods to correlate with resilient modulus (Hossain, 2008; Hossain, 2010; Hossain and Kim,
2014). Based on these studies, ongoing research, discussions with experts, and testing in
Pavement ME Design, a draft manual for using Pavement ME Design that details how designers
should enter project information was developed (VDOT, 2013a).
One of the final tasks in implementing the ME design process is to perform validation,
calibration, and verification of the models to substantiate that the predicted pavement
performance matches what is observed in Virginia for the distress and ride quality values. In
addition, requirement values for pavement design should be reviewed so that pavement
structures are expected to achieve an acceptable level of performance throughout their design life
with a cost-effective design. AASHTO (2010) highly recommends that each agency conduct an
analysis of the results of Pavement ME Design to determine if the nationally calibrated
performance models accurately predict field performance, as the performance prediction models
used in ME design may require calibration to local conditions.
PURPOSE AND SCOPE
The purpose of this study was to perform local calibration of the distress models included
in Pavement ME Design so that they would better match VDOT’s observed performance. In
addition, preliminary values for performance targets, reliability, and design life criteria were to
be developed to provide a full set of inputs for VDOT to use to develop pavement designs using
Pavement ME Design.
The study included a review of both asphalt and concrete distress prediction models for
pavements in Virginia to develop a set of calibration factors applicable for the entire state. The
calibration was based on a comparison of predicted permanent deformation, cracking, punchouts,
and International Roughness Index (IRI) values and the measured values from VDOT’s
Pavement Management System (PMS). It was expected that further refinement of the calibration
coefficients might be necessary and that model improvement would continue beyond the initial
implementation.
Page 8
3
METHODS
Three tasks were conducted to fulfill the purpose of the study:
1. A literature review was conducted to document the experiences of other
transportation agencies in calibrating and implementing ME design procedures.
2. Local calibration was performed to remove bias and assess standard error of distress
models for asphalt and concrete pavements.
3. Suggested values for design requirements were developed.
Literature Review
The literature search was conducted by searching various databases such as TRID, the
Catalog of Transportation Libraries (TLCat), the Catalog of Worldwide Libraries (WorldCat),
and the Transportation Research Board’s Research in Progress (RiP) and Research Needs
Statements (RNS) databases.
Local Calibration of Distress Models
The local calibration process for this study was similar to the procedure outlined by
AASHTO in Guide for Local Calibration of the Mechanistic-Empirical Pavement Design Guide
(hereinafter AASHTO local calibration guide) (AASHTO, 2010). The guide offers an 11-step
procedure for local calibration as follows:
1. Select input level for each parameter.
2. Develop local experimental plan and sampling template.
3. Estimate sample size for specific distress prediction models.
4. Select roadway segments.
5. Extract and evaluate distress and project data.
6. Conduct field investigations.
7. Assess local bias.
8. Eliminate local bias of distress and IRI prediction models.
9. Assess the standard error of the estimate.
10. Reduce the standard error of the estimate.
11. Interpret the results.
Select Input Level for Each Parameter
VDOT’s Pavement ME User Manual—Draft (VDOT, 2013a) describes VDOT’s current
procedure for inputting project details to perform pavement analysis using Pavement ME Design.
Material, subgrade, traffic, and climate inputs used in the local calibration are based on these
procedures to mimic what would be used in design.
Page 9
4
Select Roadway Segments
VDOT began the local calibration effort in 2009, prior to the publication of the AASHTO
calibration guide, by identifying test sections to use for calibration. Although a detailed
sampling template and minimum sample size requirements were not established, VDOT
recognized that a large, varied sample of projects would be necessary to provide a representative
account for pavement performance in Virginia. The initial goal was to identify five asphalt
pavement sites from each VDOT district that were built after 1999 and that were more than 0.5
mi long with more than 8 in of asphalt.
PMS data were used to identify concrete pavement sites for calibration of concrete
pavement models. Sites with both continuously reinforced concrete pavements (CRCP) and
jointed plain concrete pavements (JPCP) were sought; projects with construction dates after 1985
with a minimum section length of 0.5 mi were included.
Extract and Evaluate Pavement Distress and Project Data
The project information for each calibration site required two aspects: field performance
records and project details. The field performance records were extracted from VDOT’s PMS
network level distress data. VDOT has automated distress data available beginning in 2007 at
yearly intervals for all interstate and primary roadways. Distress data are measured at 0.1-mi
intervals; the distresses at each interval within the project section were averaged to obtain the
average distress for each site per year.
For asphalt pavement distress data, the rutting depth (inches), fatigue cracking—labeled
as alligator cracking in PMS (square feet, three severity levels), and IRI (inches/mile) were used
in calibration. Longitudinal cracks are recorded in PMS; however, these cracks are defined as
outside the wheelpath and different from the longitudinal cracks predicted in Pavement ME
Design that are assumed to be loading induced from the top of the pavement. Instead, the low
severity (Level 1) fatigue cracks were assumed to be longitudinal cracks in Pavement ME Design
predictions, and medium and high severity (Levels 2 and 3) alligator cracks were matched with
the Pavement ME Design fatigue cracking predictions. The AASHTO local calibration guide
suggests combining cracking types if the location where cracking initiated is not known and
adjusting the bottom-up fatigue cracking model to fit the data (AASHTO, 2010).
CRCP distresses recorded in PMS include punchouts (count and square feet), cluster
cracks (count and square feet, two severity levels), concrete patches (square feet, three severity
levels), asphalt concrete patches (square feet), and IRI (inches/mile). The main distress that is
predicted for CRCP in Pavement ME Design is punchouts (Pavement ME Design also classifies
cluster cracks as punchouts). The measured area of punchouts was related to the number of
punchouts by assuming the area of each punchout to be 25 ft2
based on the typical lane width and
definitions of crack spacing for punchouts (Miller and Bellinger, 2003). The number of
punchouts from area distress measurement was used because it appeared more consistent year to
year than the PMS count of punchouts. Some of the CRCP were known to have premature
deterioration attributable to the method used to place the reinforcement. These sections had
Page 10
5
patching to repair failures soon after construction but still remain in service; these sites were
included, and patched areas were disregarded.
The project-specific data entered into Pavement ME Design to produce predicted
distresses were collected from a combination of sources. Asphalt pavement structure
information including layer types, layer thicknesses, and year of construction information was
provided by VDOT district materials personnel. The available subgrade information varied by
project; when available, the subgrade classification was combined with records of resilient
modulus testing of similar local materials. Otherwise, subgrade properties were taken from
records of typical materials encountered in the area on recent projects with resilient modulus test
data. Concrete pavement structure information, including base type, depth of concrete, and
shoulder type, was obtained from construction records in PMS and current pavement images
from pavement management; all CRCP were modeled with 0.7% steel at mid-depth.
Traffic count records were averaged at each section beginning with the year of
construction to obtain the average daily traffic (ADT) over the analysis period. A zero growth
rate was used for all vehicle classes because average ADT values already accounted for changes
in traffic volume over the period. The percent truck traffic was selected from the design year to
determine the average annual daily truck traffic (AADTT) for input into Pavement ME Design.
A single weather station was selected near the project location. Statewide average values
were used for asphalt mixture properties (by mixture type), concrete material properties,
aggregate base properties, vehicle class distribution, axle load spectra, and axles per truck in
accordance with VDOT’s Pavement ME User Manual—Draft (VDOT, 2013a). Other inputs
were left at national default values.
Checks were performed on the distress and construction records to remove data points
that seemed unreasonable. Project sites that indicated pavement layers with zero thickness were
removed if the appropriate pavement structure could not be ascertained. PMS data were not
considered at sites after rehabilitation was performed. The year of rehabilitation was identified
for asphalt sites when the PMS data showed an improvement in the Critical Condition Index
(CCI) or IRI of 10% or greater. For concrete pavement sites with rehabilitation by asphalt
overlay, PMS data would no longer show distress rating criteria required for concrete-surfaced
pavements. Concrete pavements with significant patching rehabilitation were identified by a
10% or greater CCI improvement that withstood two consecutive years; this was done because
the concrete pavement CCI data showed high year-to-year variability that did not always
represent rehabilitation. Data on sites prior to rehabilitation were still included for use in
calibration.
Assess and Reduce Local Bias and Standard Error of the Estimate
The main parameters to evaluate the fit of the distress or IRI prediction models are the
bias and standard error of the estimate (Se). These terms are defined as the systematic offset
between predicted and observed values and the variability between the predicted and measured
values, respectively (AASHTO, 2010). The residual error represents the difference between the
measured and predicted values for each data point; the bias was calculated as the average of the
Page 11
6
individual residual errors, and the Se was the standard deviation of the residual error. Another
way used to evaluate the residual error is to compare the Se to the standard deviation of the
measured distress (Sy); the Se/Sy ratio should decrease with local calibration. These values were
calculated by entering the predicted and measured performance in a spreadsheet. Adjustments to
the calibration coefficients for each model were made using a generalized reduced gradient non-
linear tool to eliminate or reduce the bias and improve the Se.
The AASHTO local calibration guide notes the importance of both the calibration and
validation steps being a part of the local calibration effort; calibration is the process to minimize
the residual error (difference between observed and predicted values), and validation is the
process of applying the model to data that were not used in calibration to ensure the model
statistics are similar to those from calibration, confirming the robustness of the model. If the
model statistics are similar, the calibration and validation datasets are recombined to refine the
model coefficients based on the entire available set of data (AASHTO, 2010). One of two
procedures may be used for validation: (1) withhold 20% of the sites from the calibration data
(called split-sample validation), or (2) remove a single site from the calibration data (called the
jackknife procedure) (AASHTO, 2010).
The total rutting and bottom-up fatigue cracking were the primary models of interest for
asphalt pavements, with IRI also being considered. Pavement ME Design also includes models
to predict top-down fatigue cracking, thermal cracking, and chemically stabilized fatigue; these
models were not considered for calibration at this time because either the models have revisions
pending based on research under the auspices of the National Cooperative Highway Research
Program (NCHRP) to improve the model or the distresses lack sensitivity in predictions for
Virginia sections. CRCP pavement calibrations focused on the punchout and IRI predictions.
Pavement ME Design has models for JPCP percent of cracked slabs and faulting distress, which
were not considered because of the lack of sites with that pavement type in Virginia.
The calibration coefficients considered for adjustment to improve the model fit are shown
in Table 1.
Table 1. Recommendation From AASHTO (2010) for Transfer Function Calibration Coefficients
to Be Adjusted for Eliminating Bias and Reducing the Standard Error
Distress Eliminate Bias Reduce Standard Error
Asphalt Pavements
Total rutting Unbound materials and asphalt layers βs1 or βr1 βr2, βr3
Load-related cracking Alligator cracking C2 or βf1 βf2, βf3, and C1
Longitudinal cracking C2 or βf1 βf2, βf3, and C1
Semi-rigid pavements C2 or βc1 C1, C2, C4
Non–load-related cracking Transverse cracking βf3 βf3
IRI C4 C1, C2, C3
Concrete Pavements
JPCP faulting C1 C1
JPCP fatigue cracking C1 or C4 C2, C5
CRCP punchouts Fatigue C1 C2
Punchouts C3 C4, C5
Crack widths C6 C6
IRI JPCP C4 C1
CRCP C4 C1, C2
IRI = International Roughness Index; JPCP = jointed plain concrete pavement; CRCP = continuously reinforced concrete
pavement.
Page 12
7
The distress and IRI models with the coefficients from Table 1 are shown here; variable
definitions and other details for the models can be found in the AASHTO MEPDG Manual of
Practice (AASHTO, 2008).
Asphaltrutting = �k�10���n������T������
Base/Subgraderutting = β#�k#�ε% &ε'ε�( e
)*+,-.
N0)123 = k0�4C64C16β0�4ε76�8��8�4E1236�8��8�
Fatiguecracking<=77=> = & 160( @
CA1 + e*C�C�∗EC�C�∗F=G4HIJKLLKM∗�''6-N
IRIQRSTUVRS = IRI' + C� ∗ RD + CX ∗ FC7=7YR + CZ ∗ TC + CA ∗ SF
Punchouts = CZ1 + CA ∗ DI]^C_
IRIC`C] = IRII + C� ∗ PO + CX ∗ SF
Development of Suggested Values for Design Requirements
Another key area of concern for VDOT prior to implementing ME design procedures is
selecting design requirement properties—specifically design life, reliability level, and target
performance values. These values are an important component of the transition from analysis of
pavement structures with Pavement ME Design to development of pavement designs that can
efficiently balance cost and pavement performance. The decision on selecting these values
reflected a few different perspectives:
• national guidelines
• previous VDOT design standards
• data from end-of-service pavements in Virginia
• relationships between distress in serviceability used in PMS
• values in local calibration site data
• experience of VDOT district and field personnel.
Example pavement designs were developed for hypothetical scenarios to demonstrate
how the revised local calibration coefficients and design criteria values relate to a pavement
structure. Three design scenarios were considered with low, medium, and high traffic levels
combined with test records of subgrade properties and climate data from different locations in
Virginia.
Page 13
8
RESULTS AND DISCUSSION
Literature Review
A research report from the Federal Highway Administration (FHWA) on the use of PMS
data when ME distress models are calibrated identified some recommendations for agencies to
consider when using these data to calibrate locally (FHWA, 2010). The first recommendation
was to evaluate the measured distress data and ensure they are consistent with the distress
definitions when Pavement ME Design was developed; further, the material, traffic, and climate
parameters should be reviewed to determine changes from the default inputs that are necessary to
model the project sections accurately. Some of the other challenges identified were the lack of
distress or pavement material information, limited ranges of distress values and pavement service
life, and fewer sites than needed for statistically meaningful calibration.
In preparation for local calibration of ME distress models, the Georgia Department of
Transportation (DOT) commissioned a synthesis study of local calibration activities being
conducted by state highway agencies (Von Quintus et al., 2013). The study showed that many
states were working toward calibration by focusing on building design input libraries for material
and traffic inputs. Further, the study showed that states that performed local calibration of
asphalt pavements consistently found that the global predictions from the ME design method
overpredicted rutting and developed local calibration factors to improve the prediction. The
local calibration of the asphalt fatigue cracking transfer function showed more variability than
the rutting model, but it reasonably estimated the measured levels of cracking over a broad range
of pavement structures. One state, Arizona, had performed local calibration of CRCP punchout
and IRI models and found the global calibration coefficients for the CRCP models to be
reasonable. Utah, Colorado, and Wyoming found the global calibration coefficients for JPCP
transverse cracking and joint faulting to be acceptable unbiased predictions when correct
materials inputs were used; Arizona found the JPCP global distress models to match field
observations reasonably but made slight adjustments to reduce the error.
The Missouri DOT also commissioned a local calibration of ME models (ARA, Inc.,
2009). To evaluate the models, their study used LTPP data combined with sections from the
state PMS data split into 500-ft-long sections with both statistical and non-statistical approaches.
The statistical approach considered the R2, standard error of the estimate, and bias; hypothesis
testing on the model intercept being equal to 0, and the model slope being equal to 1; and a
paired t-test of measured and predicted distress/IRI values. A non-statistical approach was used
for some models that showed little or no measured distress (i.e., asphalt pavement bottom-up
fatigue cracking and JPCP joint faulting). The study found the default models for predicting
bottom-up fatigue cracking of asphalt pavements and IRI predictions of asphalt overlays on
JPCP to be reasonable, but transverse cracking, total rutting, and IRI prediction for asphalt
pavements were all acceptable after local calibration of the model coefficients. The Missouri
JPCP investigation showed that the national models for slab cracking and joint faulting were
adequate but recalibrated the IRI prediction model.
A report documenting the implementation of the ME design procedure by the Colorado
DOT covered identifying LTPP and PMS sites for calibration, developing traffic and material
Page 14
9
inputs, locally calibrating models, analyzing sensitivity, and comparing design outputs to
previous pavement design results (Mallela et al., 2013). The distress model validation compared
pavement thicknesses on projects determined by the locally calibrated ME models to Colorado’s
previous design strategy using the 1993/1998 AASHTO design procedures (AASHTO, 1993;
AASHTO, 1998). The comparison showed good agreement between the two design methods,
with all the example projects showing thickness values within 1 in. A comparison of pavement
designs from the Indiana DOT showed that thicknesses developed from the ME design procedure
were less than those developed from the 1993 AASHTO procedure for all examples of both
asphalt and concrete pavements; this thickness reduction translated to an estimated cost savings
of more than $10 million (Nantung, 2010).
In a recent NCHRP synthesis project, Pierce and McGovern (2014) surveyed highway
transportation agencies to collect information on implementing the MEPDG. Of the 57 agencies
surveyed, 3 had already implemented the MEPDG at the time of the survey; 8 agencies reported
local calibration of at least some of the asphalt and concrete models (Arizona, Colorado, Florida,
Indiana, Missouri, North Dakota, and Oregon). Agencies reported threshold levels for design
that showed varying distress or IRI performance levels, design lives, and reliability levels based
on the agency; functional classification; traffic level; or distress type considered. These values
were developed from pavement management data, engineering judgment by pavement managers
and designers, sensitivity analysis, previous design standards, and ranges provided in Pavement
ME Design. Agencies that had conducted local calibration work identified the need to reanalyze
when further data were available; a database to maintain all of the data necessary for calibrating
ME models was recommended.
Local Calibration of Distress Models
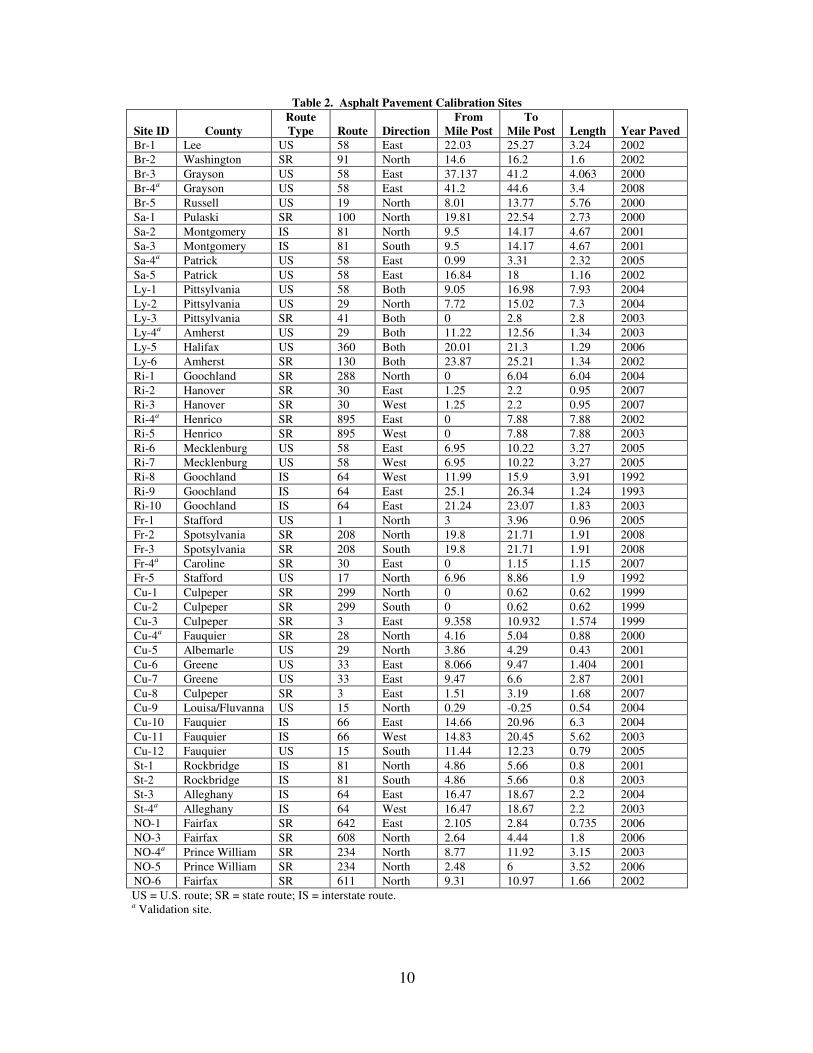
The asphalt pavement sites considered for local calibration are listed in Table 2. These
locations cover eight of the nine VDOT districts; no sites were identified in the Hampton Roads
District because many of the roads there that have had significant construction involve overlays
on concrete pavements, which were not included in this calibration. The Site ID tag is an
identifier that was used to keep track of the projects during calibration. As may be seen, some
asphalt sites were withheld from the calibration dataset to be used for validation. Some sites are
listed as being both directions, and others are listed as being single direction and may contain
parallel routes as separate numbers; directions were combined when the pavement structure and
year of construction were the same for both directions; other cases may have had different years
of construction and therefore were separate sites.
Table 3 shows the CRCP sites used for concrete pavement calibration. A limited number
of concrete pavement sections were available for local calibration, especially for JPCP with only
four projects identified. Therefore, the JPCP models were not reviewed in this study and the
concrete pavement calibration was focused on CRCP. A jackknife approach (n – 1) was used for
validation instead of split-sampling to achieve an independent check on the model; therefore, no
concrete sites were marked as validation sites.
Page 15
10
Table 2. Asphalt Pavement Calibration Sites
Site ID
County
Route
Type
Route
Direction
From
Mile Post
To
Mile Post
Length
Year Paved
Br-1 Lee US 58 East 22.03 25.27 3.24 2002
Br-2 Washington SR 91 North 14.6 16.2 1.6 2002
Br-3 Grayson US 58 East 37.137 41.2 4.063 2000
Br-4a Grayson US 58 East 41.2 44.6 3.4 2008
Br-5 Russell US 19 North 8.01 13.77 5.76 2000
Sa-1 Pulaski SR 100 North 19.81 22.54 2.73 2000
Sa-2 Montgomery IS 81 North 9.5 14.17 4.67 2001
Sa-3 Montgomery IS 81 South 9.5 14.17 4.67 2001
Sa-4a Patrick US 58 East 0.99 3.31 2.32 2005
Sa-5 Patrick US 58 East 16.84 18 1.16 2002
Ly-1 Pittsylvania US 58 Both 9.05 16.98 7.93 2004
Ly-2 Pittsylvania US 29 North 7.72 15.02 7.3 2004
Ly-3 Pittsylvania SR 41 Both 0 2.8 2.8 2003
Ly-4a Amherst US 29 Both 11.22 12.56 1.34 2003
Ly-5 Halifax US 360 Both 20.01 21.3 1.29 2006
Ly-6 Amherst SR 130 Both 23.87 25.21 1.34 2002
Ri-1 Goochland SR 288 North 0 6.04 6.04 2004
Ri-2 Hanover SR 30 East 1.25 2.2 0.95 2007
Ri-3 Hanover SR 30 West 1.25 2.2 0.95 2007
Ri-4a Henrico SR 895 East 0 7.88 7.88 2002
Ri-5 Henrico SR 895 West 0 7.88 7.88 2003
Ri-6 Mecklenburg US 58 East 6.95 10.22 3.27 2005
Ri-7 Mecklenburg US 58 West 6.95 10.22 3.27 2005
Ri-8 Goochland IS 64 West 11.99 15.9 3.91 1992
Ri-9 Goochland IS 64 East 25.1 26.34 1.24 1993
Ri-10 Goochland IS 64 East 21.24 23.07 1.83 2003
Fr-1 Stafford US 1 North 3 3.96 0.96 2005
Fr-2 Spotsylvania SR 208 North 19.8 21.71 1.91 2008
Fr-3 Spotsylvania SR 208 South 19.8 21.71 1.91 2008
Fr-4a Caroline SR 30 East 0 1.15 1.15 2007
Fr-5 Stafford US 17 North 6.96 8.86 1.9 1992
Cu-1 Culpeper SR 299 North 0 0.62 0.62 1999
Cu-2 Culpeper SR 299 South 0 0.62 0.62 1999
Cu-3 Culpeper SR 3 East 9.358 10.932 1.574 1999
Cu-4a Fauquier SR 28 North 4.16 5.04 0.88 2000
Cu-5 Albemarle US 29 North 3.86 4.29 0.43 2001
Cu-6 Greene US 33 East 8.066 9.47 1.404 2001
Cu-7 Greene US 33 East 9.47 6.6 2.87 2001
Cu-8 Culpeper SR 3 East 1.51 3.19 1.68 2007
Cu-9 Louisa/Fluvanna US 15 North 0.29 -0.25 0.54 2004
Cu-10 Fauquier IS 66 East 14.66 20.96 6.3 2004
Cu-11 Fauquier IS 66 West 14.83 20.45 5.62 2003
Cu-12 Fauquier US 15 South 11.44 12.23 0.79 2005
St-1 Rockbridge IS 81 North 4.86 5.66 0.8 2001
St-2 Rockbridge IS 81 South 4.86 5.66 0.8 2003
St-3 Alleghany IS 64 East 16.47 18.67 2.2 2004
St-4a Alleghany IS 64 West 16.47 18.67 2.2 2003
NO-1 Fairfax SR 642 East 2.105 2.84 0.735 2006
NO-3 Fairfax SR 608 North 2.64 4.44 1.8 2006
NO-4a Prince William SR 234 North 8.77 11.92 3.15 2003
NO-5 Prince William SR 234 North 2.48 6 3.52 2006
NO-6 Fairfax SR 611 North 9.31 10.97 1.66 2002
US = U.S. route; SR = state route; IS = interstate route. a Validation site.
Page 16
11
Table 3. Concrete Pavement Calibration Sites
Site ID
County
Route
Type
Route
Direction
From
Mile Post
To
Mile Post
Length
Year Paved
PCC-2 York IS 64 Both 28.820 31.250 2.43 2006
PCC-5 Chesterfield IS 295 East 1.250 2.110 0.86 1992
PCC-6 Henrico IS 295 Both 25.080 37.830 12.75 1990
PCC-7 Prince George IS 295 Both 0.000 5.490 5.49 1992
PCC-8 Prince George IS 295 Both 5.490 12.330 6.84 1992
PCC-9 Norfolk IS 564 Both 1.360 2.110 0.75 1991
PCC-10 Nansemond IS 664 East 2.210 5.630 3.42 1991
PCC-12 Norfolk IS 664 East 0.000 3.920 3.92 1991
PCC-13 York IS 664 Both 1.120 4.030 2.91 1987
PCC-14 Chesterfield SR 76 Both 0.000 9.760 9.76 1988
PCC-15 Nansemond SR 164 West 0.200 1.240 1.04 1991
PCC-16 Chesterfield SR 288 North 0.000 0.630 0.63 1989
PCC-17 Chesterfield SR 288 South 0.000 15.900 15.9 1988
PCC-18 Chesterfield SR 288 Both 16.110 22.620 6.51 2004
PCC-19 Amherst US 29 Both 0.460 11.680 11.22 2005
PCC-20 Greensville US 58 East 9.790 11.290 1.5 1988
PCC-21 Greensville US 58 East 11.290 4.450 6.84 1990
US = U.S. route; SR = state route; IS = interstate route.
Once the projects were selected, an experimental testing matrix was completed to show
the range of base types and pavement thicknesses covered by the calibration sites. This sampling
matrix is shown in Table 4 for asphalt pavement sites and in Table 5 for concrete pavement sites
showing the type of base layer and the thickness of the asphalt or concrete. Some of the
pavement sections also included open-graded drainage layers, large stone base layers, or
stabilized subgrade layers that are not shown in the testing matrix tables but were accounted for
in modeling the pavement structures.
Table 4. Testing Matrix for Asphalt Pavement Sites
Base Type
Asphalt Thickness (in)
5-7 7.1-9 9.1-11 11.1-13 >13
Graded aggregate base 3 8 6 8 5
Cement-treated aggregate 2 5 7 2 0
Select materials 0 1 2 2 0
Stabilized subgrade 0 0 2 0 0
Full-depth asphalt 0 0 0 2 0
Table 5. Testing Matrix for Portland Concrete Pavement Sites
Base Type
Concrete Thickness (in)
8 9 10 12
Graded aggregate base 5 3 1 0
Cement-treated aggregate 0 0 0 1
Select materials 0 4 0 0
Stabilized subgrade 0 2 0 1
Page 17
12
Asphalt Pavement Rutting Calibration
The first model considered in VDOT’s local calibration was the predicted rutting on
asphalt pavements. A comparison of the measured and predicted values of total rutting when the
default global calibration coefficients in Pavement ME Design were used is shown in Figure 1.
This figure shows an overprediction in the amount of rutting, with most of the points falling
above the line of equality.
Statistics for the global and local calibration data are shown in Table 6. The global
calibration values showed a large bias, with the Pavement ME Design models predicting more
than 0.2 in greater rutting than was measured in the field on average. In addition, the standard
error of the estimate indicated a large amount of variability in the differences between measured
and predicted rutting values.
The model intercept factors for asphalt and subgrade rutting were adjusted with the use of
Solver to meet the constraints of a minimum standard error of the estimate and zero bias for total
rutting of the calibration dataset. Table 6 shows the calibration coefficients that were obtained
and indicators of how well the revised model fit the data for the calibration and validation
datasets. The AASHTO local calibration guide suggests that a reasonable limit for the standard
error of the estimate is 0.10 in, based on the typical amounts of rutting that were encountered
nationally (AASHTO, 2010). Both datasets showed little or no bias and acceptable standard
error values. Although the validation dataset showed statistically significant results at an alpha
level of 0.05 for the paired t-test, which suggests the predicted rutting did not match the
measured rutting, the researchers decided to accept the calibration since the validation still
showed a low bias and a Se lower than that of the calibration dataset. Therefore, the model was
recalibrated with the combined calibration and validation datasets to refine the model
coefficients.
Figure 1. Asphalt Pavement Rutting Comparison With Global Calibration Coefficients
Page 18
13
Table 6. Rutting Local Calibration Results
Statistic Global Calibration Local Calibration Validation Combined
Count 236 198 38 236
Bias, in -0.214 0.000 0.023 0.000
Se, in 0.183 0.079 0.033 0.076
R2, % 16.5 22.2 42.8 23.7
p-value (paired t-test) 0.00 1.00 0.0001 1.00
Regression slope 1.546 0.792 0.492 0.812
p-value (slope) 0.017 0.050 0.000 0.050
Regression intercept 0.144 0.027 0.033 0.024
p-value (intercept) 0.000 0.069 0.005 0.069
Se/Sy 3.52 1.50 0.76 1.47
βr1 1.000 0.664 0.664 0.687a
βs1–fine subgrade 1.000 0.151 0.151 0.153a
βs1–granular subgrade 1.000 0.151 0.151 0.153a a Coefficients used to generate Figure 2.
All of the data points were recombined to refine the model coefficients after the
validation model showed a reasonable fit. The resulting calibration coefficients were used to
graph the predicted and measured rutting value comparison with local calibration in Figure 2.
One concern with regard to the local calibration models is the poor fit shown by the coefficient
of determination and Se/Sy; however, this may be partially attributable to the fairly small range
over which measured rutting values were recorded for the sites. Despite a slope that is
statistically similar to unity for the calibrated model, care should be taken when predicted
distress values, at 50% reliability, that are above the range of values used for calibration are
considered.
Figure 2. Asphalt Pavement Rutting With Locally Calibrated Coefficients
Page 19
14
Asphalt Pavement Bottom-up Fatigue Cracking Calibration
The next consideration for asphalt pavements was calibration of the fatigue cracking
models. A graph of the measured (combined severity Level 2 and Level 3) alligator cracking
and predicted bottom-up fatigue distress using the global calibration parameters is shown in
Figure 3. As shown in the figure, none of the sites had very high levels of predicted fatigue
distress, with the maximum value being 1.7% cracking. The measured fatigue cracking values
were also fairly low, with 265 data points (78% of the measurements) less than 2%.
The adjustment of calibration coefficients was performed by varying the βf1 value for
determining fatigue damage and both C1 and C2 used in the transfer function for bottom-up
cracking prediction. Initial calibration attempts through Solver optimization found calibration
coefficients that effectively would predict the same amount of cracking for all pavement designs.
To ensure that Pavement ME Design would still predict a range of predicted distress values
depending on the situation, the parameters C1 and C2 were set to be equal and data points with
greater than 2% measured cracking were used first to set the starting point for readjusting the
calibration coefficients. Table 7 shows the fit parameters for global and local calibration
coefficients adjusted for either all the data or the subset with greater than 2% cracking. For both
cases, the validation results showed acceptable results, with a paired t-test showing a p-value
greater than 0.05, indicating the difference between predicted and measured values would not be
considered statistically significant.
Figure 3. Asphalt Pavement Bottom-Up Cracking Comparison With Global Calibration Coefficients
0
5
10
15
20
25
0 5 10 15 20 25
Pre
dic
ted
Bo
tto
m-U
p C
rack
ing
(%
Are
a)
Measured Bottom-up Cracking (% Area)
Page 20
15
Table 7. Bottom-Up Fatigue Cracking Local Calibration Results
Statistic
All Data Points Measured Cracking > 2%
Global
Calibration
Local
Calibration
Validation
Combined
Global
Calibration
Local
Calibration
Validation
Combined
Count 233 195 38 233 51 44 7 51
Bias, % 1.486 0.000 0.003 0.000 5.725 0.000 0.426 0.000
Se, % 3.10 3.52 2.21 3.34 4.47 5.49 1.98 5.15
R2, % 0.51% 3.34% 6.42% 3.04% 0.78% 8.06% 25.32% 7.75%
p-value (paired t-test) 0.0000 1.0000 0.9939 1.0000 0.0000 1.0000 0.5895 1.0000
p-value (slope) 0.0000 0.0000 0.0000 0.0000 0.0000 0.0000 0.0869 0.0000
p-value (intercept) 0.0000 0.0000 0.0000 0.0000 0.1096 0.0000 0.1611 0.0000
Se/Sy 1.005 1.095 0.993 1.085 1.004 1.169 0.781 1.157
βf1 1.0000 42.87 42.87 42.87a 1.0000 36.63 36.63 36.63
C1 1.0000 0.3190 0.3190 0.3190a 1.0000 0.2218 0.2218 0.2209
C2 1.0000 0.3190 0.3190 0.3190a 1.0000 0.2218 0.2218 0.2209 a Coefficients used to generate Figure 4.
Page 21
16
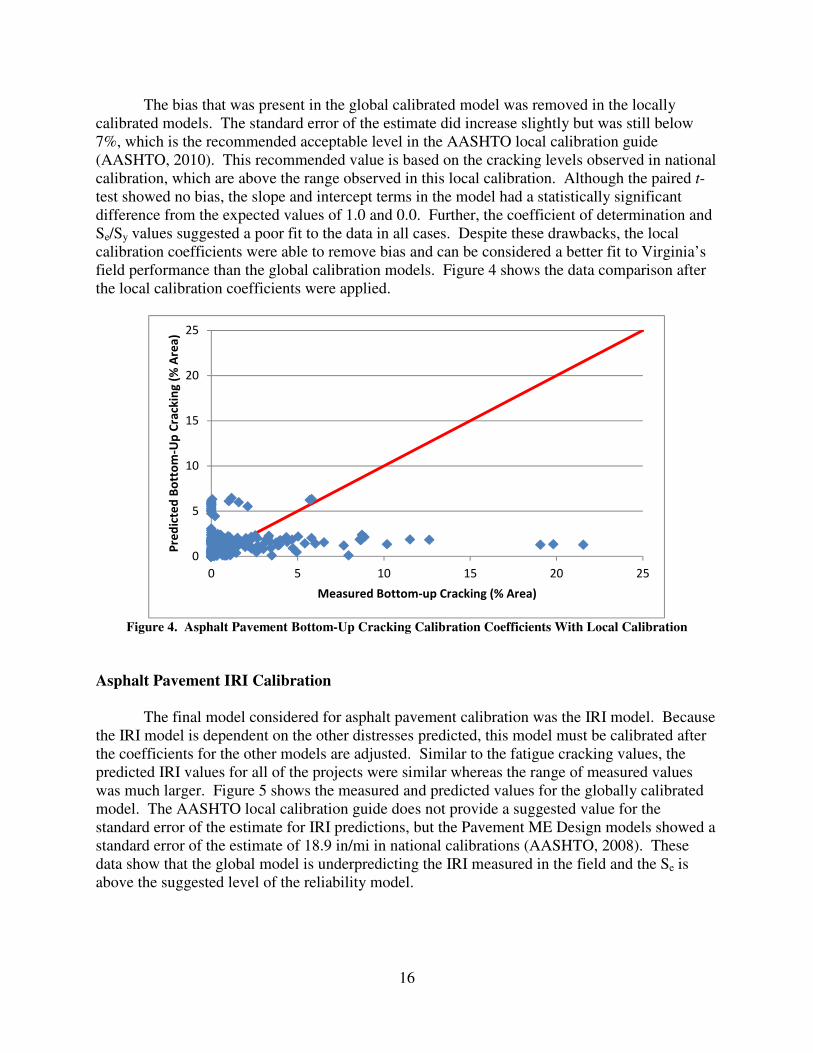
The bias that was present in the global calibrated model was removed in the locally
calibrated models. The standard error of the estimate did increase slightly but was still below
7%, which is the recommended acceptable level in the AASHTO local calibration guide
(AASHTO, 2010). This recommended value is based on the cracking levels observed in national
calibration, which are above the range observed in this local calibration. Although the paired t-
test showed no bias, the slope and intercept terms in the model had a statistically significant
difference from the expected values of 1.0 and 0.0. Further, the coefficient of determination and
Se/Sy values suggested a poor fit to the data in all cases. Despite these drawbacks, the local
calibration coefficients were able to remove bias and can be considered a better fit to Virginia’s
field performance than the global calibration models. Figure 4 shows the data comparison after
the local calibration coefficients were applied.
Figure 4. Asphalt Pavement Bottom-Up Cracking Calibration Coefficients With Local Calibration
Asphalt Pavement IRI Calibration
The final model considered for asphalt pavement calibration was the IRI model. Because
the IRI model is dependent on the other distresses predicted, this model must be calibrated after
the coefficients for the other models are adjusted. Similar to the fatigue cracking values, the
predicted IRI values for all of the projects were similar whereas the range of measured values
was much larger. Figure 5 shows the measured and predicted values for the globally calibrated
model. The AASHTO local calibration guide does not provide a suggested value for the
standard error of the estimate for IRI predictions, but the Pavement ME Design models showed a
standard error of the estimate of 18.9 in/mi in national calibrations (AASHTO, 2008). These
data show that the global model is underpredicting the IRI measured in the field and the Se is
above the suggested level of the reliability model.
0
5
10
15
20
25
0 5 10 15 20 25
Pre
dic
ted
Bo
tto
m-U
p C
rack
ing
(%
Are
a)
Measured Bottom-up Cracking (% Area)
Page 22
17
Figure 5. Asphalt Pavement International Roughness Index (IRI) With Global Calibration Coefficients
A comparison of the fit parameters from the global model with a revised model that
sought to remove the bias by adjusting the site factor coefficient, C4, is shown in Table 8, and the
local calibration model is graphed in Figure 6. One difficultly in recalibrating the model
coefficients to Virginia conditions was the lack of initial construction IRI values. The initial
value of IRI is an important component of the predicted IRI in Pavement ME Design because it
is used as a starting point for progression of IRI. The national default value of 63 in/mi was left
in place; however, if the sites in calibration start with higher initial IRI values, for instance,
closer to 73, then the model would show little or no bias. Without the initial IRI values, it is
difficult to assume that the inaccuracy of the model prediction is caused by improper calibration
coefficients. Further, it is likely that variability in the after construction IRI could reduce some
of the prediction error observed. Therefore, it is recommended that VDOT maintain the global
calibration coefficients at this time.
Table 8. Asphalt Pavement IRI Local Calibration Results
Parameter Global Calibration Local Calibration
Count 236 236
Bias, % 11.641 0.000
Se, % 23.99 27.51
R2, % 2.35% 4.91%
p-value (paired t-test) 0.0000 1.0000
p-value (slope) 0.0000 0.0000
p-value (intercept) 0.0000 0.0000
Se/Sy 1.081 1.239
C1 40 40a
C2 0.4 0.4a
C3 0.008 0.008a
C4 0.0150 0.0392a
IRI = International Roughness Index.
a Coefficients used to generate Figure 6.
0
25
50
75
100
125
150
175
200
225
250
0 25 50 75 100 125 150 175 200 225
Pre
dic
ted
IR
I (i
n/m
i)
Measured IRI (in/mi)
Page 23
18
Figure 6. Asphalt Pavement International Roughness Index (IRI) With Local Calibration Coefficients
Evaluation of Revised Asphalt Local Calibration Coefficients
To evaluate further the revised rutting and fatigue local calibration coefficients and their
effect on different pavement types, the calibration sites were split based on different factors and
the error terms from the data points were reviewed. This type of residual analysis can be used to
help determine if there are any situations where the models may have bias. The evaluation was
performed by plotting the error with a subjective review to identify any factors that might need
further consideration when performing design. All of the plots showed residual error (measured
minus predicted) on the vertical axes; thus, negative values indicate model overprediction and
positive values indicate underprediction. Although the calibration work minimized the
variability of the residual error and ensured the values were on average near zero, these plots can
help identify areas where the ME models may have residual error values that are grouped
together, showing a pattern of underprediction or overprediction.
Figure 7 shows box plots of the rutting error and fatigue error for the different types of
base under the asphalt pavement calibration sections. The select materials base type showed
noticeable overprediction for both distresses, although this was on a limited number of locations
(count of number of sites shown in Table 4) that also had other unique project factors. The line
representing no bias is between the 25th and 75th percentile of the rutting and fatigue cracking
error terms for the other base types. This figure suggests the local calibration is fairly reasonable
across the different pavement base types encompassed in the sites.
0
25
50
75
100
125
150
175
200
225
0 25 50 75 100 125 150 175 200 225
Pre
dic
ted
IR
I (i
n/m
i)
Measured IRI (in/mi)
Page 24
19
Figure 7. Asphalt Pavement Calibration Residual Error Box Plots by Base Type (rutting error shown in blue
on left for each pair; fatigue error shown in red on right). Agg Base = Aggregate Base; CTA = Cement
Treated Aggregate Base; Stab. Subgrade = Stabilized Subgrade; Select Matl = Select Material Base; Full
Depth HMA = Full Depth Asphalt.
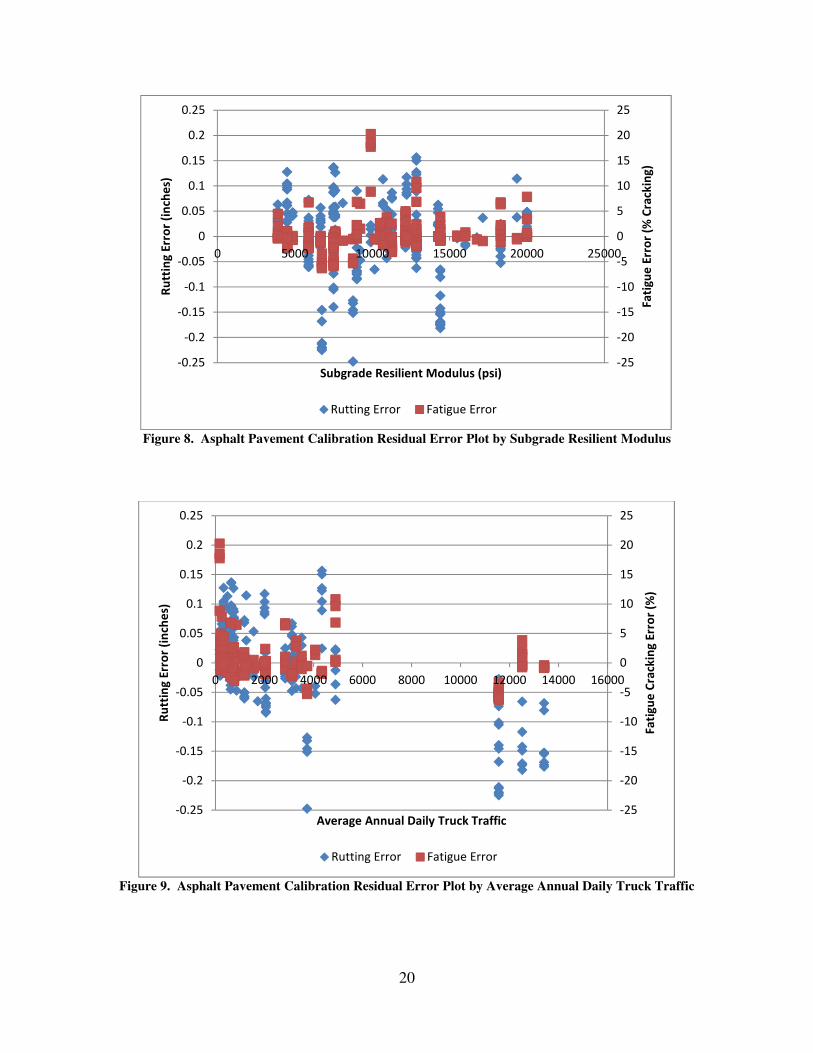
Figure 8 shows a scatter plot of the residual error with the subgrade resilient modulus on
the horizontal axis. Based on this figure, the error values for both rutting and fatigue cracking
appear centered at zero over the range of resilient modulus values with fairly consistent variance.
This figure shows that observed error is not related to the subgrade modulus, suggesting that the
Pavement ME Design models effectively account for the different performance related to
different subgrade conditions.
Figure 9 shows the observed error with the AADTT for each section. Based on this
graph, it appears the rutting is overpredicted at high truck volumes. Four sites (all located on I-
81) had significantly more loading with more than twice as much truck traffic as any of the other
calibration sites; two of these sites were also the only two sites with select material base that are
shown as underpredicting in Figure 7. This observation should be considered when results from
Pavement ME Design on highly trafficked areas are reviewed, i.e., the locally calibrated results
may still be overpredicting the rutting response of the asphalt pavement. The fatigue error
appears reasonable over the range of truck traffic. The box plot of error by route classification,
shown in Figure 10, shows similar results with a larger skew toward negative values for
interstate sites, which were largely influenced by the I-81 sites.
Page 25
20
Figure 8. Asphalt Pavement Calibration Residual Error Plot by Subgrade Resilient Modulus
Figure 9. Asphalt Pavement Calibration Residual Error Plot by Average Annual Daily Truck Traffic
-25
-20
-15
-10
-5
0
5
10
15
20
25
-0.25
-0.2
-0.15
-0.1
-0.05
0
0.05
0.1
0.15
0.2
0.25
0 5000 10000 15000 20000 25000
Fa
tig
ue
Err
or
(% C
rack
ing
)
Ru
ttin
g E
rro
r (i
nch
es)
Subgrade Resilient Modulus (psi)
Rutting Error Fatigue Error
-25
-20
-15
-10
-5
0
5
10
15
20
25
-0.25
-0.2
-0.15
-0.1
-0.05
0
0.05
0.1
0.15
0.2
0.25
0 2000 4000 6000 8000 10000 12000 14000 16000
Fa
tig
ue
Cra
ckin
g E
rro
r (%
)
Ru
ttin
g E
rro
r (i
nch
es)
Average Annual Daily Truck Traffic
Rutting Error Fatigue Error
Page 26
21
Figure 10. Asphalt Pavement Calibration Residual Error Box Plots by Road Classification (rutting error
shown in blue on left for each pair; fatigue error shown in red on right). IS = interstate route; US = U.S.
route; SR = state route.
Figure 11 shows the error based on the number of years since the site was constructed.
Multiple years of distress data were used for calibration, so data points from the same sites are
shown progressing in years as the pavement ages. Based on this figure, the bias appears
consistently centered at zero, with no large differences in variance as the age progresses.
Figure 11. Asphalt Pavement Calibration Residual Error Plot by Age
-25
-20
-15
-10
-5
0
5
10
15
20
25
-0.25
-0.2
-0.15
-0.1
-0.05
0
0.05
0.1
0.15
0.2
0.25
0 5 10 15 20
Fa
tig
ue
Cra
ckin
g E
rro
r (%
)
Ru
ttin
g E
rro
r (i
nch
es)
Age (years)
Rutting Error Fatigue Error
Page 27
22
Figure 12 shows box plots of the residual error as based on the asphalt thickness ranges
identified in Table 4. The rutting values for the asphalt sections showed an underprediction of
rutting for most of the five sites with less than 7 in of asphalt. The asphalt sections with greater
than 13 in of asphalt also showed underprediction with five sites. This again shows the need for
caution when applying the local calibration results beyond the ranges used in the calibration
sites. The fatigue error shows little bias over the range of asphalt thicknesses and has small
boxes for the interquartile range, indicating that most of the data are consistent for the different
asphalt ranges.
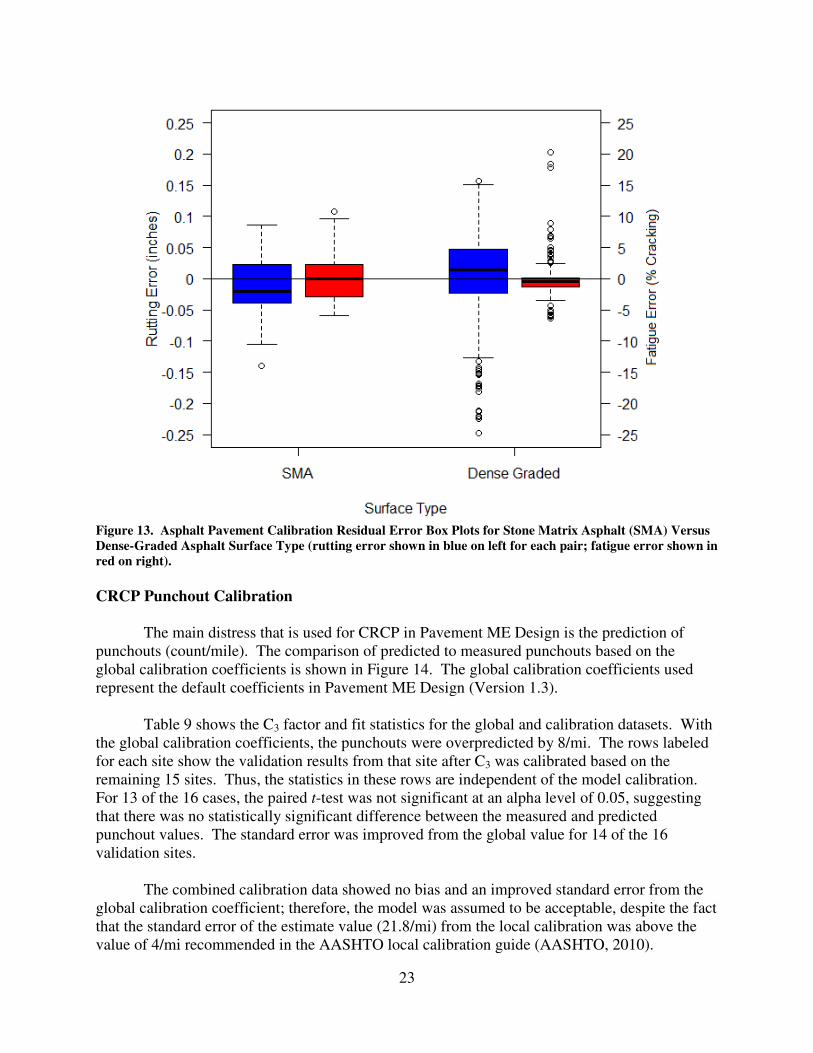
The box plots in Figure 13 show the rutting and fatigue error for the asphalt calibration
sites based on stone matrix asphalt (SMA) and standard dense-graded asphalt surface mixtures.
Seven of the sites were constructed with a gap-graded SMA surface layer that responds to
pavement loading differently than the dense-graded asphalt used on the rest of the sites. The
residual error between these two surface mixture types showed similar results, which suggests
that Pavement ME Design sufficiently accounts for the difference between the two mixture types
when predicting rutting and fatigue distress.
Figure 12. Asphalt Pavement Calibration Residual Error Box Plots by Asphalt Thickness (in inches) (rutting
error shown in blue on left for each pair; fatigue error shown in red on right).
Page 28
23
Figure 13. Asphalt Pavement Calibration Residual Error Box Plots for Stone Matrix Asphalt (SMA) Versus
Dense-Graded Asphalt Surface Type (rutting error shown in blue on left for each pair; fatigue error shown in
red on right).
CRCP Punchout Calibration
The main distress that is used for CRCP in Pavement ME Design is the prediction of
punchouts (count/mile). The comparison of predicted to measured punchouts based on the
global calibration coefficients is shown in Figure 14. The global calibration coefficients used
represent the default coefficients in Pavement ME Design (Version 1.3).
Table 9 shows the C3 factor and fit statistics for the global and calibration datasets. With
the global calibration coefficients, the punchouts were overpredicted by 8/mi. The rows labeled
for each site show the validation results from that site after C3 was calibrated based on the
remaining 15 sites. Thus, the statistics in these rows are independent of the model calibration.
For 13 of the 16 cases, the paired t-test was not significant at an alpha level of 0.05, suggesting
that there was no statistically significant difference between the measured and predicted
punchout values. The standard error was improved from the global value for 14 of the 16
validation sites.
The combined calibration data showed no bias and an improved standard error from the
global calibration coefficient; therefore, the model was assumed to be acceptable, despite the fact
that the standard error of the estimate value (21.8/mi) from the local calibration was above the
value of 4/mi recommended in the AASHTO local calibration guide (AASHTO, 2010).
Page 29
24
Figure 14. Concrete Pavement Punchout Comparison With Global Calibration Coefficients
Table 9. Punchout Local Calibration Jackknife Results
Dataset C3 Count Bias
Standard
Error Se/Sy
Significance Test p-Value
Paired-t Slope Intercept
Global 216.84 87 -8.47 30.3 1.705 0.01 0.00 0.00
PCC-2 114.52 6 0.29 0.4 1.000 0.14 0.00 0.01
PCC-5 100.75 5 20.21 42.8 0.964 0.35 0.00 0.00
PCC-6 118.05 7 -3.38 9.6 0.886 0.39 0.00 0.00
PCC-7 108.87 6 7.09 14.5 0.888 0.28 0.00 0.00
PCC-8 90.16 6 29.57 39.1 0.997 0.12 0.00 0.00
PCC-9 112.69 4 3.74 6.1 1.000 0.31 0.00 0.00
PCC-10 109.29 6 6.58 6.2 1.000 0.05 0.00 0.00
PCC-12 109.90 4 8.78 11.9 1.000 0.24 0.00 0.00
PCC-13 113.00 6 2.12 2.4 0.996 0.08 0.00 0.00
PCC-14 114.16 7 0.62 8.7 0.948 0.86 0.00 0.00
PCC-15 111.03 2 13.46 18.9 1.000 0.50 N/A N/A
PCC-17 130.89 6 -19.38 8.2 1.033 0.00 0.02 0.00
PCC-18 114.19 6 0.69 1.3 1.000 0.26 0.00 0.00
PCC-19 114.00 6 0.91 1.2 1.000 0.11 0.00 0.00
PCC-20 154.00 5 -56.61 4.3 1.283 0.00 0.35 0.00
PCC-21 154.00 5 -56.61 4.3 1.283 0.00 0.35 0.00
Combined calibration 114.76a 87 0.00 21.8 1.226 1.00 0.00 0.00
N/A/ = Not available because of too few data points. a
Coefficient used to generate Figure 15.
Additional calibration attempts to reduce further the standard error and achieve slope and
intercept values statistically similar to 1.0 and 0.0, respectively, by adjusting C4 and C5 with C3
did not result in a practical set of calibration coefficients. The model with C3 calibrated based
on the full dataset from the 16 sites was selected for use as it removed the bias and improved on
the standard error from the global calibration model. Figure 15 shows the measured and
predicted distress comparison based on the locally calibrated model.
0
20
40
60
80
100
120
0 20 40 60 80 100 120
Pre
dic
ted
Pu
nch
ou
ts
Measured Punchouts
Page 30
25
Figure 15. Concrete Pavement Punchouts With Local Calibration Coefficient
Concrete IRI Calibration
After the punchout prediction model was adjusted, the CRCP ride quality model was
evaluated. Figure 16 shows the global predicted IRI values with the measured values from PMS.
This figure shows a large number of points with a predicted IRI near 63 in/mi, which was the
initial IRI value used when the analysis was performed in Pavement ME Design for the projects.
These points show that when no punchout distress is predicted, the IRI of the CRCP is expected
to stay fairly constant. The graph also shows that Pavement ME Design is underpredicting IRI
values for the sites considered.
Figure 16. Concrete Pavement International Roughness Index (IRI) Comparison With Global Calibration
Coefficients
0
20
40
60
80
100
120
0 20 40 60 80 100 120
Pre
dic
ted
Pu
nch
ou
ts
Measured Punchouts
0
20
40
60
80
100
120
140
160
180
200
0 50 100 150 200
Pre
dic
ted
IR
I (i
n/m
i)
Measured IRI (in/mi)
Page 31
26
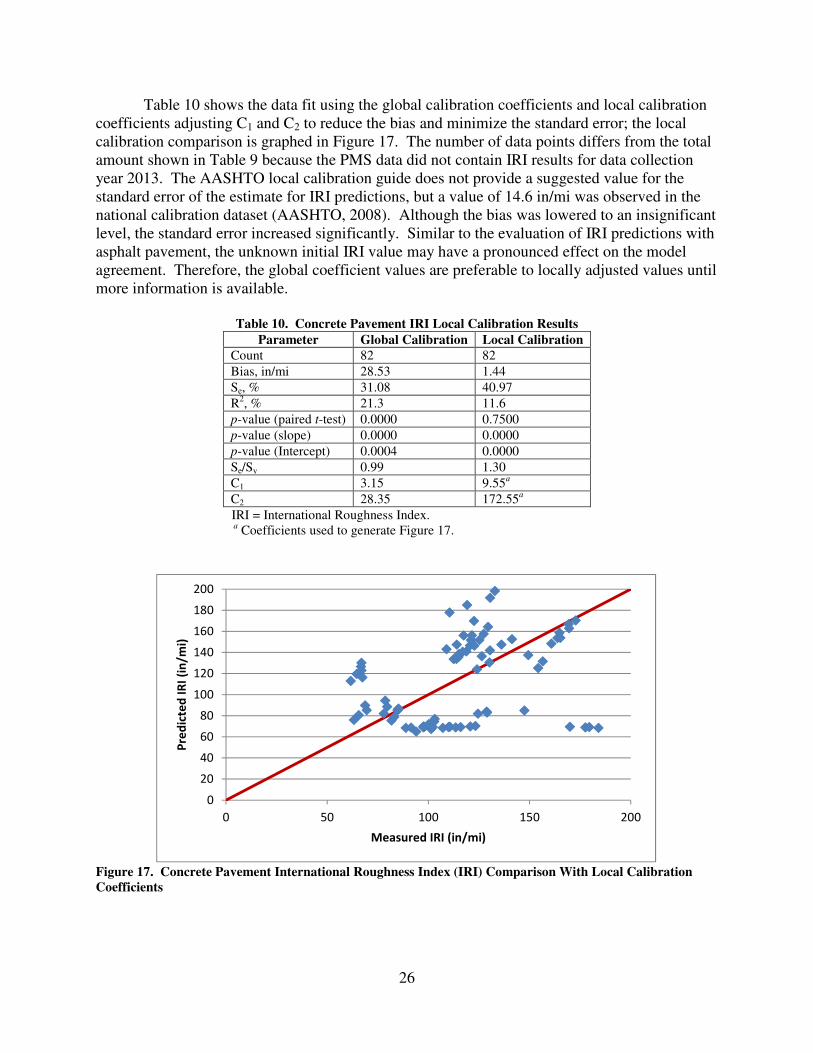
Table 10 shows the data fit using the global calibration coefficients and local calibration
coefficients adjusting C1 and C2 to reduce the bias and minimize the standard error; the local
calibration comparison is graphed in Figure 17. The number of data points differs from the total
amount shown in Table 9 because the PMS data did not contain IRI results for data collection
year 2013. The AASHTO local calibration guide does not provide a suggested value for the
standard error of the estimate for IRI predictions, but a value of 14.6 in/mi was observed in the
national calibration dataset (AASHTO, 2008). Although the bias was lowered to an insignificant
level, the standard error increased significantly. Similar to the evaluation of IRI predictions with
asphalt pavement, the unknown initial IRI value may have a pronounced effect on the model
agreement. Therefore, the global coefficient values are preferable to locally adjusted values until
more information is available.
Table 10. Concrete Pavement IRI Local Calibration Results
Parameter Global Calibration Local Calibration
Count 82 82
Bias, in/mi 28.53 1.44
Se, % 31.08 40.97
R2, % 21.3 11.6
p-value (paired t-test) 0.0000 0.7500
p-value (slope) 0.0000 0.0000
p-value (Intercept) 0.0004 0.0000
Se/Sy 0.99 1.30
C1 3.15 9.55a
C2 28.35 172.55a
IRI = International Roughness Index. a Coefficients used to generate Figure 17.
Figure 17. Concrete Pavement International Roughness Index (IRI) Comparison With Local Calibration
Coefficients
0
20
40
60
80
100
120
140
160
180
200
0 50 100 150 200
Pre
dic
ted
IR
I (i
n/m
i)
Measured IRI (in/mi)
Page 32
27
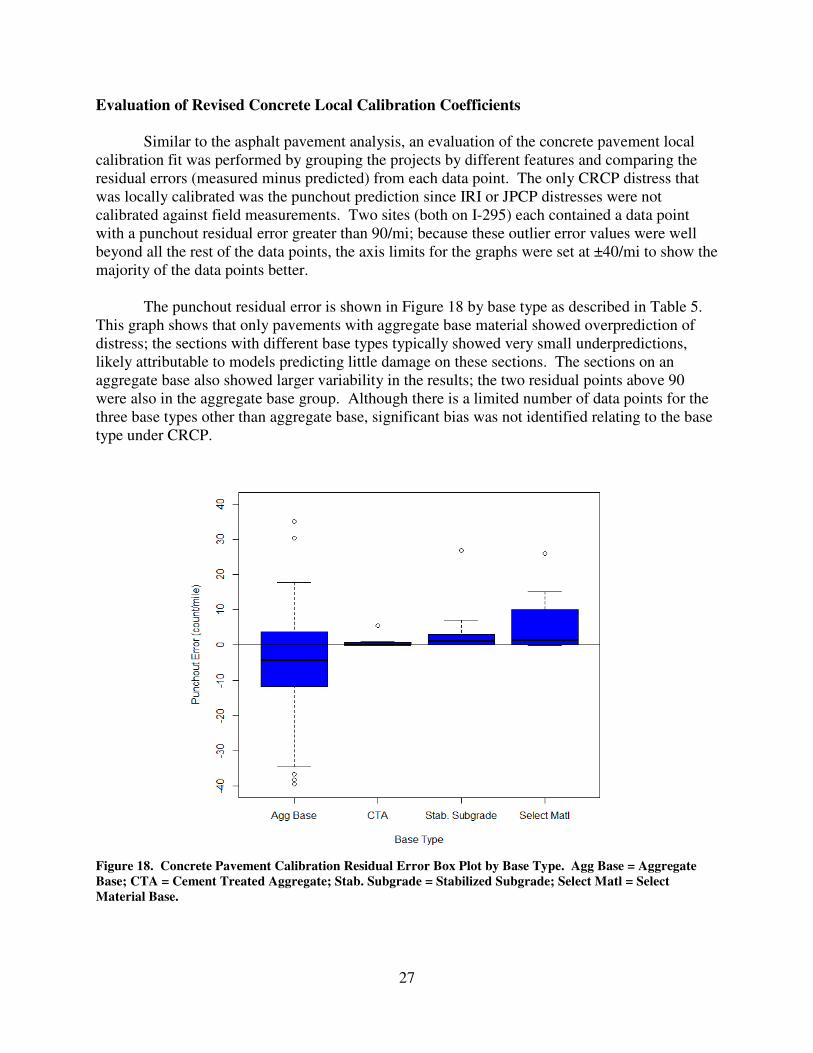
Evaluation of Revised Concrete Local Calibration Coefficients
Similar to the asphalt pavement analysis, an evaluation of the concrete pavement local
calibration fit was performed by grouping the projects by different features and comparing the
residual errors (measured minus predicted) from each data point. The only CRCP distress that
was locally calibrated was the punchout prediction since IRI or JPCP distresses were not
calibrated against field measurements. Two sites (both on I-295) each contained a data point
with a punchout residual error greater than 90/mi; because these outlier error values were well
beyond all the rest of the data points, the axis limits for the graphs were set at ±40/mi to show the
majority of the data points better.
The punchout residual error is shown in Figure 18 by base type as described in Table 5.
This graph shows that only pavements with aggregate base material showed overprediction of
distress; the sections with different base types typically showed very small underpredictions,
likely attributable to models predicting little damage on these sections. The sections on an
aggregate base also showed larger variability in the results; the two residual points above 90
were also in the aggregate base group. Although there is a limited number of data points for the
three base types other than aggregate base, significant bias was not identified relating to the base
type under CRCP.
Figure 18. Concrete Pavement Calibration Residual Error Box Plot by Base Type. Agg Base = Aggregate
Base; CTA = Cement Treated Aggregate; Stab. Subgrade = Stabilized Subgrade; Select Matl = Select
Material Base.
Page 33
28
Figure 19 shows the punchout error based on the subgrade resilient modulus for each
project. Because the CRCP projects were located in only select areas in the state and the
pavement structure inputs were developed based on database values, most of the subgrade inputs
were similar for the projects. The two outlier values above 90/mi are located at the band of data
points around 16,500 psi. The values appear to show no change in the bias related to subgrade
resilient modulus.
A scatterplot of concrete pavement calibration residual error versus AADTT is shown in
Figure 20. This chart does not show any trends between the truck traffic volume and model
prediction error for punchout distress. The two outlier points at approximately 90/mi did have
different truck traffic volumes: one project had an AADTT of 3,930, and the other 6,808.
Figure 19. Concrete Pavement Calibration Residual Error Plot by Subgrade Resilient Modulus
Figure 20. Concrete Pavement Calibration Residual Error Plot by Average Annual Daily Truck Traffic
-50
-40
-30
-20
-10
0
10
20
30
40
0 5000 10000 15000 20000
Pu
nch
ou
t E
rro
r (c
ou
nt/
mil
e)
Subgrade Resilient Modulus (psi)
-50
-40
-30
-20
-10
0
10
20
30
40
0 2000 4000 6000 8000 10000
Pu
nch
ou
t E
rro
r (c
ou
nt/
mil
e)
Average Annual Daily Truck Traffic
Page 34
29
Figure 21 shows the age of the concrete pavement versus the error of the punchout
calibration. There is a noticeable difference between the residual error for CRCP for three
projects in the first 10 years and for CRCP at 15 to 25 years of age. This difference may be
related to the more recent projects having little to no distresses predicted and measured. In
addition to having less time in service, the more recent pavements were also built thicker and
with improved construction methods, both of which are expected to help improve the pavement
performance. The error values from the data points with greater age values have a larger
variance; the two outlier points are at the age of 20 years. Because the data are centered at zero
error for both sets of age ranges, it appears the locally calibrated model is appropriate for more
recent CRCP sections as well as those that have been in service for a longer period.
A corresponding factor to the age of the sites is the thickness of the pavement structure,
shown in box plots of the residual error in Figure 22. The three projects built after 2000 were the
only projects constructed with a concrete thickness of 10 or 12 in, whereas all of the 8- and 9-in
projects represented projects that have 15 to 25 years of aging. The 8-in pavement sections were
all built on aggregate base sections and their punchout distress was similarly overpredicted, as
shown in Figure 18. One outlier data point each was in the 8-in and 9-in concrete thickness
ranges. Based on the relationships between base type, age, and concrete thickness among the
sites, it is hard to determine if one of these factors contributed more or less than the others to the
model prediction error. Overall, the results appear reasonable over the range of CRCP
thicknesses included in the dataset.
Figure 23 shows box plots of the CRCP residual error based on the road classification.
All of these CRCP sites were built as new construction with fairly high volumes of truck traffic
expected, regardless of the road classification. The U.S. routes show primarily negative error
values, whereas the other two classifications had average values very close to an error of zero.
The U.S. routes represented only three different projects, two of which were near the same
location with matching designs constructed 2 years apart.
Figure 21. Concrete Pavement Calibration Residual Error Plot by Age
-40
-30
-20
-10
0
10
20
30
40
0 5 10 15 20 25 30
Pu
nch
ou
t E
rro
r (c
ou
nt/
mil
e)
Age (years)
Page 35
30
Figure 22. Concrete Pavement Calibration Residual Error Box Plot by Concrete Thickness
Figure 23. Concrete Pavement Calibration Residual Error Box Plot by Road Classification. IS = interstate
route; US = U.S. route; SR = state route.
Page 36
31
Suggested Values for Design Requirements
Another essential step toward implementing the ME design procedure for VDOT is
reviewing requirement values for design. Values such as the design life, reliability level, and
performance limit (or target value) can all have a significant effect on whether a pavement
design is suitable for a project or if adjustments are necessary. VDOT’s current pavement design
policy, i.e., following the 1993 AASHTO design guide, specifies the design life and reliability
values for the different road classifications and pavement types shown in Table 11. The
performance limit with the 1993 AASHTO design policy is based on terminal serviceability; the
values used for VDOT pavement designs, found in the VDOT Materials Division Manual of
Instructions, Chapter 6, also vary by highway classification (VDOT, 2008). The design life and
reliability in the 1993 AASHTO design guide resemble criteria used for Pavement ME Design;
although they are integrated into the two design methods differently, the previously established
values are helpful in identifying values for Pavement ME Design. Performance limits based on
distress in Pavement ME Design are harder to compare to existing criteria in the 1993 AASHTO
design guide based on serviceability, so target values for Pavement ME Design will need to be
considered separately from existing values.
The design life values shown in Table 11 are for new asphalt pavement designs; concrete
pavements are designed for a 30-year life for all classifications. It is acknowledged that
rehabilitation work is likely to be performed on a pavement before the end of the design life to
maintain its functional characteristics, whereas the objective of the design life is to prevent
structural repairs from being required during the design life period. This distinction is implicit in
the 1993 AASHTO pavement designs, whereas Pavement ME Design predicts pavement
performance in terms of both functional and structural criteria. Therefore, some performance
measures are better evaluated on a shorter time frame that better represents when a functional
repair will be scheduled. A longer design life (e.g., 30 years) is still needed to evaluate distresses
that identify an insufficient pavement structure. A similar structural design life is recommended
for lower highway classifications since the functional characteristics can be separated in design
and any additional costs to achieve a lasting pavement structure are expected to be outweighed
by reducing the need for major rehabilitation.
Table 11. VDOT Design Life and Reliability Level With 1993 AASHTO Pavement Design Guidelines
Highway Classification
Design Life
(years)
Reliability (%)
Urban Rural
Interstate 30 95 95
Divided primary 30 90 90
Undivided primary 20 90 85
High-volume secondary 20 90 85
Farm to market secondary 20 85 75
Subdivision 20 75 70
Page 37
32
In both the 1993 AASHTO pavement design and Pavement ME Design, reliability values
are used to account for variability that is expected from design and construction of the pavement.
The reliability levels work differently in the two programs in that the 1993 AASHTO pavement
design reliability factors add additional loading (or damage) whereas Pavement ME Design
increases the predicted distress or IRI based on the variability of the prediction. The variability
for each performance measure in Pavement ME Design is determined from standard deviation
values calculated based on the level of distress (greater distress equals greater variability),
although the standard deviation for IRI remains constant regardless of predicted ride quality.
Reviewing the standard deviation models was not considered as part of this study, so the globally
calibrated error models were maintained for variability calculations.
The reliability level should be considered in conjunction with the performance criteria, as
a high reliability level can be especially difficult or costly if the distress limits are also low
(AASHTO, 2008). With regard to the reliability levels VDOT uses with 1993 AASHTO design,
a 95% reliability is recommended for interstate projects. A 90% reliability value is
recommended for both divided and undivided primary highways regardless of whether the
setting is urban or rural. This should simplify some of the design considerations and is not
expected to change the pavement design outputs greatly. For secondary routes being designed
with Pavement ME Design, a reliability value of 85% is recommended. VDOT policy on when
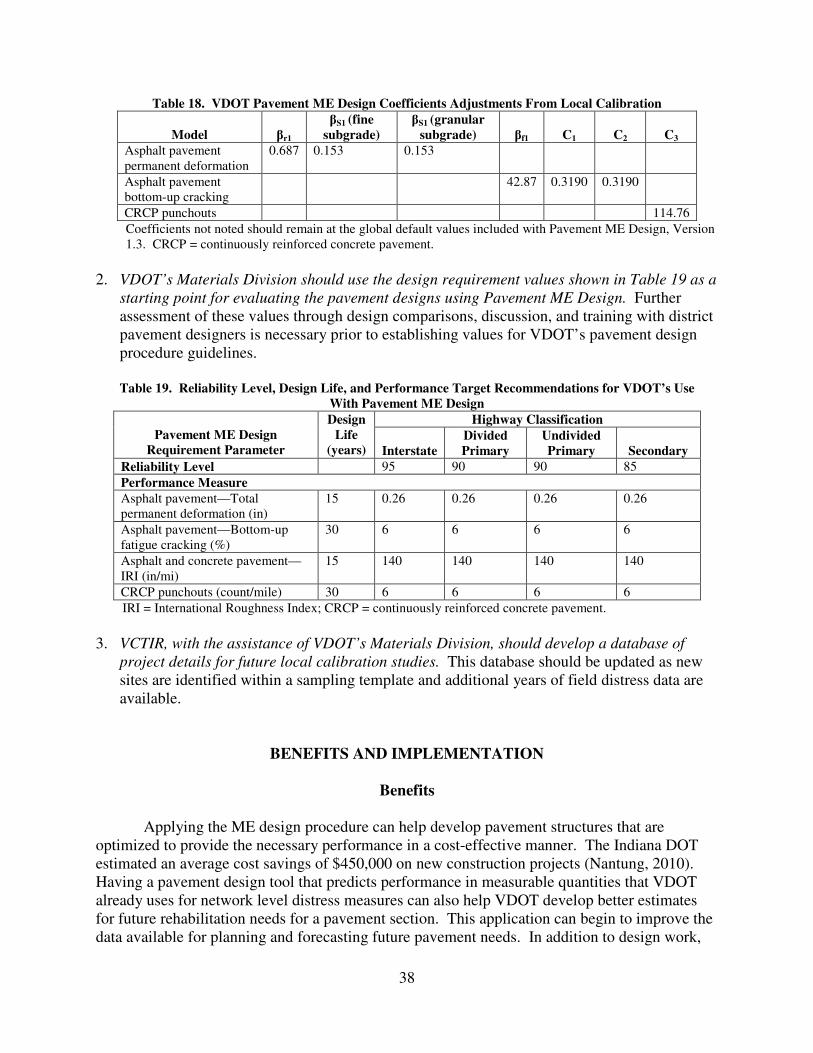
to apply Pavement ME Design (based on functional classification, etc.) was outside the scope of
this study. These reliability levels were taken into consideration in determining appropriate
values for the performance targets discussed here.
Asphalt Pavement Design Requirements
The default asphalt pavement performance limit criteria in Pavement ME Design
(Version 1.3) and recommended values from the MEPDG Manual of Practice (AASHTO, 2008)
are shown in Table 12 along with the associated reliability recommendations. As mentioned
previously, some of the models shown will not be considered for VDOT pavement designs at this
time.
Table 12. AASHTO (2008) Recommendations for Asphalt Pavement ME Design Criteria
Performance Criterion
Program ME Design
Default
MEPDG Manual of Practice
Interstate Primary Secondary
Terminal IRI (in/mi) 172 160 200 200
Asphalt top-down fatigue cracking (ft/mi) 2,000 N/A N/A N/A
Asphalt bottom-up fatigue cracking (%) 25 10% 20% 35%
Asphalt thermal cracking (ft/mi) 1,000 500 700 700
Chemically stabilized layer–fatigue fracture
(%)
25 N/A N/A N/A
Permanent deformation–total pavement (in) 0.75 0.4 0.5 0.65
Permanent deformation–asphalt only (in) 0.25 N/A N/A N/A
Reliability level (%) 90 95 85-90 75-80
IRI = International Roughness Index.
Page 38
33
These recommendations from national guidelines may need to be adjusted to represent
typical distress levels observed by VDOT. Based on VDOT’s State of the Pavement 2013,
12.5% of the primary miles in Virginia had an IRI greater than 140 in/mi, with only 2% with an
IRI greater than 200 in/mi (VDOT, 2013b). This suggests that a threshold limit lower than the
200 in/mi suggested by AASHTO (2008) for primary routes or the 172 in/mi program default
value would be more consistent with experience. Distress ratings from different VDOT-specific
sources that were used to help identify performance limits for asphalt pavements are shown in
Table 13. Column 1 shows the amount of distress that would result in a pavement being rated as
deficient either by IRI or through CCI using deduct equations for Level 3 alligator cracking and
permanent deformation. These values are assuming that the particular distress is the only
deficiency, which would be an extreme case. Column 2 shows the average distress measured
prior to rehabilitation based on VDOT’s PMS data. Column 3 shows the average of the
maximum IRI or distress that was observed at each site used in local calibration.
A consistent pattern for the IRI, asphalt bottom-up cracking, and permanent deformation
is that the distress from the PMS deduct is greater than the average prior to rehabilitation, which
is greater than the average distress from the calibration sites. This pattern is not irrational
considering pavement resurfacing is scheduled to prevent a pavement being rated as deficient in
many cases. This may be especially true for calibration sites, which were all constructed
relatively recently and mostly show good performance, although some have already been
resurfaced. As noted previously, it is important to consider the effect of the reliability when
performance limits are selected. It would be unreasonable to select performance targets in
accordance with the average observed distress and then combine them with a high value of
reliability; that would create a change in the expected level of performance, which is not a
desired result of changing pavement design methodologies.
A value of 6% is recommended for the bottom-up fatigue cracking performance limit
primarily because of the distress levels observed in this calibration study. Because the predicted
cracking at calibration sites does not represent a very robust model over a large range of
measured cracking values, it is important to ensure that the performance criteria are well within
the range of predicted distress. The recommended value is based on the typical peak distress of
calibration sites and accounts for variability between 75% and 95%, depending on highway type.
Table 13. VDOT Distress Measurements for Asphalt Pavement Performance Limit Selection
Performance
Criterion
Distress to Reach
“Deficient” PMS Rating
Average Prior to
Rehabilitation
Average Maximum Distress
of Calibration Sites
Terminal IRI (in/mi) 140a 110 101
Asphalt bottom-up fatigue
cracking (%)
15b 11 4.6
Permanent deformation–
total pavement (in)
0.37 0.18 0.16
PMS = Pavement Management System; IRI = International Roughness Index. a 140 in/mi represents “deficient” for interstate and primary.
b Calculation for bottom-up fatigue cracking deficient rating taken from Level 3 alligator cracking.
Page 39
34
Because both the rutting (occurring predominately in the asphalt surface) and IRI for
asphalt pavements are expected to be improved when a functional rehabilitation is performed on
a project, the predicted performance of these distresses at the end of a 30-year structural design
life may not match experience. It is recommended that the predicted rutting distress and IRI be
considered at a 15-year period for all pavement designs. This shorter time frame will show
values that are more in line with VDOT’s experience for pavements nearing resurfacing.
For permanent deformation, again using total amount, which is predominately the rutting
in asphalt, the average prior to rehabilitation and peak values of the calibration sites were similar.
A target value of 0.26 in is recommended for use in pavement design. Based on the data that
were considered, a rutting value performance target of 0.26 would match what is typically
observed prior to overlay, accounting for variability included for higher reliability designs.
For terminal IRI, a good portion of the interstate and primary routes are resurfaced while
still in good condition and many of the rest are in fair condition. However, the large adjustment
attributable to reliability (standard error of 18.9 in/mi for new asphalt pavements) makes the 140
in/mi limit of distress, coinciding with deficient ride quality for interstate and primary routes, an
appropriate performance limit. Secondary pavements show higher levels of IRI that may be
attributable to the higher initial IRI values (typically VDOT has not applied rideability
specifications for these projects) and deferred resurfacing on the sections. The current
recommendation is to use the same performance limit and time frame for secondary routes as for
other highway classifications, although a longer service life or adjusted initial/terminal IRI
values may be considered in the future.
Concrete Pavement Design Requirements
Target values were considered for CRCP and JPCP. Limits for distress or IRI values at
the end of the design life as recommended for concrete pavements are shown in Table 14. The
reliability level recommendations from ME Pavement Design and AASHTO’s Manual of
Practice (AASHTO, 2008) are also listed (these are the same as shown in Table 12). Since IRI is
consistent for both pavement types, the performance limit should be the same between the two
pavement types.
Table 14. MEPDG Recommendations for Concrete Pavement Design Criteria
Performance Criterion
Pavement ME
Design Default
MEPDG Manual of Practice (AASHTO, 2008)
Interstate Primary Secondary
Terminal IRI (in/mi) 172 160 200 200
CRCP punchouts
(count/mile)
10 N/A N/A N/A
JPCP transverse cracking
(% slabs)
15
10 15% 20%
JPCP mean joint faulting
(in)
0.12 0.15 0.20 0.25
Reliability level (%) 90 95 85-90 75-80
IRI = International Roughness Index; CRCP = continuously reinforced concrete pavement; JPCP = jointed plain
concrete pavement.
Page 40
35
The values shown in Table 15 were based on VDOT’s PMS data collection on concrete
pavements. The average distress prior to rehabilitation values were based on historical PMS data
for the count of punchouts per mile in CRCP and the percentage of divided slabs in JPCP. The
other values shown for CRCP punchouts represent the number per mile based on the area of
distress.
For CRCP punchouts, the value of 6/mi is suggested for a target value for VDOT designs.
This value is less than the default target and the magnitude of distress observed for many of the
calibration sites but is near the typical distress level measured prior to rehabilitation. The
suggested initial target of 6/mi agrees with some of the most recent CRCP designs that are
expected to have a long service life with little damage (and have shown very little distress thus
far in service).
Table 15 also shows some distress values for JPCP pavements, although based on only
four sites that were identified in the state. Based on the deduct equations for jointed pavements,
the program default target value of 15% cracked slabs appears reasonable. Based on the limited
data on JPCP in Virginia, the faulting predictions may be lower than what has been observed in
PMS, although since the model has not been locally calibrated, it is recommended that the
default value of 0.12 in be maintained.
Table 15. VDOT Distress Measurements for Concrete Pavement Performance Limit Selection
Performance Criterion
Distress to Reach
“Deficient” PMS Rating
Average Prior to
Rehabilitation
Average Maximum
Distress of
Calibration Sites
Terminal IRI (in/mi) 140 N/A 124
CRCP punchouts
(count/mile)
65 7 29
JPCP transverse cracking (%
slabs)
15 2 5.3
Mean joint faulting (in) N/A N/A 0.158
IRI = International Roughness Index; CRCP = continuously reinforced concrete pavement; JPCP = jointed plain
concrete pavement.
Example Pavement Structure with ME Design Process
To demonstrate the pavement structures that are developed using the ME design process,
some example designs were performed using hypothetical pavement design scenarios. Table 16
shows the route type, traffic, location, and subgrade inputs that were used to develop the ME
design. Scenarios A, B, and C were selected based on the 25th, 50th, and 75th percentile of
AADTT levels, respectively, from interstate and primary traffic link data (VDOT, 2012).
Table 16. Example Pavement Design Scenario Inputs
Scenario
Route
Type
Virginia
County
No. of Lanes
(Directional)
Annual
Daily
Traffic
(2-way)
% Trucks
AASHTO Soil
Classification
Resilient
Modulus
(psi)
A Primary Nelson 1 2,200 8% A-4 3,882
B Primary Chesapeake 2 9,300 11% A-2-4 6,533
C Interstate Montgomery 3 22,000 25% A-6 8,853
Page 41
36
Pavement designs were developed for each of the scenarios using Pavement ME Design
with the local calibration coefficients and performance limits identified in this study and project
inputs based on Table 16 in accordance with VDOT’s Pavement ME User Manual—Draft
(VDOT, 2013a). The pavement structures that were developed for each of the hypothetical
design situations are shown in Table 17 for asphalt, CRCP, and JPCP sections. The layer
thickness values represent the necessary structure assuming a typical base structure and do not
reflect project-specific design features that could be used on a specific project (i.e., stabilized
subgrade or widened-edge concrete pavement).
Table 17. Example Pavement Structure From ME Design Process
Scenario Asphalt Design CRCP Design JPCP Design
A 1.5 in SM-9.5A
2.5 in IM-19.0A
3.5 in BM-25A
8 in 21A
8.0 in CRCP
8 in 21A
8.0 in JPCP
8 in 21A
B 1.5 in SM-12.5D
3.0 in IM-19.0A
4.0 in BM-25A
8 in 21B
9.0 in CRCP
8 in 21B
9.0 in JPCP
8 in 21B
C 2.0 in SMA-12.5 (76-22)
2.5 in SMA-19 (70-22)
7.5 in BM-25D
2 in OGDL
6 in CTA
10 in CRCP
2 in OGDL
6 in CTA
11.5 in JPCP
2 in OGDL
6 in CTA
SM = Surface Mix; IM = Intermediate Mix; BM = Base Mix; SMA = Stone Matrix Asphalt;
CRCP = continuously reinforced concrete pavement; JPCP = jointed plain concrete pavement;
OGDL = open graded drainage layer; CTA = cement treated aggregate.
Limitations
The adjustments to local calibration coefficients presented in this report are highly
dependent on the setting in which they were developed. The pavement structure, materials,
traffic, and climate inputs represent VDOT’s current practice when using Pavement ME Design;
the calibration coefficients may need to be revisited as these input parameters are further
developed and improved upon. In addition to the ongoing work by VDOT to augment Pavement
ME Design, changes are anticipated at a national level to enhance the models that will require
VDOT to recalibrate. Some future changes include revisions to the global calibration
coefficients for concrete pavements, improvements to the top-down asphalt cracking model,
adjustment of cement-stabilized material failure models, and revision of the reflective cracking
models.
The PMS data provide convenient, consistent information on the pavement performance;
they do not provide the detailed project information that would be more helpful in comparing the
measured to predicted distress data in Pavement ME Design. One reason a forensic investigation
of calibration sites was not included in the scope of this study was that many of the sites either
had been rehabilitated or indicated a minimal amount of distress. In addition, some categories of
pavement type, base type, pavement thickness, distress level, and age may be underrepresented
in this study. Expanding the pool of project sites used for calibration can help provide more
Page 42
37
robust calibration coefficients. In some cases, such as JPCP, this may require partnering with
surrounding states to calibrate models if enough sites in Virginia are not available.
CONCLUSIONS
• The local calibration values identified in this study offer improved pavement performance
predictions compared to the global calibration coefficients, but they should be used with
caution with pavement types that differ from those included in this study and distress levels
that are beyond the measured values in this study.
• Rutting model local calibration coefficients remove an overprediction from the global model;
the adjusted values show no bias and lower the standard error of the estimate within an
acceptable range.
• The global model for bottom-up fatigue cracking underpredicts the Virginia dataset,
although most sites had very little fatigue cracking damage measured and predicted. Local
calibration removes the bias and maintains a reasonable standard error of the estimate.
Bottom-up fatigue cracking model local calibration coefficients remove an underprediction
from the global model and maintain a reasonable standard error of the estimate.
• The asphalt pavement IRI model local calibration coefficient corrects an underprediction
from the global model but increases the standard error of the estimate.
• The CRCP punchout local calibration coefficient removes an overprediction bias in the
global model and decreases the standard error of the estimate.
• The CRCP IRI local calibration coefficient removes a large underprediction from the global
model but also increases the standard error of the estimate.
• Global calibration coefficients for JPCP transverse cracking and faulting are considered
appropriate despite too few project sites to evaluate. Study findings from Arizona, Utah,
Colorado, and Wyoming verified that the global coefficients were acceptable (Von Quintus et
al., 2013).
RECOMMENDATIONS
1. VDOT’s Materials Division should incorporate the locally adjusted calibration coefficients
shown in Table 18 into Pavement ME Design when analyzing or designing asphalt or CRCP
pavement structures.
Page 43
38
Table 18. VDOT Pavement ME Design Coefficients Adjustments From Local Calibration
Model
βr1
βS1 (fine
subgrade)
βS1 (granular
subgrade)
βf1
C1
C2
C3
Asphalt pavement
permanent deformation
0.687 0.153 0.153
Asphalt pavement
bottom-up cracking
42.87 0.3190 0.3190
CRCP punchouts 114.76
Coefficients not noted should remain at the global default values included with Pavement ME Design, Version
1.3. CRCP = continuously reinforced concrete pavement.
2. VDOT’s Materials Division should use the design requirement values shown in Table 19 as a
starting point for evaluating the pavement designs using Pavement ME Design. Further
assessment of these values through design comparisons, discussion, and training with district
pavement designers is necessary prior to establishing values for VDOT’s pavement design
procedure guidelines.
Table 19. Reliability Level, Design Life, and Performance Target Recommendations for VDOT’s Use
With Pavement ME Design
Pavement ME Design
Requirement Parameter
Design
Life
(years)
Highway Classification
Interstate
Divided
Primary
Undivided
Primary
Secondary
Reliability Level 95 90 90 85
Performance Measure
Asphalt pavement—Total
permanent deformation (in)
15 0.26 0.26 0.26 0.26
Asphalt pavement—Bottom-up
fatigue cracking (%)
30 6 6 6 6
Asphalt and concrete pavement—
IRI (in/mi)
15 140 140 140 140
CRCP punchouts (count/mile) 30 6 6 6 6
IRI = International Roughness Index; CRCP = continuously reinforced concrete pavement.
3. VCTIR, with the assistance of VDOT’s Materials Division, should develop a database of
project details for future local calibration studies. This database should be updated as new
sites are identified within a sampling template and additional years of field distress data are
available.
BENEFITS AND IMPLEMENTATION
Benefits
Applying the ME design procedure can help develop pavement structures that are
optimized to provide the necessary performance in a cost-effective manner. The Indiana DOT
estimated an average cost savings of $450,000 on new construction projects (Nantung, 2010).
Having a pavement design tool that predicts performance in measurable quantities that VDOT
already uses for network level distress measures can also help VDOT develop better estimates
for future rehabilitation needs for a pavement section. This application can begin to improve the
data available for planning and forecasting future pavement needs. In addition to design work,
Page 44
39
forensic pavement investigations can be performed with locally calibrated Pavement ME Design
analysis and use project-specific materials testing information to obtain better estimates of
pavement performance.
Implementation
The local calibration coefficient and design value recommendations from this study will
be implemented by VDOT’s Materials Division by incorporating them into VDOT’s Pavement
ME User Manual. In addition, the revised manual should be distributed to pavement design staff
in VDOT districts along with training on incorporating the revised values into Pavement ME
Design and developing a pavement design using the software.
The ME design method should be used with the revised inputs for comparison designs
with VDOT’s current design procedure to continue to evaluate the new design process and
ensure that the output is consistent with experience and engineering judgment. Prior to
switching to a ME design procedure, VDOT will also need to provide training opportunities to
external partners. Ongoing research needs related to ME design will continue to be identified
and managed through VCTIR as appropriate. The data used for this study will be organized and
maintained to provide a basis for future revisions to local calibration coefficients that will be
necessary as VDOT gains more experience with ME design.
ACKNOWLEDGMENTS
The authors thank Angela Beyke, Affan Habib, Bipad Saha, and Michael Wells of
VDOT’s Materials Division; Sean Nelson of VDOT’s Fredericksburg Residency; and Raja
Shekharan of VDOT’s Maintenance Division for input in data collection and other significant
contributions to this study. The authors appreciate Linda Evans of VCTIR for editorial
assistance. The Technical Review Panel for the study was composed of Brian Diefenderfer of
VCTIR; Affan Habib and Haroon Shami of VDOT’s Culpeper District; Raja Shekharan of
VDOT’s Maintenance Division; and Tom Tate of VDOT’s Hampton Roads District.
REFERENCES
American Association of State Highway and Transportation Officials. Guide for Design of
Pavement Structures. Washington, DC, 1993.
American Association of State Highway and Transportation Officials. Supplement to the
AASHTO Guide for Guide for Design of Pavement Structures: Part II Rigid Pavement
Design & Rigid Pavement Joint Design. Washington, DC, 1998.
American Association of State Highway and Transportation Officials. Mechanistic-Empirical
Pavement Design Guide: A Manual of Practice, Interim Edition. Washington, DC, 2008.
Page 45
40
American Association of State Highway and Transportation Officials. Guide for the Local
Calibration of the Mechanistic-Empirical Pavement Design Guide. Washington, DC,
2010.
Apeagyei, A., and Diefenderfer, S. Asphalt Material Design Inputs for Use With the
Mechanistic Empirical Pavement Design Guide. VTRC 12-R6. Virginia Center for
Transportation Innovation and Research, Charlottesville, 2011.
Applied Research Associates, Inc. Guide for the Mechanistic-Empirical Design of New &
Rehabilitated Pavement Structures. NCHRP Project 1-37A. Transportation Research
Board of the National Academies, Washington, DC, 2004.
Applied Research Associates, Inc. Implementing the AASHTO Mechanistic-Empirical Pavement
Design Guide in Missouri. MODOT Study RI04-002. Missouri Department of
Transportation, Columbia, 2009.
Cottrell, B.H., Jr., and Kweon, Y.J. Review of the Virginia Department of Transportation’s
Truck Weight Data Plan for the Mechanistic-Empirical Pavement Design Guide. VCTIR
12-R4. Virginia Center for Transportation Innovation and Research, Charlottesville,
2011.
Cottrell, B.H., Jr., Schinkel, T.O., and Clark, T.M. A Traffic Data Plan for Mechanistic-
Empirical Pavement Designs (2002 Pavement Design Guide). VTRC 04-R3. Virginia
Transportation Research Council, Charlottesville, 2003.
Diefenderfer, S.D. Analysis of the Mechanistic-Empirical Pavement Design Guide Performance
Predictions: Influence of Asphalt Material Input Properties. VTRC 11-R3. Virginia
Transportation Research Council, Charlottesville, 2010.
Federal Highway Administration . Local Calibration of the MEPDG Using Pavement
Management Systems. HIF-11-026. Federal Highway Administration. Washington, DC,
2010
Flintsch, G.W., Loulizi, A., Diefenderfer, S.D., Galal, K.A., and Diefenderfer, B. Asphalt
Materials Characterization in Support of Implementation of the Proposed Mechanistic-
Empirical Pavement Design Guide. VTRC 07-CR10. Virginia Transportation Research
Council, Charlottesville, 2007.
Hossain, M.S. Characterization of Subgrade Resilient Modulus for Virginia Soils and Its
Correlation with the Results of Other Soil Tests. VTRC 09-R4. Virginia Transportation
Research Council, Charlottesville, 2008.
Hossain, M.S. Characterization of Unbound Pavement Materials From Virginia Sources for
Use in the New Mechanistic-Empirical Pavement Design Procedure. VTRC 11-R6.
Virginia Transportation Research Council, Charlottesville, 2010.
Page 46
41
Hossain, M.S., and Kim, W.S. Estimation of Subgrade Resilient Modulus Using the Unconfined
Compression Test. VCTIR 15-R12. Virginia Center for Transportation Innovation and
Research, Charlottesville, 2014.
Loulizi, A., Flintsch, G., and McGhee, K. Determination of the In-Place Hot-Mix Asphalt Layer
Modulus for Rehabilitation Projects Using a Mechanistic-Empirical Procedure. VTRC
07-CR1. Virginia Transportation Research Council, Charlottesville, 2006.
Mallela, J., Titus-Glover, L., Sadasivam, S., Bhattacharya, B., Darter, M., and Von Quintus, H.
Implementation of the AASHTO Mechanistic-Empirical Pavement Design Guide for
Colorado. CDOT-2013-4. Colorado Department of Transportation–Research, Denver,
2013.
Miller, J.S., and Bellinger, W.Y. Distress Identification Manual for the Long-Term Pavement
Performance Program (Fourth Revised Edition). FHWA-RD-03-031. Federal Highway
Administration, McLean, VA, 2003.
Nantung, T.E. Implementing the Mechanistic-Empirical Pavement Design Guide for Cost
Savings in Indiana. TR News, No. 271, Nov-Dec, 2010, pp. 34-36.
Pierce, L.M., and McGovern, G. Implementation of the AASHTO Mechanistic-Empirical
Pavement Design Guide and Software: A Synthesis of Highway Practice. NCHRP
Synthesis 457. Transportation Research Board of the National Academies, Washington,
DC, 2014.
Smith, B.C., and Diefenderfer, B. Analysis of Virginia-Specific Traffic Data Inputs for Use with
the Mechanistic-Empirical Pavement Design Guide. VTRC 10-R19. Virginia
Transportation Research Council, Charlottesville, 2010.
Virginia Department of Transportation, Materials Division. VDOT Preparation Plan for the
Implementation of the Mechanistic-Empirical Guide for Design of New and Rehabilitated
Pavement Structures. Memorandum. Richmond, February 5, 2007.
Virginia Department of Transportation, Materials Division. Manual of Instructions, Section 604,
Guidelines for Use of the 1993 AASHTO Pavement Design Procedure. Richmond, 2008.
Virginia Department of Transportation. Average Daily Traffic Volumes with Vehicle
Classification Data on Interstate, Arterial, and Primary Routes. Richmond, 2012.
Virginia Department of Transportation, Materials Division. Pavement ME User Manual— Draft.
Richmond, 2013a.
Virginia Department of Transportation, Materials Division. State of the Pavement 2013.
Richmond, 2013b.
Page 47
42
Von Quintus, H.L., Mallela, J., Sadasivam, S., and Darter, M. Literature Search and Synthesis—
Verification and Local Calibration/Validation of the MEPDG Performance Models for
Use in Georgia. GADOT-TO-01-Task 1. Georgia Department of Transportation,
Atlanta, 2013.