Calibration of diffuse correlation spectroscopy blood flow index with venous-occlusion diffuse optical spectroscopy in skeletal muscle Zhe Li Wesley B. Baker Ashwin B. Parthasarathy Tiffany S. Ko Detian Wang Steven Schenkel Turgut Durduran Gang Li Arjun G. Yodh
Transcript
Calibration of diffuse correlationspectroscopy blood flow index withvenous-occlusion diffuse opticalspectroscopy in skeletal muscle
Zhe LiWesley B. BakerAshwin B. ParthasarathyTiffany S. KoDetian WangSteven SchenkelTurgut DurduranGang LiArjun G. Yodh
Calibration of diffuse correlation spectroscopyblood flow index with venous-occlusion diffuseoptical spectroscopy in skeletal muscle
Zhe Li,a,b,c,* Wesley B. Baker,a Ashwin B. Parthasarathy,a Tiffany S. Ko,d Detian Wang,a,e Steven Schenkel,aTurgut Durduran,f Gang Li,b,c and Arjun G. Yodha
aUniversity of Pennsylvania, Department of Physics & Astronomy, 209 South 33rd Street, Philadelphia, Pennsylvania 19104, United StatesbTianjin University, School of Precision Instrument and Opto-Electronics Engineering, Tianjin 300072, ChinacTianjin University, State Key Laboratory of Precision Measurement Technology and Instruments, Tianjin 300072, ChinadUniversity of Pennsylvania, Department of Bioengineering, 210 South 33rd Street, Philadelphia, Pennsylvania 19104, United StateseInstitute of Fluid Physics, Mianyang 621000, ChinafICFO-Institut de Ciéncies Fotóniques, Mediterranean Technology Park, 08860 Castelldefels (Barcelona), Spain
Paper 150567RR received Aug. 24, 2015; accepted for publication Nov. 17, 2015; published online Dec. 23, 2015.
1 IntroductionBlood flow (BF), the primary source of oxygen delivery to tissue,plays a critical role fueling metabolism.1 Thus, measurement ofBF is often utilized to inform clinicians about oxygen deliveryand metabolism in tissues such as brain2–5 and muscle.6–8 Permuscle, such measurements hold special significance for patientswith peripheral artery disease (PAD), wherein insufficient flowcan lead to nutrient deficits, tissue damage, and muscle weak-ness.9–11 To date, several approaches have been developed fortracking BF in muscle; they range from relatively simple bedsidetechniques, such as strain-gauge plethysmography (SGP) 12–15
and Doppler ultrasound,16–18 to more complex and low-through-put approaches, such as arterial spin labeled magnetic resonanceimaging19–21 and positron emission tomography.22–25 The presentpaper explores state-of-the-art near-infrared optical methods formeasurement of blood perfusion in deep tissues. These opticaltechniques are attractive because they are noninvasive, portable,inexpensive, and because they offer the possibility for quantitativemonitoring of both BF and oxy-/deoxyhemoglobin concentration(½HbO�∕½Hb�) continuously and concurrently at the bedside.Herein we comprehensively compare and cross-calibrate twoqualitatively different and complementary near-infrared opticalBF techniques: venous-occlusion diffuse optical spectroscopy(VO-DOS)26–35 and diffuse correlation spectroscopy (DCS).7,36–40
VO-DOS, also known as venous-occlusion near-infraredspectroscopy, estimates absolute muscle BF from measurementof the linear rate-of-change of total hemoglobin concentration(½HbT� ¼ ½HbO� þ ½Hb�) following venous occlusion.26–35 Intheir pioneering study, De Blasi et al. demonstrated high cor-relation between measurements of absolute BF in the forearmwith VO-DOS and SGP.29 Unfortunately, since venous occlu-sion interrupts BF, VO-DOS cannot monitor muscle BFcontinuously.
By contrast, DCS monitors a muscle blood flow index (BFI)continuously in real time.41 DCS is a simple noninvasive tech-nique that derives flow information from measurements of thetemporal intensity fluctuations of multiply scatteredlight.39,40,42–46 The DCS BFI has been validated against a plethoraof gold-standard techniques;7,47–52 in these studies, the BFI andespecially its variation were demonstrated to be approximatelyproportional to true BF in a range of subjects and tissue types.However, clinical interpretation of the DCS BFI is complicatedby its unusual units of [cm2∕s]. To remedy this limitation, Gurleyet al. recently carried out exercise studies wherein they employedmeasurements of absolute BF with VO-DOS to calibrate sub-sequent continuous DCS measurements for the first time.35
After VO-DOS calibration, they monitored absolute muscleBF with DCS and determined oxygen metabolism during exer-cise. This promising approach combines the best features of
both techniques for the patient: quantitative absolute BF (VO-DOS) and continuous relative BF (DCS) monitoring.
However, perhaps because the calibration concept was not acentral goal of their paper, they simply assumed that the tech-nique worked. They did not validate the method, and their workdid not critically examine the technique’s accuracy, repeatabil-ity, and, ultimately, its potential for facilitating absolute BFmeasurements based on the DCS BFI alone (i.e., without venousocclusion). Clinically, absolute muscle BF monitoring withDCS alone is a significant advance that is especially usefulfor patients wherein venous occlusion is not feasible, e.g., inpatients with calcified vessels or pain due to peripheral arterydisease. Our study quantified the repeatability of the calibrationmethod, identified the sources and sizes of errors associated withabsolute BF calibration, and determined population-averagedvalues of these calibration coefficients for determination ofabsolute BF from DCS alone.
For error quantification, we tested the accuracy of the keyassumption made in the hybrid VO-DOS/DCS technique, i.e.,that γ is constant. Here, γ denotes the constant of proportionalitybetween VO-DOS absolute BF and DCS BFI. Since the VO-DOS/DCS technique assumes that γ remains constant for theentire monitoring session, percent variations in γ translateinto percent error in the measured absolute BF. We directly mea-sured the variability in γ on the arm of N ¼ 10 healthy adultsover a wide range of BF levels (e.g., for resting muscle and dur-ing the hyperemic overshoot after arm-cuff ischemia), acrossmeasurement days, and across tissue site (e.g., right arm versusleft arm, small probe position shifts on the same arm, etc.). Fromthese measurements, we derived a population-averaged estimateof γ on the dominant arm and assessed its suitability for deter-mining absolute BF from measured DCS BFIs.
We found excellent agreement (∼1∶1) between relative BFchanges measured by DCS and VO-DOS. Further, we found∼10% variability in γ across BF level, ∼20% variability acrossslight shifts in probe position, and ∼50% variability across meas-urement days. Thus, the current accuracy of hybrid VO-DOS/DCS technique should not be expected to be better than 10%;care should be taken to minimize probe positional shifts from sub-ject motion (e.g., during exercise), and, if possible, it is valuableto carry out a venous-occlusion calibration prior to each monitor-ing session. For cases wherein VO-DOS/DCS calibration is notfeasible, we derived a population-averaged calibration coefficientof γm ¼ 1.24 × 108 ðmL · 100 mL−1 · min−1Þ∕ðcm2∕sÞ to con-vert DCS BFI to absolute BF on a subject’s dominant arm, i.e.,BFDCS ¼ γm × BFI. We found a significant correlation(R2 ¼ 0.63) between BFDCS and absolute BF measured withVO-DOS across subjects when tissue optical properties are deter-mined on a subject-by-subject basis. However, individual subjectdeviations between BFDCS and BF are considerable (interquartilerange of 44%). Improvements in experimental design that shouldreduce this variability are discussed. Ultimately, the VO-DOS/DCS method will permit clinicians and researchers to mea-sure/monitor absolute skeletal BF continuously and noninvasivelyduring many kinds of activities, and the technique facilitatesdevelopment of strategies for absolute calibration of DCS.
2 Methods
2.1 Diffuse Correlation Spectroscopy
DCS is a noninvasive optical method that quantitatively mea-sures tissue BF using speckle correlation techniques.39,40,42–46
Herein, aspects of this technique relevant to our study are high-lighted; for additional details, the reader should consult compre-hensive reviews and papers.7,36–40 DCS measures the temporalintensity fluctuations of coherent near-infrared (NIR) light thathas multiply scattered from moving red blood cells in tis-sue.7,36,39,40 These fluctuations are quantified by computingthe temporal intensity autocorrelation function of the collectedlight, whose transport through tissue is mathematicallydescribed by the correlation diffusion equation. 39,40 The solu-tion to the correlation diffusion equation depends on severalparameters including tissue geometry, tissue absorption andreduced scattering coefficients (μa, μ 0
s), and a tissue BFI[cm2∕s]. In practice, BFI can be broken down further; it isthe product of an effective diffusion coefficient (DB) that char-acterizes red blood cell motion and another parameter (α) that isproportional to the concentration of moving red blood cells.Note that the correlation diffusion equation solution has beencompared to data across a wide range of sample length scalesand tissue types, and it has been found to best match the mea-sured signals when the mean-square displacement of the redblood cells is modeled diffusively.36
To quantify BF with DCS, the measured intensity autocor-relation function from muscle is fit to the solution of the corre-lation diffusion equation in the semi-infinite geometry; from thisfit, we extract BFI.39,40,53,54 The tissue absorption and reducedscattering coefficients are required inputs for this fit. For thepresent study, we measured each subject’s baseline tissueabsorption (μa0) and baseline reduced scattering (μ 0
s0) coefficientwith a frequency-domain diffuse optical spectroscopy device(Sec. 2.4). Subsequent variations in tissue absorption withrespect to baseline during the monitoring session were obtainedfrom DOS intensity changes using the semi-infinite modifiedBeer-Lambert law55,56 (see Sec. 2.5), with tissue scatteringassumed to remain constant.
Although the BFI has nontraditional units for flow, we andothers have shown that BFI is proportional to true tissueBF.8,47–51,57
Here, we define the proportionality constant, γ½ðmL ·100 mL−1 · min−1Þ∕ðcm2∕sÞ�, as the DCS calibration coeffi-cient. Note that this proportionality relation is accurate onlyfor physiological conditions; for example, when flow isvery low and a biological zero is probed, then an offset istypically observed, and the simple proportionality relationbreaks down.
From Eq. (1), it is apparent that fractional/relative changesof tissue blood flow (rBF) compared to a baseline blood flowBF0 can be derived from corresponding changes in BFI, i.e.,
Therefore, knowledge of γ is not required to derive relativechanges in BF from relative changes in BFI. However, knowl-edge of γ is required to interpret BFI for any problem needinginformation about flow in absolute (clinical) units [Eq. (1)].Thus, the primary goal of this in vivo study is to determineand critically characterize γ using independent measurementsof BF with VO-DOS.
Journal of Biomedical Optics 125005-2 December 2015 • Vol. 20(12)
Li et al.: Calibration of diffuse correlation spectroscopy blood flow index. . .
2.2 Venous-Occlusion Diffuse Optical Spectroscopy
DOS is a well-known technique that uses diffuse NIR light tomonitor tissue oxygen saturation and blood volume.51,58,59 Thetechnique of VO-DOS employs DOS to measure changes inblood volume during a venous occlusion, and this informationpermits estimation of absolute muscle BF.26–35 The venousocclusion of skeletal blood vessels is made with a blood pressurecuff set above venous pressure, but below arterial pressure (e.g.,the blood pressure cuff is inflated to ∼50 mmHg). Practitionersassume that during such an occlusion, venous outflow drainingthe muscle is reduced to zero, but arterial inflow, accommodatedby passive expansion of the muscle vasculature, is initiallyunaltered.
With zero outflow and constant inflow, the muscle blood vol-ume initially increases at a constant rate, and the tissue BF in thiscase is readily modeled as being proportional to the rate ofincrease in blood volume. In practice, we measure the rate ofincrease in the concentration of total hemoglobin ([HbT])with DOS, which is proportional to the rate of increase inblood volume. The tissue BF is then given by29
EQ-TARGET;temp:intralink-;e003;63;525BF ¼ 1
Cd½HbT�
dt; (3)
where C is the concentration of hemoglobin in blood, which isassumed or is measured from a blood gas sample. In our mea-surements, we assumed C to be 14.1 g∕dL.35 We will revisit andreconsider the VO-DOS assumptions in Sec. 4.
2.3 Instrumentation
For subject monitoring during arm-cuff occlusion experiments(Sec. 2.4), we utilized a custom-designed hybrid optical instru-ment that could continuously obtain continuous-wave DOS andDCS data (Fig. 1); the instrument is described in detail else-where.60 Briefly, the DOS measurements employed five laserdiodes (685, 730, 785, 808, and 830 nm; OZ Optics, Ottawa,Canada) coupled to an optical switch (DiCon FiberopticsInc., Richmond, California) to sequentially illuminate a singletissue location (S in Fig. 1) via a multimode fiber (940 μm core
diameter; OZ Optics). Multiply scattered light emerging at tissuelocation D in Fig. 1 was detected with a multimode fiber bundle(3.5 mm active area diameter; Dolan-Jenner Industries,Boxborough, Massachusetts) and was coupled to a photomulti-plier tube (R928, Hamamatsu, Bridgewater, New Jersey).
For DCS measurements, a continuous-wave, long-coher-ence-length, fiber-coupled laser (785 nm, DL785-100-SO,CrystaLaser Inc., Reno, Nevada) illuminated the tissue at loca-tion FS in Fig. 1 via a multimode optical fiber (200 μm diameter;OZ Optics). Detected light emerged at location FD in Fig. 1, anda single-photon counting avalanche photodiode (SPCM-AQ4C,Excelitas, Quebec, Canada) was coupled to this output light viaa single-mode fiber (5 μm diameter; OZ Optics). A commercialmulti-tau hardware correlator (Correlator.com, Bridgewater,New Jersey) computed the intensity autocorrelation functionof the detected DCS light in real time. For the DCS andDOS measurements, the source–detector separation was2.5 cm, and the temporal resolutions were 2.5 and 3 s per meas-urement, respectively.
As an alternative to venous-occlusion calibration, we aimedto derive a population-averaged calibration coefficient [i.e., γ inEq. (1)] to convert DCS BFI directly to absolute BF. This ideawas stymied, in part, by a mediocre correlation between absoluteBF and BFI. We later realized that this mediocre correlation wasin large part due to errors in our assumed baseline tissueoptical properties for the subjects. To ameliorate these errors,we utilized a frequency-domain ISS Imagent (ISS Medical,Champaign, Illinois) for subject-specific measurement of base-line absolute absorption and reduced scattering coefficients at830 and 785 nm; this frequency-domain spectroscopy measure-ment was carried out many days after the cuff-occlusion experi-ments on the same subjects (Sec. 2.4).
2.4 Subjects and Protocols
Ten healthy adult volunteers (six men, four women, age29.5� 3.8) participated in this study after giving their writteninformed consent. All study procedures were approved by theinstitutional review board of the University of Pennsylvania.Each subject came to the University of Pennsylvania for fourvisits.
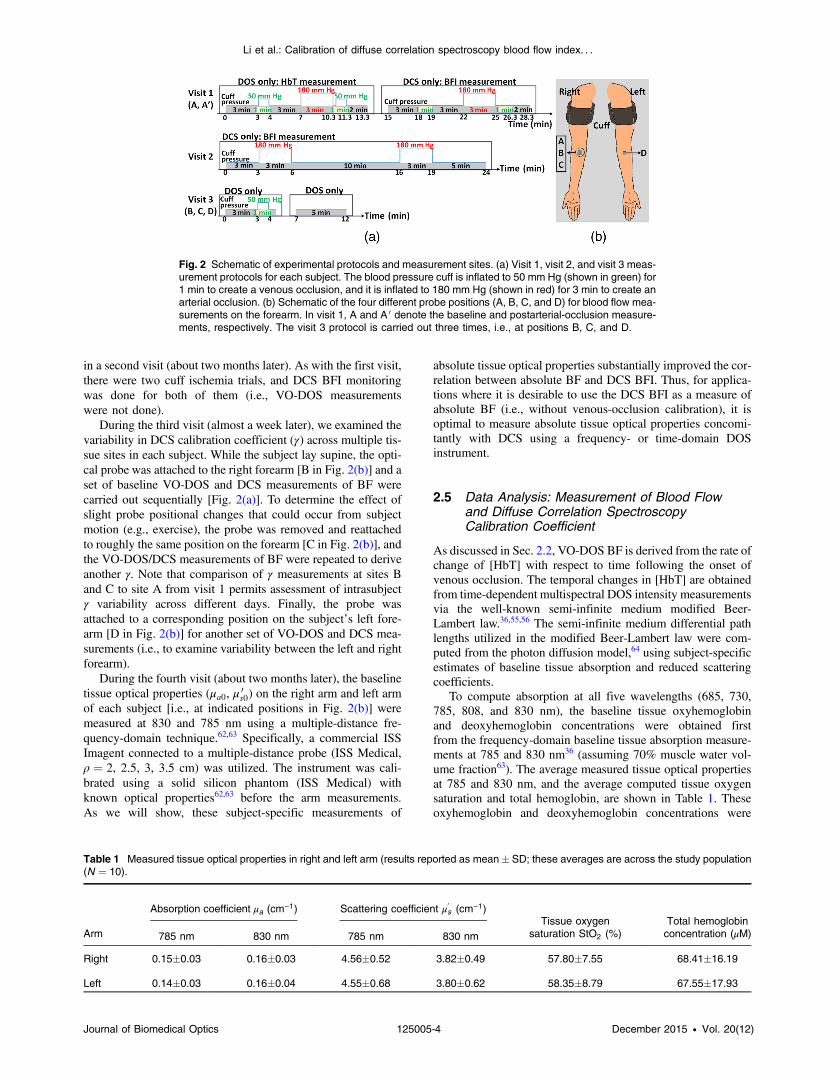
In the first visit, the subject lay supine with his/her right armextended in a comfortable bed (note that all subjects measured inthe study were right-handed, hence the right arm was their dom-inant arm). The optical probe was secured to the subject’s rightforearm with an elastic neoprene strap at position A indicated inFig. 2(b). A blood pressure cuff was placed around the rightbicep. Two cuff ischemia trials were carried out in series; forthe arterial occlusion (cuff ischemia) measurement, the bloodpressure cuff was inflated to 180 mm Hg [indicated in red inFig. 2(a)]. In the first trial, measurements of [HbT] were utilizedto estimate absolute BF with the VO-DOS method at the base-line and postarterial-occlusion intervals [indicated in green withcuff pressure of 50 mm Hg in Fig. 2(a)]. In the second trial, theDCS BFI was continuously monitored. Since the absolute BFwas measured twice at site A (baseline and postarterial-occlu-sion measurement), we use A to denote the baseline measure-ment and A 0 to denote the postarterial-occlusion measurement.Thus, for each venous-occlusion measurement, a DCS calibra-tion coefficient [γ; see Eq. (1)] is determined. This informationenables us to assess the variability in γ over a range of BF levels.
The reproducibility of the cuff ischemia BF responsebetween trials 1 and 2 in each subject was tested with DCS
Fig. 1 Schematic of the hybrid instrument for diffuse correlation spec-troscopy (DCS) monitoring of blood flow and diffuse optical spectros-copy (DOS) monitoring of tissue total hemoglobin in the forearm. Theoptical probe head is comprised of four optical fibers that form oneDCS source–detector separation pair (FS-FD, 2.5 cm) and oneDOS source–detector separation pair (S-D, 2.5 cm). As a roughrule of thumb, the approximate depth of measurement below theskin is one third to one half the source-detector separation, i.e.,1.25 cm (for a more precise relation, see Ref. 61). A tourniquet system(Zimmer Inc., Warsaw, Indiana) is utilized to inflate an arm cuff to50 mm Hg (shown in green) for venous occlusion and 180 mm Hg(shown in red) for arterial occlusion.
Journal of Biomedical Optics 125005-3 December 2015 • Vol. 20(12)
Li et al.: Calibration of diffuse correlation spectroscopy blood flow index. . .
in a second visit (about two months later). As with the first visit,there were two cuff ischemia trials, and DCS BFI monitoringwas done for both of them (i.e., VO-DOS measurementswere not done).
During the third visit (almost a week later), we examined thevariability in DCS calibration coefficient (γ) across multiple tis-sue sites in each subject. While the subject lay supine, the opti-cal probe was attached to the right forearm [B in Fig. 2(b)] and aset of baseline VO-DOS and DCS measurements of BF werecarried out sequentially [Fig. 2(a)]. To determine the effect ofslight probe positional changes that could occur from subjectmotion (e.g., exercise), the probe was removed and reattachedto roughly the same position on the forearm [C in Fig. 2(b)], andthe VO-DOS/DCS measurements of BF were repeated to deriveanother γ. Note that comparison of γ measurements at sites Band C to site A from visit 1 permits assessment of intrasubjectγ variability across different days. Finally, the probe wasattached to a corresponding position on the subject’s left fore-arm [D in Fig. 2(b)] for another set of VO-DOS and DCS mea-surements (i.e., to examine variability between the left and rightforearm).
During the fourth visit (about two months later), the baselinetissue optical properties (μa0, μ 0
s0) on the right arm and left armof each subject [i.e., at indicated positions in Fig. 2(b)] weremeasured at 830 and 785 nm using a multiple-distance fre-quency-domain technique.62,63 Specifically, a commercial ISSImagent connected to a multiple-distance probe (ISS Medical,ρ ¼ 2, 2.5, 3, 3.5 cm) was utilized. The instrument was cali-brated using a solid silicon phantom (ISS Medical) withknown optical properties62,63 before the arm measurements.As we will show, these subject-specific measurements of
absolute tissue optical properties substantially improved the cor-relation between absolute BF and DCS BFI. Thus, for applica-tions where it is desirable to use the DCS BFI as a measure ofabsolute BF (i.e., without venous-occlusion calibration), it isoptimal to measure absolute tissue optical properties concomi-tantly with DCS using a frequency- or time-domain DOSinstrument.
2.5 Data Analysis: Measurement of Blood Flowand Diffuse Correlation SpectroscopyCalibration Coefficient
As discussed in Sec. 2.2, VO-DOS BF is derived from the rate ofchange of [HbT] with respect to time following the onset ofvenous occlusion. The temporal changes in [HbT] are obtainedfrom time-dependent multispectral DOS intensity measurementsvia the well-known semi-infinite medium modified Beer-Lambert law.36,55,56 The semi-infinite medium differential pathlengths utilized in the modified Beer-Lambert law were com-puted from the photon diffusion model,64 using subject-specificestimates of baseline tissue absorption and reduced scatteringcoefficients.
To compute absorption at all five wavelengths (685, 730,785, 808, and 830 nm), the baseline tissue oxyhemoglobinand deoxyhemoglobin concentrations were obtained firstfrom the frequency-domain baseline tissue absorption measure-ments at 785 and 830 nm36 (assuming 70% muscle water vol-ume fraction63). The average measured tissue optical propertiesat 785 and 830 nm, and the average computed tissue oxygensaturation and total hemoglobin, are shown in Table 1. Theseoxyhemoglobin and deoxyhemoglobin concentrations were
Fig. 2 Schematic of experimental protocols and measurement sites. (a) Visit 1, visit 2, and visit 3 meas-urement protocols for each subject. The blood pressure cuff is inflated to 50 mm Hg (shown in green) for1 min to create a venous occlusion, and it is inflated to 180 mm Hg (shown in red) for 3 min to create anarterial occlusion. (b) Schematic of the four different probe positions (A, B, C, and D) for blood flow mea-surements on the forearm. In visit 1, A and A 0 denote the baseline and postarterial-occlusion measure-ments, respectively. The visit 3 protocol is carried out three times, i.e., at positions B, C, and D.
Table 1 Measured tissue optical properties in right and left arm (results reported as mean� SD; these averages are across the study population(N ¼ 10).
Total hemoglobinconcentration (μM)785 nm 830 nm 785 nm 830 nm
Right 0.15�0.03 0.16�0.03 4.56�0.52 3.82�0.49 57.80�7.55 68.41�16.19
Left 0.14�0.03 0.16�0.04 4.55�0.68 3.80�0.62 58.35�8.79 67.55�17.93
Journal of Biomedical Optics 125005-4 December 2015 • Vol. 20(12)
Li et al.: Calibration of diffuse correlation spectroscopy blood flow index. . .
used to compute tissue absorption at the other three wave-lengths.36 For baseline tissue scattering, we found the measuredreduced scattering coefficients at 785 and 830 nm to be compa-rable. Therefore, the average of the two measurements wasused as the baseline tissue scattering coefficient for all fivewavelengths.
Figure 3 shows a temporal trace of [HbT] during venousocclusion in a representative subject. Absolute BF is obtainedvia Eq. (3), where the rate of change, d½HbT�∕dt, was estimatedfrom the slope of the linear regression line fit to [HbT] duringvenous occlusion (e.g., solid red line in Fig. 3).
Ideally, [HbT] will increase linearly following the onset ofvenous occlusion. In practice, however, the inflation of thearm cuff to 50 mm Hg is not instantaneous. Thus, the rate ofincrease in [HbT] is nonlinear at the earliest times, and thenit settles to a steady rate of increase obtained at full cuff infla-tion. Eventually, the vasculature in the muscle approaches maxi-mal dilation, resulting in an increase in venous blood pressurethat reduces arterial inflow. At this point, [HbT] starts to level offtoward a maximal value as arterial inflow drops to zero. Asshown in Fig. 3, blood flow is determined from the slope of[HbT] during the temporal interval Tfit, just after the pressureis increased and where the rate of increase is linear. (We notethat for some subjects, the linear regime for fitting had fewerdata points than in Fig. 3, leading to greater experimental uncer-tainty.) This procedure provides a quantitative estimate of abso-lute muscle BF just prior to each venous occlusion performed.For example, in visit 1 (see Fig. 2), two venous occlusions weredone, enabling the measurement of baseline absolute BF, BF0,and measurement of the peak BF achieved from the hyperemicovershoot following cuff ischemia, BFos.
These measurements of absolute BF with VO-DOS are thencombined with corresponding measurements of DCS BFI(Sec. 2.1) to calculate the DCS calibration coefficient, γ, viaEq. (1). Continuing with the visit 1 example, the baselineDCS BFI, BFI0, was obtained by averaging the measuredBFI over times corresponding to baseline temporal fitting inter-val, Tfit;0, in cuff ischemia trial 1 (i.e., that used for the baselineVO-DOS measurement of BF0, see Fig. 2). Similarly, BFIos wasobtained by averaging the measured BFI over the times corre-sponding to overshoot fitting interval, Tfit;os, used for the VO-DOS measurement of BFos. Two estimates of γ are, therefore,obtained from visit 1: γA ¼ BF0∕BFI0 and γA ¼ BFos∕BFIos.
During a separate visit on a different day (visit 3), three esti-mates of γ, i.e., γB, γC, and γD, were obtained from sequential
baseline VO-DOS and DCS muscle measurements acquired atpositions B, C, and D indicated in Fig. 2(b). Positions B and Con the right arm are roughly the same and similar to position A(i.e., the probe was removed from position B and then reattachedin roughly the same position, C); position D is at the correspond-ing location on the left arm.
We first establish that our VO-DOS protocol described inSec. 2.5 produces reasonable estimates of resting skeletalmuscle BF. For each subject, we acquired three measurementsof resting skeletal muscle BF on the right (dominant) forearm[see Fig. 2(b)]. On average, across 30 VO-DOS measurements[ð3 positionsÞ × ð10 subjectsÞ], the resting forearm muscle BF(mean� SD) in the dominant arm was BF0 ¼ 1.53�0.55 mL · 100 mL−1 · min−1. The resting BF on the left (non-dominant) arm was 1.61� 0.82 mL · 100 mL−1 · min−1. Theaverage resting BF across both right and left arms was1.56� 0.54 mL · 100 mL−1 · min−1. These measurements ofresting BF in the forearm are consistent with previously pub-lished findings, which are summarized in Table 2.
3.2 Cuff Ischemia due to Arterial OcclusionProduces a Reproducible Response
Since we do not determine flow with simultaneous measurementsof VO-DOS and DCS, we performed a second experiment toensure that BF measured with the arterial arm-cuff ischemiamodel is repeatable (see visit 2 in protocol, Fig. 2). Figure 4shows representative temporal dynamics of BFI estimated withDCS from a healthy male subject during two sequential cuffischemia experiments. During the artery occlusions (denotedas AO1 and AO2), DCS-BFI decreases by ∼95%, and then it rap-idly reaches a peak hyperemic overshoot above baseline follow-ing cuff deflation. The hemodynamics of the two arterialocclusions were characterized by the magnitudes of the peakhyperemic overshoot, FAO1 and FAO2, and the times to reachthe peak overshoot, TAO1 and TAO2 [see Fig. 4(b), insets].
In the 10 healthy subjects, the peak BF overshoot (FAO1,FAO2) and the time-to-peak overshoot (TAO1, TAO2) for thetwo arterial occlusions are in excellent agreement (Fig. 5).Figure 5(a) shows the comparison of the peak BF overshootof two arterial occlusions, plotting the peak BF overshoot ofthe second arterial occlusion on the vertical axis against thepeak BF overshoot of the first arterial occlusion on the horizon-tal axis. Figure 5(b) shows the analogous comparison of thetime-to-peak overshoot of the two arterial occlusions. Bothplots are highly linear (R2 ¼ 0.99) with a slope close tounity (0.98 for peak overshoot, 1.00 for time-to-peak). Thus,we conclude the BF response from sequential cuff ischemiaexperiments is reproducible. Interestingly, although the hypere-mic response is reproducible for a single subject, its magnitudeis highly heterogeneous across different subjects (Fig. 5).Similar heterogeneous responses to cuff ischemia were observedin the leg across both healthy subjects and patients with periph-eral artery disease.65,66
Fig. 3 Temporal [HbT] trace during baseline venous occlusion meas-urement of a healthy subject. T fit is the time interval (shaded greenregion) used for the linear regression fit of [HbT] (red solid line) duringvenous occlusion (VO).
Journal of Biomedical Optics 125005-5 December 2015 • Vol. 20(12)
Li et al.: Calibration of diffuse correlation spectroscopy blood flow index. . .
One aim of this paper is to compare BF dynamics duringarm-cuff ischemia measured with VO-DOS and with DCS.Accordingly, in another set of measurements on the same
subjects (visit 1 in Fig. 2), two sequential arterial occlusionswere carried out wherein the BF response in the first occlusion(trial 1) was measured with VO-DOS, and the BF responsein the second occlusion (trial 2) was measured with DCS[Fig. 6(a)]. Since the reproducibility of the cuff ischemiaresponse has been validated (Sec. 3.2), it is reasonable to
Table 2 Comparison of our venous-occlusion diffuse optical spectroscopy (VO-DOS) measurements of resting blood flow in the forearm (bottomrow) to other forearm resting blood flow estimates in the literature measured with VO-DOS and with venous-occlusion strain-gauge plethsmography(VO-SGP) (results reported as mean� SD; n/a, not applicable; N , number of subjects).
Study Wavelength (nm) Separation (cm)
Resting blood flow (mL · 100 mL−1 · min−1)
VO-DOS VO-SGP
Reference 29 775, 825, 850,904
3 1.9� 0.8 3.4� 1.3
(N ¼ 11, five trials per subject) (N ¼ 11)
Reference 31 770, 848, 901 3.5 1.1� 1.0 2.2� 0.8
(N ¼ 13, three trials per subject) (N ¼ 12)
Reference 34 905, 805, 770 3.5 1.28� 0.82 n/a(N ¼ 78, three trials per subject)
2, 2.5, 3 1.76� 0.42 n/a(N ¼ 9, three trials per subject)
Present study 685, 730, 785,808, 830
2.5 1.56� 0.54 n/a(N ¼ 10, four trials per subject)
Fig. 4 Reproducibility of blood flow response following arm-cuff ischemia. (a) Protocol of the DCS meas-urement for assessing reproducibility of cuff ischemia response in visit 2. (b) Representative changes inDCS blood flow index (BFI) during two consecutive artery occlusions. These responses are character-ized by their peak hyperemic magnitudes, FAO1 and FAO2, and the time durations from point of cuff defla-tion to hyperemic peak, T AO1 and T AO2 (indicated in insets).
Journal of Biomedical Optics 125005-6 December 2015 • Vol. 20(12)
Li et al.: Calibration of diffuse correlation spectroscopy blood flow index. . .
Fig. 5 Comparison of peak blood flow overshoot [FAO1, FAO2, (a) and (b)] and time-to-peak overshoot[T AO1, T AO2, (c) and (d)] of two artery occlusions in healthy adult subjects (N ¼ 10). The arterial occlu-sions, respectively, are denoted as AO1 and AO2. The hemodynamics of the two arterial occlusions werecharacterized by the magnitude of their peak hyperemic overshoot (FAO1, FAO2) and their time to reachthe peak overshoot (T AO1, T AO2). Bland-Altman plots are shown in (b) and (d); the solid horizontal lineindicates the mean difference between the two parameters computed across the study population, whichis not significantly different than zero. The dotted lines indicate the 95% confidence interval (CI) limits foragreement.
Fig. 6 Time tracesofHbTandBFI during theentiremeasurement (visit 1). Thebest linear fit lines (blacksolidlines) are used for calculation of BF0 andBFos. Green shaded and red shaded regions represent theVOandarterial occlusion (AO) periods, respectively. The purple shaded regions indicate the fit interval for determi-nationof absolute blood flow (b) and the corresponding intervals for BFI averaging (c). For the representativesubject, the baseline and hyperemia blood flows were estimated to be BF0 ¼ 1.17� 0.05 mL · 100 mL−1 ·min−1 and BFos ¼ 2.66� 0.35 mL · 100 mL−1 · min−1. The corresponding DCS estimates of BFI wereBFI0 ¼ ð6.08� 0.37Þ × 10−9 cm2∕s and BFIos ¼ ð1.46� 0.08Þ × 10−8 cm2∕s. Thus, the subject’s relativehyperemic blood flow overshoot measured with DCS and with VO-DOS are rBFIos ¼BFIos∕BFI0 − 1 ¼ 1.39� 0.23 and rBFos ¼ BFos∕BF0 − 1 ¼ 1.28� 0.20, respectively.
Journal of Biomedical Optics 125005-7 December 2015 • Vol. 20(12)
Li et al.: Calibration of diffuse correlation spectroscopy blood flow index. . .
compare the BF dynamics measured with VO-DOS to thedynamics measured with DCS. Figure 6(b) displays the tempo-ral traces of [HbT] and BFI during trials 1 and 2, respectively, ina representative healthy male subject. As before, the BFresponse was characterized by comparing the ratio of BF duringpostischemic hyperemia to a baseline value.
In trial 1, two venous occlusions were performed toestimate the baseline BF to be BF0 ¼ 1.17� 0.05 mL ·100 mL−1 · min−1 and the blood flow during hyperemia tobe BFos ¼ 2.66� 0.35 mL · 100 mL−1 · min−1 [note that theerrors in the BF estimates were calculated by bootstrap resam-pling of the data over the purple fitting interval in Fig. 6(b)].As discussed in Sec. 2.5, the baseline and postocclusion DCSBFIs (i.e., BFI0, BFIos) were averaged over corresponding timeintervals during the venous occlusions of trial 1 [Fig. 6(b)].For the representative subject in Fig. 6, the DCS measurementsin trial 2 were BFI0 ¼ ð6.08� 0.37Þ × 10−9 cm2∕s and BFIos ¼ð1.46� 0.08Þ × 10−8 cm2∕s (mean� SD). These BFI valueswere obtained from within the purple averaging interval inFig. 6(c). Thus, the subject’s relative hyperemic BF overshootmeasured with DCS and with VO-DOS are rBFIos ¼ BFIos∕BFI0 − 1 ¼ 1.39� 0.23 and rBFos ¼ BFos∕BF0 − 1 ¼ 1.28�0.20, respectively.
Figure 7(a) is a plot of rBFos measured with VO-DOS on thevertical axis against rBFos measured with DCS on the horizontalaxis for all 10 subjects. A linear regression analysis [Fig. 7(a);solid red regression line, dotted green one-to-one line] anda Tukey mean-difference (or Bland-Altman) analysis67,68
[Fig. 7(b)] show excellent agreement between the two tech-niques, per estimation of relative BF changes. The slopebetween relative BF measured by DOS (rBFos) and DCS(rBFIos) is 0.94 (�0.073), and the Pearsons correlation coeffi-cient is R2 ¼ 0.95. Further, the mean difference in relative BF of−0.10� 0.45 between the two techniques was not significantlydifferent from zero (P ¼ 0.2).
The observed agreement between the relative flow measuredby VO-DOS and DCS in Fig. 7 suggests that the two techniquesare sensitive to the same parameter, i.e., muscle BF. The data
also further support the notion of using VO-DOS to calibrateDCS for accurate absolute BF monitoring in skeletal muscle.
3.4 Calibration of Diffuse Correlation SpectroscopyBlood Flow With Venous-Occlusion DiffuseOptical Spectroscopy for Absolute Blood Flow
We found that the absolute BF measured with VO-DOS on theright arm significantly correlates with the absolute BFI mea-sured with DCS [R2 ¼ 0.63, n ¼ 30, P < 0.01, see Fig. 8(a)].We estimate the DCS calibration coefficient [Eq. (1)] fromthe slope of the best fit line, i.e., γ ¼ ð1.24� 0.15Þ ×108 ðmL · 100 mL−1 · min−1Þ∕ðcm2∕sÞ; here, the error is the95% confidence interval (CI). As an important practical consid-eration, the subject-specific measurement of baseline opticalproperties is required to achieve this level of correlation signifi-cance. By contrast, when baseline optical properties used tocompute the DCS BFI were assumed (μa0 ¼ 0.17 andμ 0s0 ¼ 6 cm−1),69 the correlation was weaker [R2 ¼ 0.15,
n ¼ 30, P ¼ 0.032, see Fig. 8(b)].The significant correlation in Fig. 8(a) suggests that the
DCS BFI can be used as a surrogate for absolute BF, i.e.,BFDCS ≡ ð1.24 × 10⁸ÞBFI. Figure 9(a) is a plot of absoluteBF measured with VO-DOS on the vertical axis againstabsolute BFDCS calculated from the measured BFI [usingð1.24 × 10⁸ÞBFI� on the horizontal axis across n ¼ 30 measure-ments. A linear regression line [solid red line in Fig. 9(a)] and aone-to-one line [dotted yellow line in Fig. 9(a)] exhibit moderatecorrelation (R2 ¼ 0.63) between the two techniques; impor-tantly, there exists considerable variability on a per-subjectbasis. The interquartile range (75th percentile to 25th percentile,n ¼ 30 measurements) of the fractional difference BFDCS∕BF −1 is 44%, which is modestly smaller than the intersubject vari-ability in BF of 75% [i.e., BF∕BFm − 1 has an interquartilerange of 75%, where BFm is the mean BF across subjects(Table 2)]. Additionally, the Bland-Altman analysis of thesedata [Fig. 9(b)] reveals a mean difference in absolute BF of0.1� 1.0 mL · 100 mL−1 · min−1, which is not significantlydifferent than zero (P ¼ 0.3). By contrast to the relative BF
Fig. 7 (a) Relative hyperemic blood flow overshoot from cuff ischemia measured by VO-DOS (verticalaxis) and by DCS (horizontal axis) inN ¼ 10 healthy adults. The solid red line is the linear best-fit with theintercept forced at zero (R2 ¼ 0.95, slope ¼ 0.94� 0.073) and the dotted green line is the one-to-oneline. rBFIos is the relative fractional DCS BFI change, i.e., BFIos∕BFI0; rBFos is the relative fractional VO-DOS blood flow change, i.e., BFos∕BF0. (b) Bland-Altman plot of the difference in rBFIos and rBFos versusthe mean of these two parameters. The solid horizontal line indicates the mean difference between thesetwo parameters computed across the study population (N ¼ 10), which is not significantly different fromzero (P ¼ 0.2); the dotted lines indicate the 95% CI limits for agreement.
Journal of Biomedical Optics 125005-8 December 2015 • Vol. 20(12)
Li et al.: Calibration of diffuse correlation spectroscopy blood flow index. . .
results in Fig. 7, however, the mean difference estimated by the95% CI of the absolute BF results is of order its mean [Fig. 9(b)]; this finding suggests substantial variability on a per-subjectbasis can exist and should be accounted for, whenever possible.
Thus, it is best to employ in situ calibration of DCS for abso-lute BF monitoring with VO-DOS on a per-subject basis. For insitu calibration, γ is derived from the quotient of the absolute BFmeasurement with VO-DOS and the corresponding BFI meas-urement with DCS [see Sec. 2.5 and Eq. (1)]. For each subject,we utilized this approach to obtain five estimates of γ that cor-respond to the five pairs of VO-DOS and DCS measurementsmade during visits 1 and 3 (Sec. 2.5). In visit 1 (Fig. 2), twosubject-specific estimates of γ corresponding to the baselineand hyperemic overshoot BF levels were obtained on the dom-inant arm: γA ¼ BF0∕BFI0 and γA 0 ¼ BFos∕BFIos for each sub-ject. In a separate visit on a different day (i.e., visit 3), threesubject-specific estimates of γ were obtained: γB and γC,acquired at roughly the same position on the dominant arm(the probe was removed and reattached between measurements),
and γD, acquired at the corresponding position on the nondomi-nant arm.
The in situ measurements of γA, γA 0 , γB, γC, and γD acrosssubjects are shown in Fig. 10. Interestingly, although the mediancalibration coefficient is similar for different positions (and flowspeeds) on the dominant arm, it is noticeably higher on the non-dominant arm (Fig. 10). This observation suggests that the cal-ibration technique can be sensitive to tissue heterogeneities (e.g., differences in tissue vascular structure between right and leftarm, discussed further in Sec. 4).
In Table 3, we quantitatively characterize the intrasubjectvariability in γ over four paired comparisons across differentflow levels (RAA 0 ), slightly different positions (RBC), differentdays (RABC), and different arms (RBCD). Both the weightedmean and median were computed for each comparison. Theweight that each subject contributes in the weighted mean isset by the inverse of the subject’s variance for the particular vari-ability parameter (see Table 3). To estimate the variance, thestandard deviation of the variability parameter (i.e., obtained
Fig. 8 Absolute blood flow measured by VO-DOS (vertical axis) compared to the blood flow index mea-sured by DCS (horizontal axis) across n ¼ 30 measurements [ðA;B;CÞ × 10 subjects]. The labels A, B,and C described in Fig. 2 correspond to three separate measurements on the dominant forearm in eachsubject using (a) measured optical properties and (b) assumed optical properties (i.e., μa0 ¼ 0.17,μ 0s0 ¼ 6 cm−1). The red solid line represents the best linear fit to the data. In both panels, the estimate
of γ is the slope of the best linear fit, and the error is the 95% CI for the slope.
Fig. 9 (a) Absolute blood flow measured by VO-DOS (vertical axis; BF) and by DCS [horizontal axis;BFDCS ¼ ð1.24 × 10⁸ÞBFI, as determined from Fig. 8(a)] across n ¼ 30 measurements [ðA;B;CÞ ×10 subjects]. The labels A, B, and C described in Fig. 2 correspond to three separate measurementson the dominant forearm in each subject using measured optical properties). The solid red line is thelinear best-fit (R2 ¼ 0.63) and the dotted yellow line is the one-to-one line. (b) Bland-Altman plot ofthe difference in BFDCS and BF versus the mean of these two parameters. The solid horizontal line indi-cates the mean difference between these two parameters computed across n ¼ 30 measurements[ðA;B;CÞ × 10 subjects]; the dotted lines indicate the 95% CI limits for agreement.
Journal of Biomedical Optics 125005-9 December 2015 • Vol. 20(12)
Li et al.: Calibration of diffuse correlation spectroscopy blood flow index. . .
from the standard deviations of the appropriate γ coefficients)was added in quadrature with the median of RAA 0 .70 In this pro-cedure, we thus regard the median of RAA 0 as a minimum sys-tematic error to prevent overweighting of particular subjectswith small random error bars. To estimate the subject’s randomerror, the standard deviations in the absolute BF and BFI mea-surements were employed to compute the standard deviations inthe γ coefficients present in the variability parameter [Eq. (1)].Here, the standard deviation of the measured slope d½HbT�∕dtdetermined the standard deviation in BF, and the standarddeviation in BFI was computed across the measurements inthe appropriate venous occlusion time window (e.g., purpleshaded regions in Fig. 6).
As expected from our results in Fig. 7, intrasubject variabilityin γ at different BF levels but at the same site and on the sameday is small (first comparison in Table 3). Removing and reat-taching the probe at a slightly different position on the right fore-arm had a larger effect on the measured γ coefficient (secondcomparison in Table 3). The variability in γ across differentdays was even more substantial (notice the large SD ofRABC). Finally, the fourth comparison in Table 3 is a comple-mentary result to Fig. 10, indicating a systematic differencein the γ coefficient between the dominant (right) and nondomi-nant (left) arms.
4 DiscussionTo our knowledge, the present study is the first direct compari-son and characterization of muscle BF changes measured withthe techniques of VO-DOS and DCS. An important previousexperiment employed the method,35 but it made an implicitassumption that the techniques are comparable and repeatable.Our study rigorously tests this assumption, comprehensivelyestablishes limits of accuracy, provides guidelines for calibra-tion of DCS with VO-DOS, and examines absolute BF monitor-ing based on DCS BFI without venous-occlusion calibration.
First, we used a cuff ischemia paradigm to assess agreementbetween VO-DOS and DCS per relative BF changes.Interestingly, although the hyperemic BF response to arm-cuff ischemia is reproducible for a single subject, it is highlyheterogeneous across different subjects (Figs. 5 and 7). Thus,our experimental scheme facilitated comparison of the two tech-niques over a wide range of flow levels. Specifically, across 10subjects, peak hyperemia ranged from 100 to ∼400% (Fig. 7)and time-to-peak hyperemia ranged from 6 to 24 s (Fig. 5).We observed a high correlation (R2 ¼ 0.95, P < 0.01), goodagreement [slope ¼ 0.94 ð�0.073Þ], and small mean difference[i.e., −0.10 (�0.45)] in the cuff ischemia induced BF changesmeasured with VO-DOS versus DCS (Fig. 7).
This observation supports the concept, initially suggested byGurley et al.,35 of using VO-DOS to calibrate DCS for continu-ous absolute BF monitoring. This optical technique for absolutemuscle BF monitoring is arguably more accurate than the con-ventional SGP technique, because SGP measures global BFacross the whole limb, while VO-DOS and DCS are more local-ized to muscle tissue,29 i.e., the approximate depth of measure-ment below the skin is half the source–detector separation(∼1.25 cm). Calibration of DCS with VO-DOS is also attractivebecause both methods employ diffuse optical signals that sam-ple approximately the same tissue volume. [Note that variationin depth penetration from absorption differences at NIR wave-lengths used for DOS (685 to 830 nm) and DCS (785 nm) iscomparatively small and is safely ignored.]
Underlying the accuracy of the VO-DOS/DCS BF monitor-ing technique is the assumption that the constant of proportion-ality between absolute BF and the DCS BFI, γ, indeed remainsconstant for the entire monitoring session. To test thisassumption, we measured γ for muscle at rest (i.e., γA) andfor the higher hyperemic overshoot BF level following arm-cuff ischemia (i.e., γA 0 ). On average, γA differed from γA 0 by
Fig. 10 Box plots of the five DCS calibration coefficient measure-ments (γA, γA’, γB, γC, γD; see Sec. 2.5) measured on 10 healthy sub-jects. In both panels, the central mark is the median, the edges of thebox are the 25th and 75th percentiles, the whiskers extend to the mostextreme data points not considered outliers, and the blue dots re-present each subject measurement.
Table 3 Comparison of intrasubject variability in the calibration coefficient γ across different blood flow levels, positions, and days. Here, theweighted mean and median are computed over the study population (N ¼ 10). The weights used in computing the weighted mean and standarddeviation are the inverse variances of the subject measurements (see main text).
Comparison Positions Variability parameter Weighted mean (�weighted SD) % Median (�25 percentile) %
Baseline flow versus hyperemicflow (visit 1)
Same RAA 0 ≡ γAγA 0 × 100 97�10 105�8
(A, A 0)
Consecutive measurementrepeatability (visit 3)
Similar RBC ≡ γBγC× 100 110�23 117� 19
(B, C)
Visit 1 versus 3 (two monthsbetween visits)
Similar RABC ≡ γA0.5ðγBþγCÞ × 100 95�49 109�43
(A, B, C)
Right versus left arm (visit 3) Different RBCD ≡ 0.5ðγBþγCÞγD
× 100 68�35 65�32(B, C, D)
Journal of Biomedical Optics 125005-10 December 2015 • Vol. 20(12)
Li et al.: Calibration of diffuse correlation spectroscopy blood flow index. . .
10% (see RAA 0 variability parameter in Table 3). Thus, when γ isassumed constant, the percent deviation in γ corresponds to apercent error in absolute BF [see Eq. (1)]. We therefore expectthe percent error in the VO-DOS/DCS measurement of absolutemuscle BF to be ∼10%.
Further, during a monitoring session involving musclemotion (e.g., exercise), the optical probe is prone to small posi-tion changes that can induce substantial changes in γ (∼20%, seeRBC variability parameter in Table 3). This result highlights theimportance of firmly securing the probe during a monitoringsession to reduce occurrence of positional error. It is also pru-dent to track probe motion via an accelerometer to aid detectionof motion-induced γ variation.
The study revealed a significant correlation between the DCSBFI and absolute muscle BF (VO-DOS) on the dominant rightarm [R2 ¼ 0.63, Fig. 8(a)]. However, we caution that on aper-subject basis, the computation of absolute muscle BFfrom the DCS BFI using the slope of the best fit line as theγ coefficient [i.e., BFDCS ¼ ð1.24 × 10⁸Þ × BFI] can deviateconsiderably from the true BF measured by VO-DOS(mean difference ¼ 0.1� 1.0 mL · 100 mL−1 · min−1, Fig. 9).In fact, the interquartile range (75th percentile to 25th percentile,N ¼ 30 measurements) of the fractional differenceBFDCS∕BF − 1 is 44%, which is modestly smaller than the inter-subject variability in BF of 75% [i.e., BF∕BFm − 1 has an inter-quartile range of 75%, where BFm is the mean BF acrosssubjects (Table 2)]. We will outline strategies to amelioratethese differences below. Based on the present approach withoutadditional strategies (see below), we conclude that it is prefer-able to carry out an in situ calibration of DCS with VO-DOSprior to every monitoring session. When calibration is person-alized to subject and session in this manner, our results suggestthat the calibration coefficient will remain roughly constantacross a wide range of BF changes (i.e., within 10%, seeFig. 7, Table 3).
Our investigation suggests several strategies for improvingthe accuracy of BFDCS for measuring absolute BF. First, wefound it important to measure and use absolute tissue opticalproperties for each subject; i.e., when we assumed the samebaseline optical properties for every subject, the correlationsbetween DCS BFI and absolute BF were mediocre (seeFig. 8). This conclusion and suggestion is consistent with thefindings of Irwin et al.71 Note that our study sets a lowerbound on possible improvement due to measurement of absoluteoptical properties, since we measured baseline optical propertiesfor each subject at only one time-point. We expect further cor-relation improvements when measurements of absolute opticalproperties, using frequency- or time-domain instrumentation,accompany each DCS measurement. We stress that these con-comitant measurements should be done whenever using DCSBFI to estimate absolute BF.
Second, tissue heterogeneity and measurement uniformityacross subjects is always a factor when attempting to derive pop-ulation-averaged calibration. For example, the layer thickness ofthe adipose tissue located above the muscle72 and the pressure ofthe probe against the tissue4 are both effects for which we didnot control in the present study. Different superficial fat thick-nesses can affect the fraction of light that interacts with themuscle; further, muscle typically has a higher blood volumefraction than adipose tissue, and hence, it can have a higherα value and higher BFI even if flow velocities in the two tissuesare similar. In our study, we did not measure the thickness of
these layers; future studies should attempt to measure/assess tis-sue heterogeneity. Similarly, increased pressure applied by theprobe on the tissue surface can have the effect of reducing thesuperficial tissue blood flow above the muscle.4 In our study, wedid not explicitly control for the probe pressure; in future stud-ies, this effect can be ameliorated by measurement and adjust-ment of pressure in situ and even by pressure modulation.73
Another source of calibration error can arise from breakdownof the assumptions employed in VO-DOS measurements of BF.The simplest of these issues concerns the factor C, i.e., the con-centration of hemoglobin in blood, which we assumed to be14.1 g∕dL35 for all subjects. In the future, direct measurementor estimation of C should reduce variation in γ across subjects.More subtle errors can arise from assumptions about the effectsof the 50 mm Hg cuff inflation. VO-DOS assumes that completevenous occlusion occurs at 50 mm Hg. However, depending onthe locations of veins and venules in the arm tissues, as well ontissue elastic moduli, it is possible that some veins or venulescould remain partially open at 50 mm Hg. Errors associatedwith this assumption could lead to an underestimation of BFby VO-DOS. Conversely, it is also possible that some arteriolesand arteries could decrease in diameter with concomitantincrease in vascular resistance at 50 mm Hg; in this case,blood flow at 50 mm Hg would decrease compared to normal.Still other related phenomenology could lead to a breakdown inthe assumptions about changing vasculature volume. Indeed,some of these effects could help explain the observed variabilityin absolute BF across different cuff inflation pressures measuredby VO-DOS.33 These sources of VO-DOS error very likely con-tribute to the observed heterogeneity in our DCS calibrationcoefficients (see Fig. 10, Table 3).
We observed an interesting effect in the calibration of leftversus right (dominant) arms. Specifically, substantial variabil-ity was found between the calibration coefficients measured onthe right and left arms (∼35%, Table 3), even when using tissueoptical properties measured in-situ for each arm. One potentialexplanation for this difference derives from tissue microstruc-ture. To further appreciate this argument, recall that the calibra-tion coefficient γ relates the measured DCS BFI to absolute BF.Formally, DCS BFI is defined as BFI ¼ αDb.
36 Here, α is thefraction of dynamically scattered photons, and Db characterizesthe mean square displacement of the scattering particles (e.g.,red blood cells). In general, Db depends on the nature of themicroscopic motions, on the spatial distributions of red bloodcell motion, and on photon light paths. The structure of the vas-culature is probably different between the right and left arms(the right is the dominant arm in all our subjects) as a resultof differences in muscle tone, fat content, size/diameter ofarteries/veins, etc. Similarly, Db could be different betweenthe right and left arms, even though we measured absoluteBF to be almost the same (1.53� 0.55 mL · 100 mL−1 ·min−1 for the right and 1.61� 0.82 mL · 100 mL−1 · min−1
for the left arm); this effect could arise as a result of differencesin size/diameter/distribution of tissue vasculature. The calibra-tion coefficient implicitly accounts for these and other possibletissue heterogeneities, and detailed explanations for these issueswill require further study.
Finally, we turn to the potential of this approach for flowmeasurement in other tissues. Although venous occlusion iseasily achieved for skeletal muscle in the limbs (e.g., armsand legs), it is difficult to implement for tissues such as thebrain. Another challenge associated with the brain is its
Journal of Biomedical Optics 125005-11 December 2015 • Vol. 20(12)
Li et al.: Calibration of diffuse correlation spectroscopy blood flow index. . .
depth below the skin (∼1.2 cm for adults73), which is compa-rable to the approximate depth of measurement. Thus, althoughthe technique is sensitive to the brain, signal contamination fromsuperficial tissue layers is not negligible;73 note that for neonateswhere the superficial tissue layer thickness is smaller, this issueis less of a concern. Therefore, this VO-DOS calibrationapproach of DCS is currently limited to skeletal muscle BF.Nevertheless, absolute BF monitoring with DCS and VO-DOS has great clinical relevance. For example, it can be appliedto measure and monitor absolute BF continuously in the legs ofpatients with peripheral artery disease (PAD). Absolute BF, inthis case, will provide additional information that complementsrelative flow changes. For instance, several investigators haveexplored the use of the hyperemic response to cuff ischemiato assess the health of peripheral vasculature,65,74,75 but interpre-tation of the hyperemic response measurements as a diagnostictool for vascular health is complicated by significant responseheterogeneity in subjects of similar vascular health (e.g., Figs. 5and 7). The only requirement for continuous absolute BF mea-surements with DCS is a one-time VO-DOS calibration meas-urement. In principle, either the VO-DOS method or the VO-SGP method can provide this absolute BF calibration.Importantly, and unlike the VO-DOS and VO-SGP techniques,DCS does not interrupt BF during measurement and can provideabsolute BF continuously even during exercise.35,76 Patientswith PAD have lower than normal BF to the skeletal muscle,resulting in a mismatch of oxygen supply and metabolicdemand.77,78 Knowledge of absolute BF at rest and during exer-cise has potential to improve diagnostic and treatment optionsfor muscle diseases (i.e., PAD).65,77,79
5 ConclusionsWe have validated VO-DOS as a measure of relative BF againstDCS in humans. We also showed that VO-DOS technique canbe used to calibrate DCS for skeletal muscle BF. Provided thatbaseline tissue optical properties are measured, the variability inthe calibration coefficient is small enough that there is a signifi-cant correlation between DCS BFI and absolute BF. However,the variability can still be an issue, and if possible, it is best tocalibrate DCS with VO-DOS prior to every BF monitoring ses-sion. Several parameters were identified that could give rise tocalibration coefficient variation; in the future, most of theseparameters (e.g., probe pressure, C, etc.) can be measuredand controlled.
AcknowledgmentsWe thank David Busch and ShihYu Tzeng for valuable discus-sions and assistance with measurements. We acknowledge sup-port from the National Institutes of Health (AGY, R01-NS060653, P41-EB015893), the American Heart Association(ABP, 14POST20460161), the China Scholarship Council(201306250114) and the Application Foundation & AdvancedTechnology Research Program of Tianjin (14JCZDJC33100).
References1. D. P. Casey, T. B. Curry, and M. J. Joyner, “Measuring muscle blood
flow: a key link between systemic and regional metabolism,” Curr.Opin. Clin. Nutr. Metab. Care 11(5), 580–586 (2008).
2. A. Villringer and B. Chance, “Non-invasive optical spectroscopy andimaging of human brain function,” Trends Neurosci. 20(10), 435–442 (1997).
3. D. A. Boas, A. M. Dale, and M. A. Franceschini, “Diffuse optical im-aging of brain activation: approaches to optimizing image sensitivity,resolution, and accuracy,” NeuroImage 23, S275–S288 (2004).
4. R. C. Mesquita et al., “Influence of probe pressure on the diffuse cor-relation spectroscopy blood flow signal: extra-cerebral contributions,”Biomed. Opt. Express 4(7), 978–994 (2013).
5. M. N. Kim et al., “Continuous optical monitoring of cerebral hemo-dynamics during head-of-bed manipulation in brain-injured adults,”Neurocrit. Care 20(3), 443–453 (2014).
6. M. Ferrari, M. Muthalib, and V. Quaresima, “The use of near-infraredspectroscopy in understanding skeletal muscle physiology: recent devel-opments,” Philos. Trans. Ser. A, Math. Phys. Eng. Sci. 369(1955),4577–4590 (2011).
7. R. C. Mesquita et al., “Direct measurement of tissue blood flow andmetabolism with diffuse optics,” Philos. Trans. Ser. A, Math. Phys.Eng. Sci. 369(1955), 4390–4406 (2011).
8. G. Yu et al., “Validation of diffuse correlation spectroscopy for muscleblood flow with concurrent arterial spin labeled perfusion MRI,” Opt.Express 15(3), 1064–1075 (2007).
9. H. L. Gornik and J. A. Beckman, “Peripheral arterial disease,”Circulation 111(13), e169–e172 (2005).
10. E. Selvin and T. P. Erlinger, “Prevalence of and risk factors for periph-eral arterial disease in the United States: results from the NationalHealth and Nutrition Examination Survey, 1999–2000,” Circulation110(6), 738–743 (2004).
11. W. R. Hiatt, R. K. Rogers, and E. P. Brass, “The treadmill is a betterfunctional test than the 6-minute walk test in therapeutic trials ofpatients with peripheral artery disease,” Circulation 130(1), 69–78(2014).
12. I. B. Wilkinson and D. J. Webb, “Venous occlusion plethysmography incardiovascular research: methodology and clinical applications,” Br. J.Clin. Pharmacol. 52, 631–646 (2001).
13. M. Kooijman et al., “Leg blood flow measurements using venous occlu-sion plethysmography during head-up tilt,” Clin. Auton. Res. 17(2),106–111 (2007).
14. M. J. Joyner, N. M. Dietz, and J. T. Shepherd, “From Belfast to Mayoand beyond the use and future of plethysmography to study blood flowin human limbs,” J. Appl. Physiol. 91, 2431–2441 (2001).
15. R. Joannides, J. Bellien, and C. Thuillez, “Clinical methods for theevaluation of endothelial function—a focus on resistance arteries,”Fundam. Clin. Pharmacol. 20(3), 311–320 (2006).
16. B. A. Parker et al., “Age and microvascular responses to knee extensorexercise in women,” Eur. J. Appl. Physiol. 103(3), 343–351 (2008).
17. D. Walter Wray et al., “Endothelin-1-mediated vasoconstriction at restand during dynamic exercise in healthy humans,” Am. J. Physiol.293(4), H2550–H2556 (2007).
18. C. M. Sehgal et al., “Quantitative vascularity of breast masses byDoppler imaging: regional variations and diagnostic implications,” J.Ultrasound Med. 19(7), 427–440 (2000).
19. P. Schmitt et al., “Quantitative tissue perfusion measurements in headand neck carcinoma patients before and during radiation therapy with anon-invasive MR imaging spin-labeling technique,” Radiother. Oncol.67(1), 27–34 (2003).
20. J. A. Detre et al., “Applications of arterial spin labeled MRI in thebrain,” J. Magn. Reson. Imaging 35(5), 1026–1037 (2012).
21. R. L. Wolf and J. A. Detre, “Clinical neuroimaging using arterial spin-labeled perfusion magnetic resonance imaging,” Neurotherapeutics4(3), 346–359 (2007).
22. C. J. Price, “A review and synthesis of the first 20 years of PET andfMRI studies of heard speech, spoken language and reading,”NeuroImage 62(2), 816–847 (2012).
23. A. Drzezga et al., “First clinical experience with integrated whole-bodyPET/MR: comparison to PET/CT in patients with oncologic diagnoses,”J. Nucl. Med. 53(6), 845–855 (2012).
24. B. J. Pichler et al., “PET/MRI: paving the way for the next generation ofclinical multimodality imaging applications,” J. Nucl. Med. 51(3), 333–336 (2010).
25. W. Lin et al., “Quantitative measurements of cerebral blood flow inpatients with unilateral carotid artery occlusion: a PET and MRstudy,” J. Magn. Reson. Imaging 14(6), 659–667 (2001).
26. A. Edwards et al., “Measurement of hemoglobin flow and blood flow byNIRS,” J. Appl. Physiol. 75(4), 1884–1889 (1993).
Journal of Biomedical Optics 125005-12 December 2015 • Vol. 20(12)
Li et al.: Calibration of diffuse correlation spectroscopy blood flow index. . .
27. F. Harel et al., “Near-infrared spectroscopy to monitor peripheral bloodflow perfusion,” J. Clin. Monit. Comput. 22(1), 37–43 (2008).
28. M. C. P. V. Beekvelt et al., “Performance of near-infrared spectroscopyin measuring local O2 consumption and blood flow in skeletal muscle,”J. Appl. Physiol. 90, 511–519 (2001).
29. R. A. De Blasi et al., “Noninvasive measurement of forearm blood flowand oxygen consumption by near-infrared spectroscopy,” J. Appl.Physiol. 76, 1388–1393 (1994).
30. R. A. D. Blasi et al., “Comparison of two methods of measuring forearmoxygen consumption (VO2) by near infrared spectroscopy,” J. Biomed.Opt. 2(2), 171–175 (1997).
31. M. C. P. V. Beekvelt et al., “Validation of measurement protocols toassess oxygen consumption and blood flow in the human forearm bynear infrared spectroscopy,” Proc. SPIE 3194, 133–144 (1998).
32. S. Homma et al., “Near-infrared estimation of O2 supply and consump-tion in forearm muscles working at varying intensity,” J. Appl. Physiol.80(4), 1279–1284 (1996).
33. C. Casavola et al., “Blood flow and oxygen consumption with near-infrared spectroscopy and venous occlusion: spatial maps and the effectof time and pressure of inflation,” J. Biomed. Opt. 5(3), 269–276 (2000).
34. M. C. P. V. Beekvelt et al., “Adipose tissue thickness affects in vivoquantitative near-IR spectroscopy in human skeletal muscle,” Clin.Sci. 101, 21–28 (2001).
35. K. Gurley, Y. Shang, and G. Yu, “Noninvasive optical quantification ofabsolute blood flow, blood oxygenation, and oxygen consumption ratein exercising skeletal muscle,” J. Biomed. Opt. 17(7), 075010 (2012).
36. T. Durduran et al., “Diffuse optics for tissue monitoring and tomogra-phy,” Rep. Prog. Phys. 73(7), 076701 (2010).
37. T. Durduran and A. G. Yodh, “Diffuse correlation spectroscopy for non-invasive, micro-vascular cerebral blood flow measurement,”NeuroImage 85, 51–63 (2014).
38. E. M. Buckley et al., “Diffuse correlation spectroscopy for measurementof cerebral blood flow: future prospects,” Neurophotonics 1(1), 011009(2014).
39. D. Boas, L. Campbell, and A. Yodh, “Scattering and imaging with dif-fusing temporal field correlations,” Phys. Rev. Lett. 75(9), 1855–1858(1995).
40. D. A. Boas and A. G. Yodh, “Spatially varying dynamical properties ofturbid media probed with diffusing temporal light correlation,” J. Opt.Soc. Am. A 14(1), 192–215 (1997).
41. Y. Shang, K. Gurley, and G. Yu, “Diffuse correlation spectroscopy(DCS) for assessment of tissue blood flow in skeletal muscle: recentprogress,” Anat. Physiol. 3(2), 128 (2013).
42. M. Ninck, M. Untenberger, and T. Gisler, “Diffusing-wave spectroscopywith dynamic contrast variation: disentangling the effects of blood flowand extravascular tissue shearing on signals from deep tissue,” Biomed.Opt. Express 1(5), 1502–1513 (2010).
43. T. Binzoni and F. Martelli, “Assessing the reliability of diffuse correla-tion spectroscopy models on noise-free analytical Monte Carlo data,”Appl. Opt. 54(17), 5320–5326 (2015).
44. R. S. Chandran et al., “Detection and estimation of liquid flow through apipe in a tissue-like object with ultrasound-assisted diffuse correlationspectroscopy,” J. Opt. Soc. Am. A 32(10), 1888–1897 (2015).
45. M. Tivnan et al., “High frequency sampling of TTL pulses on aRaspberry Pi for diffuse correlation spectroscopy applications,”Sensors 15(8), 19709–19722 (2015).
46. M. Diop et al., “Calibration of diffuse correlation spectroscopy with atime-resolved near-infrared technique to yield absolute cerebral bloodflow measurements,” Biomed. Opt. Express 2(7), 2068–2082 (2011).
47. T. Durduran et al., “Diffuse optical measurement of blood flow, bloodoxygenation, and metabolism in a human brain during sensorimotor cor-tex activation,” Opt. Lett. 29(15), 1766–1768 (2004).
48. E. M. Buckley et al., “Cerebral hemodynamics in preterm infants duringpositional intervention measured with diffuse correlation spectroscopyand transcranial Doppler ultrasound,” Opt. Express 17(15), 12571–12581 (2009).
49. S. A. Carp et al., “Validation of diffuse correlation spectroscopy mea-surements of rodent cerebral blood flow with simultaneous arterial spinlabeling MRI; towards MRI-optical continuous cerebral metabolic mon-itoring,” Biomed. Opt. Express 1(2), 553–565 (2010).
50. E. M. Buckley et al., “Validation of diffuse correlation spectroscopicmeasurement of cerebral blood flow using phase-encoded velocity
mapping magnetic resonance imaging,” J. Biomed. Opt. 17(3),037007 (2012).
51. C. Zhou et al., “Diffuse optical monitoring of hemodynamic changes inpiglet brain with closed head injury,” J. Biomed. Opt. 14(3), 034015(2009).
52. V. Jain et al., “Cerebral oxygen metabolism in neonates with congenitalheart disease quantified by MRI and optics,” J. Cereb. Blood FlowMetab. 34(3), 380–388 (2014).
53. D. Pine et al., “Diffusing wave spectroscopy,” Phys. Rev. Lett. 60(12),1134–1137 (1988).
54. M. Stephen, “Temporal fluctuations in wave propagation in randommedia,” Phys. Rev. B 37(1), 1–5 (1988).
55. D. T. Delpy et al., “Estimation of optical pathlength through tissue fromdirect time of flight measurement,” Phys. Med. Biol. 33(12), 1433–1442(1988).
56. S. R. Arridge, M. Cope, and D. T. Delpy, “The theoretical basis for thedetermination of optical pathlengths in tissue: temporal and frequencyanalysis,” Phys. Med. Biol. 37(7), 1531 (1992).
57. D. Milej et al., “Time-resolved detection of fluorescent light duringinflow of ICG to the brain—a methodological study,” Phys. Med.Biol. 57(20), 6725–6742 (2012).
58. V. Ntziachristos et al., “MRI-guided diffuse optical spectroscopy ofmalignant and benign breast lesions,” Neoplasia 4, 347–354 (2002).
59. D. Roblyer et al., “Feasibility of direct digital sampling for diffuse opti-cal frequency domain spectroscopy in tissue,” Meas. Sci. Technol.24(4), 045501 (2013).
60. M. Kim, “Application of hybrid diffuse optics for clinical managementof adults after brain injury,” PhD Thesis, University of Pennsylvania,Philadelphia (2013).
61. M. S. Patterson et al., “Absorption spectroscopy in tissue-simulatingmaterials: a theoretical and experimental study of photon paths,”Appl. Opt. 34(1), 22–30 (1995).
62. D. M. Hueber et al., “Non-invasive and quantitative near-infrared hae-moglobin spectrometry in the piglet brain during hypoxic stress, using afrequency-domain multidistance instrument,” Phys. Med. Biol. 46(1),41–62 (2001).
63. D. J. Wallace et al., “Results of a 95-subject human clinical trial for thediagnosis of peripheral vascular disease using a near-infrared frequencydomain hemoglobin spectrometer,” Proc. SPIE 3597, 300–316 (1999).
64. S. Fantini et al., “Non-invasive optical monitoring of the newborn pigletbrain using continuous-wave and frequency-domain spectroscopy,”Phys. Med. Biol. 44(6), 1543–1563 (1999).
65. E. K. Englund et al., “Combined measurement of perfusion, venousoxygen saturation, and skeletal muscle T2* during reactive hyperemiain the leg,” J. Cardiovasc. Magn. Reson. 15, 70 (2013).
66. E. K. Englund et al., “Multiparametric assessment of vascular functionin peripheral artery disease: dynamic measurement of skeletal muscleperfusion, blood-oxygen-level dependent signal, and venous oxygensaturation,” Circ. Cardiovasc. Imaging 8(4) (2015).
67. D. Altman and J. Bland, “Measurement in medicine: the analysis ofmethod comparison studies,” Statistician 32, 307–317 (1983).
68. D. Altman and J. Bland, “Statistical methods for assessing agreementbetween two methods of clinical measurement,” Lancet 327(8476),307–310 (1986).
69. S. L. Jacques, “Optical properties of biological tissues: a review,” Phys.Med. Biol. 58(11), R37–61 (2013).
70. J. R. Taylor, An Introduction to Error Analysis, 2nd ed., UniversityScience Books, Sausalito, California (1997).
71. D. Irwin et al., “Influences of tissue absorption and scattering on diffusecorrelation spectroscopy blood flow measurements,” Biomed. Opt.Express 2(7), 1969–1985 (2011).
72. A. Kienle and T. Glanzmann, “In vivo determination of the optical prop-erties of muscle with time-resolved reflectance using a layered model,”Phys. Med. Biol. 44(11), 2689–2702 (1999).
73. W. B. Baker et al., “Pressure modulation algorithm to separate cerebralhemodynamic signals from extracerebral artifacts,” Neurophoton 2(3),035004 (2015).
74. G. Yu et al., “Time-dependent blood flow and oxygenation in humanskeletal muscles measured with noninvasive near-infrared diffuse opti-cal spectroscopies,” J. Biomed. Opt. 10(2), 024027 (2005).
75. W. C. Wu et al., “Skeletal muscle microvascular flow in progressiveperipheral artery disease: assessment with continuous arterial spin-labeling
Journal of Biomedical Optics 125005-13 December 2015 • Vol. 20(12)
Li et al.: Calibration of diffuse correlation spectroscopy blood flow index. . .
perfusion magnetic resonance imaging,” J. Am. Coll. Cardiol. 53(25),2372–2377 (2009).
76. Y. Shang et al., “Effects of muscle fiber motion on diffuse correlationspectroscopy blood flow measurements during exercise,” Biomed. Opt.Express 1(2), 500–511 (2010).
77. K. J. Stewart et al., “Exercise training for claudication,” N. Engl. J. Med.347(24), 1941–1951 (2002).
78. E. R. Mohler, III and H. Litt, Atlas of Vascular Medicine: A Case-BasedApproach to Current Management, Demos Medical, New York (2011).
79. W. R. Hiatt, “Medical treatment of peripheral arterial disease and clau-dication,” N. Engl. J. Med. 344(21), 1608–1621 (2001).
Zhe Li is a doctoral student in biomedical engineering in the School ofPrecision Instrument and Opto-Electronics Engineering, TianjinUniversity. She was a visiting scholar in physics and astronomy atthe University of Pennsylvania from September 2013 to September2015. Her research interests include utilizing diffuse optics techniquesto measure hemodynamics in skeletal muscles.
Wesley B. Baker is a postdoctoral researcher in physics andastronomy at the University of Pennsylvania. He graduated with aPhD in physics at the University of Pennsylvania in May 2015. Hisresearch interests include cerebral blood flow and oxygenmetabolismmonitoring with optical spectroscopy/imaging techniques.
Ashwin B. Parthasarathy is a postdoctoral researcher in physics andastronomy at the University of Pennsylvania. He graduated with aPhD in biomedical engineering from the University of Texas atAustin in 2010 and was subsequently a postdoctoral researcher atBoston University before moving to Penn in 2012. His researchfocuses on the imaging and monitoring of cerebral blood flow duringand after stroke, with laser speckle contrast imaging and diffuse cor-relation spectroscopy, respectively.
Tiffany S. Ko is an HHMI Interfaces in Imaging doctoral student in theDepartment of Bioengineering at the University of Pennsylvania. Shecompleted her undergraduate training in electrical engineering atPrinceton University in 2009 and received her master’s in bioengin-eering at the University of California, Berkeley, in 2012. Currently, she
works jointly with the Yodh Biomedical Optics Group and LichtNeurovascular Imaging Group at the Children’s Hospital ofPhiladelphia.
DetianWang is an assistant professor at the Institute of Fluid Physicsin China. He received his master’s in optics from the Institute of FluidPhysics in 2008. He was a visiting scholar in physics and astronomyat the University of Pennsylvania from July 2013 to September 2015.His research interests include biology tissue monitoring with diffuselight and optoelectronic measurement.
Steven Schenkel is a research coordinator in the Yodh lab at theUniversity of Pennsylvania. He completed his undergraduate trainingin experimental physics at the University of Pennsylvania in 2010 andassists in organizing and conducting research studies to investigatecerebral hemodynamics in multiple patient populations.
Turgut Durduran was trained at the University of Pennsylvania. In2009, he moved to ICFO–The Institute of Photonic Sciences,Spain, where he leads the medical optics group. His research inter-ests revolve around the use of diffuse light to noninvasively probe tis-sue function. The group develops new technologies and algorithmsand routinely translates them to preclinical, clinical, and industrialapplications.
Gang Li is a professor at the School of Precision Instrument andOpto-Electronics Engineering, Tianjin University. His major researchinterests include biomedical information detection, diffuse reflectancespectroscopy applied in tongue diagnosis, and noninvasive bloodcomponents analysis with dynamic spectrum.
Arjun G. Yodh is the James M. Skinner professor of science and thedirector of the Laboratory for Research on the Structure of Matter atthe University of Pennsylvania. His current interests span fundamen-tal and applied questions in condensed matter physics, medical andbiophysics, and optical sciences. He has extensive experience utiliz-ing diffuse optics techniques for monitoring and imaging of hemo-dynamics in living tissues.
Journal of Biomedical Optics 125005-14 December 2015 • Vol. 20(12)
Li et al.: Calibration of diffuse correlation spectroscopy blood flow index. . .