Calibration of diffuse correlation spectroscopy with a time-resolved near-infrared technique to yield absolute cerebral blood flow measurements
Mamadou Diop,1,2,*
Kyle Verdecchia,1,2
Ting-Yim Lee,1,2,3
and Keith St Lawrence1,2
1Imaging Program, Lawson Health Research Institute, London, Ontario N6A 4V2, Canada
2Department of Medical Biophysics, University of Western Ontario, London, Ontario N6A 3K7, Canada 3Imaging Research Laboratories, Robarts Research Institute, London, Ontario N6G 2V4, Canada
Abstract: A primary focus of neurointensive care is the prevention of secondary brain injury, mainly caused by ischemia. A noninvasive bedside technique for continuous monitoring of cerebral blood flow (CBF) could improve patient management by detecting ischemia before brain injury occurs. A promising technique for this purpose is diffuse correlation spectroscopy (DCS) since it can continuously monitor relative perfusion changes in deep tissue. In this study, DCS was combined with a time-resolved near-infrared technique (TR-NIR) that can directly measure CBF using indocyanine green as a flow tracer. With this combination, the TR-NIR technique can be used to convert DCS data into absolute CBF measurements. The agreement between the two techniques was assessed by concurrent measurements of CBF changes in piglets. A strong correlation between CBF changes measured by TR-NIR and changes in the scaled diffusion coefficient measured by DCS was observed (R
2 = 0.93) with a
slope of 1.05 ± 0.06 and an intercept of 6.4 ± 4.3% (mean ± standard error).
OCIS codes: (170.1470) Blood or tissue constituent monitoring; (170.3660) Light propagation in tissues; (170.3890) Medical optics instrumentation
References and links
1. D. A. Boas, L. E. Campbell, and A. G. Yodh, ―Scattering and Imaging with Diffusing Temporal Field Correlations,‖ Phys. Rev. Lett. 75(9), 1855–1858 (1995).
2. D. A. Boas and A. G. Yodh, ―Spatially varying dynamical properties of turbid media probed with diffusing temporal light correlation,‖ J. Opt. Soc. Am. A 14(1), 192–215 (1997).
3. G. Dietsche, M. Ninck, C. Ortolf, J. Li, F. Jaillon, and T. Gisler, ―Fiber-based multispeckle detection for time-resolved diffusing-wave spectroscopy: characterization and application to blood flow detection in deep tissue,‖ Appl. Opt. 46(35), 8506–8514 (2007).
4. J. Li, G. Dietsche, D. Iftime, S. E. Skipetrov, G. Maret, T. Elbert, B. Rockstroh, and T. Gisler, ―Noninvasive detection of functional brain activity with near-infrared diffusing-wave spectroscopy,‖ J. Biomed. Opt. 10(4), 044002 (2005).
5. J. Li, F. Jaillon, G. Dietsche, G. Maret, and T. Gisler, ―Pulsation-resolved deep tissue dynamics measured with diffusing-wave spectroscopy,‖ Opt. Express 14(17), 7841–7851 (2006).
6. J. Li, M. Ninck, L. Koban, T. Elbert, J. Kissler, and T. Gisler, ―Transient functional blood flow change in the human brain measured noninvasively by diffusing-wave spectroscopy,‖ Opt. Lett. 33(19), 2233–2235 (2008).
7. F. Jaillon, J. Li, G. Dietsche, T. Elbert, and T. Gisler, ―Activity of the human visual cortex measured non-invasively by diffusing-wave spectroscopy,‖ Opt. Express 15(11), 6643–6650 (2007).
8. M. Ninck, M. Untenberger, and T. Gisler, ―Diffusing-wave spectroscopy with dynamic contrast variation: disentangling the effects of blood flow and extravascular tissue shearing on signals from deep tissue,‖ Biomed. Opt. Express 1(5), 1502–1513 (2010).
9. M. Belau, M. Ninck, G. Hering, L. Spinelli, D. Contini, A. Torricelli, and T. Gisler, ―Noninvasive observation of skeletal muscle contraction using near-infrared time-resolved reflectance and diffusing-wave spectroscopy,‖ J. Biomed. Opt. 15(5), 057007 (2010).
10. F. Jaillon, S. E. Skipetrov, J. Li, G. Dietsche, G. Maret, and T. Gisler, ―Diffusing-wave spectroscopy from head-like tissue phantoms: influence of a non-scattering layer,‖ Opt. Express 14(22), 10181–10194 (2006).
11. E. M. Buckley, N. M. Cook, T. Durduran, M. N. Kim, C. Zhou, R. Choe, G. Yu, S. Schultz, C. M. Sehgal, D. J. Licht, P. H. Arger, M. E. Putt, H. H. Hurt, and A. G. Yodh, ―Cerebral hemodynamics in preterm infants during
#146337 - $15.00 USD Received 19 May 2011; revised 23 Jun 2011; accepted 25 Jun 2011; published 28 Jun 2011(C) 2011 OSA 1 July 2011 / Vol. 2, No. 7 / BIOMEDICAL OPTICS EXPRESS 2068
positional intervention measured with diffuse correlation spectroscopy and transcranial Doppler ultrasound,‖ Opt. Express 17(15), 12571–12581 (2009).
12. C. Cheung, J. P. Culver, K. Takahashi, J. H. Greenberg, and A. G. Yodh, ―In vivo cerebrovascular measurement combining diffuse near-infrared absorption and correlation spectroscopies,‖ Phys. Med. Biol. 46(8), 2053–2065 (2001).
13. G. Yu, T. Durduran, G. Lech, C. Zhou, B. Chance, E. R. Mohler 3rd, and A. G. Yodh, ―Time-dependent blood flow and oxygenation in human skeletal muscles measured with noninvasive near-infrared diffuse optical spectroscopies,‖ J. Biomed. Opt. 10(2), 024027 (2005).
14. G. Yu, T. F. Floyd, T. Durduran, C. Zhou, J. Wang, J. A. Detre, and A. G. Yodh, ―Validation of diffuse correlation spectroscopy for muscle blood flow with concurrent arterial spin labeled perfusion MRI,‖ Opt. Express 15(3), 1064–1075 (2007).
15. C. Zhou, ―In-vivo optical imaging and spectroscopy of cerebral hemodynamics,‖ Ph.D. thesis (University of Pennsylvania, 2007).
16. C. Zhou, R. Choe, N. Shah, T. Durduran, G. Yu, A. Durkin, D. Hsiang, R. Mehta, J. Butler, A. Cerussi, B. J. Tromberg, and A. G. Yodh, ―Diffuse optical monitoring of blood flow and oxygenation in human breast cancer during early stages of neoadjuvant chemotherapy,‖ J. Biomed. Opt. 12(5), 051903 (2007).
17. C. Zhou, S. A. Eucker, T. Durduran, G. Yu, J. Ralston, S. H. Friess, R. N. Ichord, S. S. Margulies, and A. G. Yodh, ―Diffuse optical monitoring of hemodynamic changes in piglet brain with closed head injury,‖ J. Biomed. Opt. 14(3), 034015 (2009).
18. S. A. Carp, G. P. Dai, D. A. Boas, M. A. Franceschini, and Y. R. Kim, ―Validation of diffuse correlation spectroscopy measurements of rodent cerebral blood flow with simultaneous arterial spin labeling MRI; towards MRI-optical continuous cerebral metabolic monitoring,‖ Biomed. Opt. Express 1(2), 553–565 (2010).
19. J. P. Culver, T. Durduran, D. Furuya, C. Cheung, J. H. Greenberg, and A. G. Yodh, ―Diffuse optical tomography of cerebral blood flow, oxygenation, and metabolism in rat during focal ischemia,‖ J. Cereb. Blood Flow Metab. 23(8), 911–924 (2003).
20. T. Durduran, ―Non-invasive measurements of tissue hemodynamics with hybrid diffuse optical methods,‖ Ph.D. thesis (University of Pennsylvania, 2004).
21. T. Durduran, M. G. Burnett, G. Yu, C. Zhou, D. Furuya, A. G. Yodh, J. A. Detre, and J. H. Greenberg, ―Spatiotemporal quantification of cerebral blood flow during functional activation in rat somatosensory cortex using laser-speckle flowmetry,‖ J. Cereb. Blood Flow Metab. 24(5), 518–525 (2004).
22. T. Durduran, R. Choe, G. Yu, C. Zhou, J. C. Tchou, B. J. Czerniecki, and A. G. Yodh, ―Diffuse optical measurement of blood flow in breast tumors,‖ Opt. Lett. 30(21), 2915–2917 (2005).
23. T. Durduran, G. Yu, M. G. Burnett, J. A. Detre, J. H. Greenberg, J. Wang, C. Zhou, and A. G. Yodh, ―Diffuse optical measurement of blood flow, blood oxygenation, and metabolism in a human brain during sensorimotor cortex activation,‖ Opt. Lett. 29(15), 1766–1768 (2004).
24. T. Durduran, C. Zhou, E. M. Buckley, M. N. Kim, G. Yu, R. Choe, J. W. Gaynor, T. L. Spray, S. M. Durning, S. E. Mason, L. M. Montenegro, S. C. Nicolson, R. A. Zimmerman, M. E. Putt, J. Wang, J. H. Greenberg, J. A. Detre, A. G. Yodh, and D. J. Licht, ―Optical measurement of cerebral hemodynamics and oxygen metabolism in neonates with congenital heart defects,‖ J. Biomed. Opt. 15(3), 037004 (2010).
25. T. Durduran, C. Zhou, B. L. Edlow, G. Yu, R. Choe, M. N. Kim, B. L. Cucchiara, M. E. Putt, Q. Shah, S. E. Kasner, J. H. Greenberg, A. G. Yodh, and J. A. Detre, ―Transcranial optical monitoring of cerebrovascular hemodynamics in acute stroke patients,‖ Opt. Express 17(5), 3884–3902 (2009).
26. L. Gagnon, M. Desjardins, J. Jehanne-Lacasse, L. Bherer, and F. Lesage, ―Investigation of diffuse correlation spectroscopy in multi-layered media including the human head,‖ Opt. Express 16(20), 15514–15530 (2008).
27. C. Zhou, T. Shimazu, T. Durduran, J. Luckl, D. Y. Kimberg, G. Yu, X. H. Chen, J. A. Detre, A. G. Yodh, and J. H. Greenberg, ―Acute functional recovery of cerebral blood flow after forebrain ischemia in rat,‖ J. Cereb. Blood Flow Metab. 28(7), 1275–1284 (2008).
28. C. Zhou, G. Yu, D. Furuya, J. Greenberg, A. Yodh, and T. Durduran, ―Diffuse optical correlation tomography of cerebral blood flow during cortical spreading depression in rat brain,‖ Opt. Express 14(3), 1125–1144 (2006).
29. P. Zirak, R. Delgado-Mederos, J. Martí-Fàbregas, and T. Durduran, ―Effects of acetazolamide on the micro- and macro-vascular cerebral hemodynamics: a diffuse optical and transcranial doppler ultrasound study,‖ Biomed. Opt. Express 1(5), 1443–1459 (2010).
30. R. C. Mesquita, N. Skuli, M. N. Kim, J. Liang, S. Schenkel, A. J. Majmundar, M. C. Simon, and A. G. Yodh, ―Hemodynamic and metabolic diffuse optical monitoring in a mouse model of hindlimb ischemia,‖ Biomed. Opt. Express 1(4), 1173–1187 (2010).
31. T. L. Becker, A. D. Paquette, K. R. Keymel, B. W. Henderson, and U. Sunar, ―Monitoring blood flow responses during topical ALA-PDT,‖ Biomed. Opt. Express 2(1), 123–130 (2011).
32. M. A. De Georgia and A. Deogaonkar, ―Multimodal monitoring in the neurological intensive care unit,‖ Neurologist 11(1), 45–54 (2005).
33. CDC, ―Traumatic brain injury in the United States: Assessing outcomes in children,‖ (2000) accessed July 28, 2009, http://www.cdc.gov/ncipc/tbi/tbi_report/09_Appendix_B.htm.
34. A. Helmy, M. Vizcaychipi, and A. K. Gupta, ―Traumatic brain injury: intensive care management,‖ Br. J. Anaesth. 99(1), 32–42 (2007).
35. D. W. Brown, P. A. Picot, J. G. Naeini, R. Springett, D. T. Delpy, and T.-Y. Lee, ―Quantitative near infrared spectroscopy measurement of cerebral hemodynamics in newborn piglets,‖ Pediatr. Res. 51(5), 564–570 (2002).
36. M. Diop, J. T. Elliott, K. M. Tichauer, T.-Y. Lee, and K. St Lawrence, ―A broadband continuous-wave multichannel near-infrared system for measuring regional cerebral blood flow and oxygen consumption in newborn piglets,‖ Rev. Sci. Instrum. 80(5), 054302 (2009).
#146337 - $15.00 USD Received 19 May 2011; revised 23 Jun 2011; accepted 25 Jun 2011; published 28 Jun 2011(C) 2011 OSA 1 July 2011 / Vol. 2, No. 7 / BIOMEDICAL OPTICS EXPRESS 2069
37. J. T. Elliott, M. Diop, K. M. Tichauer, T.-Y. Lee, and K. St Lawrence, ―Quantitative measurement of cerebral blood flow in a juvenile porcine model by depth-resolved near-infrared spectroscopy,‖ J. Biomed. Opt. 15(3), 037014 (2010).
38. M. Diop, K. M. Tichauer, J. T. Elliott, M. Migueis, T.-Y. Lee, and K. St Lawrence, ―Comparison of time-resolved and continuous-wave near-infrared techniques for measuring cerebral blood flow in piglets,‖ J. Biomed. Opt. 15(5), 057004 (2010).
39. M. Diop, K. M. Tichauer, J. T. Elliott, M. Migueis, T.-Y. Lee, and K. St Lawrence, ―Time-resolved near-infrared technique for bedside monitoring of absolute cerebral blood flow,‖ Proc. SPIE 7555, 75550Z (2010).
40. A. Liebert, H. Wabnitz, J. Steinbrink, H. Obrig, M. Möller, R. Macdonald, A. Villringer, and H. Rinneberg, ―Time-resolved multidistance near-infrared spectroscopy of the adult head: intracerebral and extracerebral absorption changes from moments of distribution of times of flight of photons,‖ Appl. Opt. 43(15), 3037–3047 (2004).
41. L. Gagnon, C. Gauthier, R. D. Hoge, F. Lesage, J. Selb, and D. A. Boas, ―Double-layer estimation of intra- and extracerebral hemoglobin concentration with a time-resolved system,‖ J. Biomed. Opt. 13(5), 054019 (2008).
42. A. Kienle and M. S. Patterson, ―Improved solutions of the steady-state and the time-resolved diffusion equations for reflectance from a semi-infinite turbid medium,‖ J. Opt. Soc. Am. A 14(1), 246–254 (1997).
43. T.-Y. Lee, ―Functional CT: physiological models,‖ Trends Biotechnol. 20(8), S3–S10 (2002). 44. A. Cenic, D. G. Nabavi, R. A. Craen, A. W. Gelb, and T.-Y. Lee, ―Dynamic CT measurement of cerebral blood
flow: a validation study,‖ AJNR Am. J. Neuroradiol. 20(1), 63–73 (1999). 45. A. Liebert, H. Wabnitz, D. Grosenick, and R. Macdonald, ―Fiber dispersion in time domain measurements
compromising the accuracy of determination of optical properties of strongly scattering media,‖ J. Biomed. Opt. 8(3), 512–516 (2003).
46. S. Prahl, ―Optical Absorption of Indocyanine Green (ICG),‖ http://omlc.ogi.edu/spectra/icg/index.html. 47. T. Durduran, R. Choe, W. B. Baker, and A. G. Yodh, ―Diffuse optics for tissue monitoring and tomography,‖
Rep. Prog. Phys. 73(7), 076701 (2010). 48. T. Gisler, H. Rüger, S. U. Egelhaaf, J. Tschumi, P. Schurtenberger, and J. Rička, ―Mode-selective dynamic light
scattering: theory versus experimental realization,‖ Appl. Opt. 34(18), 3546–3553 (1995). 49. T. Durduran, C. Zhou, E. M. Buckley, M. N. Kim, G. Yu, R. Choe, J. W. Gaynor, T. L. Spray, S. M. Durning, S.
E. Mason, L. M. Montenegro, S. C. Nicolson, R. A. Zimmerman, M. E. Putt, J. Wang, J. H. Greenberg, J. A. Detre, A. G. Yodh, and D. J. Licht, ―Optical measurement of cerebral hemodynamics and oxygen metabolism in neonates with congenital heart defects,‖ J. Biomed. Opt. 15(3), 037004 (2010).
50. N. Roche-Labarbe, S. A. Carp, A. Surova, M. Patel, D. A. Boas, P. E. Grant, and M. A. Franceschini, ―Noninvasive optical measures of CBV, StO(2), CBF index, and rCMRO(2) in human premature neonates’ brains in the first six weeks of life,‖ Hum. Brain Mapp. 31(3), 341–352 (2010).
51. M. N. Kim, T. Durduran, S. Frangos, B. L. Edlow, E. M. Buckley, H. E. Moss, C. Zhou, G. Yu, R. Choe, E. Maloney-Wilensky, R. L. Wolf, M. S. Grady, J. H. Greenberg, J. M. Levine, A. G. Yodh, J. A. Detre, and W. A. Kofke, ―Noninvasive measurement of cerebral blood flow and blood oxygenation using near-infrared and diffuse correlation spectroscopies in critically brain-injured adults,‖ Neurocrit. Care 12(2), 173–180 (2010).
52. I. G. Roberts, P. Fallon, F. J. Kirkham, P. M. Kirshbom, C. E. Cooper, M. J. Elliott, and A. D. Edwards, ―Measurement of cerebral blood flow during cardiopulmonary bypass with near-infrared spectroscopy,‖ J. Thorac. Cardiovasc. Surg. 115(1), 94–102 (1998).
53. F. Gora, S. Shinde, C. E. Elwell, J. C. Goldstone, M. Cope, D. T. Delpy, and M. Smith, ―Noninvasive measurement of cerebral blood flow in adults using near-infrared spectroscopy and indocyanine green: a pilot study,‖ J. Neurosurg. Anesthesiol. 14(3), 218–222 (2002).
54. R. L. Grubb, Jr., M. E. Raichle, J. O. Eichling, and M. M. Ter-Pogossian, ―The effects of changes in PaCO2 on cerebral blood volume, blood flow, and vascular mean transit time,‖ Stroke 5(5), 630–639 (1974).
55. B. D. Murphy, A. J. Fox, D. H. Lee, D. J. Sahlas, S. E. Black, M. J. Hogan, S. B. Coutts, A. M. Demchuk, M. Goyal, R. I. Aviv, S. Symons, I. B. Gulka, V. Beletsky, D. Pelz, V. Hachinski, R. Chan, and T.-Y. Lee, ―Identification of penumbra and infarct in acute ischemic stroke using computed tomography perfusion-derived blood flow and blood volume measurements,‖ Stroke 37(7), 1771–1777 (2006).
1. Introduction
Diffuse correlation spectroscopy (DCS) [1,2]—also known as diffuse wave spectroscopy [3–10]—is emerging as a reliable noninvasive technique for continuous monitoring of perfusion changes in deep tissue [11–31]. The continuous measurement capability of DCS could be beneficial in areas such as neurointensive care to assist with the management of patients recovering from brain-injury [32]. In these patients, multiple factors including systemic hypotension, increased intracranial pressure, impaired autoregulation and spontaneous vessel constriction can cause cerebral ischemia [33,34]. Since the brain is extremely vulnerable to ischemic injury due to its high energy demands and limited substrate storage, continuous monitoring of cerebral blood flow (CBF) could improve outcome by providing the ability to detect ischemia before permanent tissue damage occurs. However, the capability of DCS to determine if CBF has fallen to ischemic levels is hampered by the current inability to interpret DCS measurements in terms of absolute blood flow.
#146337 - $15.00 USD Received 19 May 2011; revised 23 Jun 2011; accepted 25 Jun 2011; published 28 Jun 2011(C) 2011 OSA 1 July 2011 / Vol. 2, No. 7 / BIOMEDICAL OPTICS EXPRESS 2070
Our group has developed a dynamic contrast-enhanced near-infrared (NIR) technique for measuring absolute CBF using a light-absorbing dye, indocyanine green (ICG), as an intravascular contrast agent [35]. The accuracy of the technique has been demonstrated in multiple studies by comparison to CBF measurements acquired with perfusion computed tomography [35–37]. Initially developed for second-derivative NIR spectroscopy, it has also been extended to time-resolved (TR) NIR technology [38,39], which provides better depth sensitivity [40]. Although quantitative, a limitation with this technique is the need to inject a bolus of ICG every time CBF is measured. Since the clearance of ICG (mainly by liver) from the blood circulation takes 10-20 min, CBF measurements can only be obtained infrequently.
Considering that DCS and TR-NIR technologies are compatible, our goal was to combine the continuous monitoring ability of DCS with the quantitative, single time-point measurement capability of the dynamic contrast-enhanced technique in order to provide a method for continuous monitoring of absolute CBF. With this approach, quantitative CBF measurements obtained by the TR-NIR technique are used to convert DCS data into units of absolute blood flow. The effectiveness of this approach will depend upon the agreement between perfusion changes measured by the two techniques. To address this issue, concurrent DCS and TR-NIR measurements were acquired in newborn piglets in which CBF was altered by changing the arterial carbon dioxide tension (paCO2) and by occluding the carotid arteries. This animal model was chosen to minimize signal contamination from extracerebral tissues. The agreement between the two techniques was assessed by converting TR-NIR CBF measurements into relative blood flow changes, which were compared to corresponding perfusion changes measured by DCS.
2. Materials and methods
2.1. Instrumentation
A detailed description of the time-resolved instrument and its characterization can be found in Ref. [39]. In brief, the light source of the time-resolved instrument was a picosecond diode laser (LDH-P-C-810, PicoQuant, Germany) emitting at 802 nm, the peak absorption wavelength of ICG in plasma. The laser output power and the pulse repetition rate were set to 1.4 mW and 80 MHz, respectively. The laser beam was attenuated by two variable neutral density filters (NDC-50-4M, Thorlabs, Newton, NJ) and coupled into a 1.5-m long multimode fiber (core = 400 µm and N.A. = 0.22; Fiberoptics Technology, Pomfret, CT). Photons emerging from tissue were collected by a similar optical fiber whose distal end was secured in front of an electromechanical shutter (SM05, Thorlabs). Light transmitted through the shutter was collected by a Peltier-cooled photomultiplier tube (PMT) (PMC-100, Becker & Hickl, Germany). The shutter was kept closed to protect the PMT from exposure to intense light and was only open during TR measurements. The output of the PMT and the synchronization signal from the laser driver (PDL 828, PicoQuant) were sent to a time-correlated single photon counting module (SPC-134, Becker & Hickl) that computed the temporal point spread function (TPSF). The shape of the TPSF depends on the optical properties (i.e., the absorption
coefficient, µa, and the reduced scattering coefficient, µs) of the medium probed by the detected photons [41,42].
The light source of the DCS instrument was a continuous-wave laser (DL785-100-S, CrystaLaser, Reno, NV) emitting at 786 nm. The coherence length of the laser (> 5 m) was much longer than typical photon pathlengths and the maximum output power was 100 mW. The laser beam was attenuated with a variable neutral density filter (NDC-50-4M, Thorlabs) and coupled into an emission fiber similar to the one used in the time-resolved apparatus. Light emerging from the tissue was collected with a 4-m long single-mode fiber (SMF-28e + , N.A. = 0.14, core = 125 µm, single-mode cutoff wavelength at 1260 nm). Since the emission wavelength of the laser was much shorter than the single-mode cutoff wavelength of the detection fiber, the latter was expected to guide more than one propagating mode. The detection fiber was wrapped around into a 15-cm diameter cylinder to increase the losses in the higher-order modes and to convert them into non-propagating modes. Light collected by
#146337 - $15.00 USD Received 19 May 2011; revised 23 Jun 2011; accepted 25 Jun 2011; published 28 Jun 2011(C) 2011 OSA 1 July 2011 / Vol. 2, No. 7 / BIOMEDICAL OPTICS EXPRESS 2071
the detection fiber was detected by a single photon detector (id100-MMF 50, id Quantique, Geneva, Switzerland) for the first three animals and by a single photon counting module (SPCM-AQR-15-FC, PerkinElmer Canada Inc, QC, Canada) for the remaining of the study. The output of the detector was sent to a photon correlator board (DPC-230, Beker & Hickl, Germany) that computed the normalized intensity autocorrelation function. This function contained information about the dynamics of the scatterers (mainly red blood cells) in the region probed by the detected photons [12].
2.2. CBF measurement with the time-resolved NIR technique
2.2.1. Tracer-kinetics model
The hemodynamics of an organ can be quantified by tracking the passage of a contrast agent through the vascular bed – an approach that has been adapted to imaging modalities including magnetic resonance imaging (MRI) and computed tomography (CT). With this method, the time-dependent concentration of contrast agent in tissue, Q(t), is related to its concentration in arterial blood, Ca(t), by the following expression [43]:
( ) ( ) ( ),aQ t C t F R t (1)
where * is the convolution operator, F is blood flow and R(t) is the impulse residue function, which represents the fraction of contrast agent remaining in the tissue at time t. In our dynamic contrast-enhanced experiments, Q(t) was measured by the TR-NIR instrument and Ca(t) obtained noninvasively using a dye densitometer (DDG 2001, Nihon Kohden, Japan). The function F·R(t) was extracted from the tissue and arterial ICG concentration curves using a stable deconvolution algorithm [44]. The initial height of the function is CBF since by definition R(0) = 1, and the area under F·R(t) equals the cerebral blood volume (CBV) [35].
2.2.2. Measuring the time-dependent concentration of ICG in brain
The time-dependent tissue concentration of ICG was measured by continuously acquiring a series of TPSFs with a temporal resolution of 0.4 s, 10 s prior to and for 60 s after an intravenous bolus injection of ICG (0.5 ml, containing 0.05 mg of ICG per kg of animal
weight). Tissue optical properties (µa and µs) were obtained by fitting the measured TPSFs with the solution to the diffusion equation for semi-infinite homogeneous media using extrapolated-zero boundary conditions [42]. To account for the finite width of the laser pulse and its broadening by the fibers and the detection system, the instrument response function (IRF) of the apparatus was measured and convolved with the analytical solution [45]. A nonlinear optimization routine (MATLAB
® function fminsearch) was used to fit the model
convolved with the IRF to each measured TPSF. The fitting range was set to 80% of the peak value on the leading edge and 20% on the falling edge of the TPSFs. Determining the tissue
ICG concentration first required measuring the baseline optical properties, µa and µs, which were determined from TPSFs acquired over the 10 s period prior to ICG injection. The fitting procedure included an additional scaling factor to account for the laser power, detection gain and coupling efficiency. Changes in light absorption caused by ICG were characterized using
only µa as a fitting parameter, with µs and the scaling factor fixed to their baseline values. Finally, the measured changes in the absorption coefficient were used to calculate ICG concentration by:
( ) 0 ln(10) ,a a ICGQ t t (2)
where µa(0) represents the average baseline absorption coefficient determined prior to ICG injection and εICG is the extinction coefficient of ICG at 802 nm (186 OD/mM/cm [46]).
To compare with the DCS measurements, changes in CBF relative to normocapnia were determined by:
#146337 - $15.00 USD Received 19 May 2011; revised 23 Jun 2011; accepted 25 Jun 2011; published 28 Jun 2011(C) 2011 OSA 1 July 2011 / Vol. 2, No. 7 / BIOMEDICAL OPTICS EXPRESS 2072
100 ,cond normo
normo
CBF CBFCBF
CBF
(3)
where CBFcond is the average cerebral blood flow measured at either hypocapnia, hypercapnia or during carotid occlusion, and CBFnormo is the average CBF measured at normocapnia.
2.3. Diffuse correlation flowmetry
The dynamics of the scatterers in the region probed by the DCS instrument can be assessed by measuring the temporal dependence of the normalized intensity autocorrelation function:
2 2
( , ) ( , )( , ) ,
( , )
I t I tg
I t
(4)
which is related to the electric field autocorrelation function G1(ρ,τ) by the Siegert relation [15]:
2
1
2 2
( , )( , ) 1 .
( , )
Gg
I t
(5)
Here β is the coherence factor and ( , )I t represents the average detected intensity.
2.3.1. Diffusion approximation model
It has been shown that in highly scattering, low absorbing media, G1(ρ,τ) is solution to the diffusion equation for large interoptode distances (>3/µs') [2,47]. In this study, the DCS data were analyzed using the analytical solution to the diffusion equation for a semi-infinite homogeneous medium with extrapolated-zero boundary conditions [12]:
'
1 2
1
1 2
3 exp( ) exp( )( , ) .
4
s D Dk r k rG
r r
(6)
Here, 2 ' '2 2
03 6D s a s Bk k D (for Brownian dynamics), 2 2
1 0r z ,
2 2
2 0( 2 )br z z , ρ is the interoptode distance measured on the surface of the piglet's
head, zb is the distance above the surface of head at which the fluence vanishes, and z0 is the effective depth of the source [20]. Each acquired g2(ρ,τ) function was fit with the analytical model using µs' and µa measured with the TR-NIR system and the known interoptode distance. This procedure yielded estimates of β and the scaled diffusion coefficient (αDB). The integration range was between 0.5 and 10 µs. The lower limit was chosen to reduce the influence of noise at early correlation times, while the upper limit was set to suppress contributions from photons with short pathlength, which have mainly probed extracerebral tissues, and to not overweight the tail of the autocorrelation curve.
Changes in the scaled diffusion coefficient were evaluated by:
100 .B cond B normo
B
B normo
D DD
D
(7)
Here αDB-Cond is the average value of αDB measured during a condition of blood flow change (hypocapnia, hypercapnia or carotid occlusion) compared to normocapnia, and αDB-normo is the average scaled diffusion coefficient obtained at normocapnia.
#146337 - $15.00 USD Received 19 May 2011; revised 23 Jun 2011; accepted 25 Jun 2011; published 28 Jun 2011(C) 2011 OSA 1 July 2011 / Vol. 2, No. 7 / BIOMEDICAL OPTICS EXPRESS 2073
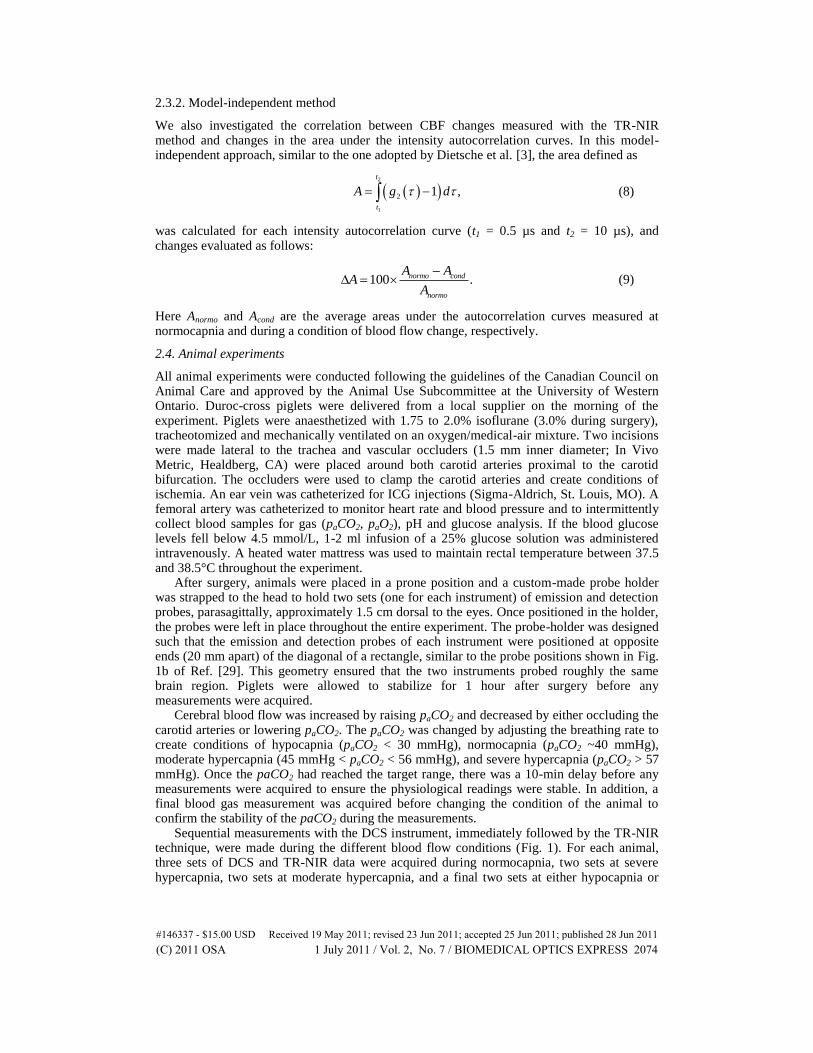
2.3.2. Model-independent method
We also investigated the correlation between CBF changes measured with the TR-NIR method and changes in the area under the intensity autocorrelation curves. In this model-independent approach, similar to the one adopted by Dietsche et al. [3], the area defined as
2
1
2 1 ,
t
t
A g d (8)
was calculated for each intensity autocorrelation curve (t1 = 0.5 µs and t2 = 10 µs), and changes evaluated as follows:
100 .normo cond
normo
A AA
A
(9)
Here Anormo and Acond are the average areas under the autocorrelation curves measured at normocapnia and during a condition of blood flow change, respectively.
2.4. Animal experiments
All animal experiments were conducted following the guidelines of the Canadian Council on Animal Care and approved by the Animal Use Subcommittee at the University of Western Ontario. Duroc-cross piglets were delivered from a local supplier on the morning of the experiment. Piglets were anaesthetized with 1.75 to 2.0% isoflurane (3.0% during surgery), tracheotomized and mechanically ventilated on an oxygen/medical-air mixture. Two incisions were made lateral to the trachea and vascular occluders (1.5 mm inner diameter; In Vivo Metric, Healdberg, CA) were placed around both carotid arteries proximal to the carotid bifurcation. The occluders were used to clamp the carotid arteries and create conditions of ischemia. An ear vein was catheterized for ICG injections (Sigma-Aldrich, St. Louis, MO). A femoral artery was catheterized to monitor heart rate and blood pressure and to intermittently collect blood samples for gas (paCO2, paO2), pH and glucose analysis. If the blood glucose levels fell below 4.5 mmol/L, 1-2 ml infusion of a 25% glucose solution was administered intravenously. A heated water mattress was used to maintain rectal temperature between 37.5 and 38.5°C throughout the experiment.
After surgery, animals were placed in a prone position and a custom-made probe holder was strapped to the head to hold two sets (one for each instrument) of emission and detection probes, parasagittally, approximately 1.5 cm dorsal to the eyes. Once positioned in the holder, the probes were left in place throughout the entire experiment. The probe-holder was designed such that the emission and detection probes of each instrument were positioned at opposite ends (20 mm apart) of the diagonal of a rectangle, similar to the probe positions shown in Fig. 1b of Ref. [29]. This geometry ensured that the two instruments probed roughly the same brain region. Piglets were allowed to stabilize for 1 hour after surgery before any measurements were acquired.
Cerebral blood flow was increased by raising paCO2 and decreased by either occluding the carotid arteries or lowering paCO2. The paCO2 was changed by adjusting the breathing rate to create conditions of hypocapnia (paCO2 < 30 mmHg), normocapnia (paCO2 ~40 mmHg), moderate hypercapnia (45 mmHg < paCO2 < 56 mmHg), and severe hypercapnia (paCO2 > 57 mmHg). Once the paCO2 had reached the target range, there was a 10-min delay before any measurements were acquired to ensure the physiological readings were stable. In addition, a final blood gas measurement was acquired before changing the condition of the animal to confirm the stability of the paCO2 during the measurements.
Sequential measurements with the DCS instrument, immediately followed by the TR-NIR technique, were made during the different blood flow conditions (Fig. 1). For each animal, three sets of DCS and TR-NIR data were acquired during normocapnia, two sets at severe hypercapnia, two sets at moderate hypercapnia, and a final two sets at either hypocapnia or
#146337 - $15.00 USD Received 19 May 2011; revised 23 Jun 2011; accepted 25 Jun 2011; published 28 Jun 2011(C) 2011 OSA 1 July 2011 / Vol. 2, No. 7 / BIOMEDICAL OPTICS EXPRESS 2074
during vascular occlusion. Each set of DCS and TR data included five intensity autocorrelation curves and one ICG blood flow measurement. Approximately 15 min were allowed between consecutive sets of measurements. All measurements were acquired while the animals were in steady-state as confirmed by the stability of the physiological parameters. Since the measurements were acquired sequentially, an electromechanical shutter placed in front of the PMT prevented any light from reaching the PMT during DCS measurements. The lasers were also sequentially blocked during the experiments. That is, the 786 nm CW laser was blocked during TR measurements and the 802 nm pulsed laser was blocked during DCS acquisitions. The initial count rate measured with the TR-NIR instrument was adjusted to 400 kHz (i.e., 0.5% of the laser repetition rate) to reduce dead-time effects [39]. The arterial ICG concentration curves were measured by attaching the dye densitometer probe to a forefoot. For the DCS measurements, the collection time was set to 30 s and the typical count rate was ~60 kHz and ~500 kHz for the first three and the last seven animals, respectively. The difference in count rate was a result of the difference in quantum efficiency between the two detectors (see section 2.1). Each experiment was completed in less than 7 hours.
Fig. 1. Experimental protocol.
2.5. Effects of errors in the optical properties on the recovered αDB
Simulations were conducted to investigate the effects of errors in the optical properties used in the fitting of the autocorrelation curves on the recovered αDB values. Normalized intensity autocorrelation curves, g2(ρ,τ), were generated using the diffusion approximation model (Eq.
(5) and (6)) for three values of αDB: 25, 36 and 60 (109
cm2s1
). At each αDB, g2(ρ,τ) data sets
were generated by increasing µa in increments of 0.001 cm1
from 0.15 to 0.26 cm1
while
keeping µs' = 8.0 cm1
. This procedure was repeated setting µa = 0.20 cm1
and incrementing
µs' from 7.0 to 10.0 cm1
in steps of 0.01 cm1
. These values were chosen to mimic the range encountered in this study (see Tables 1 and 2). Each g2(ρ,τ) curve generated in the aforementioned procedure was fitted using the analytical model and assuming fixed µa (0.2
cm1
) and µs' (8.0 cm1
), which are typical of optical properites measured at normocapnia (see Table 1). The percentage error in the recovered αDB was evaluated as follows:
(%) 100 .B fit Breal
Berror
Breal
D DD
D
(10)
In this equation αDB fit is the value retrieved from the fitting procedure and αDB real is the input
value (25, 36 or 60 × 109
cm2s1
).
2.6. Statistical analysis
All data are presented as mean ± standard error (SE) unless otherwise noted. Statistical analyses were conducted using SPSS 16.0 (SPSS, Chicago, IL) and statistical significance was defined as p < 0.05. Physiological variables under the different capnic levels were compared using a two-tailed paired t-test including Bonferroni correction for multiple comparisons. Regression analyses were conducted to investigate correlations between CBF values from the TR-NIR technique and relative flow parameters from DCS.
#146337 - $15.00 USD Received 19 May 2011; revised 23 Jun 2011; accepted 25 Jun 2011; published 28 Jun 2011(C) 2011 OSA 1 July 2011 / Vol. 2, No. 7 / BIOMEDICAL OPTICS EXPRESS 2075
3. Results
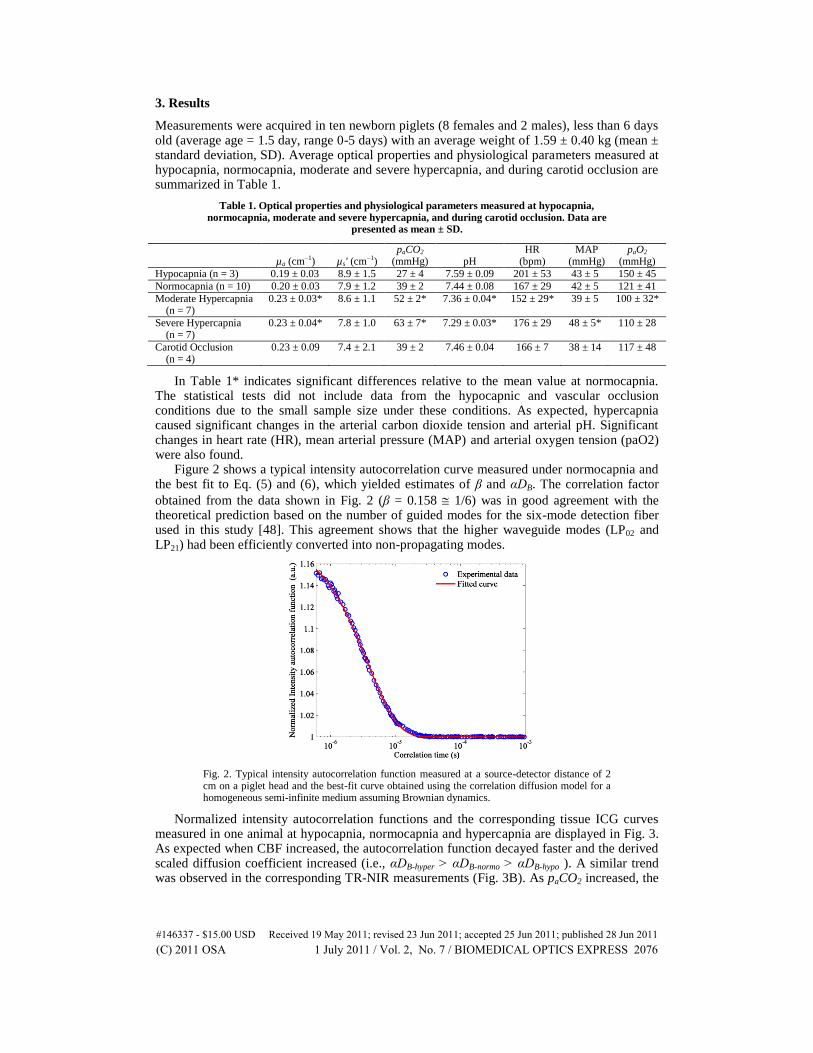
Measurements were acquired in ten newborn piglets (8 females and 2 males), less than 6 days old (average age = 1.5 day, range 0-5 days) with an average weight of 1.59 ± 0.40 kg (mean ± standard deviation, SD). Average optical properties and physiological parameters measured at hypocapnia, normocapnia, moderate and severe hypercapnia, and during carotid occlusion are summarized in Table 1.
Table 1. Optical properties and physiological parameters measured at hypocapnia, normocapnia, moderate and severe hypercapnia, and during carotid occlusion. Data are
In Table 1* indicates significant differences relative to the mean value at normocapnia. The statistical tests did not include data from the hypocapnic and vascular occlusion conditions due to the small sample size under these conditions. As expected, hypercapnia caused significant changes in the arterial carbon dioxide tension and arterial pH. Significant changes in heart rate (HR), mean arterial pressure (MAP) and arterial oxygen tension (paO2) were also found.
Figure 2 shows a typical intensity autocorrelation curve measured under normocapnia and the best fit to Eq. (5) and (6), which yielded estimates of β and αDB. The correlation factor
obtained from the data shown in Fig. 2 (β = 0.158 1/6) was in good agreement with the theoretical prediction based on the number of guided modes for the six-mode detection fiber used in this study [48]. This agreement shows that the higher waveguide modes (LP02 and LP21) had been efficiently converted into non-propagating modes.
Fig. 2. Typical intensity autocorrelation function measured at a source-detector distance of 2 cm on a piglet head and the best-fit curve obtained using the correlation diffusion model for a homogeneous semi-infinite medium assuming Brownian dynamics.
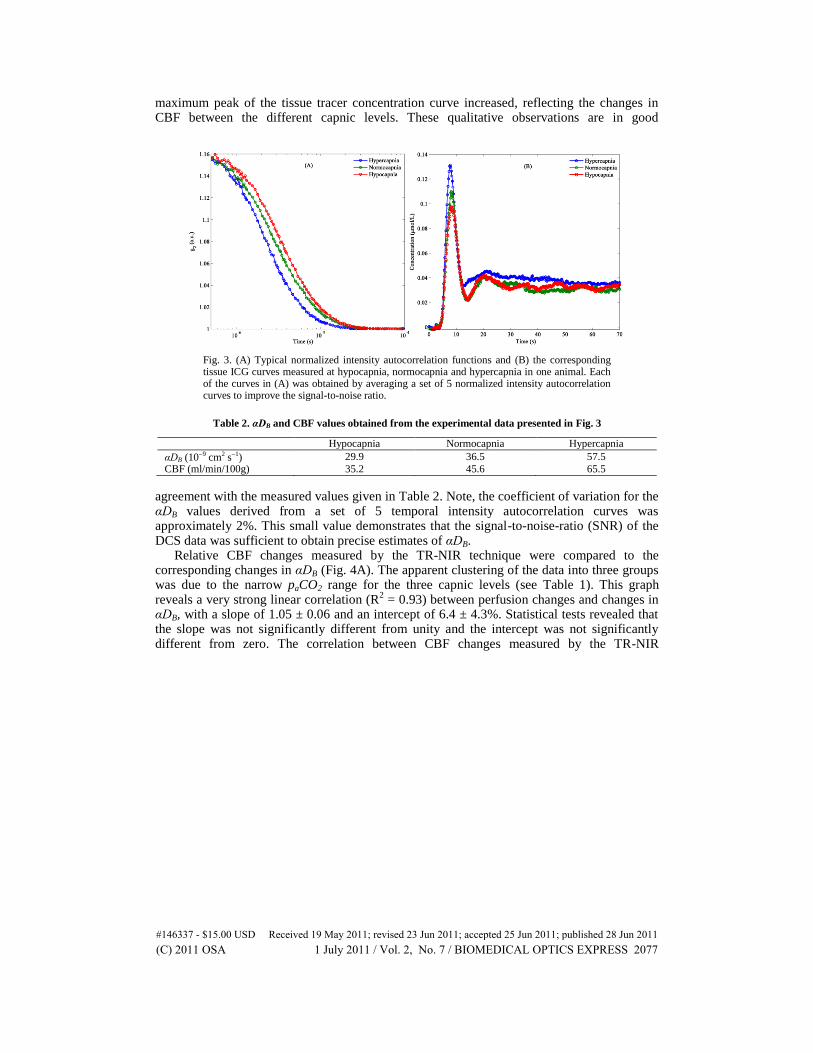
Normalized intensity autocorrelation functions and the corresponding tissue ICG curves measured in one animal at hypocapnia, normocapnia and hypercapnia are displayed in Fig. 3. As expected when CBF increased, the autocorrelation function decayed faster and the derived scaled diffusion coefficient increased (i.e., αDB-hyper > αDB-normo > αDB-hypo ). A similar trend was observed in the corresponding TR-NIR measurements (Fig. 3B). As paCO2 increased, the
#146337 - $15.00 USD Received 19 May 2011; revised 23 Jun 2011; accepted 25 Jun 2011; published 28 Jun 2011(C) 2011 OSA 1 July 2011 / Vol. 2, No. 7 / BIOMEDICAL OPTICS EXPRESS 2076
maximum peak of the tissue tracer concentration curve increased, reflecting the changes in CBF between the different capnic levels. These qualitative observations are in good
Fig. 3. (A) Typical normalized intensity autocorrelation functions and (B) the corresponding tissue ICG curves measured at hypocapnia, normocapnia and hypercapnia in one animal. Each of the curves in (A) was obtained by averaging a set of 5 normalized intensity autocorrelation curves to improve the signal-to-noise ratio.
Table 2. αDB and CBF values obtained from the experimental data presented in Fig. 3
Hypocapnia Normocapnia Hypercapnia
αDB (109 cm2 s1) 29.9 36.5 57.5
CBF (ml/min/100g) 35.2 45.6 65.5
agreement with the measured values given in Table 2. Note, the coefficient of variation for the αDB values derived from a set of 5 temporal intensity autocorrelation curves was approximately 2%. This small value demonstrates that the signal-to-noise-ratio (SNR) of the DCS data was sufficient to obtain precise estimates of αDB.
Relative CBF changes measured by the TR-NIR technique were compared to the corresponding changes in αDB (Fig. 4A). The apparent clustering of the data into three groups was due to the narrow paCO2 range for the three capnic levels (see Table 1). This graph reveals a very strong linear correlation (R
2 = 0.93) between perfusion changes and changes in
αDB, with a slope of 1.05 ± 0.06 and an intercept of 6.4 ± 4.3%. Statistical tests revealed that the slope was not significantly different from unity and the intercept was not significantly different from zero. The correlation between CBF changes measured by the TR-NIR
#146337 - $15.00 USD Received 19 May 2011; revised 23 Jun 2011; accepted 25 Jun 2011; published 28 Jun 2011(C) 2011 OSA 1 July 2011 / Vol. 2, No. 7 / BIOMEDICAL OPTICS EXPRESS 2077
Fig. 4. Perfusion changes measured with the TR-NIR technique compared to the corresponding changes in (A) the scaled diffusion coefficient (αDB) and (B) area under the intensity autocorrelation curves (A).
technique and changes in the model-independent parameter ΔA extracted from the autocorrelation function is shown in Fig. 4B. The analysis revealed that changes in the area under the intensity autocorrelation curves were strongly correlated with blood flow changes (R
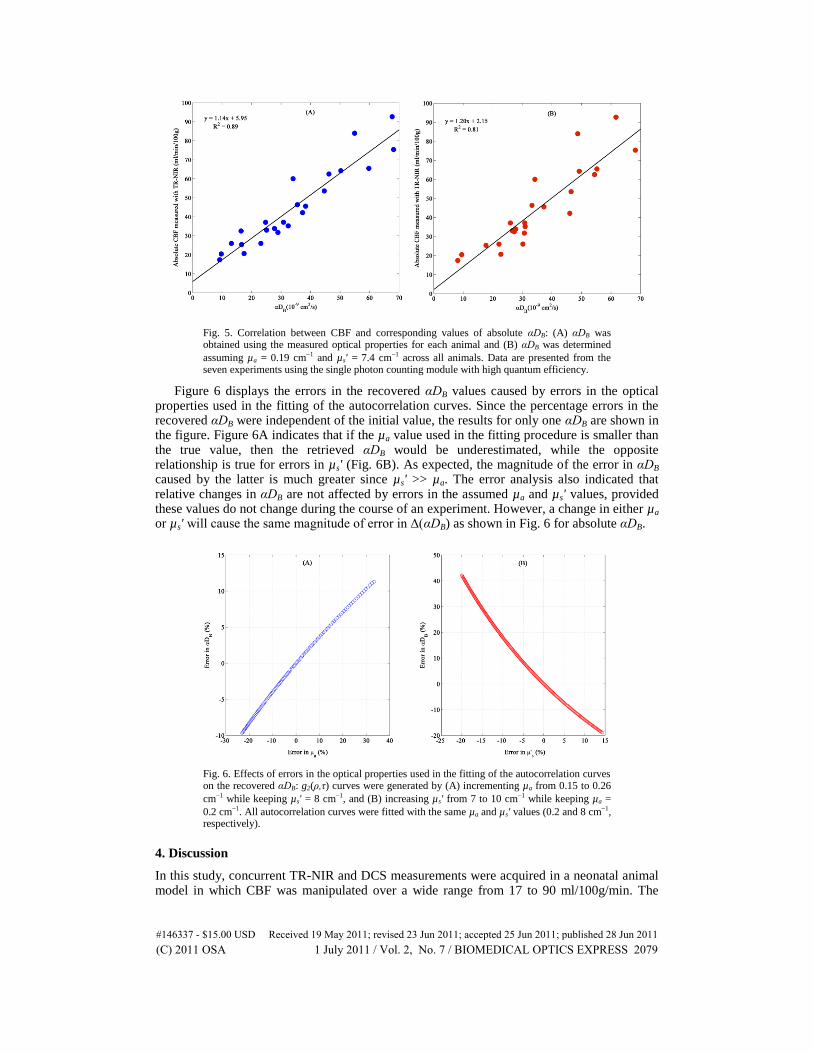
2 = 0.86), although the intercept was significantly different from zero (p = 0.04). Figure 5 shows the relationship between absolute CBF measured with the TR-NIR
technique and the corresponding αDB values. Since the apparatus used in this study was a hybrid TR-DCS instrument, the αDB data in Fig. 5A (a slope of 1.14 ± 0.08
(ml/min/100g)/(109
cm2s1
) and an intercept of 5.95 ± 3.24 ml/min/100g) were obtained using the measured µa (for each condition) and µs' (for each piglet) in the fitting of the autocorrelation curves. The benefit of using individual’s optical properties in the fitting of the DCS data was investigated by repeating the analysis using average values across all piglets
(see Fig. 5B: a slope of 1.20 ± 0.12 (ml/min/100g)/(109
cm2s1
) and an intercept of 2.15 ± 4.77 ml/min/100g). In this case, the correlation between the two techniques was weaker, as evident by a reduction in R
2 (0.81 vs. 0.89), despite the relative homogeneity of the
population. In both Figs. 5A and B, the intercept was not significantly different from zero. Only data from the last seven animals were used in the comparison presented in Fig. 5
since the DCS measurements from these animals were acquired using a detector with high photon detection efficiency (~50%) to provide high SNRs. In contrast, the first three experiments were conducted using a detector with low photon detection efficiency (~7%). The lower SNR in these experiments caused a bias in the early time-points of the autocorrelation curves (i.e., the measured g2 value was much greater than the predicted value of 1 + β), which causes a subsequent bias in αDB. Compared to the data in Fig. 5A, including data from the first three animals in the analysis resulted in a slope of 0.86 ± 0.11
(ml/min/100g)/(109
cm2s1
), an intercept of 11.45 ± 4.63 ml/min/100g and greater variability in the correlation (R
2 of 0.65 compared to 0.89).
#146337 - $15.00 USD Received 19 May 2011; revised 23 Jun 2011; accepted 25 Jun 2011; published 28 Jun 2011(C) 2011 OSA 1 July 2011 / Vol. 2, No. 7 / BIOMEDICAL OPTICS EXPRESS 2078
Fig. 5. Correlation between CBF and corresponding values of absolute αDB: (A) αDB was obtained using the measured optical properties for each animal and (B) αDB was determined
assuming µa = 0.19 cm1 and µs' = 7.4 cm1 across all animals. Data are presented from the seven experiments using the single photon counting module with high quantum efficiency.
Figure 6 displays the errors in the recovered αDB values caused by errors in the optical properties used in the fitting of the autocorrelation curves. Since the percentage errors in the recovered αDB were independent of the initial value, the results for only one αDB are shown in the figure. Figure 6A indicates that if the µa value used in the fitting procedure is smaller than the true value, then the retrieved αDB would be underestimated, while the opposite relationship is true for errors in µs' (Fig. 6B). As expected, the magnitude of the error in αDB caused by the latter is much greater since µs' >> µa. The error analysis also indicated that relative changes in αDB are not affected by errors in the assumed µa and µs' values, provided these values do not change during the course of an experiment. However, a change in either µa or µs' will cause the same magnitude of error in Δ(αDB) as shown in Fig. 6 for absolute αDB.
Fig. 6. Effects of errors in the optical properties used in the fitting of the autocorrelation curves on the recovered αDB: g2(ρ,τ) curves were generated by (A) incrementing µa from 0.15 to 0.26
cm1 while keeping µs' = 8 cm1, and (B) increasing µs' from 7 to 10 cm1 while keeping µa =
0.2 cm1. All autocorrelation curves were fitted with the same µa and µs' values (0.2 and 8 cm1, respectively).
4. Discussion
In this study, concurrent TR-NIR and DCS measurements were acquired in a neonatal animal model in which CBF was manipulated over a wide range from 17 to 90 ml/100g/min. The
#146337 - $15.00 USD Received 19 May 2011; revised 23 Jun 2011; accepted 25 Jun 2011; published 28 Jun 2011(C) 2011 OSA 1 July 2011 / Vol. 2, No. 7 / BIOMEDICAL OPTICS EXPRESS 2079
analysis revealed a strong linear correlation between CBF changes measured with the TR-NIR technique and corresponding changes in αDB. These results are in good agreement with Zhou and al [17], who also reported in the same animal model a strong correlation (R
2 = 0.81, slope
= 1.1) between perfusion changes measured with fluorescence microspheres and changes in αDB. Diffuse correlation flowmetry has also been validated against other blood flow techniques including the MRI-based arterial spin labeling method [14,18,49], transcranial Doppler (TCD) [11,29,50], laser Doppler flowmetry [30], and xenon-CT [51]. However, the current study is the first to report a comparison of DCS with another optical technique that measures CBF in a similar tissue volume to that probed by the DCS signal. Since the TR-NIR and DCS instruments use similar probe wavelengths and single-photon detectors, partial volume errors between the two techniques should be minimal compared to comparison studies involving imaging modalities or TCD. This difference may explain the stronger correlation reported here compared to previous findings [11,14,18,24,50,51].
The results of Fig. 4A suggest that a reference CBF measurement acquired with the TR-NIR technique can be used to convert relative perfusion changes obtained with DCS into absolute values. This approach requires injecting the contrast agent ICG in order to measure CBF. However, this is a minimally invasive procedure since ICG can be injected into a peripheral vein and the arterial ICG time-concentration curve can be measured noninvasively by a DDG. Furthermore, ICG is FDA-approved, has a strong safety record, and has very low acute toxicity (median lethal dose in mice is 650 mg/kg) [52]. The accuracy of this combined TR-NIR/DCS approach will depend on the precision of the CBF measurement acquired by the bolus-tracking technique. Using a repeat-measures ANOVA, our group previously determined the precision to be 9.7%, which is quite reasonable [35]. In addition, subsequent measurements of CBF could be acquired with the TR-NIR technique if relative blood flow abnormalities were suspected by the DCS measurements. A potential complication with combining DCS with the bolus-tracking method is the effects of ICG-induced changes in µa on the αDB measurements. In these validation experiments, each ICG injection was followed by a delay of 15 min to allow sufficient time for the dye to clear. However, delays of this magnitude are extremely conservative and DCS data collection could begin very shortly after the acquisition of the dynamic TR-NIR data with minimal effect on αDB. This is because the change in µa following the first pass of ICG (see Fig. 3B) is approximately 5%, which would lead to an error in αDB of only 2%, according to Fig. 6.
The strong linear correlation between CBF and absolute αDB shown in Fig. 5A suggests that an alternative approach would be to use αDB directly as a measure of CBF. Since a theoretical model relating αDB to the underlying tissue hemodynamics does not currently exist, this approach would require generating a population-based calibration curve to convert αDB into CBF. Analogous to the piglet experiments, the general relationship between CBF and absolute αDB for a specific population, such as neonates, would have to be established. The advantage of this approach is that, once the calibration curve was generated, it would not be necessary to obtain a CBF measurement with the bolus-tracking technique in subsequent experiments. This approach would require accurate measurements of the tissue optical properties in every experiment, such as by time-resolved or frequency domain methods [30], since uncertainties in µa and µs' can lead to substantial errors in αDB, as shown in Fig. 6. These simulations can also be used to predict the error in relative αDB if the optical properties changed during the course of the experiment. If the values of the tissue optical properties remained within the range of values measured in the piglet experiments, the errors would be relatively small. For example, the change in µa from normocapnia to hypercapnia was 15% (Table 1), which translates into an error in relative αDB of only 5%.
The calibration-curve approach also requires that the DCS data be acquired at high count-rates to provide sufficient stability in the retrieval of αDB. The sensitivity of αDB to count rate was evident in this study by the substantial reduction in the correlation between CBF and αDB when data acquired with the low quantum efficiency detector were included in the comparison. Noise in the autocorrelation function introduces a bias that affects the accuracy of the absolute αDB values. However, the effects are minimal on relative αDB measurements
#146337 - $15.00 USD Received 19 May 2011; revised 23 Jun 2011; accepted 25 Jun 2011; published 28 Jun 2011(C) 2011 OSA 1 July 2011 / Vol. 2, No. 7 / BIOMEDICAL OPTICS EXPRESS 2080
provided the count rate at different flow conditions is kept roughly constant, which can be achieved by adjusting the laser power. Greater SNR can be obtained by using detectors with high quantum efficiency or multiple detectors in parallel [8]. The count rate can also be improved by using few-mode detection fibers instead of truly single-mode fibers [3]. However, the increased count rate due to the larger active area of the detection fiber comes at the expense of an increased number of guided modes and, consequently, reduced correlation factor. For the few-mode detection fiber used in this study, β was expected to be ~0.167 (for an ideal six-mode fiber) [48], which was in good agreement with the measured value (β = 0.158). The small discrepancy between the predicted and experimental β values had no effect on the perfusion measurements and was likely due to a more efficient coupling of the fundamental LP01 mode compared to the two LP11 modes.
A potential complication with both the reference-CBF measurement and calibration-curve approaches is tissue heterogeneity, due to the presence of a substantial extracerebral layer in the region probed by the detected photons. While the contribution of extracerebral tissues is not expected to be substantial in neonates, it cannot be ignored in juvenile and adult subjects. Extracerebral contamination has been shown to cause substantial underestimations of CBF by ICG bolus-tracking techniques [53] and affect the accuracy of brain optical properties measurements [41]. A study involving computer simulations and layered tissue-mimicking phantoms also suggested that the accuracy of DCS can be degraded by extracerebral contamination [26]. It may be possible to overcome this limitation by applying multi-layer diffusion models and using depth-sensitive optical techniques [10,37,40,41].
Besides investigating αDB as a relative flow marker, we also compared changes in the area under the intensity autocorrelation curves (ΔA) to CBF changes. This model-independent approach is appealing due to its conceptual simplicity and does not require any knowledge about the optical properties of the medium. The results of Fig. 4B show a strong correlation between perfusion changes and changes in ΔA, but unlike in the case of αDB the correlation between ΔA and relative CBF was better represented by a second-order polynomial (R
2 =
0.89) rather than a linear curve (R2 = 0.86), suggesting a non-linear scaling of CBF with ΔA.
A potential limitation with this study was the use of two different methods to create conditions of low CBF. In the first seven animals, vascular cuffs placed around the common carotids were used to lower CBF. However, in three of these animals neither technique (DCS or TR-NIR) detected a change in CBF after the vascular occluders were inflated, which was likely due to collateral flow through the vertebral arteries. Consequently, hypocapnia rather than carotid occlusion was used to reduce CBF in the remaining three animals. Since the purpose of the study was to investigate the agreement between the two techniques over a range of CBF values, altering the method used to reduce CBF should not affect the main conclusion of the study. A second potential limitation was the exclusion of data from the first three animals in the comparison between absolute αDB and CBF. It was necessary to exclude these data due to poor SNR caused by low count rates. In the remaining seven animals, DCS data were acquired using a detector with a high photon detection efficiency, which improved the SNR and reduced the variability in the retrieved αDB values. Another potential limitation was that the tissue optical properties used in the fitting of the autocorrelation curves were measured at 802 nm, and not at the emission wavelength of the DCS instrument (786 nm). However, it is reasonable to assume that the difference in optical properties between these two wavelengths is small and, consequently, the error in the DCS measurements is minimal. For example, we have measured the optical properties at 802 and 760 nm (data not presented) and the difference in µa was less than 5%, which would cause an error of less than 3% in αDB.
A final consideration is the fact that α depends on the fraction of moving scatterers in the probed region, i.e., the cerebral blood volume (CBV). In this study, a good correlation was observed between the CBV measurements obtained from the bolus-tracking method and αDB (R
2 = 0.66, data not presented). However, this correlation is not surprising considering the
well-known coupling of CBV and CBF during variations in arterial blood CO2 tension [54], and a good correlation between CBV and CBF was also observed in this study (R
2 = 0.77). It
#146337 - $15.00 USD Received 19 May 2011; revised 23 Jun 2011; accepted 25 Jun 2011; published 28 Jun 2011(C) 2011 OSA 1 July 2011 / Vol. 2, No. 7 / BIOMEDICAL OPTICS EXPRESS 2081
would be interesting to determine if the relationship between αDB and CBF changes under condition in which CBV and CBF become uncoupled, such as during ischemia [55].
5. Conclusion
In this study we demonstrated that DCS data could be converted into cerebral blood flow using an all-optical technique approach. An extension of this approach would be to combine DCS with a TR-NIR system equipped with multiple lasers. This combination would enable continuous monitoring of both CBF and cerebral blood oxygenation, from which the cerebral metabolic rate of oxygen could be determined. The ability to continuously measure absolute blood flow and oxygen utilization could help improve the outcome of patients at risk of brain injury by early identification of cerebral ischemia.
Acknowledgments
We would like to thank Lise Desjardins for her help in the animal experiments, Kenneth Tichauer and Jonathan Elliott for useful discussions. This work was funded by the Canadian Institutes of Health Research (CIHR) and the Natural Sciences and Engineering Research Council of Canada (NSERC).
#146337 - $15.00 USD Received 19 May 2011; revised 23 Jun 2011; accepted 25 Jun 2011; published 28 Jun 2011(C) 2011 OSA 1 July 2011 / Vol. 2, No. 7 / BIOMEDICAL OPTICS EXPRESS 2082