Calibration of diode-laser second-derivative modulationspectrometry with a reference cell
Claus Weitkamp
Diode-laser second-derivative modulation spectrometry is a simple means of measuring trace concentrationsof small molecules in the gas phase. For a setup with a reference cell used both for laser frequency lockingand as a concentration standard, the calibration algorithm is developed for the general case of nonvanishingnonlinear terms in the power expansion of Beer's law in both the sample and reference channel. A practicalexample is given.
I. Introduction
Diode-laser derivative spectrometry can be efficientlyapplied to the determination of small concentrationsof gaseous molecular species. The method is particu-larly powerful for small molecules with simple bandstructure and large oscillator strengths of individualabsorption lines. It is therefore ideally suited for themeasurement of minor components (such as pollutants)in atmospheric air. Mutual interference of differentcompounds can be made totally negligible by choice ofappropriate lines and by operation at a pressure of fromone-tenth to one-hundredth atmosphere where pressurebroadening of absorption lines is considerably reduced,yet peak absorption per unit optical path length remainsalmost unaffected.
II. Experiment
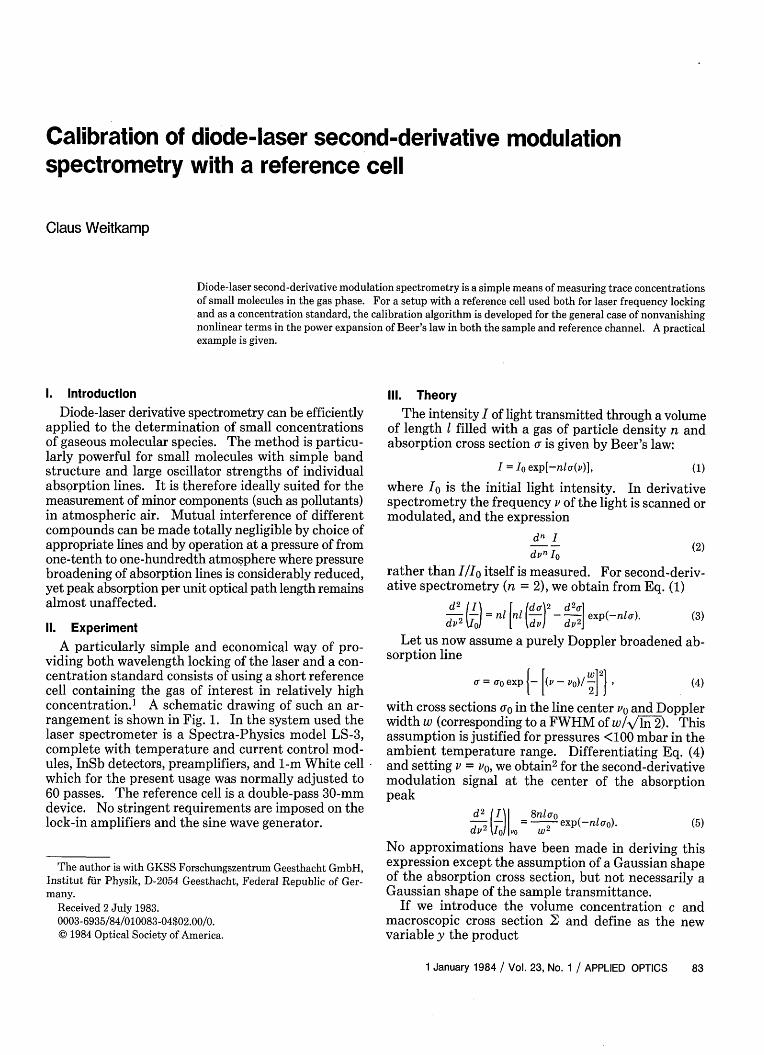
A particularly simple and economical way of pro-viding both wavelength locking of the laser and a con-centration standard consists of using a short referencecell containing the gas of interest in relatively highconcentration.1 A schematic drawing of such an ar-rangement is shown in Fig. 1. In the system used thelaser spectrometer is a Spectra-Physics model LS-3,complete with temperature and current control mod-ules, InSb detectors, preamplifiers, and 1-m White cellwhich for the present usage was normally adjusted to60 passes. The reference cell is a double-pass 30-mmdevice. No stringent requirements are imposed on thelock-in amplifiers and the sine wave generator.
The author is with GKSS Forschungszentrum Geesthacht GmbH,Institut fur Physik, D-2054 Geesthacht, Federal Republic of Ger-many.
The intensity I of light transmitted through a volumeof length filled with a gas of particle density n andabsorption cross section or is given by Beer's law:
I = Io exp[-nca(v)], (1)
where Io is the initial light intensity. In derivativespectrometry the frequency v of the light is scanned ormodulated, and the expression
d Idvn Io (2)
rather than I/Io itself is measured. For second-deriv-ative spectrometry (n = 2), we obtain from Eq. (1)
d 2 (I= n [nl (do2 d 2] exp(-n).
dV2 '- ) n k v d v2j (3)
Let us now assume a purely Doppler broadened ab-sorption line
ar = co exp -[(v - o)/ (24 )
with cross sections 00 in the line center vo and Dopplerwidth w (corresponding to a FWHM of w/i\ln2). Thisassumption is justified for pressures <100 mbar in theambient temperature range. Differentiating Eq. (4)and setting v = vo, we obtain 2 for the second-derivativemodulation signal at the center of the absorptionpeak
(IdI Snlcio2 _ = exp(-nloro).
dV2 \I Io v W2 (5)
No approximations have been made in deriving thisexpression except the assumption of a Gaussian shapeof the absorption cross section, but not necessarily aGaussian shape of the sample transmittance.
If we introduce the volume concentration c andmacroscopic cross section and define as the newvariable y the product
which for small y is approximately proportional to y,reaches a maximum at y = 1, and asymptotically dropsto zero as y - a. As d2I/dv 2 is associated with thecurvature of the absorption peak at line center, it is in-deed obvious that this term is proportional to the con-centration c as long as y = cl2 0 << 1, is zero in the flatcenter of a black resonance, and has no influence on lineprofile curvature at a point somewhere between theseextremes.
IV. Calibration Procedure
Quantities continuously and directly accessiblethroughout a measurement are only the output signalsfrom the lock-in amplifiers:
SW = CW d2j ' SR = R d 2IR (8)
(compare Fig. 1), where ew, R are some combined ef-ficiency factors of the detector, preamplifier, and lock-inamplifier, including optical and cable losses, in theWhite cell (W) and reference channel (R), respectively.Io and thus the output signals Sw and SR are propor-tional to the laser output power. It is not difficult todetermine to good accuracy at the beginning of an ex-periment the transmitted relative laser power outsidethe absorption peak and also the depth of the absorp-tion peak in the reference cell. Even if these quan-tities
UW, UR, PR
slowly flowing through the cell to avoid wall effects, aswell as the cell length R are known to good accuracy.We have thus all the data necessary to solve the systemof equations
SW = UW cwlw2o exp(-cwlw2o),
SR 8 (12)SR = UR - CRR oexp(-CRIRo0)
for the unknown concentration cw in the White cell.By division we obtain the transcendental equation
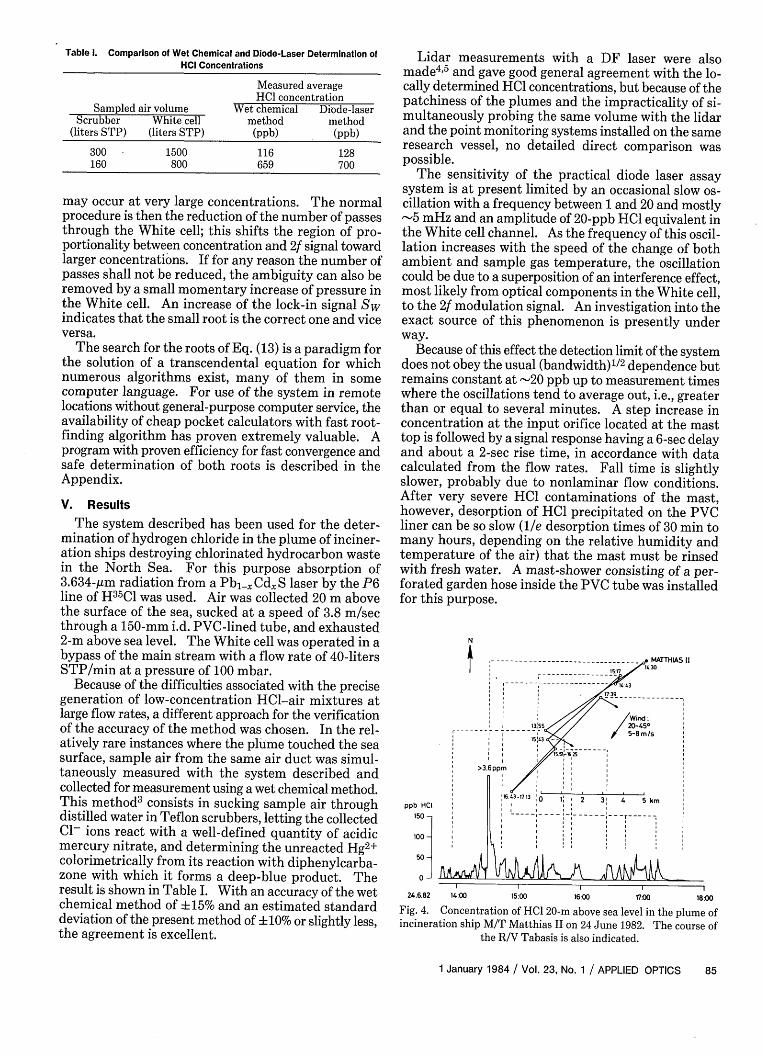
the roots of which directly yield the unknown concen-tration c W. Figure 3 shows a section through the mul-tidimensional calibration surface. Normally thesmaller of the two roots is the correct result. Doubts
WHITE CELL SIGNAL REFERENCE SIGNAL
Uw USA U SAT TION
CS I ~TUR UATION
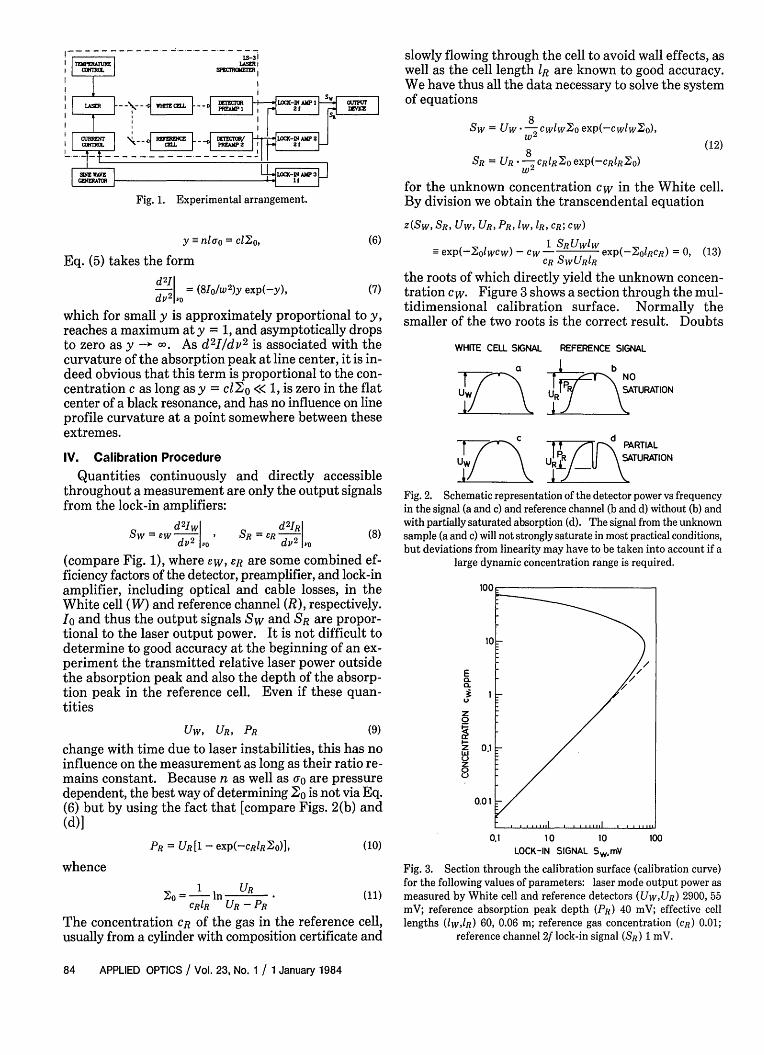
Fig. 2. Schematic representation of the detector power vs frequencyin the signal (a and c) and reference channel (b and d) without (b) andwith partially saturated absorption (d). The signal from the unknownsample (a and c) will not strongly saturate in most practical conditions,but deviations from linearity may have to be taken into account if a
large dynamic concentration range is required.
E0.0.
U
z0
zZ
Q
(9)
change with time due to laser instabilities, this has noinfluence on the measurement as long as their ratio re-mains constant. Because n as well as oo are pressuredependent, the best way of determining 20 is not via Eq.(6) but by using the fact that [compare Figs. 2(b) and(d)]
PR = UR[1 - exp(-CRlR2O)I, (10)
whence
1 URo0 - n . (11)CR1R UR - PR
The concentration CR of the gas in the reference cell,usually from a cylinder with composition certificate and
0.01
0.1 1 0 10 100
LOCK-IN SIGNAL SWmV
Fig. 3. Section through the calibration surface (calibration curve)for the following values of parameters: laser mode output power asmeasured by White cell and reference detectors (UW,UR) 2900, 55mV; reference absorption peak depth (PR) 40 mV; effective celllengths (W,IR) 60, 0.06 m; reference gas concentration (CR) 0.01;
Table 1. Comparison of Wet Chemical and Diode-Laser Determination ofHCI Concentrations
Measured averageHCl concentration
Sampled air volume Wet chemical Diode-laserScrubber White cell method method
(liters STP) (liters STP) (ppb) (ppb)
300 1500 116 128160 800 659 700
may occur at very large concentrations. The normalprocedure is then the reduction of the number of passesthrough the White cell; this shifts the region of pro-portionality between concentration and 2f signal towardlarger concentrations. If for any reason the number ofpasses shall not be reduced, the ambiguity can also beremoved by a small momentary increase of pressure inthe White cell. An increase of the lock-in signal Swindicates that the small root is the correct one and viceversa.
The search for the roots of Eq. (13) is a paradigm forthe solution of a transcendental equation for whichnumerous algorithms exist, many of them in somecomputer language. For use of the system in remotelocations without general-purpose computer service, theavailability of cheap pocket calculators with fast root-finding algorithm has proven extremely valuable. Aprogram with proven efficiency for fast convergence andsafe determination of both roots is described in theAppendix.
V. Results
The system described has been used for the deter-mination of hydrogen chloride in the plume of inciner-ation ships destroying chlorinated hydrocarbon wastein the North Sea. For this purpose absorption of3.634-Am radiation from a Pbl1 ,Cd.S laser by the P6line of H35C1 was used. Air was collected 20 m abovethe surface of the sea, sucked at a speed of 3.8 m/secthrough a 150-mm i.d. PVC-lined tube, and exhausted2-m above sea level. The White cell was operated in abypass of the main stream with a flow rate of 40-litersSTP/min at a pressure of 100 mbar.
Because of the difficulties associated with the precisegeneration of low-concentration HCl-air mixtures atlarge flow rates, a different approach for the verificationof the accuracy of the method was chosen. In the rel-atively rare instances where the plume touched the seasurface, sample air from the same air duct was simul-taneously measured with the system described andcollected for measurement using a wet chemical method.This method3 consists in sucking sample air throughdistilled water in Teflon scrubbers, letting the collectedCl- ions react with a well-defined quantity of acidicmercury nitrate, and determining the unreacted Hg2+colorimetrically from its reaction with diphenylcarba-zone with which it forms a deep-blue product. Theresult is shown in Table I. With an accuracy of the wetchemical method of 15% and an estimated standarddeviation of the present method of ± O% or slightly less,the agreement is excellent.
Lidar measurements with a DF laser were alsomade4 5 and gave good general agreement with the lo-cally determined HCl concentrations, but because of thepatchiness of the plumes and the impracticality of si-multaneously probing the same volume with the lidarand the point monitoring systems installed on the sameresearch vessel, no detailed direct comparison waspossible.
The sensitivity of the practical diode laser assaysystem is at present limited by an occasional slow os-cillation with a frequency between 1 and 20 and mostly-5 mHz and an amplitude of 20-ppb HCl equivalent inthe White cell channel. As the frequency of this oscil-lation increases with the speed of the change of bothambient and sample gas temperature, the oscillationcould be due to a superposition of an interference effect,most likely from optical components in the White cell,to the 2f modulation signal. An investigation into theexact source of this phenomenon is presently underway.
Because of this effect the detection limit of the systemdoes not obey the usual (bandwidth)1/2 dependence butremains constant at -20 ppb up to measurement timeswhere the oscillations tend to average out, i.e., greaterthan or equal to several minutes. A step increase inconcentration at the input orifice located at the masttop is followed by a signal response having a 6-sec delayand about a 2-sec rise time, in accordance with datacalculated from the flow rates. Fall time is slightlyslower, probably due to nonlaminar flow conditions.After very severe HCl contaminations of the mast,however, desorption of HCl precipitated on the PVCliner can be so slow (e desorption times of 30 min tomany hours, depending on the relative humidity andtemperature of the air) that the mast must be rinsedwith fresh water. A mast-shower consisting of a per-forated garden hose inside the PVC tube was installedfor this purpose.
ppb HCI150 -
100 -
500-
24.6.82
Fig. 4.
T - MATTHAS 11
4:30------------ _ - -- -- jol17
1443
/Wind~3,5'5 20-45O---------- ~ ~~~5-8m /s
15 43
1'S1-16 5
>3 Sppm /
E | 16 3-lzl3l o 1l 2 3 4 5 km
14:00 15:00 1 11400 15:00 16:00 17.00 18
Concentration of HCl 20-m above sea level in the plume ofincineration ship M/T Matthias II on 24 June 1982. The course of
For illustration a plot of HCl concentrations mea-sured with the R/V Tabasis on longitudinal courses inthe plume of incineration ship M/T Matthias II is shownin Fig. 4. The plot reveals that except in the upward-moving part of the plume in the immediate vicinity ofthe incinerator, maximum concentrations ranged be-tween 25- and 50-ppb HCl, in agreement with calcula-tions, and also clearly shows the rapid temporal vari-ability of the plume not easily measurable with slowerconventional HCl assay systems.
Appendix: Calibration Program for Gas Concentration Measurements by Diode-Laser Second-Derivative Spectrometry
(1) Program001 h LBL A002 STO 7003 RCL 2004 RCL 5005 -006 RCL 2007008 h 1/x009 f LN010 RCL 6011012 RCL 0013014 STO 8015 RCL 6016 X
(2) Comments003 - 014 computation of 10 from Eq. (11),015 - 038 computation of (1/CR) X ... [Eq. (13)],039 - 046 computation of 10-6 1olW,047 - 052 search for first root,053 - 061 search for second root,063 - 072 function subroutine for root search pro-
gram.
(3) Input Parameters
Optical length of IR, metersreference cell
Optical length of White Iw, meterscell
Off-peak detector UR, mVsignal, reference cell
Off-peak detector Uw, mVsignal, White cell
2f lock-in signal, SR, mVreference cell
Absorption line peak PR, mVheight, reference cell
Gas concentration, CR, vol/volreference cell
2f lock-in signal, White Sw, mVcell
(4) Sequence of Operations(a) Load program.
Memorylocation
0
Testvalue
0.06
(b) Load input parameters R ... CR in memory, useunits as above.
(c) Key in Sw and press A key. First root appears inppm.
(d) If second root is wanted, press R/S key. Secondroot appears in ppm.
(5) TestWith test values of input parameters as above, first
root must come out as 0.05208 (ppm), second root as53.41 (ppm).
1 60
2 55
3 2900
References4 1 1. P. Pokrowsky and W. Herrmann, SPIE Technical Meeting on


![Chapter 1: Diode circuits vt 15ec32].pdfChapter 1: Diode circuits ... • Diode testing • Zener diode • Diode data sheets and specifications ... Fig – b Vi characteristics of a diode](https://static.documents.pub/doc/80x56/5aedefea7f8b9a9031905d54/chapter-1-diode-circuits-vt-15ec32pdfchapter-1-diode-circuits-diode.jpg)


