15
California Agricultural Exports 2014-2015
CaliforniaAgricultural Exports
2014-2015

California Agricultural Exports, 2014-2015
n 2014, California’s agricultural exports amounted to $21.59 billion in value, showing relatively no change compared to the previous year. As indicated by the table below, California’s agricultural exports have grown at an impressive pace for the past 10 years except for a slight contraction between 2008 and 2009.
California Agricultural Export Values, 2004-2014 Year Export Value in $Billions 2014 $21.59 2013 $21.55 2012 $18.45 2011 $17.23 2010 $14.75 2009 $12.44 2008 $12.90 2007 $11.17 2006 $9.82 2005 $9.37 2004 $8.24
I Exports of almonds continued to be the top commodity from California, with a value of $4.53 billion in foreign sales. Dairy products ranked second to almonds with a California total export value of $2.43 billion, a 0.7 percent increase over 2013.
The principal 57 export commodities accounted for $18.77 billion in export value, or 89 percent of the total value of California’s agricultural exports, while the remaining 11 percent of exports were associated with “Other Products and Mixtures.” Of the top 57 commodities exported, 11 experienced an increase in export value of 5 percent or greater.
California’s share of total U.S. agricultural exports for 2014 was 14.3 percent — slightly less than the 14.9 percent share reported last year. California’s top 10 export destinations — European Union, Canada, China/Hong Kong, Japan, Mexico, Korea, India, United Arab Emirates, Turkey, and Vietnam — accounted for 69 percent of the 2014 export value. India showed the largest growth in total export value compared to the previous year at 19.1 percent.
California Agricultural Exports
MethodologyData to compute agricultural exports are derived from official government sources published industry sources and unpublished information from the government and the industry. Export quantities and values of the whole U.S. and California port districts are from the Department of Commerce (DOC) trade data posted on the United States International Trade Commission (USITC) online database (http://dataweb.usitc.gov/). Canadian import (value) data are from Strategis Canada’s online database (http:// strategis.ic.gc.ca /engdoc/main.html ). If the California export price is not available for a particular product, we use the U.S.
California Agricultural Exports, 2014-2015
average export price for that commodity in order to provide a dollar value for exports.
Production quantities and values are from various National Agricultural Statistics Service (NASS), Economic Research Service (ERS), and Agricultural Marketing Service (AMS) publications. A share of the raw data provided in these USDA service publications are released as a preliminary report early in the calendar year followed by a more accurate final report released at a later date. For accuracy, The University of California Agricultural Issues Center (AIC) export estimates use data from final USDA reports.
AIC exports estimates use different methods from other sources, such as ERS. The ERS estimates are based on a state’s national share of production of the exported commodity. The ERS method assumes that, for any particular commodity, a state’s share
of U.S. production equals that state’s share of U.S. exports. Other sources use geographic port data, without direct links to where the product originated. The AIC export figures correspond to commodities that have been produced on farms and ranches within California. Products originated in another state and exported via California ports are not included in these statistics.
In most cases, AIC reports exports at the individual commodity level. For instance, exports of a given fruit in fresh, canned, and dried forms are summed and listed under the name of the fruit, although the method for fresh fruit exports may differ from the method used for canned and dried fruit. The ratio of quantity exported to quantity produced is given on a farm weight basis. That means, for example, that wine is converted back into fresh grapes. Standard conversion factors published by the USDA are applied.

California Agricultural Exports, 2014-2015
2012 2013 2014
1 Almonds 3,387 4,166 4,532 8.8
2 Dairy and Products 1,774 2,409 2,425 0.7
3 Walnuts 1,115 1,380 1,448 4.9
4 Wine 2,3 1,276 1,453 1,392 -4.2
5 Pistachios 1,074 1,244 1,125 -9.6
6 Table Grapes 812 927 890 -4.1
7 Tomatoes, Processed 2 576 686 776 13.1
8 Rice 675 704 714 1.3
9 Oranges and Products 2 668 676 575 -15.0
10 Raisins 380 382 410 7.3
11 Strawberries 382 394 408 3.6
12 Beef and Products 2, 3 ,4 372 436 404 -7.4
13 Cotton 2 562 573 379 -33.8
14 Lettuce 2, 3 346 377 337 -10.6
15 Seeds for Sowing 2 306 320 324 1.4
16 Hay 2, 3 294 325 289 -11.1
17 Lemons 145 190 250 31.9
18 Peaches and Nectarines 3 166 162 173 7.1
19 Raspberries and Blackberries 5 154 157 172 9.3
20 Dried Plums 176 190 170 -10.4
21 Broccoli 124 126 128 1.3
22 Cauliflower 110 121 119 -1.5
23 Carrots 105 106 102 -3.6
24 Flowers and Nursery 2 88 101 96 -5.2
25 Onions 76 79 87 10.7
26 Spinach 69 83 86 3.7
27 Celery 68 84 74 -12.1
28 Plums 2 66 69 68 -2.3
29 Melons 3 58 67 64 -4.6
30 Blueberries 47 52 55 5.7
31 Tomatoes, Fresh 2 47 45 51 15.3
32 Cherries 145 135 51 -62.2
33 Tangerines and Mandarins 51 59 50 -14.3
34 Pears 38 45 43 -4.2
35 Dates 2 37 42 40 -3.8
36 Olives and Olive Oil 6 27 33 37 13.4
37 Garlic 31 32 35 10.7
38 Avocados 2 37 51 35 -32.2
39 Grape Juice 45 46 32 -30.4
40 Potatoes 30 35 29 -19.1
41 Turkey 33 29 28 -4.5
42 Grapefruit 2 34 28 28 -0.9
43 Dry Beans 35 28 28 -1.8
44 Bell and Chili Peppers 2 25 28 27 -3.3
45 Apples 29 26 25 -5.8
46 Sweet Potatoes 22 29 23 -20.3
47 Kiwi 2 18 20 19 -0.3
California Agricultural Products Export Values and Rankings, 2012-2014
2014Rank Product
Change in Value 2013 to 2014 (In Percent) 1$1 Million

California Agricultural Exports, 2014-2015
2012 2013 2014
California Agricultural Products Export Values and Rankings, 2012-2014
2014Rank Product
Change in Value 2013 to 2014 (In Percent) 1$1 Million
48 Figs 22 17 18 5.1
49 Wheat 2, 3 43 46 18 -61.7
50 Apricots 18 18 17 -9.1
51 Asparagus 20 16 14 -11.5
52 Chickens 13 12 12 -0.2
53 Cabbage 3 7 11 11 0.5
54 Eggs 9 17 9 -46.7
55 Cottonseed and Byproducts 2 14 16 8 -49.6
56 Artichokes 4 4 4 -1.0
57 Mushrooms 3 4 4 -8.8
Total Principal Commodities 7 16,287 18,911 18,766 -0.8
Total Other Products and Mixtures 2, 3, 8 2,487 2,641 2,824 6.9
Total All Agricultural Exports 18,774 21,551 21,590 0.2
Source: University of California, Agricultural Issues Center.
6 Product category "Olives and Olive Oil" is equal to the product category "Olives and Products" found in previous years' data tables.7 "Total Principal Commodity" values for 2012 and 2013 were revised based on updates to U.S. Department of Agriculture/National Agricultural Statistics Service production data.8 "Total Other Products and Mixtures" is composed of (a) highly processed products that are difficult to attribute to a specific commodity such as mixtures of fruits, nuts and vegetables and other processed foods; (b) categories for which the listed item does not provide data on individual commodities and (c) animal and plant products marketed in such small quantities that they are not included in the top 57 leading commodities.
1 Total export values for each year are rounded to the nearest million dollars. More precise values are used in the percent change calculations.2 Export values for 2013 were revised based on updated production data from the U.S. Department of Agriculture/National Agricultural Statistics Service.3 Export values for 2012 were revised based on updated production data from the U.S. Department of Agriculture/National Agricultural Statistics Service.4 Hides and skins are included in the heading "Beef and Products."5 "Raspberries and Blackberries" category also includes exports of "Mulberries and Loganberries."

California Agricultural Exports, 2014-2015
$1 Million In Percent $1 Million In Percent Percent Change
Animal Products 20,329 15.0 20,879 13.8 -8.4
Dairy and Products 6,826 37.6 6,692 36.2 -3.5
Beef and Products 1, 2 7,969 5.5 8,685 4.7 -15.1
Turkey 2 587 5.0 655 4.3 -14.4
Eggs 374 4.5 374 2.4 -46.7
Chicken 4,572 0.3 4,472 0.3 2.0
Field Crops 13,313 20.7 11,968 21.6 4.2
Cotton 5,591 10.2 4,396 8.6 -15.6
Tomatoes, Processed 1 727 94.4 821 94.6 0.2
Rice 2,204 32.0 2,013 35.4 10.9
Hay 1 1,286 25.3 1,121 25.8 2.0
Potatoes 217 16.3 199 14.4 -11.6
Wheat 1 1,318 3.5 1,447 1.2 -65.2
Sweet Potatoes 95 30.7 111 21.1 -31.4
Cottonseed and Byproducts 1 203 7.7 154 5.1 -33.9
Dry Beans 112 25.3 105 26.4 4.5
Seeds for Sowing 2 1,560 20.5 1,600 20.3 -1.1
Fruits and Products 8,375 62.3 8,238 60.6 -2.6
Wine 1 1,555 93.4 1,502 92.7 -0.8
Table Grapes 927 100.0 890 100.0 0.0
Oranges and Products 1 1,277 53.0 1,179 48.7 -8.0
Strawberries 470 84.0 464 88.1 4.9
Blueberries 320 16.1 324 16.8 4.2
Raisins 382 100.0 410 100.0 0.0
Dried Plums 190 100.0 170 100.0 0.0
Peaches and Nectarines 1 195 71.3 204 72.7 1.9
Lemons 1 224 84.8 293 85.4 0.7
Grapefruit 191 14.7 167 16.6 13.4
Plums 1 71 97.9 69 98.3 0.4
Cherries 471 28.6 524 9.7 -66.0
Melons 160 41.6 160 39.8 -4.4
Raspberries and Blackberries 1, 3 184 85.6 191 89.7 4.8
Pears 253 17.7 255 16.8 -4.9
Grape Juice 1 97 47.6 80 40.2 -15.6
Apples 1,157 2.3 1,128 2.2 -3.4
Kiwi 1 20 100.0 19 100.0 0.0
Dates 1 42 100.0 40 100.0 0.0
Olives and Olive Oil 4 33 100.0 37 100.0 0.0
Tangerines and Mandarins 64 91.5 56 90.0 -1.6
Figs 17 100.0 18 100.0 0.0
Apricots 1 20 90.2 19 86.2 -4.5
Avocados 1 58 88.2 39 89.6 1.7
California Share of U.S. Agricultural Exports by Category and Commodity, 2013 and 2014Change in California Share
of U.S. Exports 2013 to 2014Total U.S. Export Value
California Percent Share
2013
Total U.S. Export Value
CaliforniaPercent Share
2014
Commodity

California Agricultural Exports, 2014-2015
$1 Million In Percent $1 Million In Percent Percent Change
California Share of U.S. Agricultural Exports by Category and Commodity, 2013 and 2014Change in California Share
of U.S. Exports 2013 to 2014Total U.S. Export Value
California Percent Share
2013
Total U.S. Export Value
CaliforniaPercent Share
2014
Commodity
Tree Nuts 6,790 100.0 7,105 100.0 0.0
Almonds 4,166 100.0 4,532 100.0 0.0
Walnuts 1,380 100.0 1,448 100.0 0.0
Pistachios 1,244 100.0 1,125 100.0 0.0
Vegetables 1,796 62.1 1,750 61.7 -0.7
Lettuce 1 500 75.3 481 70.0 -7.1
Broccoli 1 134 94.4 132 96.4 2.2
Carrots 1 123 86.6 117 87.5 1.1
Tomatoes, Fresh 1 156 28.5 166 31.0 8.5
Celery 97 86.4 82 89.9 4.1
Onions 291 27.1 278 31.4 16.0
Cauliflower 1 140 86.3 136 87.5 1.4
Garlic 32 100.0 35 100.0 0.0
Spinach 107 77.9 119 73.0 -6.4
Bell and Chili Peppers 1 88 31.9 90 30.2 -5.4
Cabbage 1 42 26.1 36 30.8 18.2
Asparagus 33 46.8 32 43.1 -7.8
Artichokes 4 100.0 4 100.0 0.0
Mushrooms 1 49 8.4 43 8.7 3.0
Flowers and Nursery 1 396 25.6 396 24.3 -5.2
Total Principal Commodities 2 50,999 37.3 50,335 37.2 -0.3
Total Other Products and Mixtures 5 93,380 2.8 100,131 2.8 -0.3
Total US Agricultural Exports 2, 6 144,379 14.9 150,466 14.3 -3.9
Source: University of California Agricultural Issues Center.
2 Hides and skins are included in the heading "Beef and Products."3 "Raspberries and Blackberries" category also includes exports of "Mulberries and Loganberries."4 Product category "Olives and Olive Oil" is equal to the product category "Olives and Products" found in previous years' data tables.5 Total "Other Products and Mixtures" is equal to "Total U.S. Agricultural Exports" minus "Total California Principal Commodity Exports."6 Total U.S. agricultural export values come from USDA. USDA defines agriculture to include: live animals, meat, and products of livestock, poultry, and Dairy and products; hides and skins (but not leather products); animal fats and greases; food and feed grains and grain products; oilseeds and oilseed products; fruits, nuts, and vegetables and products of these; juices, wine, and malt beverages (not distilled spirits); essential oils; planting seeds; raw cotton, wool, and other fibers (not manufactured products of these); unmanufactured tobacco (not manufactured tobacco products); sugar and sugar products; coffee, cocoa, tea, and products of these; rubber and allied products; and stock for nurseries and greenhouses, spices, and crude or natural drugs. Fish, shellfish, and forestry products are not included in "agriculture."
1 Export values were revised for 2013 based on updated production data from the U.S. Department of Agriculture/National Agricultural Statistics Service.

California Agricultural Exports, 2014-2015
Commodities 1 and Destinations
Commodities 1 and Destinations
Commodities 1 and Destinations
Almonds (1) 2013 2014 Oranges and Products (9) 2013 2014 Dried Plums (20) 2013 2014European Union 36 38 Canada 24 24 European Union 36 38India 8 10 South Korea 27 23 Japan 16 18China/Hong Kong 13 9 China/Hong Kong 15 17 Canada 7 8United Arab Emirates 7 7 Japan 12 13 China/Hong Kong 9 5Japan 5 6 Other destinations 22 23 Israel <5 5Canada 5 6 Other destinations 30 26Korea <5 5 Raisins (10) 2013 2014Other destinations 25 19 European Union 34 34 Broccoli (21) 2013 2014
Japan 14 13 Canada 63 65Dairy and Products (2) 2013 2014 Canada 10 10 Japan 25 27Mexico 21 27 China/Hong Kong 7 6 Taiwan 9 6China/Hong Kong 11 10 Other destinations 36 36 Other destinations 3 2Philippines 5 8Indonesia 5 5 Strawberries (11) 2013 2014 Cauliflower (22) 2013 2014Japan <5 5 Canada 76 74 Canada 76 73Vietnam <5 5 Japan 8 9 Japan 17 18Canada 11 <5 Mexico 8 8 Taiwan <5 6Other destinations 43 39 Other destinations 8 10 Other destinations 4 4
Walnuts (3) 2013 2014 Beef and Products (12) 3 2013 2014 Carrots (23) 2013 2014European Union 25 32 China/Hong Kong 33 35 Canada 91 92China/Hong Kong 19 13 Japan 35 33 Other destinations 9 8South Korea 7 8 Korea 19 21Turkey 7 8 Taiwan 7 6 Flowers and Nursery (24) 2013 2014Canada 6 7 Other destinations 6 5 Mexico 43 44Japan 6 7 Canada 39 36Vietnam 9 6 Cotton (13) 2013 2014 European Union 9 9Other destinations 19 19 China/Hong Kong 57 33 Other destinations 10 11
Turkey 8 13Wine (4) 2013 2014 Indonesia <5 7 Onions (25) 2013 2014European Union 41 37 South Korea <5 7 Canada 46 46Canada 28 29 India 6 6 Mexico 12 16China/Hong Kong 11 10 Other destinations 21 34 Japan 10 9Japan 7 6 European Union 7 7Other destinations 15 17 Lettuce (14) 2013 2014 Taiwan 6 <4
Canada 88 88 Other destinations 16 18Pistachios (5) 2013 2014 Other destinations 12 12European Union 29 40 Spinach (26) 2013 2014China/Hong Kong 45 32 Hay (16) 2013 2014 Canada 97 96Canada 6 7 Japan 43 43 Other destinations 3 4Other destinations 20 21 China/Hong Kong 19 25
South Korea 15 15 Celery (27) 2013 2014Table Grapes (6) 2013 2014 United Arab Emirates 16 10 Canada 77 74Canada 25 27 Other destinations 6 6 Japan 6 6Hong Kong 15 14 Taiwan 6 6Mexico 10 10 Lemons (17) 2013 2014 China/Hong Kong 4 5Australia 5 6 Canada 31 27 Other destinations 7 9Philippines 5 <5 Japan 30 26Other destinations 40 39 China/Hong Kong 10 16 Plums (28) 2013 2014
South Korea 11 9 Canada 39 44Tomatoes, Processed (7) 2013 2014 European Union <5 6 China/Hong Kong 23 20Canada 34 34 Australia 6 5 Mexico 15 15European Union 15 18 Other destinations 8 11 Taiwan 8 7Mexico 12 10 Other destinations 15 13Japan 5 <5 Peaches and Nectarines (18) 2013 2014Other destinations 35 34 Canada 51 50 Melons (29) 2013 2014
Mexico 22 20 Canada 86 83Rice (8) 2013 2014 Taiwan 14 11 Mexico <5 7Japan 29 35 Australia <5 6 Japan 6 5Turkey 8 12 Other destinations 13 14 Other destinations 8 4Jordan 9 10Canada 7 9 Raspberries and Blackberries (19) 4 2013 2014Taiwan 6 5 Canada 84 85Korea 16 <5 Japan 6 6Other destinations 26 24 European Union 5 <5
Other destinations 5 7
Major Destinations for California Agricultural Exports, 2013 and 2014 1, 2
Percent of Total by Destination
Percent of Total by Destination
Percent of Total by Destination

California Agricultural Exports, 2014-2015
Commodities 1 and Destinations
Commodities 1 and Destinations
Commodities 1 and Destinations
Major Destinations for California Agricultural Exports, 2013 and 2014 1, 2
Percent of Total by Destination
Percent of Total by Destination
Percent of Total by Destination
Blueberries (30) 2013 2014 Avocado (38) 2013 2014 Figs (48) 2013 2014Canada 66 60 Canada 46 52 Canada 55 49China/Hong Kong 8 15 Japan 30 26 Mexico 23 30Japan 9 8 Korea <5 8 Japan 12 10Other destinations 17 17 Singapore <5 5 China/Hong Kong 7 8
Chile 9 0 Other destinations 2 3Tomatoes, Fresh (31) 2013 2014 Other destinations 15 9Canada 77 88 Apricots (50) 2013 2014Mexico 9 10 Grape Juice (39) 2013 2014 Canada 66 61Japan 5 <5 Canada 62 72 Mexico 18 20Other destinations 10 2 Korea 18 10 Japan 8 9
Japan <5 7 Other destinations 8 9Cherries (32) 2013 2014 China/Hong Kong 5 5Canada 32 28 Other destinations 11 5 Asparagus (51) 2013 2014South Korea 18 22 Canada 47 55China/Hong Kong 17 18 Potatoes (40) 2013 2014 Japan 22 24Japan 12 9 Canada 54 48 European Union 8 5Taiwan 6 8 Mexico 18 19 Australia <5 5Other destinations 15 15 Other destinations 28 33 Switzerland 10 <5
Other destinations 9 11Tangerines and Mandarins (33) 2013 2014 Grapefruit (42) 2013 2014Canada 52 56 Japan 40 36 Cabbage (53) 2013 2014Japan 23 16 European Union 29 31 Canada 89 89European Union 15 15 Canada 17 18 Barbados 7 6Other destinations 11 13 South Korea 5 8 Other destinations 3 4
Other destinations 9 8Pears (34) 2013 2014 Cottonseed and Byproducts (55) 2013 2014Canada 62 60 Dry Beans (43) 2013 2014 Mexico 51 39Mexico 18 18 European Union 44 44 South Korea 8 17Other destinations 20 22 Canada 11 13 Saudi Arabia 6 14
Japan 9 10 Japan 7 11Dates (35) 2013 2014 India <5 6 Canada 9 8Australia 39 41 Turkey 8 <5 China/Hong Kong 8 <3Canada 28 30 Iran 6 <5 Other destinations 10 9European Union 10 9 Mexico 5 <5Indonesia 7 <4 Other destinations 17 20 Artichokes (56) 2013 2014Other destinations 15 17 Canada 80 74
Bell and Chili Peppers (44) 2013 2014 Mexico 16 22
Olives and Olive Oil (36) 5 2013 2014 Canada 95 95 Other destinations 5 4Canada 44 38 Other destinations 5 5European Union 18 15Mexico 6 14 Sweet Potatoes (46) 2013 2014Japan 9 8 European Union 59 62Other destinations 24 25 Canada 40 36
Other destinations 1 2Garlic (37) 2013 2014Canada 39 40 Kiwi (47) 2013 2014European Union 14 13 Mexico 54 66Mexico 14 13 Canada 28 23Australia <5 7 European Union 5 <5Japan 8 6 Japan 7 <5Indonesia <5 6 Other destinations 7 11Other destinations 21 16
1 This table shows destinations that receive shares of total exports greater than or equal to 5 percent of each commodity in either 2013 or 2014 for which reliable data are available. 2 Accurate export destination data are only available for 50 of the top 57 commodities. The commodities for which export destinations are not included are apples, chickens, eggs, mushrooms, seeds for sowing, turkey and wheat.3 "Hides and Skins" are included in the heading "Beef and Products." 4 "Raspberries and Blackberries" category also includes exports of "Mulberries and Loganberries."5 Product category "Olives and Olive Oil" is equal to the product category "Olives and Products" found in previous years' data tables.
Source: University of California Agricultural Issues Center.

California Agricultural Exports, 2014-2015
Destination by Rank 2011 2012 Destination by Rank 2011 20121- Canada 3,049.0 3,148.6 3 2- European Union (EU-27) 2,412.2 2,511.3 4
Wine 323.5 364.5 13 Almonds 961.1 1,048.2 9
Lettuce 318.5 302.2 -5 Wine 444.1 463.8 4
Strawberries 272.2 297.8 9 Pistachios 264.7 313.8 19
Table Grapes 206.2 229.3 11 Walnuts 322.3 270.4 -16
Tomatoes, Processed 226.8 220.7 -3 Raisins 132.8 113.6 -14
Almonds 155.5 175.2 13 Tomatoes, Processed 43.4 72.7 68
Oranges and Products 148.5 132.7 -11 Dried Plums 58.3 61.0 5
Raspberries and Blackberries 3 116.8 126.4 8 Rice 28.5 27.2 -5
Carrots 105.2 95.9 -9 Cotton 18.7 14.1 -24
Walnuts 66.6 83.7 26 Dairy Products 2 25.9 11.9 -54
Peaches & Nectarines 73.1 80.9 11 Sweet Potatoes 9.0 11.9 33
Cauliflower 81.8 72.3 -12 Dry Beans 2 6.5 10.6 62
Broccoli 2 62.5 70.1 12 Raspberries and Blackberries 3 5.4 10.1 86
Spinach 2 60.5 68.6 13 Grapefruit 2 10.9 9.6 -12
Pistachios 59.1 68.5 16 Table Grapes 7.1 9.1 28
Dairy products 2 70.7 66.2 -6 Flowers and Nursery 8.5 8.1 -5
Celery 51.3 49.6 -3 Lemons 8.2 6.9 -15
Melons 48.5 49.5 2 Cherries 5.8 6.4 10
Rice 52.0 49.4 -5 Onions 6.0 6.2 4
Lemons 48.8 49.2 1 Strawberries 6.1 5.8 -4
Cherries 36.7 42.2 15 Tangerines and Mandarins 5.8 5.5 -5
Tomatoes, Fresh 34.7 38.1 10 Garlic 3.7 5.1 37
Raisins 36.7 36.4 -1 Dates 5.1 4.6 -10
Onions 32.0 35.0 10 Oranges and Products 8.7 3.7 -58
Flowers and Nursery 35.3 33.4 -5
Blueberries 23.9 30.2 26 3- China/Hong Kong 1,722.4 2,341.0 36
Plums 27.5 29.8 8 Almonds 448.0 648.9 45
Tangerines and Mandarins 30.4 25.7 -16 Pistachios 268.6 475.9 77
Grape Juice 25.9 25.1 -3 Walnuts 168.4 246.1 46
Peppers, Bell and Chili 25.9 23.5 -9 Cotton 118.3 243.5 106
Pears 2 19.3 23.4 21 Wine 172.0 159.6 -7
Avocados 15.6 19.0 21 Dairy Products 2 109.9 121.4 10
Potatoes 22.1 15.7 -29 Table Grapes 110.8 100.6 -9
Dried Plums 13.4 13.1 -2 Oranges and Products 115.5 91.5 -21
Olives and Olive Oil 9.1 12.3 35 Beef and Products 4 69.7 83.2 19
Apricots 9.6 11.6 21 Hay 17.3 35.9 108
Dates 10.3 11.5 12 Raisins 29.2 28.4 -3
Sweet Potatoes 11.1 10.8 -2 Cherries 14.8 26.4 78
Garlic 10.8 10.1 -6 Dried Plums 14.9 14.9 0
Figs 9.7 9.2 -5 Plums 16.0 11.9 -25
Asparagus 7.6 8.5 11 Lemons 10.9 11.0 1
Grapefruit 2 5.5 6.6 20 Rice 2.9 7.2 146
Cabbage 5.1 4.6 -10 Tomatoes, Processed 6.2 5.8 -7
Kiwi 3.7 3.9 5 Blueberries 2.1 4.1 101
Artichokes 3.7 3.6 -2 Peaches and Nectarines 3.2 3.8 19
Dry Beans 2 2.0 3.4 69 Celery 2.6 3.5 34
Beef and products 4 2.1 3.3 59 Strawberries 2.7 3.5 30
Hay 1.3 2.3 71 Lettuce 1.6 2.2 38
Major California Agricultural Exports to the Top 15 Destinations, 2011 and 2012
Approximate Export Value Million Dollars 1 Percent Change2011/2012
Approximate Export Value Million Dollars 1 Percent Change2011/2012
2013 2014 2013 2014
1- European Union (EU-27) 3,305.9 3,706.8 12.1 2- Canada 3,483.5 3,490.5 0.2
Almonds 1,488.2 1,740.5 17.0 Wine 401.9 410.1 2.1
Wine 585.1 516.3 -11.8 Strawberries 299.3 301.3 0.7
Pistachios 357.1 447.2 25.2 Lettuce 332.3 296.2 -10.9
Walnuts 348.7 458.0 31.3 Tomatoes, Processed 231.4 267.2 15.5
Raisins 129.1 139.9 8.4 Almonds 226.8 263.1 16.0
Tomatoes, Processed 102.3 137.0 33.9 Table Grapes 230.9 236.5 2.4
Dried Plums 68.0 63.7 -6.3 Raspberries and Blackberries 2 131.3 145.3 10.6
Dairy and Products 41.5 33.3 -19.8 Oranges and Products 175.9 139.4 -20.7
Rice 24.6 29.8 21.1 Dairy and Products 90.3 99.7 10.4
Sweet Potatoes 17.2 14.5 -15.4 Walnuts 87.5 95.5 9.2
Table Grapes 17.2 19.4 13.2 Carrots 96.5 93.6 -3.0
Cotton 13.9 10.3 -25.6 Peaches and Nectarines 82.1 86.7 5.6
Oranges and Products 13.5 4.0 -70.8 Cauliflower 91.5 86.1 -5.9
Dry Beans 12.5 12.2 -2.4 Spinach 81.1 83.4 2.8
Flowers and Nursery 9.5 8.5 -9.9 Broccoli 79.9 82.7 3.6
Tangerines and Mandarins 8.5 7.7 -9.4 Pistachios 77.2 74.8 -3.1
Grapefruit 8.5 8.5 0.3 Lemons 59.3 66.8 12.7
Raspberries and Blackberries 2 8.0 3.4 -57.6 Rice 51.8 63.0 21.6
Strawberries 6.4 7.0 9.5 Celery 64.2 54.6 -15.0
Lemons 6.3 15.3 142.2 Melons 57.2 53.0 -7.4
Olives and Olive Oil 3 6.0 5.6 -6.5 Tomatoes, Fresh 34.2 45.1 32.1
Onions 5.5 6.3 13.1 Raisins 37.4 41.5 10.9
Garlic 4.4 4.7 6.0 Onions 36.5 40.5 10.9
Cherries 4.4 1.8 -58.9 Flowers and Nursery 39.1 34.4 -12.1
Dates 4.3 3.5 -19.3 Blueberries 34.0 32.9 -3.2
Carrots 2.4 1.2 -52.1 Plums 26.1 28.7 9.9
Tangerines and Mandarins 30.3 28.0 -7.5
Pears 27.6 25.9 -6.3
Bell and Chili Peppers 27.3 25.9 -5.3
Grape Juice 28.7 23.3 -18.9
Avocados 24.0 18.1 -24.7
Dried Plums 14.0 14.2 1.4
Cherries 43.3 14.2 -67.2
Olives and Olive Oil 3 14.3 14.1 -1.3
Garlic 12.5 14.0 12.1
Potatoes 19.0 13.7 -27.8
Dates 11.7 11.9 1.5
Apricots 11.9 10.2 -14.9
Cabbage 9.7 9.8 1.2
Figs 9.6 8.9 -7.4
Sweet Potatoes 11.8 8.3 -29.4
Asparagus 9.2 7.1 -22.0
Grapefruit 4.9 4.9 0.2
Kiwi 5.4 4.4 -17.9
Dry Beans 3.0 3.6 19.0
Artichokes 3.2 2.9 -7.7
Mushrooms 2.4 2.2 -7.2
Hay 2.3 1.9 -18.5
Major California Agricultural Exports to the Top 15 Destinations, 2013 and 2014
Approximate Export Value Million Dollars 1 Percent Change
2013 to 2014
Approximate Export Value Million Dollars 1 Percent Change
2013 to 2014Destination by Rank Destination by Rank

California Agricultural Exports, 2014-2015
2013 2014 2013 2014
Major California Agricultural Exports to the Top 15 Destinations, 2013 and 2014
Approximate Export Value Million Dollars 1 Percent Change
2013 to 2014
Approximate Export Value Million Dollars 1 Percent Change
2013 to 2014Destination by Rank Destination by Rank
3- China/Hong Kong 2,610.3 2,038.0 -21.9 5- Mexico 1,158.3 1,235.9 6.7
Almonds 526.3 402.2 -23.6 Dairy and Products 567.2 618.6 9.1
Pistachios 560.3 362.8 -35.2 Grapes, Table 89.0 92.5 3.9
Dairy and Products 264.7 239.1 -9.7 Almonds 71.7 80.1 11.7
Walnuts 269.0 181.9 -32.4 Tomatoes, Processed 79.4 78.9 -0.6
Beef and Products 4 142.6 140.6 -1.4 Flowers and Nursery 43.2 42.5 -1.5
Wine 152.1 140.2 -7.8 Peaches and Nectarines 35.9 34.2 -4.9
Cotton 324.5 124.4 -61.6 Strawberries 30.2 32.9 8.6
Table Grapes 38.7 120.4 211.4 Walnuts 29.6 27.3 -7.8
Oranges and Products 108.8 97.8 -10.1 Pistachios 23.0 22.9 -0.3
Hay 62.0 71.6 15.4 Rice 17.6 22.4 27.1
Lemons 19.1 39.5 106.2 Raisins 14.4 18.8 30.2
Tomatoes, Processed 24.5 25.8 5.5 Wine 12.0 14.8 23.0
Raisins 26.5 25.7 -3.0 Cotton 13.3 14.7 9.8
Plums 15.4 13.1 -15.0 Onions 9.3 13.8 48.8
Cherries 22.2 9.2 -58.5 Kiwi 10.4 12.9 23.5
Dried Plums 16.4 9.0 -45.0 Lettuce 11.3 10.6 -6.7
Blueberries 0.5 8.1 1,521.6 Plums 10.1 10.1 -0.2
Rice 18.4 4.4 -76.1 Oranges and Products 9.9 9.4 -4.9
Celery 3.4 3.7 8.8 Pears 7.9 7.7 -2.9
Peaches 1.5 2.4 61.4 Beef and Products 4 8.9 5.7 -36.5
Lettuce - 2.3 N/A Figs 4.0 5.5 37.8
Strawberries 2.8 1.7 -38.6 Potatoes 6.3 5.4 -14.5
Grape Juice 2.4 1.7 -28.8 Olives and Olive Oil 3 1.9 5.3 173.2
Tomatoes, Fresh 3.9 5.2 32.5
4- Japan 1,510.6 1,568.6 3.8 Melons 2.7 4.8 76.0
Almonds 220.2 263.1 19.5 Garlic 4.4 4.5 2.1
Rice 201.1 238.3 18.5 Carrots 3.3 3.9 16.0
Beef and Products 4 152.9 132.5 -13.3 Dried Plums 3.2 3.7 17.5
Hay 144.9 125.2 -13.6 Lemons 1.6 3.4 109.8
Dairy and Products 96.3 125.5 30.3 Apricots 3.3 3.3 -0.9
Wine 95.0 83.5 -12.1 Cottonseed Oil 7.8 3.1 -60.7
Oranges and Products 88.4 72.7 -17.8 Spinach 1.8 2.8 52.6
Walnuts 83.2 106.6 28.1 Raspberries and Blackberries 2 1.1 2.1 92.0
Lemons 56.6 64.7 14.3 Cherries 3.4 1.2 -65.6
Raisins 52.1 54.8 5.1
Strawberries 31.9 34.9 9.1 6- Korea 983.1 802.8 -18.3
Tomatoes, Processed 31.4 35.7 13.5 Almonds 171.6 212.6 23.9
Dried Plums 31.2 30.3 -3.1 Oranges and Products 191.9 133.7 -30.3
Broccoli 30.9 33.9 9.7 Walnuts 102.5 120.9 18.0
Table Grapes 28.0 22.4 -20.0 Dairy and Products 69.5 90.9 30.7
Cauliflower 20.2 21.4 5.9 Beef and Products 4 83.7 85.2 1.8
Pistachios 20.2 23.8 17.6 Hay 50.7 44.6 -11.9
Cherries 16.7 4.6 -72.2 Rice 111.0 32.4 -70.8Avocados 15.6 9.1 -41.3 Cotton 17.8 26.1 46.6Tangerines and Mandarins 13.2 8.0 -39.5 Table Grapes 18.1 24.7 36.7
Grapefruit 11.4 10.0 -12.8 Lemons 21.5 23.1 7.0
Raspberries and Blackberries 2 9.6 10.4 8.3 Tomatoes, Processed 16.8 19.6 16.9
Onions 8.0 7.8 -1.9 Wine 16.2 18.1 11.7
Cotton 6.5 11.2 71.4 Raisins 10.7 11.5 7.0
Celery 5.3 4.3 -19.0 Cherries 23.8 11.4 -52.2
Blueberries 4.7 4.5 -3.2 Pistachios 9.4 8.0 -14.6
Asparagus 4.3 3.2 -25.3 Strawberries 5.5 6.0 9.1
Melons 4.0 3.3 -19.0 Dried Plums 3.5 4.2 19.2
Lettuce 3.2 2.0 -35.6 Grape Juice 8.5 3.3 -61.7
Olives and Olive Oil 3 2.8 2.9 3.3 Lettuce 3.2 3.1 -4.5
Garlic 2.6 2.2 -17.9 Avocados 1.9 2.8 48.0Dry Beans 2.5 2.9 14.5 Blueberries 1.9 2.3 19.0Figs 2.1 1.9 -11.3 Grapefruit 1.6 2.1 33.5Tomatoes, Fresh 2.0 0.2 -87.6
Grape Juice 1.6 2.4 50.1
California Agricultural Exports, 2014-2015
2013 2014 2013 2014
Major California Agricultural Exports to the Top 15 Destinations, 2013 and 2014
Approximate Export Value Million Dollars 1 Percent Change
2013 to 2014
Approximate Export Value Million Dollars 1 Percent Change
2013 to 2014Destination by Rank Destination by Rank
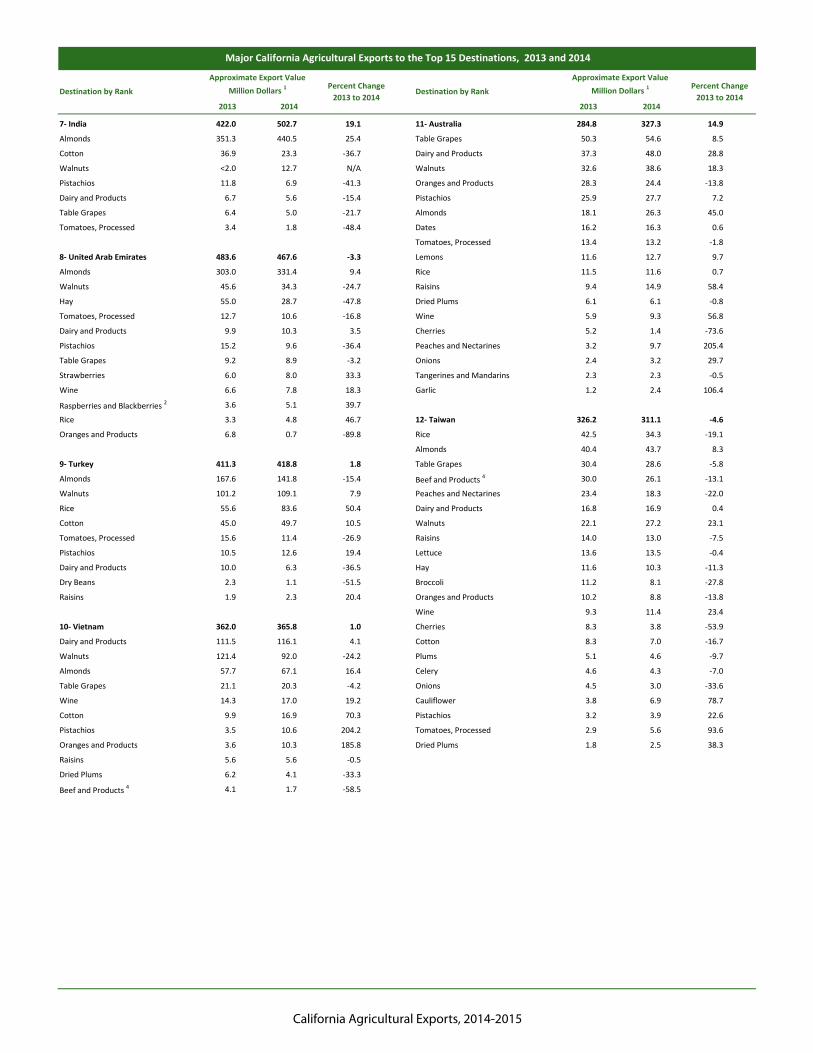
7- India 422.0 502.7 19.1 11- Australia 284.8 327.3 14.9
Almonds 351.3 440.5 25.4 Table Grapes 50.3 54.6 8.5
Cotton 36.9 23.3 -36.7 Dairy and Products 37.3 48.0 28.8
Walnuts <2.0 12.7 N/A Walnuts 32.6 38.6 18.3
Pistachios 11.8 6.9 -41.3 Oranges and Products 28.3 24.4 -13.8
Dairy and Products 6.7 5.6 -15.4 Pistachios 25.9 27.7 7.2
Table Grapes 6.4 5.0 -21.7 Almonds 18.1 26.3 45.0
Tomatoes, Processed 3.4 1.8 -48.4 Dates 16.2 16.3 0.6
Tomatoes, Processed 13.4 13.2 -1.8
8- United Arab Emirates 483.6 467.6 -3.3 Lemons 11.6 12.7 9.7
Almonds 303.0 331.4 9.4 Rice 11.5 11.6 0.7
Walnuts 45.6 34.3 -24.7 Raisins 9.4 14.9 58.4
Hay 55.0 28.7 -47.8 Dried Plums 6.1 6.1 -0.8
Tomatoes, Processed 12.7 10.6 -16.8 Wine 5.9 9.3 56.8
Dairy and Products 9.9 10.3 3.5 Cherries 5.2 1.4 -73.6
Pistachios 15.2 9.6 -36.4 Peaches and Nectarines 3.2 9.7 205.4
Table Grapes 9.2 8.9 -3.2 Onions 2.4 3.2 29.7
Strawberries 6.0 8.0 33.3 Tangerines and Mandarins 2.3 2.3 -0.5
Wine 6.6 7.8 18.3 Garlic 1.2 2.4 106.4
Raspberries and Blackberries 2 3.6 5.1 39.7
Rice 3.3 4.8 46.7 12- Taiwan 326.2 311.1 -4.6
Oranges and Products 6.8 0.7 -89.8 Rice 42.5 34.3 -19.1
Almonds 40.4 43.7 8.3
9- Turkey 411.3 418.8 1.8 Table Grapes 30.4 28.6 -5.8
Almonds 167.6 141.8 -15.4 Beef and Products 4 30.0 26.1 -13.1
Walnuts 101.2 109.1 7.9 Peaches and Nectarines 23.4 18.3 -22.0
Rice 55.6 83.6 50.4 Dairy and Products 16.8 16.9 0.4
Cotton 45.0 49.7 10.5 Walnuts 22.1 27.2 23.1
Tomatoes, Processed 15.6 11.4 -26.9 Raisins 14.0 13.0 -7.5
Pistachios 10.5 12.6 19.4 Lettuce 13.6 13.5 -0.4
Dairy and Products 10.0 6.3 -36.5 Hay 11.6 10.3 -11.3
Dry Beans 2.3 1.1 -51.5 Broccoli 11.2 8.1 -27.8
Raisins 1.9 2.3 20.4 Oranges and Products 10.2 8.8 -13.8
Wine 9.3 11.4 23.4
10- Vietnam 362.0 365.8 1.0 Cherries 8.3 3.8 -53.9
Dairy and Products 111.5 116.1 4.1 Cotton 8.3 7.0 -16.7
Walnuts 121.4 92.0 -24.2 Plums 5.1 4.6 -9.7
Almonds 57.7 67.1 16.4 Celery 4.6 4.3 -7.0
Table Grapes 21.1 20.3 -4.2 Onions 4.5 3.0 -33.6
Wine 14.3 17.0 19.2 Cauliflower 3.8 6.9 78.7
Cotton 9.9 16.9 70.3 Pistachios 3.2 3.9 22.6
Pistachios 3.5 10.6 204.2 Tomatoes, Processed 2.9 5.6 93.6
Oranges and Products 3.6 10.3 185.8 Dried Plums 1.8 2.5 38.3
Raisins 5.6 5.6 -0.5
Dried Plums 6.2 4.1 -33.3
Beef and Products 4 4.1 1.7 -58.5
California Agricultural Exports, 2014-2015
2013 2014 2013 2014
Major California Agricultural Exports to the Top 15 Destinations, 2013 and 2014
Approximate Export Value Million Dollars 1 Percent Change
2013 to 2014
Approximate Export Value Million Dollars 1 Percent Change
2013 to 2014Destination by Rank Destination by Rank
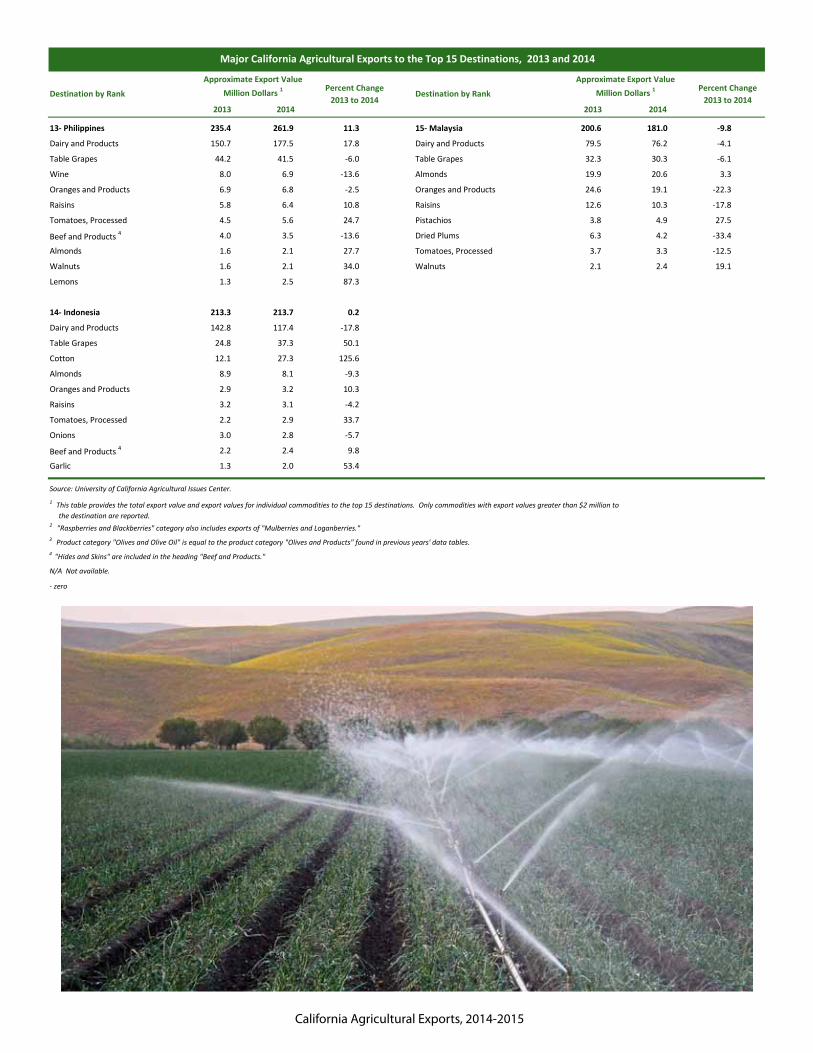
13- Philippines 235.4 261.9 11.3 15- Malaysia 200.6 181.0 -9.8
Dairy and Products 150.7 177.5 17.8 Dairy and Products 79.5 76.2 -4.1
Table Grapes 44.2 41.5 -6.0 Table Grapes 32.3 30.3 -6.1
Wine 8.0 6.9 -13.6 Almonds 19.9 20.6 3.3
Oranges and Products 6.9 6.8 -2.5 Oranges and Products 24.6 19.1 -22.3
Raisins 5.8 6.4 10.8 Raisins 12.6 10.3 -17.8
Tomatoes, Processed 4.5 5.6 24.7 Pistachios 3.8 4.9 27.5
Beef and Products 4 4.0 3.5 -13.6 Dried Plums 6.3 4.2 -33.4
Almonds 1.6 2.1 27.7 Tomatoes, Processed 3.7 3.3 -12.5
Walnuts 1.6 2.1 34.0 Walnuts 2.1 2.4 19.1
Lemons 1.3 2.5 87.3
14- Indonesia 213.3 213.7 0.2
Dairy and Products 142.8 117.4 -17.8
Table Grapes 24.8 37.3 50.1
Cotton 12.1 27.3 125.6
Almonds 8.9 8.1 -9.3
Oranges and Products 2.9 3.2 10.3
Raisins 3.2 3.1 -4.2
Tomatoes, Processed 2.2 2.9 33.7
Onions 3.0 2.8 -5.7
Beef and Products 4 2.2 2.4 9.8
Garlic 1.3 2.0 53.4
N/A Not available.
- zero
Source: University of California Agricultural Issues Center.
4 "Hides and Skins" are included in the heading "Beef and Products."
1 This table provides the total export value and export values for individual commodities to the top 15 destinations. Only commodities with export values greater than $2 million to the destination are reported. 2 "Raspberries and Blackberries" category also includes exports of "Mulberries and Loganberries."3 Product category "Olives and Olive Oil" is equal to the product category "Olives and Products" found in previous years' data tables.

California Agricultural Exports, 2014-2015
Rank EU-27 Member 1 Almonds Wine Pistachios Walnuts Raisins Total 3
1 Germany 422 72 80 158 33 63 828
2 Spain 557 2 23 118 1 25 726
3 United Kingdom 103 214 16 17 50 75 474
4 Netherlands 165 23 99 56 13 81 436
5 Italy 166 47 22 91 <1 105 431
6 Belgium 77 26 148 8 4 16 280
7 France 80 38 32 1 2 14 168
8 Sweden 22 25 <1 6 17 10 79
9 Denmark 31 28 <1 <1 11 2 72
10 Luxembourg <1 <1 13 <1 <1 <1 13
Other EU Members 4 117 41 14 4 9 14 198
Total 3 1,741 516 447 458 140 405 3,707
1 Germany 372 102 71 118 34 65 763
2 Spain 485 1 31 92 1 22 631
3 United Kingdom 84 249 14 10 41 74 472
4 Italy 129 45 19 85 <1 90 369
5 Netherlands 148 21 65 29 12 84 358
6 Belgium 65 22 75 3 3 29 198
7 France 73 38 25 2 1 17 155
8 Sweden 21 41 1 5 19 11 97
9 Denmark 26 33 <1 <1 9 6 74
10 Luxembourg <1 <1 50 <1 <1 <1 50
Other EU Members 4 86 32 8 5 9 35 140
Total 3 1,488 585 357 349 129 403 3,306
Major California Agricultural Exports to the European Union (EU), 2013 and 2014 (Approximate Export Value, $Millions)
3 Accurate export destination data is only available for 50 of the top 57 commodities. The commodities for which export destinations are not included are apples, chickens, eggs, mushrooms, seeds for sowing, turkey, and wheat. Totals may not equal due to rounding.4 The other 17 EU members include Austria, Bulgaria, Cyprus, Czech Republic, Estonia, Finland, Greece, Hungary, Ireland, Latvia, Lithuania, Malta, Poland, Portugal, Romania, Slovak Republic, and Slovenia. All these countries combined account for just over 5 percent of California agricultural exports to the EU.
1 The EU-27 members to which California exports are shipped reflect only the initial destination of the product, not the EU country of consumption. Many products are distributed throughout the EU after the initial entry.2 " Other Principal Products" are those that individually account for less than $100 million in export value to the EU.
Other Principal Products 2
2014
2013
Source: University of California Agricultural Issues Center.

California Agricultural Exports, 2014-2015
Farm-Gate Units
Almonds 2 cwt. 13,347 20,100 0.66 12,621 18,700 0.67
Apples cwt. 772 2,700 0.29 793 2,400 0.33
Apricots 2 short tons 11 54 0.21 9 55 0.16
Artichokes 2 cwt. 51 959 0.05 46 949 0.05
Asparagus cwt. 4 368 0.01 4 341 0.01
Avocados 2 short tons 21 149 0.14 11 164 0.07
Beef and Products 2, 3 liveweight cwt. 1,882 20,388 0.09 1,593 18,948 0.08
Bell and Chili Peppers cwt. 403 11,105 0.04 339 12,428 0.03
Blueberries cwt. 242 514 0.47 258 552 0.47
Broccoli 2 cwt. 2,446 20,460 0.12 2,465 20,130 0.12
Cabbage 2 cwt. 300 5,670 0.05 344 6,888 0.05
Carrots 2 cwt. 2,138 22,323 0.10 2,032 23,084 0.09
Cauliflower 2 cwt. 2,425 5,868 0.41 2,368 6,272 0.38
Celery cwt. 2,386 16,968 0.14 2,441 17,408 0.14
Cherries short tons 36 79 0.45 15 29 0.53
Cotton 2 bales 1,043 943 1.11 887 755 1.18
Cottonseed and Byproducts 2 short tons 61 355 0.17 34 292 0.11
Dairy and Products 4 cwt. 123,430 412,201 0.30 118,420 423,051 0.28
Dates 2 short tons 7 31 0.22 6 29 0.22
Dried Plums short tons 236 255 0.93 204 312 0.65
Dry Beans cwt. 658 1,150 0.57 737 1,040 0.71
Eggs 2 100-dozens 95 4,207 0.02 95 3,793 0.02
Figs 2 short tons 14 33 0.41 16 32 0.51
Garlic cwt. 670 3,795 0.18 741 3,795 0.20
Grapefruit 2 short tons 74 154 0.48 67 152 0.44
Grapes, All 2, 5 short tons 1,576 7,742 0.20 1,607 6,822 0.24
Hay 2 short tons 1,234 5,810 0.21 1,024 5,688 0.18
Kiwi 2 short tons 11 27 0.39 12 27 0.44
Lemons 2 76lb boxes 3,652 19,789 0.18 3,833 21,579 0.18
Lettuce 2 cwt. 5,754 65,115 0.09 5,257 61,010 0.09
Melons 2 cwt. 2,340 21,280 0.11 2,223 17,268 0.13
Olives and Olive Oil 6 short tons 51 166 0.31 55 94 0.59
Onions 2 cwt. 3,674 18,242 0.20 4,328 22,856 0.19
Oranges and Products 2 short tons 934 1,980 0.47 729 1,960 0.37
Peaches and Nectarines cwt. 1,751 15,960 0.11 1,584 16,260 0.10
Pears short tons 33 220 0.15 29 189 0.15
Plums short tons 53 103 0.52 47 113 0.41
Potatoes 2 cwt. 1,794 14,369 0.12 1,355 15,694 0.09
Raspberries and Blackberries 2, 7 cwt. 545 1,075 0.51 597 1,450 0.41
Rice 2 cwt. 22,400 47,641 0.47 18,225 36,993 0.49
Spinach 2 cwt. 617 4,731 0.13 603 5,265 0.11
Strawberries 2 cwt. 3,117 27,573 0.11 3,022 27,577 0.11
Sweet Potatoes cwt. 855 6,840 0.13 639 5,225 0.12
Tangerines and Mandarins 2 short tons 44 588 0.07 35 728 0.05
Tomatoes, Fresh 2 cwt. 570 10,200 0.06 641 10,175 0.06
Tomatoes, Processed short tons 3,709 12,100 0.31 4,064 14,010 0.29
Turkey liveweight cwt. 167 3,653 0.05 173 3,102 0.06
Walnuts 2 short tons 321 492 0.65 299 570 0.52
Wheat 2 bushels 4,350 32,500 0.13 1,758 17,025 0.10
Weighted Average 8 0.27 0.27
Source: University of California Agricultural Issues Center.
2 Quantities for 2013 were revised based on updated production data from the U.S. Department of Agriculture/National Agricultural Statistics Service.
6 Product category "Olives and Olive Oil" is equal to the product category "Olives and Products" found in previous years' data tables.
Ratio of California Farm Quantity Exported to Farm Quantity Produced, 2013 and 2014
(Export volumes in farm weight basis)2013 2014
Commodity Quantity Exported 1 Quantity ProducedRatio of Quantity
Exported to Quantity Produced
Quantity Exported 1 Quantity Produced
5 "Grapes, All" includes grape juice, raisins, table grapes, and wine.
7 "Raspberries and Blackberries" category also includes exports of "Mulberries and Loganberries."8 The weighted average is based on each of the 53 commodity's share of production value. Values for chickens, flowers and nursery products, mushrooms and seeds for sowing are not included because reliable data on export quantity is not available.
Ratio of Quantity Exported to Quantity
Produced1,000 Farm-Gate Units 1,000 Farm-Gate Units
1 Export quantities of processed goods were converted to farm fresh quantities using conversion factors published by UDSA ERS (http://www.ers.usda.gov/publications/ah697/) or annual conversion factors published by USDA NASS in annual crop summaries.
3 "Hides and Skins" are included in the heading "Beef and Products."4 Farm quantity exported for "Dairy and Products" is calculated by converting cheese, condensed milk, fluid milk, ice cream, nonfat dry milk, and whole dry milk to their fluid milk equivalents.


