Energy Research and Development Division FINAL PROJECT REPORT CALIFORNIA AUTONOMOUS UNMANNED AERIAL VEHICLE AIR POLLUTION PROFILING STUDY DECEMBER 2009 CEC-500-2011-039 Prepared for: California Energy Commission Prepared by: Scripps Institution of Oceanography
Transcript
E n e r g y R e s e a r c h a n d D e v e l o p m e n t D i v i s i o n F I N A L P R O J E C T R E P O R T
CALIFORNIA AUTONOMOUS UNMANNED AERIAL VEHICLE AIR POLLUTION PROFILING STUDY
DECE MBER 2009 CE C-500-2011-039
Prepared for: California Energy Commission Prepared by: Scripps Institution of Oceanography
PREPARED BY: Primary Author(s): Craig Corrigan V. Ramanathan Scripps Institute of Oceanography La Jolla, CA 92093 Contract Number: 500-07-014 Prepared for: California Energy Commission Guido Franco Contract Manager Linda Spiegel Office Manager Energy Generation Research Office Laurie ten Hope Deputy Director ENERGY RESEARCH AND DEVELOPMENT DIVISION Robert P. Oglesby Executive Director
DISCLAIMER This report was prepared as the result of work sponsored by the California Energy Commission. It does not necessarily represent the views of the Energy Commission, its employees or the State of California. The Energy Commission, the State of California, its employees, contractors and subcontractors make no warranty, express or implied, and assume no legal liability for the information in this report; nor does any party represent that the uses of this information will not infringe upon privately owned rights. This report has not been approved or disapproved by the California Energy Commission nor has the California Energy Commission passed upon the accuracy or adequacy of the information in this report.
ACKNOWLEDGEMENTS
The author acknowledges all those who assisted in the sample collection and analysis, as well as the data analysis: MV Ramana, Aihua Zhu, Katrin Lehmann, Odelle Hadley, and Thomas Kirchstetter. Furthermore, the author thanks Guido Franco and the California Energy Commission for funding this project. The author also would like to acknowledge Mike Marston at NASA Dryden and the flight team from Advanced Ceramics Research and Latitude Engineering for their valuable assistance in getting the aircraft off the ground for each mission.
i
PREFACE
The California Energy Commission Energy Research and Development Division supports public interest energy research and development that will help improve the quality of life in California by bringing environmentally safe, affordable, and reliable energy services and products to the marketplace.
The Energy Research and Development Division conducts public interest research, development, and demonstration (RD&D) projects to benefit California.
The Energy Research and Development Division strives to conduct the most promising public interest energy research by partnering with RD&D entities, including individuals, businesses, utilities, and public or private research institutions.
Energy Research and Development Division funding efforts are focused on the following RD&D program areas:
• Buildings End-Use Energy Efficiency
• Energy Innovations Small Grants
• Energy-Related Environmental Research
• Energy Systems Integration
• Environmentally Preferred Advanced Generation
• Industrial/Agricultural/Water End-Use Energy Efficiency
• Renewable Energy Technologies
• Transportation
California Autonomous Unmanned Aerial Vehicle Air Pollution Profiling Study is the final report for the Evaluating Past and Improving Present and Future Measurements of Black Carbon Particles in the Atmosphere project (Contract Number 500-07-014) conducted by Scripps Institution of Oceanography. The information from this project contributes to Energy Research and Development Division’s Energy-Related Environmental Research Program.
For more information about the Energy Research and Development Division, please visit the Energy Commission’s website at www.energy.ca.gov/research/ or contact the Energy Commission at 916-327-1551.
Measuring aerosol and gas phase pollutants at the surface level only provides partial information for both climate and air pollution studies. Remote sensing satellites typically provide column integrated measurements (surface to top of atmosphere) and are very limited in their ability to provide resolved vertical profiles. Information on the vertical distribution of these atmospheric components is important for properly answering questions concerning their impact on regional climate. The California Autonomous Unmanned Aerial Vehicle Air Pollution Profiling Study is the first study of its kind in California to collect routine vertical profiles of aerosol, black carbon, and ozone pollutants in conjunction with solar radiation measurements using lightweight autonomous unmanned aerial vehicles. The amount of black carbon particulate matter above semi-rural desert and coastal Southern California during April-May of 2008 was between zero and 100 nanograms per meter cubed up to four kilometers altitude. Measurements during the summer and fall also showed black carbon concentrations below 100 nanograms per meter cubed above two kilometers altitude except during wildfire events in July 2008 when concentrations were as high as 400 nanograms per meter cubed above two kilometers.
The average observed ozone concentrations above National Aeronautics and Space Administration Dryden and Vandenberg Air Force Base demonstrated modest variability over the various flights and were roughly twice the background level typically measured over remote surface locations (25-40 parts-per-billion). The highest event of ozone concentration was observed in July and corresponded to the highly polluted wildfire events. The effect on climate in California could be substantial considering that smoke blanketed large regions of the state for the weeks and months that these fires persisted.
Keywords: Black carbon, vertical profiles, ozone, wildfires, radiative forcing
Please use the following citation for this report:
Corrigan, Craig; Ramanathan, V. (Scripps Institute of Technology). 2009. California Autonomous Unmanned Aerial Vehicle Air Pollution Profiling Study. California Energy Commission. Publication Number: CEC-500-2011-039.
iii
TABLE OF CONTENTS
Acknowledgements ................................................................................................................................... i
PREFACE ................................................................................................................................................... ii
ABSTRACT .............................................................................................................................................. iii
TABLE OF CONTENTS ......................................................................................................................... iv
LIST OF FIGURES .................................................................................................................................... v
LIST OF TABLES .................................................................................................................................... vi
Figure ES-1: The ACR Manta Lightweight Unmanned Aircraft ......................................................... 2
Figure 1: Aerosol Optical Depth Shows Significant Transport Of Particulate Pollution from Asia To North America During Spring 2001. Aerosol Optical Depth Data From MODIS Instrument On NASA Aqua Satellite. (From Hadley Et Al, 2006) ........................................................................... 7
Figure 2: Vertical Distribution Showing Fraction Of Asian BC Versus Total BC. The Region Between 30N And 42N Covers California. (From Hadley Et Al, 2006) .............................................. 8
Figure 3: California Department Of Forestry Map For Wild Fire Occurrences In California ......... 9
Figure 4: Map Of Flight Locations. The Green Star Is Vandenberg AFB And The Yellow Star Is The NASA Dryden Research Center At Edwards AFB. ..................................................................... 11
Figure 5: The ACR Manta Lightweight Unmanned Aircraft ............................................................. 12
Figure 6: Miniaturized AUAV Instruments For Aerosol, Radiometric And Ozone Measurements .................................................................................................................................................................... 14
Figure 7: Payload Bay For Instrumented Aerosol Radiometric AUAV ........................................... 15
Figure 8: Vertical Profiles Of Ozone Over NASA Dryden (May – Aug) And Vandenberg (Nov) During 2008 ............................................................................................................................................... 18
Figure 9: Vertical Profiles Of Total Particle Concentration (#/cm3) During The CAPPS project. Flight dates Are Expressed As YYYYMMDD ...................................................................................... 19
Figure 10: Vertical Profiles of The Apparent Black Carbon Concentrations Over NASA Dryden And Vandenberg AFB In California. The Legend Format Is YYYYMMDD .................................... 19
Figure 11: The Prevalence And Intensity Of Wildfires In California In Late June 2009 ................ 22
Figure 12: Satellite Images Of Fire Fronts (Red) And Smoke Plumes Over The State Of California On a.) June 30, 2009 and b.) July 10, 2009. Star Indicates Location Of Flight Area At NASA Dryden. Images Obtained From earthobservatory.nasa.gov ........................................................... 23
Figure 13: MODIS Aerosol Optical Depth At 550 nm Over California On July 10, 2008 ............... 23
Figure 14: Vertical Profiles Over NASA Dryden On July 10, 2008 Showing a.) Total Particle Concentration And b.) Coarse Particle Size Distribution (0.3 – 3.0 µm) .......................................... 24
Figure 15: Vertical Profile Of Aerosol Absorption At Three Wavelengths Over NASA Dryden On July 10, 2008 During Wildfire Events .............................................................................................. 25
v
Figure 16: Comparison Of Measured And Simulated Absorption (In The Visible Region) Occurring In The Atmospheric Layers Of The Lower Troposphere Over NASA Dryden On July 10, 2008 ...................................................................................................................................................... 26
Figure 17: Diurnal Averages Of Forcing (In The Broadband And Visible Region) From Aerosols Over NASA Dryden On July 10, 2008 During Wildfire events. Values Are In W/m2 And Values In Parentheses Indicate The Percentage Of Aerosol Forcing Relative To The Background Atmosphere Without Aerosols .............................................................................................................. 27
LIST OF TABLES
Table 1: Parameters Measured During CAPPS Flights And The Corresponding Instrumentation .................................................................................................................................................................... 13 Table 2: Scientific Missions Flown During CAPPS Project ................................................................ 17
vi
EXECUTIVE SUMMARY
Introduction California has taken an active interest in its role in global and regional climate change. The potential impacts of climate change are still being debated, but possible outcomes regularly appearing in the literature include altered weather patterns such as drought and floods, beach erosion, reduced agricultural yields, and altered energy requirements. A better understanding of climate change potential requires a better understanding of the concentrations and sources of climate-relevant pollutants. Measurements collected only at the surface do not capture the detailed atmospheric information needed by climate models. Satellite measurements are unable to provide the necessary vertical resolution to validate climate models. Identifying the vertical distribution of black carbon, aerosols, ozone and other relevant atmospheric components provides a necessary step in understanding the regional radiative forcing (the change in the difference between the incoming and outgoing radiation energy) occurring over California.
In addition to the pollutants being introduced by California’s residents and industries, some pollutants originate from outside California. The long-range transport of pollution into California is more significant at high altitudes where the jet stream is located. The substantial amount of climate relevant pollutants released by wildfires may also largely overshadow the contribution of local and long-range pollutants while these fires are occurring.
Project Purpose The purpose of this project was to determine the vertically-resolved concentrations of aerosol, black carbon, and ozone above California over several seasons. These observations were performed between the surface and 3700 meters above sea level (masl). The information can be applied towards models that need vertically-resolved parameters to more accurately estimate radiative forcing. A few occurrences of highly polluted events (wildfires) allowed for the direct observation of solar absorption by layers of the atmosphere that can be applied towards estimating the contribution of wildfire smoke towards statewide radiative forcing.
The objective of the California Air Pollution Profiling Study was to observe the temporal cycle of pollution over California at multiple altitudes. Four objectives were addressed:
1. Collect a record of aerosol, black carbon, and ozone pollution concentrations from the surface up to 3600 masl (12,000 feet above sea level) during different seasons.
2. Discriminate between California-generated pollution and long-range transport from other regions based on concentrations and back trajectories.
3. Analyze the impact of pollution layers on radiative forcing to quantify the amount of solar absorption by the atmosphere and surface dimming.
4. Deploy and validate novel miniaturized instruments and unmanned aerial vehicle platforms for advanced, state-of-the-art measurements.
1
Figure ES-1: The ACR Manta Lightweight Unmanned Aircraft
Project Results A total of 12 aerosol profile missions and six ozone profile missions were flown by unmanned aircraft between April 2008 and November 2008 at NASA Dryden Research Center and Vandenberg Air Force Base, both of which are located approximately 100 kilometers north of Los Angeles. One aerosol mission to sample wildfire plumes in July 2008 involved operating two aircraft simultaneously in a stacked formation to obtain direct measurements of solar absorption by layers of the atmosphere and addressed objective three. A final flight at NASA Dryden was conducted in September 2009 to capture more wildfire plumes resulting from a large wildfire near Pasadena.
Vertical profiles of black carbon concentration, aerosol absorption, total particle concentration and ozone concentration were obtained over California for the first time using instrumented, lightweight, unmanned aircraft. The initial five missions were conducted during April, a month that is characterized by significant long-range transport of particulates from Asia to North America. Black carbon was either below or at detectable limits at higher altitudes (up to four kilometers above sea level), especially if the sampling went above the boundary layer where long range transport typically occurs. The amount of black carbon particulate matter above the sampled regions of Southern California during April-May of 2008 was between zero and 100 nanograms per meter cubed, with the range being mainly a reflection of the noise level and minimum sensitivity of the instrument. Using the black carbon source partition given in Hadley et al (2006), the amount of black carbon up to the four kilometer altitude originating from Asia would be between 0 and 75 nanograms per meter cubed. Flights at Vandenberg Air Force Base with less continental influence and a lower boundary layer produced equivalent results, but sampling at that location was only attempted in November 2008.
The extensive wildfire events throughout the state in the summer of 2008 provided the opportunity to measure for the first time the radiative forcing from aged regional wildfire haze by using stacked aircraft. The measurements produced estimates of +25.3 watts per meter squared of forcing in the atmosphere and -31 watts per meter squared of forcing at the surface (in the broadband region), which would create a more stable atmosphere as it reduced the amount of convection. The resulting climate forcing may be significant given that smoke from wildfires was prevalent throughout the state for several months out of the year. Further
2
modeling that encompasses the smoke blanketing the entire state may provide insights regarding the overall climate forcing from wildfires by using these measurements.
The research team recommended that additional research should include:
• A continuation of model simulations to assess the impact of wildfire smoke on radiative forcing could be expanded to a statewide level (or even larger).
• Better detection of black carbon at high altitudes would benefit from improving the sensitivity of absorption and black carbon instrumentation deployed for vertical profiling.
• Flight permissions at a location farther north would allow the possibility to sample higher concentrations of the long-range transport plume from Asia. These flight permissions should include the ability to operate two aircraft simultaneously in stacked formation.
• The ability to sample at higher altitudes would produce more valuable vertical profiles that would capture more long-range transport, but would require modifications to both flight permissions and aircraft design.
Project Benefits The results of this study offered a step towards a better understanding of the vertical distribution of pollutants over California, some of which have origins in Asia and Mexico. The results will serve to better constrain models that estimate radiative forcing and climate change. In addition, the direct observation of radiative forcing by aged wildfire plumes may with understanding the overall impact of wildfire emissions on climate forcing when combined with models. Climate change will affect energy demand and generation. Having improved estimations of how climate change would manifest in California is crucial for adapting the state’s energy system to the new climate regimes.
3
CHAPTER 1: Introduction The California autonomous unmanned aerial vehicles Air Pollution Profiling Study (CAPPS) is the first study of its kind in California to collect routine vertical profiles of aerosol, black carbon, and ozone pollutants in conjunction with solar radiation measurements. Moreover, CAPPS was the first study of its kind anywhere to incorporate lightweight autonomous unmanned aerial vehicles (AUAV) in routine atmospheric measurements.
1.1 Identification of the Problem Concern over climate change is of increasing public interest since the consequences can be far reaching. Climate change is closely associated with air pollution, which makes it an important topic to California. Air pollution in California arises from the combination of the energy needs of a large population and its unique regional meteorology/climate. The large population requires power generation, accompanying industry, and a vast transportation system focused at the individual level (i.e., automobiles). Adding to the pollution caused by the large population are the effects of a dry climate that promotes the occurrence of wild fires and a characteristic meteorology (in Southern California) that has a tendency to retain pollution within the region rather than exporting it. Recently, the contribution of pollution transported across the Pacific from the Asian continent has also been identified as a significant source of pollution in California (Hadley et al, 2006). The effects of this pollution have traditionally applied to the areas of health, visibility, agricultural yields and acid rain; however, concerns also extend to the regional climate such as the dimming of the amount of sunlight that reaches the ground, atmospheric heating or cooling due to the aerosol reflecting and absorbing sunlight, reduced snowfall, and even the accelerated melting of the winter snowpack. (Hansen and Nazarenko, 2004) These outcomes can in turn affect many factors important to the citizens of California such as agricultural plant growth, solar- and hydropower generation, and even the frequency of forest fires (Jacobson, 2004; Westerling et al, 2006).
Both an increase of heat retaining gases (i.e., greenhouse gases) and the modification of the amount of solar radiation reaching the surface may result in changes to the climate. This process of altering the amount of solar energy reflected or retained by the atmosphere is termed radiative forcing. Combustion of fossil fuels creates carbon dioxide gas (CO2), the most common greenhouse gas, and other minor climate influencing gases such as ozone, carbon monoxide (CO) and hydrocarbons. Tropospheric ozone, a photolysis byproduct of nitrogen oxides and hydrocarbon pollution, is typically of concern for its effect on health and as an oxidant that accelerates the degradation of materials such as rubber. In addition, ozone is a significant greenhouse gas that contributes about 20 percent of the solar radiative forcing associated with carbon dioxide gas; therefore, ozone has a significant effect on climate change (IPCC, 2007). Moreover, ozone plays a substantial role in the formation of airborne particulate pollution, which also serves an important role in climate change. Ozone is routinely measured at the surface as part of ubiquitous air quality monitoring systems that exist in every part of the country. Studies over the East Coast of the US to measure gas concentrations at altitude using
5
manned aircraft have found that the concentration of ozone in the free troposphere was not directly influenced by the concentrations below the boundary layer (Taubman et al, 2006.) The vertical distribution of ozone was most associated with long-range transport from other regions.
Particulate pollution also has the ability to affect climate (Charlson et al, 1992) and the hydrological cycle (Ramanathan et al 2001). Particles change climate via three pathways: 1.) scattering incoming solar radiation back into space (cooling direct effect), 2.) black material (soot) absorbs light and heats the surrounding air (heating direct effect), and 3.) altering the reflectivity and lifetime of clouds (indirect effect) (Twomey, 1977; Lohmann and Feichter, 2005). Consequently, the chemistry and the color (i.e., darkness) of an aerosol particle determine the magnitude of climate influence. Particles from a diesel engine or smokestack may be dark in color due to large amounts of black carbon (BC) and will exert a positive radiative forcing (heating). A particle formed from photochemical reactions of hydrocarbons will typically be white and will scatter sunlight. Other particles may be water soluble and may alter the brightness and lifetime of clouds (indirect effect). In addition to climate change, the combinations of these radiative effects result in a decrease of sunlight reaching the surface, which is known as dimming (Ramanathan et al, 2005). The reduction of sunlight at the surface will have an impact on solar power generation, wind speeds and on agricultural yields (Jacobson and Kaufman, 2006; Stanhill and Cohen, 2001).
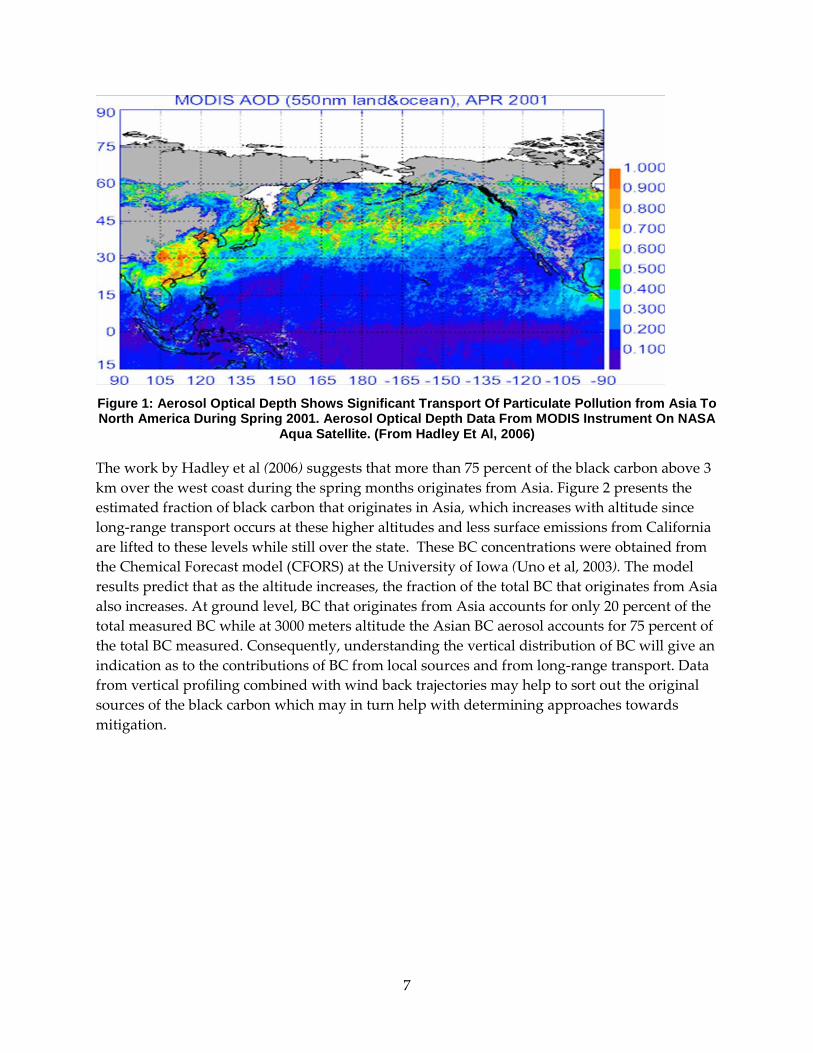
1.2 Sources of Climate Relevant Pollutants The main sources of anthropogenic sources of climate relevant pollutants are power generation, transportation, and industry. Sources within California predominantly affect the surface level below the boundary layer, but a large component of anthropogenic pollution (both gas phase and aerosol) is transported to California from other regions. Pollution above the boundary layer can often travel great distances. Figure 1 shows the long-range transport of pollution from Asia across the Pacific (Hadley et al, 2006). The figure uses data from the MODIS instrument that measures the aerosol optical depth, (i.e., the degree to which aerosols prevent the transmission of light). The material transported over the Pacific Ocean includes dust, aerosols, black carbon, and gases, such as ozone and carbon monoxide. Aerosols are partially removed on their weeklong crossing of the ocean by rain and dry deposition, yet many of the aerosols still survive the journey. Black carbon particulates (and other absorbing aerosols) are of particular interest due to the implication for regional climate change by the absorption of sunlight and its subsequent release as heat. This heating effect is magnified up to 300 percent when the absorbing material is contained within a cloud droplet (Mikhailov et al, 2006). Since aged aerosols are generally more water-soluble due to internal mixing and cloud processing, the BC arriving by long range transport will potentially be more likely than locally generated BC particulates to become incorporated into cloud droplets and thus have a larger impact on the regional climate. Moreover, as black carbon absorbs sunlight and warms the surrounding air, the boundary layer may become more stable resulting in further persistence of the aerosol pollution layers and an increased lifetime for water clouds. While not covered in the Hadley study, significant pollution may be transported from Mexico during the summer months as suggested by wind patterns.
6
Figure 1: Aerosol Optical Depth Shows Significant Transport Of Particulate Pollution from Asia To North America During Spring 2001. Aerosol Optical Depth Data From MODIS Instrument On NASA
Aqua Satellite. (From Hadley Et Al, 2006)
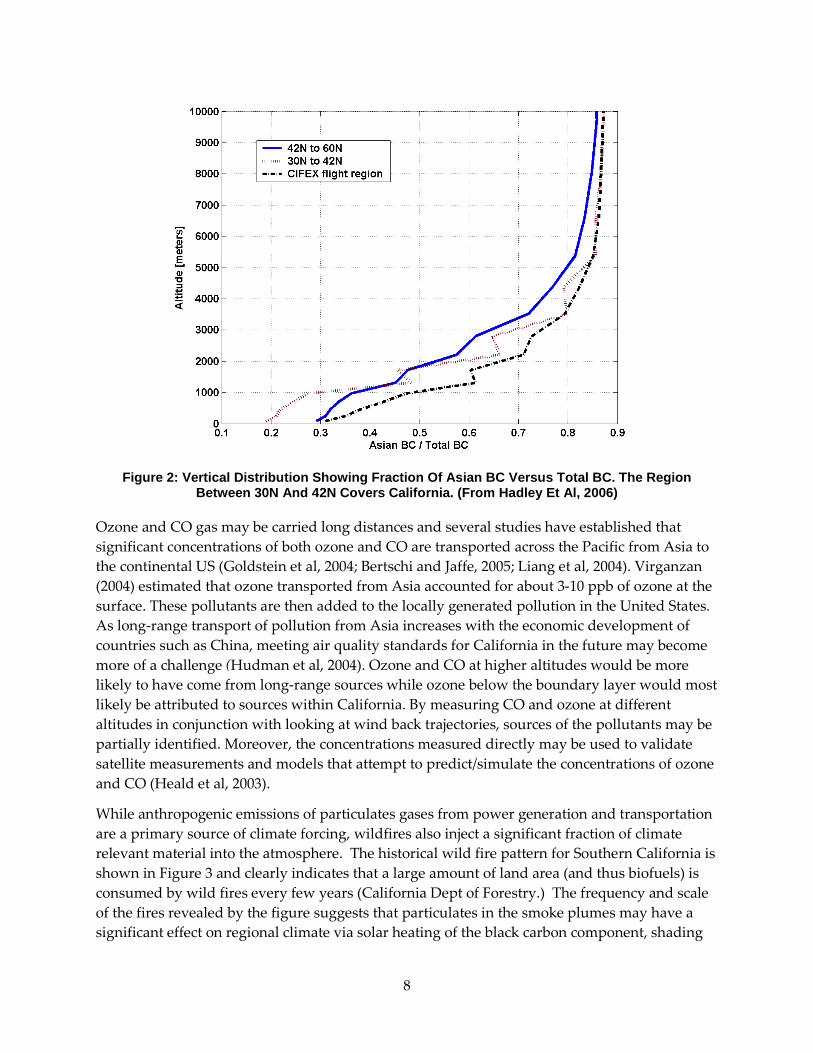
The work by Hadley et al (2006) suggests that more than 75 percent of the black carbon above 3 km over the west coast during the spring months originates from Asia. Figure 2 presents the estimated fraction of black carbon that originates in Asia, which increases with altitude since long-range transport occurs at these higher altitudes and less surface emissions from California are lifted to these levels while still over the state. These BC concentrations were obtained from the Chemical Forecast model (CFORS) at the University of Iowa (Uno et al, 2003). The model results predict that as the altitude increases, the fraction of the total BC that originates from Asia also increases. At ground level, BC that originates from Asia accounts for only 20 percent of the total measured BC while at 3000 meters altitude the Asian BC aerosol accounts for 75 percent of the total BC measured. Consequently, understanding the vertical distribution of BC will give an indication as to the contributions of BC from local sources and from long-range transport. Data from vertical profiling combined with wind back trajectories may help to sort out the original sources of the black carbon which may in turn help with determining approaches towards mitigation.
7
Figure 2: Vertical Distribution Showing Fraction Of Asian BC Versus Total BC. The Region
Between 30N And 42N Covers California. (From Hadley Et Al, 2006)
Ozone and CO gas may be carried long distances and several studies have established that significant concentrations of both ozone and CO are transported across the Pacific from Asia to the continental US (Goldstein et al, 2004; Bertschi and Jaffe, 2005; Liang et al, 2004). Virganzan (2004) estimated that ozone transported from Asia accounted for about 3-10 ppb of ozone at the surface. These pollutants are then added to the locally generated pollution in the United States. As long-range transport of pollution from Asia increases with the economic development of countries such as China, meeting air quality standards for California in the future may become more of a challenge (Hudman et al, 2004). Ozone and CO at higher altitudes would be more likely to have come from long-range sources while ozone below the boundary layer would most likely be attributed to sources within California. By measuring CO and ozone at different altitudes in conjunction with looking at wind back trajectories, sources of the pollutants may be partially identified. Moreover, the concentrations measured directly may be used to validate satellite measurements and models that attempt to predict/simulate the concentrations of ozone and CO (Heald et al, 2003).
While anthropogenic emissions of particulates gases from power generation and transportation are a primary source of climate forcing, wildfires also inject a significant fraction of climate relevant material into the atmosphere. The historical wild fire pattern for Southern California is shown in Figure 3 and clearly indicates that a large amount of land area (and thus biofuels) is consumed by wild fires every few years (California Dept of Forestry.) The frequency and scale of the fires revealed by the figure suggests that particulates in the smoke plumes may have a significant effect on regional climate via solar heating of the black carbon component, shading
8
of the surface by the organic and ash components, and also by augmenting clouds. Wildfires account for 5 percent of total CO2 and 15 percent of the emitted black carbon in the USA (Liu et al, 2004, Bond et al, 2004.) Both these percentages are actually much higher for California since the state is impacted by wildfires at a much higher levels than the average for the continental US. In addition, the smoke from these wildfires load the atmosphere with these gases and particulates over a few weeks or months; consequently, the radiative forcing from the wildfire smoke is more pronounced over a shorter timescale. The warming of the atmosphere by BC at higher altitudes may serve to stabilize the boundary layer and increase the time that pollution stays aloft. Other studies have shown that smoke can extend the lifetime of clouds by inhibiting rainfall (Rosenfeld et al, 1999). While forest fires may be contributing to climate change, they may also be affected by changes in the climate. The forest fire frequency in the Western US has been increasing over the last quarter century and this increase has been linked to higher average spring and summer temperatures and earlier spring snowmelts (Westerling et al, 2006).
Figure 3: California Department Of Forestry Map For Wild Fire Occurrences In California
1.3 Limitations of Surface Measurements Frequent monitoring of pollution in the atmosphere can give insight into the potential for climate change over a region. Several long-term monitoring programs exist in California that produce data that can be applied towards studies on climate change. Air quality issues are often intimately joined with issues of climate change, and data from sites oriented towards air quality monitoring can often be utilized for climate analysis. One large, well-established system for
9
monitoring air pollution throughout the United States is the IMPROVE (Interagency Monitoring of Protected Visual Environments) network, which is an extended air quality monitoring network positioned throughout the US National Park System and was originally installed to assess trends in visibility. The IMPROVE Network is a surface level monitoring system. Consequently, pollution released locally will typically have a greater influence on these measurements and the results may not reflect the concentrations over the larger region. Pollution carried from elsewhere may be at higher altitudes and will therefore not be detected by the ground based measurements. A large plume of material can easily pass overheard without the ground based samplers ever detecting anything. Assuming that measurements at the surface reflect the entire column of air is a limitation of ground based measurements everywhere. To accurately characterize the amount of aerosol and black carbon distributed by altitude requires taking measurements at these different altitudes (termed as vertical profiling.)
The limitation in assuming uniformly vertical atmospheric aerosol properties based on measurements taken at the surface has been recognized and addressed in numerous studies (Ramanathan et al, 2001; Huebert et al, 2003; Corrigan et al, 2006). Many of these studies utilized short term vertical profiling using manned aircraft. Most manned aircraft missions are expensive and involve risks to crews and operators. As a result, aircraft missions are typically only operated during intensive periods of one week to one month. In a few cases, small manned aircraft have been outfitted with aerosol instruments and used routinely to collect airborne data on aerosols (Andrews et al, 2004) Nonetheless, autonomous unmanned aerial vehicles (AUAV) offer the potential to execute routine airborne measurements in a less expensive and low risk manner. Previously, the Scripps team developed and deployed instrumented AUAVs that successfully measured the vertical profiles of aerosol and irradiance properties over the tropical Indian Ocean during the MAC campaign (Ramanathan et al 2007; Corrigan et al, 2008; Roberts et al, 2008). These instrumented AUAVs have been utilized in this study to measure the vertical profile of particulates, black carbon and ozone over the Mojave Desert region of Southern.
10
CHAPTER 2: Methodology 2.1 Flight Locations At the time of this study, the FAA did not allow unmanned aircraft to fly within United States public airspace without severe restrictions. Consequently, in order to sample on a routine basis and to ascend to high altitudes (4 km), the project was limited to flying in airspace controlled by the US military or partners of the military, such as NASA. Within California, only two locations allowed access to these high altitudes: NASA Dryden Research Center and Vandenberg Air Force Base (see Figure 4). The NASA Dryden center at Edwards Air Force Base located 80 miles north of Los Angeles is located in the Mojave Desert at an altitude of 670 masl and offers a centralized location in California (34.96N, -117.86 W). The NASA Dryden facility is situated in high desert that receives wind flow from all regions of California and offers exceptional support and logistics for the operation of unmanned aircraft. Flights were conducted from the dry lake bed. During the later stages of the project, flight permissions were obtained at Vandenberg AFB located 100 miles up the coast from Los Angeles at an altitude of 50 masl. Flights were conducted off of the main runway (34.75 N, -120.63 W). This facility offered the opportunity to sample air straight off the ocean prior to being exposed to California. Six campaigns were staged at NASA Dryden and two campaigns were staged at Vandenberg AFB.
2.2 Flight Operations Flight operations were conducted by the Scripps Institution of Oceanography with assistance from Advanced Ceramics Research (ACR) and oversight by NASA. Both Scripps personnel and ACR operated the autonomous aircraft. Typical missions involved launching the aircraft which would rapidly ascend to 3800 meters (12,467feet) (<20 minutes). For aerosol missions, the aircraft then stepped down at 400-500 meter (1,312 feet – 1,640 foot) increments to allow equilibration of the instruments to pressure, temperature and relative humidity changes. The ozone flights rapidly ascended and then immediately descended at about 2 m/s (13 ft/s). Flight durations were 3 to 4 hours for the aerosol flights and 1 hour for the ozone flights.
Figure 4: Map Of Flight Locations. The Green
Star Is Vandenberg AFB And The Yellow Star Is The NASA Dryden Research Center At Edwards
AFB.
11
Stacked aircraft missions were intended to further study interesting episodes, such as instances of high black carbon concentrations. The opportunity to deploy the aircraft in stacked formation arose once during the study. The aircraft occupied the same column of air but at different altitudes. Software integrated with the flight software (Piccolo Command Center) kept the aircraft flying over the same geographical point within three seconds of each other (on average). This formation allowed for the same column of air to be measured with respect to incoming and reflected solar radiation.
2.3 Sampling Platform The lightweight unmanned aircraft utilized in the CAPPS project were manufactured by Advanced Ceramics Research (since purchased by BAE) and is shown in Figure 5. The aircraft has a wingspan of 8 feet and has a maximum flight weight of 55 pounds with fuel and payload. Fixed landing gear are used for launch and recovery. The aircraft is capable of carrying a 5 kg (12 lbs) payload during a 4 to 5 hour flight and can operate autonomously within a 200 km radius of its launch and recovery point. The aircraft autopilot uses satellite GPS to follow flight paths that can be uploaded at any time during a flight. The aircraft has the capability to fly over the horizon using Iridium satellite communication to update its flight path while out of sight. The aircraft has a service ceiling of 16,000 feet and can climb to 10,000 feet in under 15 minutes. The Scripps aircraft were outfitted with an advanced differential GPS flight package that enabled fully automated takeoff and landing. Primary control of the aircraft is performed on a standard laptop computer.
Figure 5: The ACR Manta Lightweight Unmanned Aircraft
12
2.4 Measured Parameters and Instrumentation The majority of the instruments and systems needed for the CAPPS project were developed for the MAC campaign before 2006 under NOAA and NSF grants (Corrigan et al, 2008). Several microwave-oven sized instruments were specifically modified or redesigned to fit within the small space of the AUAV (large shoebox) payload compartment without jeopardizing data quality. The miniaturized instruments were successfully flown on 45 scientific flights accumulating more than 120 research hours plus dozens of test flights during previous UAV campaigns. As with this recent study, the miniaturized instruments have proven to be robust and reliable. The parameters measured during the flights are listed in Table 1 along with name and vital statistics of the miniaturized instruments. A commercial ozone monitor from 2B Technology was miniaturized to fit within the payload compartment. The instruments utilized in this project are shown in Figure 6. The aerosol instrument package is shown installed within the payload bay of an aircraft prior to a flight in Figure 7.
Table 1: Parameters Measured During CAPPS Flights And The Corresponding Instrumentation
Measured Parameter Instrument ID Weight
(kg) Power
(W)
Total Particle Concentration Condensation Particle Counter
Visible Radiative Flux Photosynthetic Active Radiation
PAR 0.29 < 0.2
Ozone Concentration Ozone Monitor O3 (0.6) <4
Temperature / relative humidity
Temperature / relative humidity
TRH 0.05 < 0.1
GPS location, time, flight data
Data acquisition system (Scripps)
DAQ 0.65 10
Aerosol inlet AI 0.21 --
13
Correction methods for the raw were required for several of the instruments. The absorption photometer made at Scripps Institution of Oceanography for this project was based on a commercial Magee Scientific Aethalometer. The raw absorption data was corrected using the method presented by Arnott et al (2005) with some altered variables to account for aged aerosols and calibrated for ambient conditions. Details of the correction method for data from this instrument is covered in Corrigan et al, (2006 and 2008). In addition, data from the radiometers required extensive data reduction which is outlined in Ramana et al, 2007. The CPC, OPC, ozone and meteorological instruments only required minimal data reduction such as calibration factors.
Ozone
Monitor
(future) Ozone monitor (730 g)
Figure 6: Miniaturized AUAV Instruments For Aerosol, Radiometric And Ozone Measurements
14
Figure 7: Payload Bay For Instrumented Aerosol Radiometric AUAV
15
CHAPTER 3: Results and Discussion 3.1 Scientific Missions The scientific missions conducted as part of the CAPPS project are listed in Table 2. An aerosol mission consisted of a vertical profile collected by an aircraft outfitted to measure met data, total particle concentration, particle size distribution, and particle absorption. The aerosol flight profile was typically a vertical profile followed by sampling for 30 minutes at six different altitudes during the descent. An ozone mission consisted of the aircraft measuring met data and ozone concentration, but sometimes included the particle absorption instrument. Ozone flight profiles were typically a quick ascent and descent unless the particle absorption instrument required the mission to follow the aerosol pattern. Solar radiation measurements were carried out during all missions.
3.2 Mission Data Figure 8 shows the vertical profiles of ozone concentration above both flight locations during the study. The average observed ozone concentrations at NASA Dryden were roughly twice the background level measured over remote surface locations (25-40 ppb), and was otherwise fairly consistent over the various flights (Vingarzan, 2004). The highest event of ozone concentration was observed in July and corresponded to the highly polluted wildfire events. The concentrations over NASA Dryden are slightly higher than the concentrations over Vandenberg AFB since the maritime air is less influenced by continental sources. Moreover, the missions at Vandenberg managed to climb well above the boundary layer, which was between 200 - 700 m and experienced diverse vertical structure under cloudy conditions. Clouds may have caused some of the variability seen in the Vandenberg profiles.
16
Table 2: Scientific Missions Flown During CAPPS Project
The vertical profiles for total particle concentrations collected for all the missions are presented in Figure 9. Particle concentrations are typically used to indicate the level of particulate pollution being observed, especially smaller particles originating from local sources. Large changes in total particle concentration can indicate a change in air mass with different aerosol sources as is often seen when passing through a boundary layer. During the spring months (Apr-May) a boundary layer is often observed where the aerosol concentration abruptly decreases with altitude, but often the boundary layer is above or at the limit of the operational ceiling of the aircraft (3700 m). During the summer and fall months, the boundary layer is typically above 3700 m due to extreme heat rising from the desert floor. Below the boundary layer, the aerosol is generally well mixed and highly influenced by sources within a 100 km. The flights out of Vandenberg in November also climbed above the boundary layer and thus show noticeable structure.
Date Mission Type Location Date Mission Type Location
Figure 8: Vertical Profiles Of Ozone Over NASA Dryden (May – Aug) And Vandenberg (Nov) During
2008
Figure 10 shows the apparent black carbon concentration measured as a function of altitude. The qualifier of “apparent” is used to recognize that the concentration of black carbon is a derived value converted from absorption coefficients measured by the absorption photometer at 880 nm. The concentration values were calculated from the absorption coefficients using a simple conversion factor of 10 m2/g. While the actual value for the cross sectional absorption of black carbon is a subject of debate and has been given values ranging from 5-13 m2/g (Bond and Bergstrom, 2006), using this value of 10 has some historic precedence for deriving a first approximation of the black carbon concentration and is easily replaced with whatever value somebody finds more convincing. Furthermore, error bars of ±50 ng/m3 are given for only the highest concentration line to avoid overwhelming the figure with clutter. The error bars are the same for all the data points and only reflect the effective lower limit of the instruments sensitivity and resolution under these operating conditions and sampling times. Longer sampling times certainly would produce smaller error bars. The error bars do not address any systematic errors that may be associated with the instrument method or correction technique since these have not been effectively quantified in the literature.
18
Figure 9: Vertical Profiles Of Total Particle Concentration (#/cm3) During The CAPPS project.
Figure 10: Vertical Profiles of The Apparent Black Carbon Concentrations Over NASA Dryden And
Vandenberg AFB In California. The Legend Format Is YYYYMMDD
19
During the spring months of April and May when long range transport from Asia is considered to be most prevalent, the black carbon existing at high altitude is below or just barely above the limit of detection of the researcher’s absorption instrument under these sampling conditions. In five flights during April, concentrations of black carbon were never observed to be greater than the limit of detection once the aircraft was airborne. It should be understood that snapshots of the atmosphere garnered from individual flights may not always capture the climatological behavior of the region, but six samples taken over a six week period indicate that concentrations of black carbon up to 3700 meters altitude are remaining below 100 ng/m3 during the month of April. Back trajectories suggest that the air masses arriving at NASA Dryden were usually coming from Northern California and occasionally due west from the Pacific Ocean. Long range transport of black carbon may be occurring at higher altitudes, but the bulk of the transported material doesn’t come as far south as either NASA Dryden or Vandenberg AFB (Hadley et al, 2006).
Concentrations of black carbon remain below 100ng/m3 up to 3700 m altitude at both flight locations for most of the months sampled except for the summer months. August shows larger concentrations of 350 ng/m3 mainly at the surface with concentrations dropping to around 100 ng/m3 above the surface. However, July shows black carbon concentrations that are 5-10 times larger than concentrations seen during the rest of the year. These high values correspond to numerous wildfire events that were simultaneously occurring throughout the state of California in June and July of 2008. The details of the July flight mission are presented as a detailed case study in the following sections.
3.3 Case study: Regional Radiative Forcing From Wildfires. The following sections describe the detailed analysis of data collected by the aircraft while plumes of wildfire smoke blanketed the state of California. The widespread dispersion of this smoke provided the opportunity to directly measure for the first time the radiative forcing of biomass smoke plumes.
3.3.1 Prevalence and Dispersion of Wildfire Plumes. During the months of June and July in 2008, the state of California was experiencing a wave of wildfires, which is a common occurrence each fire season. The smoke from these fires has a significant effect on climate forcing since the smoke is often present throughout the state for several months out of the year, but the amount of forcing from the regional haze of wildfire smoke had not previously been directly measured. The flights on July 10, 2008 were undertaken while the region heavily influenced by wildfire smoke and provided the opportunity to directly measure the absorption of sunlight by specific atmospheric layers using stacked aircraft. The wildfire smoke plumes above NASA Dryden on July 10, 2008 were well dispersed and uniform over the entire region since they had been transported and well mixed. The extent of the wildfire sources throughout the state can be seen in the map provided by the California Governor’s Office of Emergency Services in Figure 11. The majority of the smoke was produced by the fires in Northern California and then transported south over several days to the region around NASA Dryden. This allowed the smoke plumes to age and become well mixed before
20
they arrived at the sampling location. One medium fire was 100km from NASA Dryden, but the smoke plume from that fire was not moving away from the research site.
Further evidence of the impact of the firestorm can be seen from satellite images taken from the NASA Earth Observatory website. Figure 12a shows the fire fronts and smoke plumes in the north and central parts of the state on June 30th, 2008, which was 10 days prior to the research flight. The flight location is marked with a star on the map. Figure 12b is an image from 10 days later, or July 10, 2008, the day of the research flights. The fires and smoke plumes still persist and have covered the entire north state with smoke plumes which are being transported over Nevada and down to NASA Dryden.
The transport of smoke from Northern California is clearly observed in the aerosol optical depth (AOD) map presented in Figure 13. AOD can simply be described as a unit less measurement of the opacity of the atmosphere with a completely transparent atmosphere (particle free) being defined as zero. An AOD of 0.2 is generally considered the limit that indicates a polluted air mass. Figure 13 shows AOD values as high as 1.0 outlining a plume moving from Northern California, over Nevada, and then south towards the desert regions of Southern California. By the time the wildfire plumes have reached the flight area around NASA Dryden in the Mohave Desert, the particles are well mixed and have experienced some aging processes. As a result, the aerosol measured during the science missions on July 10th measured regionally-disperse, aged, homogenous wildfire plumes.
21
Figure 11: The Prevalence And Intensity Of Wildfires In California In Late June 2009
22
Figure 12: Satellite Images Of Fire Fronts (Red) And Smoke Plumes Over The State Of California
On a.) June 30, 2009 and b.) July 10, 2009. Star Indicates Location Of Flight Area At NASA Dryden. Images Obtained From earthobservatory.nasa.gov
Figure 13: MODIS Aerosol Optical Depth At 550 nm Over California On July 10, 2008
23
3.3.2 Stacked Flights to Observe Atmospheric Layers The absorption of sunlight by the smoke plumes over NASA Dryden on July 10th was measured using two aircraft deployed simultaneously and operating in a synchronized formation. The method was developed during the MAC campaign and outlined in Ramanathan et al (2007) and Ramana et al (2007) utilized two unmanned aircraft flying in stacked formation that allows them to occupy the same column of air but at different altitudes. By observing the solar flux impacting each aircraft’s radiometers, the absorption of different layers in the atmosphere below 3700 masl was directly determined. Measurements of aerosol concentrations, particle size distributions, aerosol absorption, and ozone concentrations were also measured simultaneous to the solar radiation measurements.
Data from the flights on July 10, 2008 is presented in Figure 14. The vertical distribution of the total particle concentration is shown in Figure 14a and reveals a steady decline in concentration with altitude from the surface (2340 #/cm3) up to 3700 masl (1370 #/cm3). [Note: The transient spikes seen near the surface (800 masl or 2000 feet asl) are associated with aircraft exhaust while orbiting above airfield.] A similar trend is seen in Figure 14b for the particle size distribution. This uniformity along with the met data indicates that the aircraft never climbed above boundary layer and suggests that the aerosols are well-mixed up to the mission ceiling. The high altitude of the boundary layer was consistent with the high surface temperatures which approached 45 °C (or 115 °F) during the flights.
103
104
0
500
1000
1500
2000
2500
3000
3500
#/cm3
Alti
tud
e, m
CPC data
Alti
tud
e, m
Size, µm
OPC
0.3 0.5 1 2 30
500
1000
1500
2000
2500
3000
3500
100
101
102
103
Figure 14: Vertical Profiles Over NASA Dryden On July 10, 2008 Showing a.) Total Particle
Concentration And b.) Coarse Particle Size Distribution (0.3 – 3.0 µm)
The vertical profile of the aerosol absorption coefficient at three wavelengths is presented in Figure 15. Absorbing material in the atmosphere was greatest near the surface and appeared to diminish above 2500 masl. The absorption coefficient profiles generally matched the trends indicated in the total particle concentration profile. Noticeable wavelength dependence is observed and an absorption angstrom exponent of -1.6 was calculated indicating that some of the absorbing material is organic in structure as opposed to being purely black carbon, which
24
has an angstrom exponent of -1.0. This finding is consistent with the aerosol source being wildfire smoke.
0
1000
2000
3000
4000
0 5 10 15 20 25 30
Abs coeff, Mm-1
Alti
tude
(m)
880 nm525 nm370 nm
Figure 15: Vertical Profile Of Aerosol Absorption At Three Wavelengths Over NASA Dryden On
July 10, 2008 During Wildfire Events
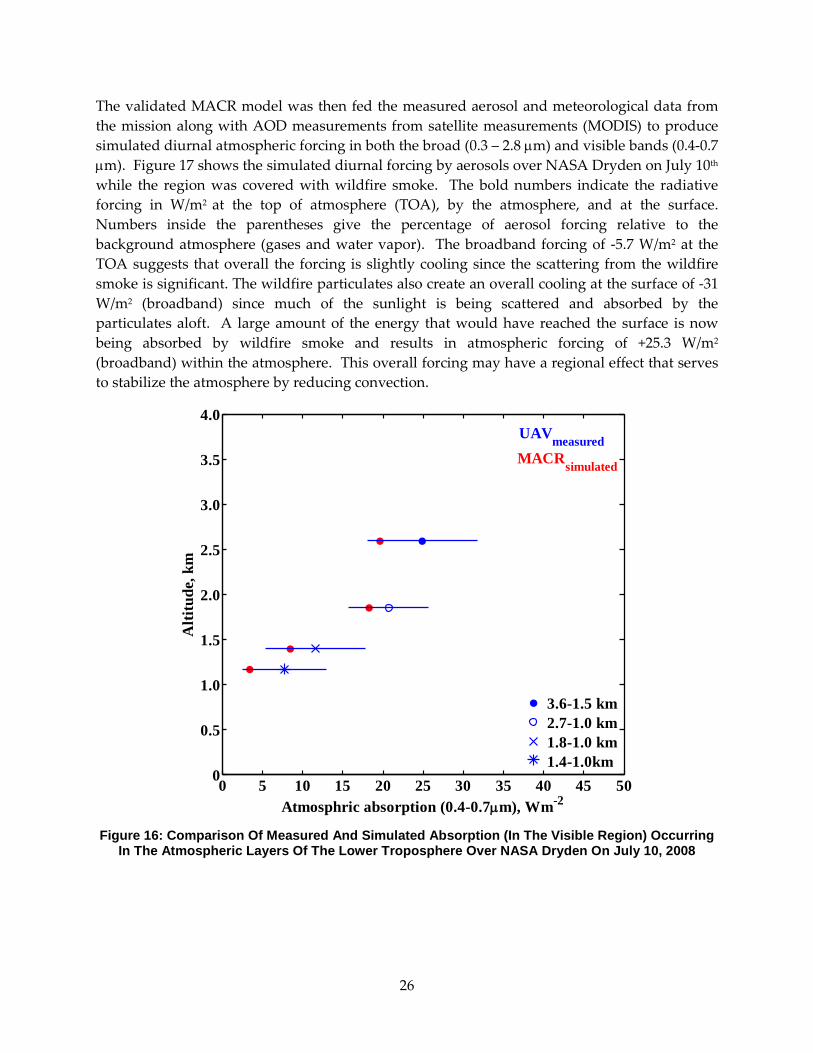
3.3.3 Aerosol Forcing from Wildfire Haze Using the flux measurements from the stacked flight radiometers, instantaneous absorption values for several layers of the atmosphere below 3.6 km altitude were determined. The absorption is defined as the difference between the net fluxes at two flight levels. These measured fluxes and absorption values were used to validate a radiative transfer model that also incorporated the absorption, aerosol, and met data collected during the flights. The radiative transfer model, the Monte Carlo Aerosol Cloud Radiation (MACR) model, was developed at Scripps and has been applied to similar aircraft studies in the Maldives (Ramanathan et al, 2007). The agreement between the model and the direct absorption measurements in the visible region is presented in Figure 16. Since aerosols contribute about 90 percent of the absorption in the visible region of the spectra, the comparison validates the treatment of measured parameters by the model. The measured atmospheric absorption values are close to 25 W/m2 for layers above 1.5 km and are close to 10 W/m2 for layers below 1.5 km in the visible region. This significant absorption was due to the presence of highly absorbing aerosols, primarily black carbon.
25
The validated MACR model was then fed the measured aerosol and meteorological data from the mission along with AOD measurements from satellite measurements (MODIS) to produce simulated diurnal atmospheric forcing in both the broad (0.3 – 2.8 µm) and visible bands (0.4-0.7 µm). Figure 17 shows the simulated diurnal forcing by aerosols over NASA Dryden on July 10th while the region was covered with wildfire smoke. The bold numbers indicate the radiative forcing in W/m2 at the top of atmosphere (TOA), by the atmosphere, and at the surface. Numbers inside the parentheses give the percentage of aerosol forcing relative to the background atmosphere (gases and water vapor). The broadband forcing of -5.7 W/m2 at the TOA suggests that overall the forcing is slightly cooling since the scattering from the wildfire smoke is significant. The wildfire particulates also create an overall cooling at the surface of -31 W/m2 (broadband) since much of the sunlight is being scattered and absorbed by the particulates aloft. A large amount of the energy that would have reached the surface is now being absorbed by wildfire smoke and results in atmospheric forcing of +25.3 W/m2 (broadband) within the atmosphere. This overall forcing may have a regional effect that serves to stabilize the atmosphere by reducing convection.
0 5 10 15 20 25 30 35 40 45 500
0.5
1.0
1.5
2.0
2.5
3.0
3.5
4.0
Atmosphric absorption (0.4-0.7µm), Wm-2
Alti
tude
, km
UAVmeasuredMACRsimulated
3.6-1.5 km2.7-1.0 km1.8-1.0 km1.4-1.0km
Figure 16: Comparison Of Measured And Simulated Absorption (In The Visible Region) Occurring
In The Atmospheric Layers Of The Lower Troposphere Over NASA Dryden On July 10, 2008
26
Atmosphere
Surface
TOA
-31.0(-14.4%)
+25.3 (26.1%)
-5.7 (-1.8%)
broad
Atmosphere
Surface
TOA
-16.1(-15.1%)
+15.2 (169%)
-0.9 (-0.8%)
VIS
Atmosphere
Surface
TOA
-31.0(-14.4%)
+25.3 (26.1%)
-5.7 (-1.8%)
broad
Atmosphere
Surface
TOA
-16.1(-15.1%)
+15.2 (169%)
-0.9 (-0.8%)
VIS
Figure 17: Diurnal Averages Of Forcing (In The Broadband And Visible Region) From Aerosols Over NASA Dryden On July 10, 2008 During Wildfire events. Values Are In W/m2 And Values In
Parentheses Indicate The Percentage Of Aerosol Forcing Relative To The Background Atmosphere Without Aerosols
27
CHAPTER 4: Conclusions and Recommendations Vertical profiles of black carbon concentration, aerosol absorption, total particle concentration and ozone concentration were performed over California for the first time using instrumented, lightweight, unmanned aircraft. The initial five missions were conducted during the season (April) that is characterized by significant long-range transport of particulates from Asia to North America. Black carbon was either below or at detectable limits at higher altitudes (up to 4 km above sea level), especially if the sampling went above the boundary layer where long range transport typically occurs. The amount of black carbon particulate matter above the sampled regions of Southern California during April-May of 2008 was between zero and 100 ng/m3 , with the range being mainly a reflection of the noise level and minimum sensitivity of the instrument. Using the black carbon source partition given in Hadley et al (2006) (see Figure 2), the amount of black carbon up to 4 km altitude originating from Asia would be between 0 and 75 ng/m3. Flights at Vandenberg AFB with less continental influence and a lower boundary layer produced equivalent results, but sampling at that location was only attempted in November 2008.
The next step in this research path regarding vertical profiling would need to address the issue of low concentrations. Both NASA Dryden and Vandenberg AFB are at a latitude of 35 N, which is most likely too far south to detect significant Asian transport. The unmanned aircraft were restricted to these two ranges due to FAA limitations and all attempts to secure flight permissions farther north proved fruitless. Future attempts at sampling Asian transport of black carbon should be attempted above 40 N latitude or even Oregon and Washington State provided that flight permissions can be obtained. Moreover, the improvement of the lower limit of detection for black carbon would (<50 ng/m3) greatly improve the value of future vertical profiles.
The extensive wildfire events throughout the state in the summer of 2008 provided the opportunity to measure for the first time the radiative forcing from aged regional wildfire haze by using stacked aircraft. The measurements produced estimates of +25.3 W/m2 of forcing in the atmosphere and -31 W/m2 of forcing at the surface (in the broadband region), which would create a more stable atmosphere as it reduced the amount of convection. With smoke from wildfires being prevalent throughout the state for several months out of the year, the resulting climate forcing may be significant. Using these measurements, further modeling that encompasses the smoke blanketing the entire state may provide insights regarding the overall climate forcing from wildfires.
28
GLOSSARY
AOD Aerosol optical depth – a measurement of the transmission of light through the atmosphere
AUAV Autonomous unmanned aerial vehicle
BC black carbon: the primary light-absorbing aerosol species that contributes to global warming and regional climate change
CAPPS California AUAV Air Pollution Profiling Study
CPC Condensation particle counter – an instrument that measures the total concentration of particles in the air
MACR Monte Carlo Aerosol Cloud Radiation model – used to calculate radiative forcing
masl Meters above sea level
MODIS Moderate Resolution Imaging Spectroradiometer – an instrument onboard the Aqua and Terra satellites – the measurement of AOD can be extracted.
OPC Optical particle counter – uses scattered light to determine size and concentration of aerosol particles that are large enough to interact with visible light (>300 nm)
ppb Part per billion – example, ng per gram.
TOA thermal-optical analysis: a method of measuring the carbon content of atmospheric particulate matter collected on quartz filters
29
REFERENCES
Andrews, E; Sheridan, PJ; Ogren, JA; Ferrare, R. 2004. In situ aerosol profiles over the Southern Great Plains cloud and radiation test bed site: 1. Aerosol optical properties. Journal of Geophysical Research-Atmospheres 109 (D6): art. no.-D06208.
Arnott, WP; Hamasha, K; Moosmuller, H; Sheridan, PJ; Ogren, JA. 2005. Towards aerosol light-absorption measurements with a 7-wavelength Aethalometer: Evaluation with a photoacoustic instrument and 3-wavelength nephelometer. Aerosol Science and Technology 39 (1): 17-29.
Bertschi, I. T., and D. A. Jaffe. Long-range transport of ozone, carbon monoxide, and aerosols to the NE Pacific troposphere during the summer of 2003: Observations of smoke plumes from Asian boreal fires, J Geophys Res-Atmos, 110, 2005.
Bond, TC; Streets, DG; Yarber, KF; Nelson, SM; Woo, JH; Klimont, Z. 2004. A technology-based global inventory of black and organic carbon emissions from combustion. Journal of Geophysical Research-Atmospheres 109 (D14): art. no.-D14203.
Bond, Tami C. and Bergstrom, Robert W. 'Light absorption by carbonaceous particles: An investigative review', Aerosol Science and Technology, 40:1, 27 - 67, 2006.
Charlson, R.J., S.E. Schwartz, J.M. Hales, R.D. Cess, J.A. Coakley, J.E. Hansen, and D.J. Hofmann, Climate forcing by anthropogenic aerosols, Science, 255, 423-430, 1992.
Corrigan, C. E., V. Ramanathan, and J. J. Schauer, Impact of monsoon transitions on the physical and optical properties of aerosols, J. Geophys. Res., 111, D18208, doi:10.1029/2005JD006370, 2006.
Corrigan, CE; Roberts, GC; Ramana, MV; Kim, D; Ramanathan, V. 2008. Capturing vertical profiles of aerosols and black carbon over the Indian Ocean using autonomous unmanned aerial vehicles. Atmospheric Chemistry and Physics 8 (3): 737-747.
Goldstein, A. H., D. B. Millet, M. McKay, L. Jaeglé, L. Horowitz, O. Cooper, R. Hudman, D. J. Jacob, S. Oltmans, and A. Clarke. Impact of Asian emissions on observations at Trinidad Head, California, during ITCT 2K2, J. Geophys. Res., 109, D23S17, doi:10.1029/2003JD004406, 2004.
Hadley, O.L., V. Ramanathan, G.R. Carmichael, Y. Tang, C.E. Corrigan, G. Roberts, and G. Mauger. Trans-Pacific Transport of Black Carbon and Fine Aerosols (D<2.5 μm) into North America. Submitted to J. Geophys. Res. 2006.
Hansen, J. and Nazarenko, L. Soot climate forcing via snow and ice albedos. Proc. Natl. Acad. Sci., 101 (2): 423-428, 2004.
Heald, C. L., et al., Asian outflow and trans-Pacific transport of carbon monoxide and ozone pollution: An integrated satellite, aircraft, and model perspective, J. Geophys. Res., 108(D24), 4804, doi:10.1029/2003JD003507, 2003.
30
Hudman, R. C., et al., Ozone production in transpacific Asian pollution plumes and implications for ozone air quality in California, J. Geophys. Res., 109, D23S10, doi:10.1029/2004JD004974, 2004.
Huebert, B. J., T. Bates, P. B. Russell, G. Shi, Y. J. Kim, K. Kawamura, G. Carmichael, and T. Nakajima, An overview of ACE-Asia: Strategies for quantifying the relationships between Asian aerosols and their climatic impacts, J. Geophys. Res., 108(D23), 8633, doi:10.1029/2003JD003550. 2003.
IPCC, Climate Change, Synthesis Report, Intergovernmental Panel on climate change, Cambridge University Press, 2007.
Jacobson, M.Z. Effects of Anthropogenic Aerosol Particles and their Precursor Gases on California and South Coast Climate . Final Report to the California Energy Commission, November 3, 2004.
Jacobson, M. Z., and Y. J. Kaufman, Wind reduction by aerosol particles, Geophys. Res. Lett.,33, L24814, doi:10.1029/2006GL027838, 2006.
Liang, Q., L. Jaegle, D. A. Jaffe, P. Weiss-Penzias, A. Heckman, and J. A. Snow. Long-range transport of Asian pollution to the northeast Pacific: Seasonal variations and transport pathways of carbon monoxide, J Geophys Res-Atmos, 109, 2004.
Liu, Y.-Q., 2004, Variability of wildland fire emissions across the continuous United States, Atmos. Environ., 38, 3489-3499.
Lohmann, U., and J. Feichter, Global indirect aerosol effects: a review, Atmos. Chem. Phys., 5, 715-737, 2005.
Mikhailov, EF; Vlasenko, SS; Podgorny, IA; Ramanathan, V; Corrigan, CE. Optical properties of soot-water drop agglomerates: An experimental study. JOURNAL OF GEOPHYSICAL RESEARCH-ATMOSPHERES 111 (D7), 2006.
Ramana, MV; Ramanathan, V; Kim, D; Roberts, GC; Corrigan, CE. 2007. Albedo, atmospheric solar absorption and heating rate measurements with stacked UAVs. Quarterly Journal of the Royal Meteorological 133 (629): 1913-1931, Part B.
Ramanathan, V., P. Crutzen, J. Lelieveld, A. Mitra, D. Althausen, J. Anderson, M. Andreae, W. Cantrell, G. Cass, C. Chung, A. Clarke, J. Coakley, W. Collins, W. Conant, F. Dulac, J. Heintzenberg, A. Heymsfield, B. Holben, S. Howell, J. Hudson, A. Jayaraman, J. Kiehl, T. Krishnamurti, D. Lubin, G. McFarquhar, T. Novakov, J. Ogren, I. Podgorny, K. Prather, K. Priestley, J. Prospero, P. Quinn, K. Rajeev, P. Rasch, S. Rupert, R. Sadourny, S. Satheesh, G. Shaw, P. Sheridan, and F. Valero, Indian Ocean Experiment: An integrated analysis of the climate forcing and effects of the great Indo-Asian haze, J. Geophys. Res., 28371-28398, 2001.
31
Ramanathan, V., C. Chung, D. Kim, T. Bettge, L. Buja, J. T. Kiehl, W. M. Washington, Q. Fu, D. R. Sikka, and M. Wild. Inaugural Article: Atmospheric brown clouds: Impacts on South Asian climate and hydrological cycle. PNAS 102: 5326-5333, 2005.
Ramanathan, V., M.V. Ramana, G. Roberts, D. Kim, C.E. Corrigan, C. Chung, and D. Winker. Warming trends in Asia amplified by brown cloud solar absorption, Nature, 448 (7153): 575-U5, 2007.
Roberts GC, MV Ramana, C Corrigan, D Kim, V Ramanathan. Simultaneous observations of aerosol-cloud-albedo interactions with three stacked unmanned aerial vehicles. Proc. Natl. Acad. Sci., 105, 7370-7375, 2008.
Rosenfeld, D., TRMM observed first direct evidence of smoke from forest fires inhibiting rainfall, Geophys. Res. Lett., 26, 3105-3108, 1999.
Stanhill, G. and S. Cohen. Global dimming: a review of the evidence for a widespread and significant reduction in global radiation with discussion of its probable causes and possible agricultural consequences. Agricultural and forest meteorology, 107(4), 255-278, 2001.
Taubman, B. F., J. C. Hains, A. M. Thompson, L. T. Marufu, B. G. Doddridge, J. W. Stehr, C. A. Piety, and R. R. Dickerson. Aircraft vertical profiles of trace gas and aerosol pollution over the mid-Atlantic United States: Statistics and meteorological cluster analysis, J. Geophys. Res., 111, D10S07, doi:10.1029/2005JD006196, 2006.
Twomey, S., The influence of pollution on the short-wave albedo of clouds, J. Atmos. Sci., 34, 1149-1152, 1977.
Uno, I., et al., Regional chemical weather forecasting system CFORS: Model descriptions and analysis of surface observations at Japanese island stations during the ACE-Asia experiment, J Geophys Res, 108, 8668, 2003.
Vingarzan, R. 2004. A review of surface ozone background levels and trends. Atmospheric Environment 38 (21): 3431-3442.
Westerling, A.L., H.G. Hidalgo, D.R. Cayan, and T.W. Swetnam. Warming and earlier spring increase western US forest fire activity. Science, 313, 940-943, 2006.