41
| Date post: | 15-May-2018 |
| Category: |
Documents |
| Upload: | nguyenphuc |
| View: | 220 times |
| Download: | 5 times |

CALIFORNIA DEPARTMENT OF
CORRECTIONS AND REHABILITATION
JEFFREY A. BEARD, Ph.D. Secretary
MARTIN HOSHINO Undersecretary (A)
Operations
DIANA TOCHE, D.D.S. Undersecretary (A)
Administation & Offender Services
BRYAN BEYER Director (A)
Division of Internal Oversight & Research
BRENDA GREALISH Deputy Director
Office of Research
JAY ATKINSON Chief
Offender Information Services Branch
JACQUI CODER Research Manager II
Estimates and Statistical Analysis Section
LORAN SHELEY Research Program Specialist II
Estimates and Statistical Analysis Section
SHELLEY BUTTLER Research Analyst II
Estimates and Statistical Analysis Section
JENNY BELNAS Research Analyst II
Estimates and Statistical Analysis Section
JUAN VILLON Research Analyst I
Estimates and Statistical Analysis Section

SPRING 2013 ADULT POPULATION PROJECTIONS
I I I
TABLE OF CONTENTS .................................................................................................... PAGE
EXECUTIVE SUMMARY ................................................................................................................... 1
SPRING 2013 ADULT POPULATION PROJECTIONS .................................................................... 3
Introduction ................................................................................................................................ 4
Institution Population ................................................................................................................ 4
Institution Population Trends ............................................................................................ 4
Institution Population Projections ..................................................................................... 5
Comparison of Spring 2013 Projections to Fall 2012 Projections ................................. 5
Felon New Admissions ....................................................................................................... 7
Felon Parole Violators ........................................................................................................ 8
Felon Court Sentences ....................................................................................................... 8
Placement Needs ................................................................................................................. 9
Parole Population .................................................................................................................... 10
Active Parole and Outpatient Population Trends .......................................................... 10
Active Parole and Outpatient Population Projections ................................................... 10
Comparison of Spring 2013 Projections to Fall 2012 Projections ............................... 11
Felon Active Parole Movement Trends ........................................................................... 13
APPENDICES A through D ............................................................................................................ 14
A - Significant Chaptered Legislation, Initiatives, Propositions and Policy Changes ..... 15
B - Methodology and Technical Notes .................................................................................. 19
C - Glossary of Terms ............................................................................................................. 20
D - Tables 1 though 14 ............................................................................................................ 22
ACKNOWLEDGMENTS .................................................................................................................. 37

SPRING 2013 ADULT POPULATION PROJECTIONS
IV
LIST OF SPRING 2013 PROJECTIONS TABLES
Table 1 – Institution Population ....................................................................................... 23
Table 2 – Parole Population ............................................................................................. 24
Table 3 – Institution Population by quarter .................................................................... 25
Table 4 – Institution Average Daily Population (ADP) by quarter ................................ 26
Table 5 – Projected Placement Needs for Male Felon Institution Population ............. 27
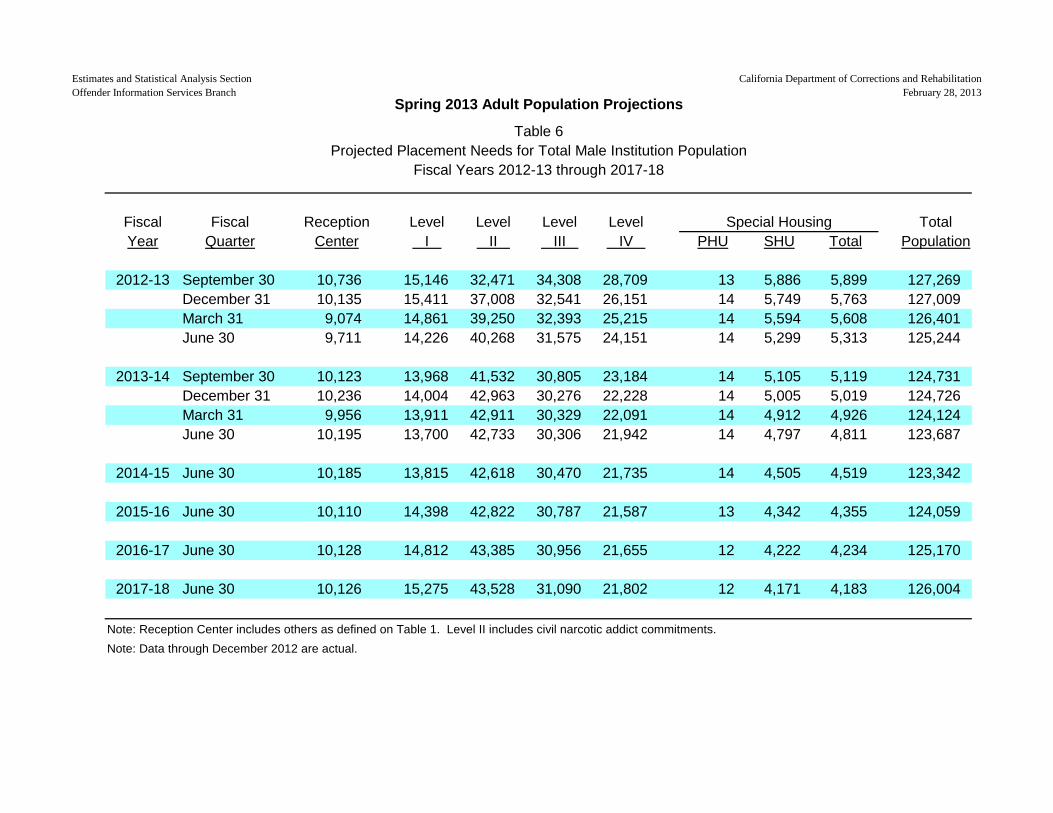
Table 6 – Projected Placement Needs for Total Male Institution Population .............. 28
Table 7 – Movement of Male Felon Institution Population ............................................ 29
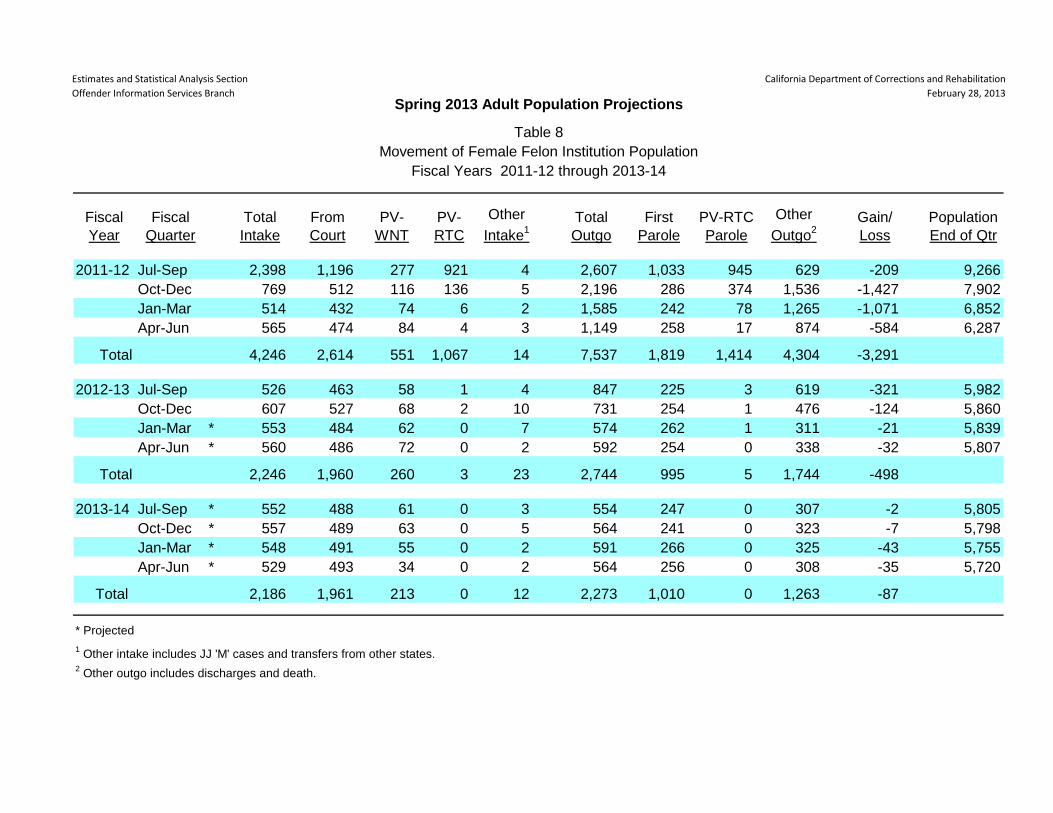
Table 8 – Movement of Female Felon Institution Population ....................................... 30
Table 9 – California Supervised Parole and Outpatient Population............................. 31
Table 10 – California Supervised Parole and Outpatient ADP ...................................... 32
Table 11 – Movement of Male Felon Parole Population ............................................... 33
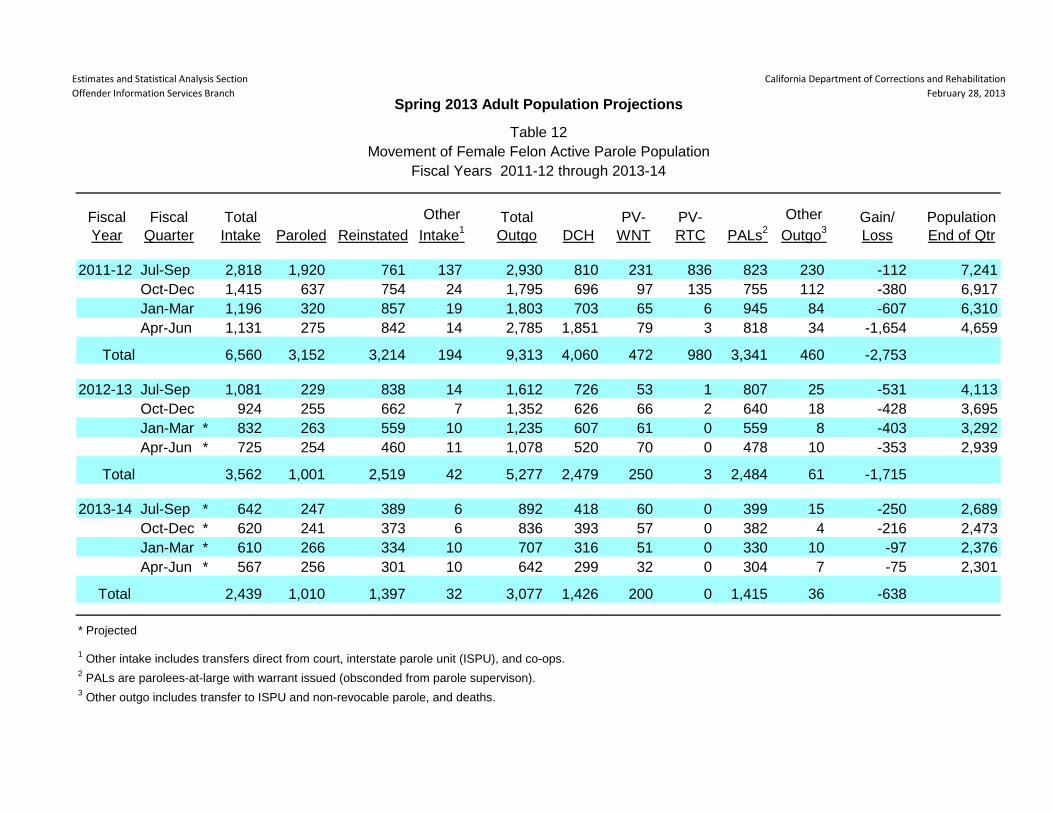
Table 12 – Movement of Female Felon Parole Population ........................................... 34
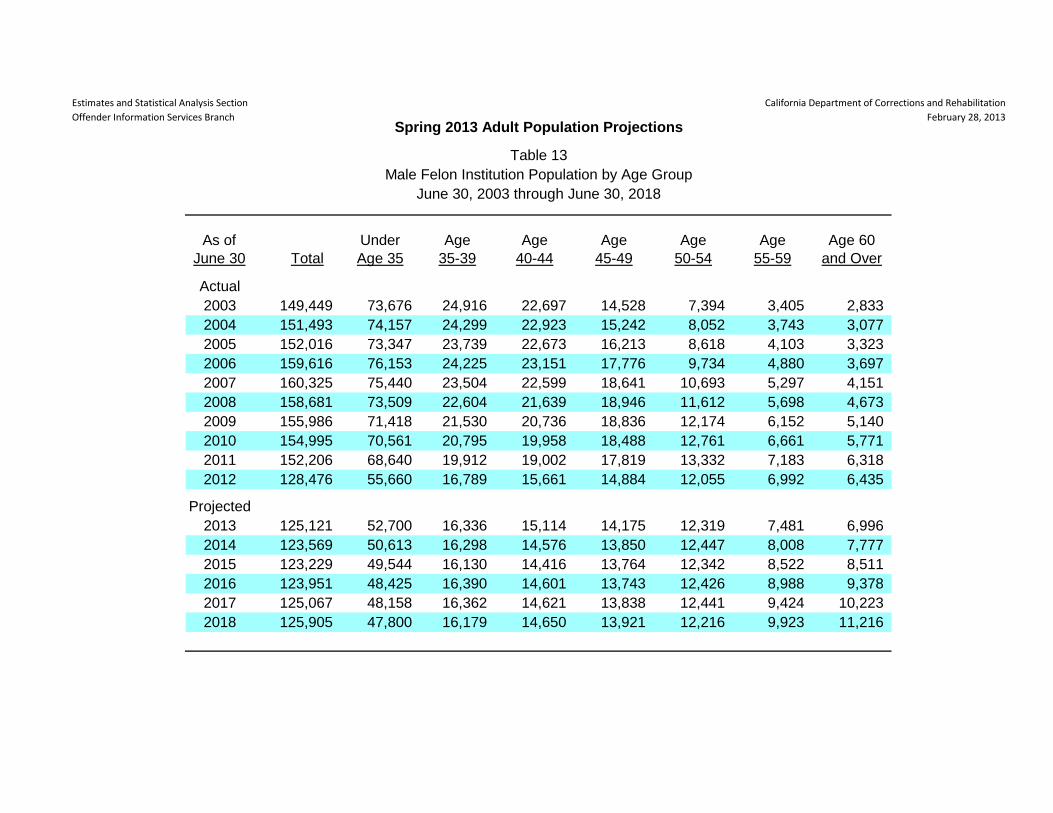
Table 13 – Male Felon Institution Population by Age Group ........................................ 35
Table 14 – Female Felon Institution Population by Age Group .................................... 36

SPRING 2013 ADULT POPULATION PROJECTIONS
1
EXECUTIVE SUMMARY

SPRING 2013 ADULT POPULATION PROJECTIONS
2
EXECUTIVE SUMMARY
This report contains the Spring 2013 Adult Population Projections for fiscal years 2012-13 through 2017-18.
On December 31, 2012, the total institution population was 132,935. This is 9.9 percent (14,643) lower than the total institution population on December 31, 2011. The institution population is projected to be 131,071 on June 30, 2013, a 3.1 percent decrease from the actual prison population on June 30, 2012. The institution population is projected to continue to decrease through June 30, 2015, when it is expected to reach 129,148. However, in subsequent years, the population is expected to increase. By June 30, 2018, it is expected to be 132,006. This projected increase in later years is due primarily to a projected increase in admissions from court. During calendar year 2012, more new admissions from court arrived than were expected. The unexpected admissions were offenders whose offenses made them eligible for either state prison or county jail, or they had prior serious or violent offenses that were unidentifiable through electronic records because they were committed out-of-state or as juveniles, or their time was served on county probation. It is expected that these trends will continue. The total active parole and outpatient population on December 31, 2012 was 57,913. This is 31,989 (35.6 percent) lower than the December 31, 2011 population. The parole population is predicted to continue to decline for the first three years of the projection cycle, falling to 29,718 by June 30, 2015. It is then expected to increase, reaching 31,738 by June 30, 2018. It is important to note that even though the institution population is projected to be higher than in Fall 2012 due to an increase in felon new admissions, much of this increase will not impact the parole population. This is because the additional new admissions expected are primarily low-level offenders who will eventually be released to PRCS rather than parole. The increase beginning in the fourth year is a result of recent legislation that will change parole terms for most parolees in the later years of the projection.

SPRING 2013 ADULT POPULATION PROJECTIONS
3
SPRING 2013 ADULT POPULATION PROJECTIONS
SPRING 2013 ADULT POPULATION PROJECTIONS
4
Introduction
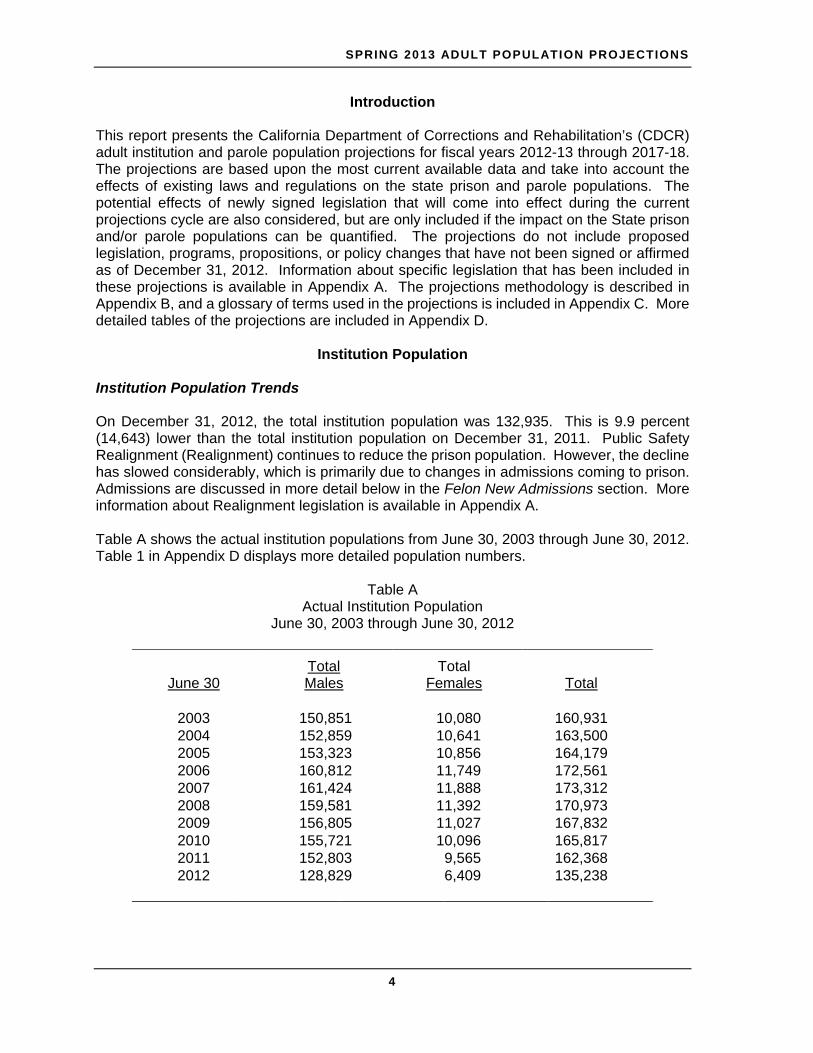
This report presents the California Department of Corrections and Rehabilitation’s (CDCR) adult institution and parole population projections for fiscal years 2012-13 through 2017-18. The projections are based upon the most current available data and take into account the effects of existing laws and regulations on the state prison and parole populations. The potential effects of newly signed legislation that will come into effect during the current projections cycle are also considered, but are only included if the impact on the State prison and/or parole populations can be quantified. The projections do not include proposed legislation, programs, propositions, or policy changes that have not been signed or affirmed as of December 31, 2012. Information about specific legislation that has been included in these projections is available in Appendix A. The projections methodology is described in Appendix B, and a glossary of terms used in the projections is included in Appendix C. More detailed tables of the projections are included in Appendix D.
Institution Population
Institution Population Trends On December 31, 2012, the total institution population was 132,935. This is 9.9 percent (14,643) lower than the total institution population on December 31, 2011. Public Safety Realignment (Realignment) continues to reduce the prison population. However, the decline has slowed considerably, which is primarily due to changes in admissions coming to prison. Admissions are discussed in more detail below in the Felon New Admissions section. More information about Realignment legislation is available in Appendix A. Table A shows the actual institution populations from June 30, 2003 through June 30, 2012. Table 1 in Appendix D displays more detailed population numbers.
Table A Actual Institution Population
June 30, 2003 through June 30, 2012
June 30
Total Males
Total Females
Total
2003 150,851 10,080 160,931 2004 152,859 10,641 163,500 2005 153,323 10,856 164,179 2006 160,812 11,749 172,561 2007 161,424 11,888 173,312 2008 159,581 11,392 170,973 2009 156,805 11,027 167,832 2010 155,721 10,096 165,817 2011 152,803 9,565 162,368 2012 128,829 6,409 135,238

SPRING 2013 ADULT POPULATION PROJECTIONS
5
Institution Population Projections The institution population is projected to be 131,071 on June 30, 2013, a 3.1 percent decrease from the actual prison population on June 30, 2012, shown above in Table A. The institution population is projected to continue to decrease through June 30, 2015. However, in subsequent years, the population is expected to increase. This projected increase is due primarily to an anticipated increase in admissions from court, which is discussed in more detail below in the Felon New Admissions section. Table B shows the projected population for the next six years. See Tables 1, 3, and 4 in Appendix D for more detail.
Table B Spring 2013 Projections
Institution Population
June 30, 2013 through June 30, 2018
June 30
Total Males
Total Females
Total
2013 125,244 5,827 131,071 2014 123,687 5,740 129,427 2015 123,342 5,806 129,148 2016 124,059 5,795 129,854 2017 125,170 5,925 131,095 2018 126,004 6,002 132,006
Comparison of Spring 2013 Projections to Fall 2012 Projections
Table C compares the Spring 2013 Projections to the Fall 2012 Projections. The institution population is projected to be higher than forecasted in the Fall 2012 Projections throughout the projections cycle. On June 30, 2013, the institution population is projected to be 131,071, 1.9 percent (2,465) higher than projected in the Fall 2012 Projections, due to a projected increase in new admissions. While the population is expected to remain higher throughout the projection cycle, the difference between the projections decreases over time. This is because, on average, the felon new admissions in Spring 2013 are projected to have shorter sentences than in Fall 2012, so the impact of having more admissions diminishes over time. By June 30, 2018, the institution population is projected to be 132,006.
Actual and projected movements for male and female felon institution populations are displayed in Tables 7 and 8 in Appendix D. Additionally, the population by age for the male and female felon institution populations are detailed in Tables 13 and 14 in Appendix D.

SPRING 2013 ADULT POPULATION PROJECTIONS
6
Table C
Spring 2013 Projections vs. Fall 2012 Projections Institution Population
June 30, 2013 through June 30, 2018
June 30
Spring 2013 Projections
Fall 2012 Projections
Difference
2013 131,071 128,606 2,465 2014 129,427 127,285 2,142 2015 129,148 127,756 1,392 2016 129,854 128,652 1,202 2017 131,095 129,940 1,155 2018 132,006 131,291 715
Figure 1 shows the actual and projected institution population for 2003 through 2018. As shown in the chart, the institution population reached a peak in 2007 and has been decreasing ever since. With the passage of Realignment, the population decreased dramatically in late 2011. The Spring 2013 Projections are higher than the Fall 2012 Projections throughout the projection cycle but the difference decreases over time.
100,000
110,000
120,000
130,000
140,000
150,000
160,000
170,000
180,000
Po
pu
lati
on
June 30
Figure 1Institution Population
June 30, 2003 - June 30, 2018
Actual
Spring 2013
Fall 2012
SPRING 2013 ADULT POPULATION PROJECTIONS
7
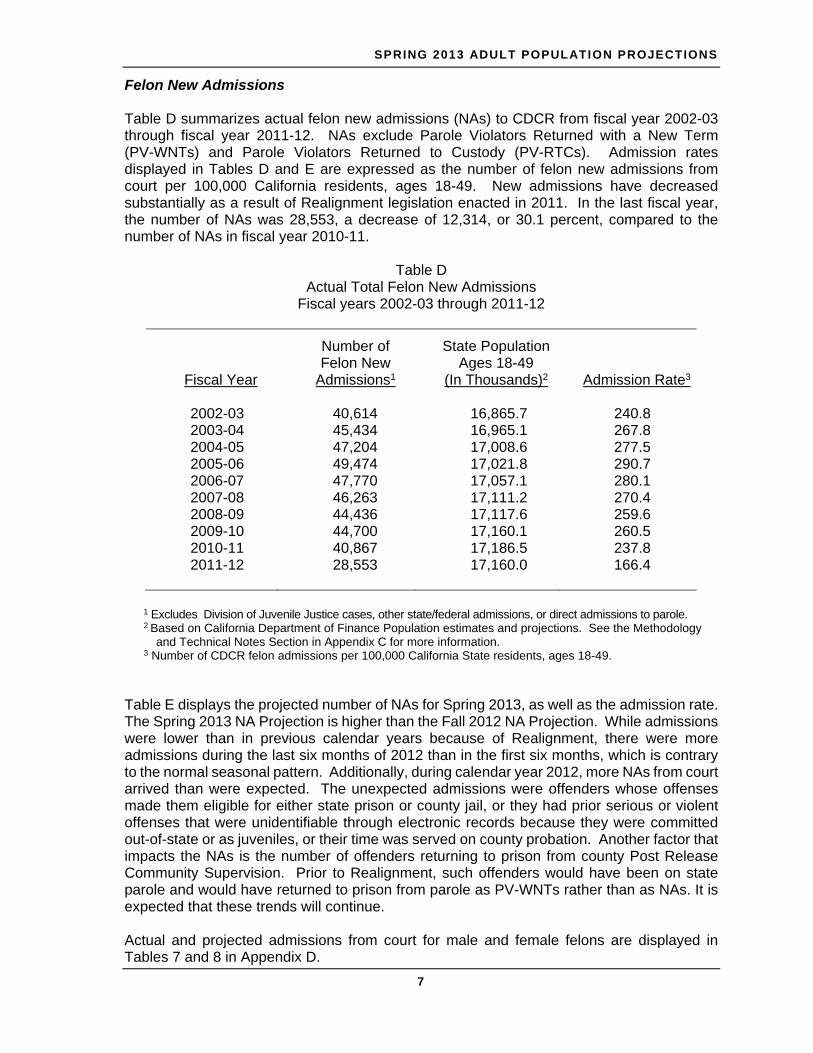
Felon New Admissions Table D summarizes actual felon new admissions (NAs) to CDCR from fiscal year 2002-03 through fiscal year 2011-12. NAs exclude Parole Violators Returned with a New Term (PV-WNTs) and Parole Violators Returned to Custody (PV-RTCs). Admission rates displayed in Tables D and E are expressed as the number of felon new admissions from court per 100,000 California residents, ages 18-49. New admissions have decreased substantially as a result of Realignment legislation enacted in 2011. In the last fiscal year, the number of NAs was 28,553, a decrease of 12,314, or 30.1 percent, compared to the number of NAs in fiscal year 2010-11.
Table D Actual Total Felon New Admissions
Fiscal years 2002-03 through 2011-12
Fiscal Year
Number of Felon New
Admissions1
State Population Ages 18-49
(In Thousands)2
Admission Rate3
2002-03 40,614 16,865.7 240.8 2003-04 45,434 16,965.1 267.8 2004-05 47,204 17,008.6 277.5 2005-06 49,474 17,021.8 290.7 2006-07 47,770 17,057.1 280.1 2007-08 46,263 17,111.2 270.4 2008-09 44,436 17,117.6 259.6 2009-10 44,700 17,160.1 260.5 2010-11 40,867 17,186.5 237.8 2011-12 28,553 17,160.0 166.4
1 Excludes Division of Juvenile Justice cases, other state/federal admissions, or direct admissions to parole. 2 Based on California Department of Finance Population estimates and projections. See the Methodology
and Technical Notes Section in Appendix C for more information. 3 Number of CDCR felon admissions per 100,000 California State residents, ages 18-49.
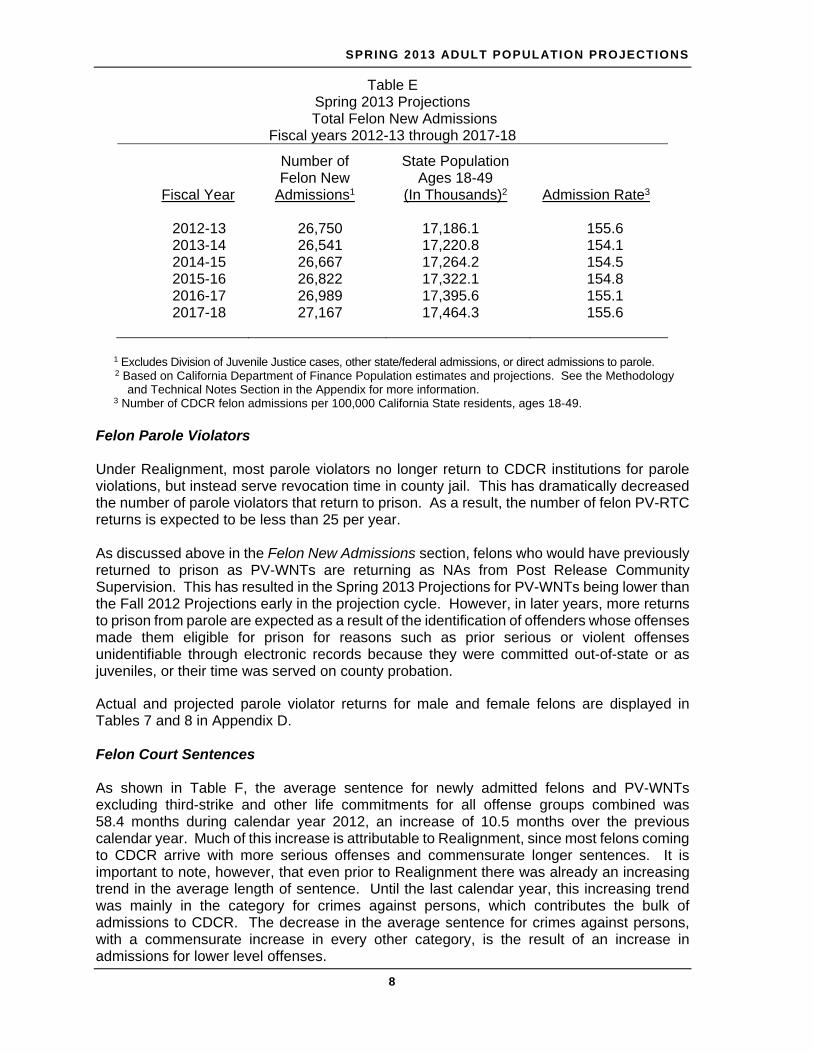
Table E displays the projected number of NAs for Spring 2013, as well as the admission rate. The Spring 2013 NA Projection is higher than the Fall 2012 NA Projection. While admissions were lower than in previous calendar years because of Realignment, there were more admissions during the last six months of 2012 than in the first six months, which is contrary to the normal seasonal pattern. Additionally, during calendar year 2012, more NAs from court arrived than were expected. The unexpected admissions were offenders whose offenses made them eligible for either state prison or county jail, or they had prior serious or violent offenses that were unidentifiable through electronic records because they were committed out-of-state or as juveniles, or their time was served on county probation. Another factor that impacts the NAs is the number of offenders returning to prison from county Post Release Community Supervision. Prior to Realignment, such offenders would have been on state parole and would have returned to prison from parole as PV-WNTs rather than as NAs. It is expected that these trends will continue. Actual and projected admissions from court for male and female felons are displayed in Tables 7 and 8 in Appendix D.
SPRING 2013 ADULT POPULATION PROJECTIONS
8
Table E Spring 2013 Projections Total Felon New Admissions
Fiscal years 2012-13 through 2017-18
Fiscal Year
Number of Felon New
Admissions1
State Population Ages 18-49
(In Thousands)2
Admission Rate3
2012-13 26,750 17,186.1 155.6 2013-14 26,541 17,220.8 154.1 2014-15 26,667 17,264.2 154.5 2015-16 26,822 17,322.1 154.8 2016-17 26,989 17,395.6 155.1 2017-18 27,167 17,464.3 155.6
1 Excludes Division of Juvenile Justice cases, other state/federal admissions, or direct admissions to parole. 2 Based on California Department of Finance Population estimates and projections. See the Methodology
and Technical Notes Section in the Appendix for more information. 3 Number of CDCR felon admissions per 100,000 California State residents, ages 18-49.
Felon Parole Violators Under Realignment, most parole violators no longer return to CDCR institutions for parole violations, but instead serve revocation time in county jail. This has dramatically decreased the number of parole violators that return to prison. As a result, the number of felon PV-RTC returns is expected to be less than 25 per year. As discussed above in the Felon New Admissions section, felons who would have previously returned to prison as PV-WNTs are returning as NAs from Post Release Community Supervision. This has resulted in the Spring 2013 Projections for PV-WNTs being lower than the Fall 2012 Projections early in the projection cycle. However, in later years, more returns to prison from parole are expected as a result of the identification of offenders whose offenses made them eligible for prison for reasons such as prior serious or violent offenses unidentifiable through electronic records because they were committed out-of-state or as juveniles, or their time was served on county probation.
Actual and projected parole violator returns for male and female felons are displayed in Tables 7 and 8 in Appendix D. Felon Court Sentences As shown in Table F, the average sentence for newly admitted felons and PV-WNTs excluding third-strike and other life commitments for all offense groups combined was 58.4 months during calendar year 2012, an increase of 10.5 months over the previous calendar year. Much of this increase is attributable to Realignment, since most felons coming to CDCR arrive with more serious offenses and commensurate longer sentences. It is important to note, however, that even prior to Realignment there was already an increasing trend in the average length of sentence. Until the last calendar year, this increasing trend was mainly in the category for crimes against persons, which contributes the bulk of admissions to CDCR. The decrease in the average sentence for crimes against persons, with a commensurate increase in every other category, is the result of an increase in admissions for lower level offenses.
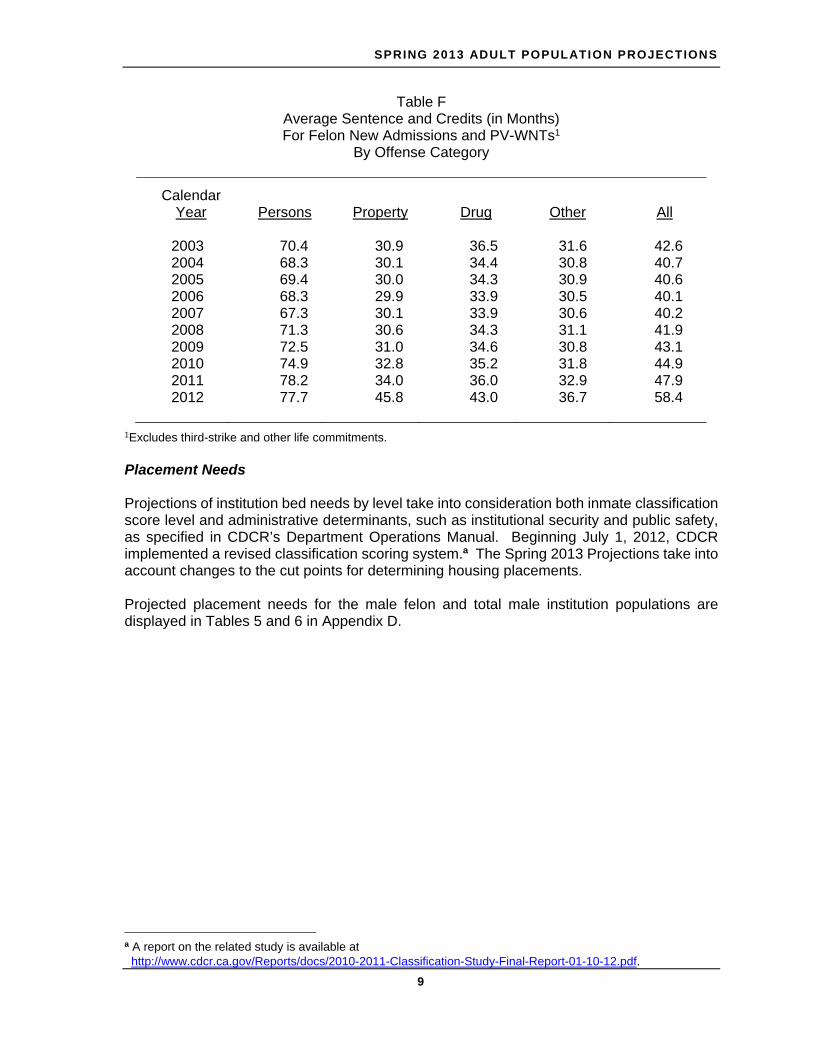
SPRING 2013 ADULT POPULATION PROJECTIONS
9
Table F
Average Sentence and Credits (in Months) For Felon New Admissions and PV-WNTs1
By Offense Category
Calendar Year
Persons Property Drug Other
All
2003 70.4 30.9 36.5 31.6 42.6 2004 68.3 30.1 34.4 30.8 40.7 2005 69.4 30.0 34.3 30.9 40.6 2006 68.3 29.9 33.9 30.5 40.1 2007 67.3 30.1 33.9 30.6 40.2 2008 71.3 30.6 34.3 31.1 41.9 2009 72.5 31.0 34.6 30.8 43.1 2010 74.9 32.8 35.2 31.8 44.9 2011 78.2 34.0 36.0 32.9 47.9 2012 77.7 45.8 43.0 36.7 58.4
1Excludes third-strike and other life commitments.
Placement Needs
Projections of institution bed needs by level take into consideration both inmate classification score level and administrative determinants, such as institutional security and public safety, as specified in CDCR’s Department Operations Manual. Beginning July 1, 2012, CDCR implemented a revised classification scoring system.a The Spring 2013 Projections take into account changes to the cut points for determining housing placements. Projected placement needs for the male felon and total male institution populations are displayed in Tables 5 and 6 in Appendix D.
a A report on the related study is available at http://www.cdcr.ca.gov/Reports/docs/2010-2011-Classification-Study-Final-Report-01-10-12.pdf.
SPRING 2013 ADULT POPULATION PROJECTIONS
10
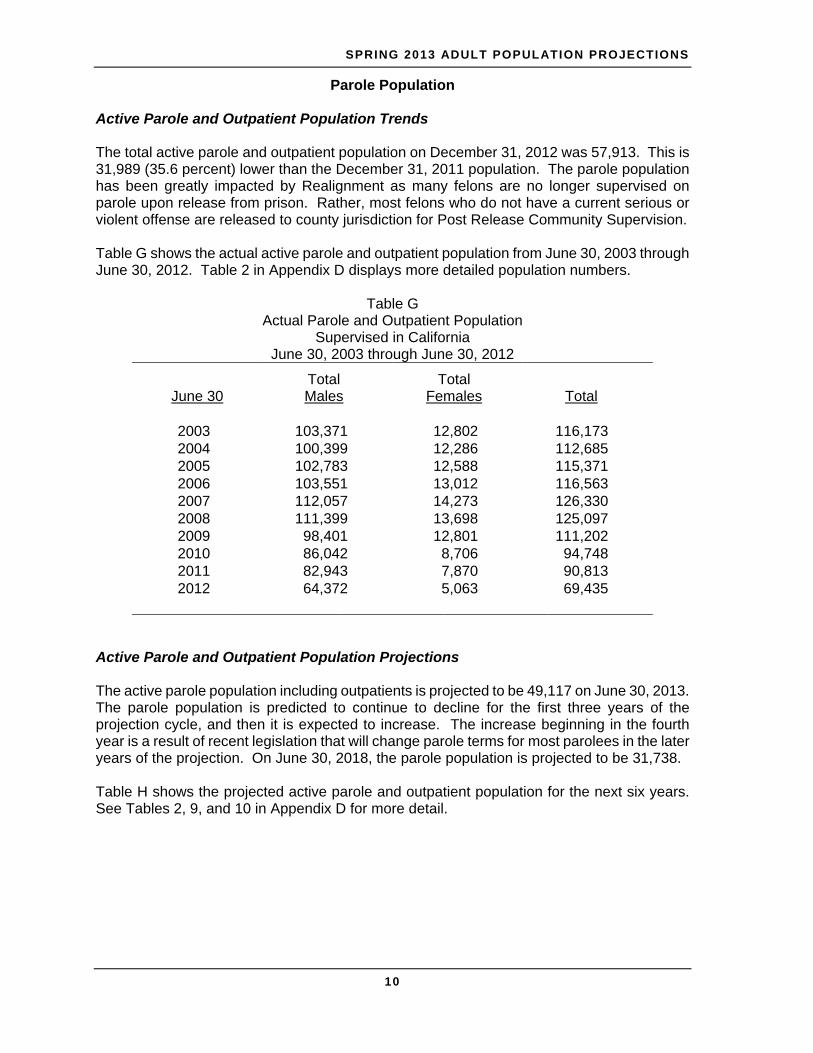
Parole Population Active Parole and Outpatient Population Trends The total active parole and outpatient population on December 31, 2012 was 57,913. This is 31,989 (35.6 percent) lower than the December 31, 2011 population. The parole population has been greatly impacted by Realignment as many felons are no longer supervised on parole upon release from prison. Rather, most felons who do not have a current serious or violent offense are released to county jurisdiction for Post Release Community Supervision. Table G shows the actual active parole and outpatient population from June 30, 2003 through June 30, 2012. Table 2 in Appendix D displays more detailed population numbers.
Table G Actual Parole and Outpatient Population
Supervised in California June 30, 2003 through June 30, 2012
June 30
Total Males
Total Females
Total
2003 103,371 12,802 116,173 2004 100,399 12,286 112,685 2005 102,783 12,588 115,371 2006 103,551 13,012 116,563 2007 112,057 14,273 126,330 2008 111,399 13,698 125,097 2009 98,401 12,801 111,202 2010 86,042 8,706 94,748 2011 82,943 7,870 90,813 2012 64,372 5,063 69,435
Active Parole and Outpatient Population Projections
The active parole population including outpatients is projected to be 49,117 on June 30, 2013. The parole population is predicted to continue to decline for the first three years of the projection cycle, and then it is expected to increase. The increase beginning in the fourth year is a result of recent legislation that will change parole terms for most parolees in the later years of the projection. On June 30, 2018, the parole population is projected to be 31,738. Table H shows the projected active parole and outpatient population for the next six years. See Tables 2, 9, and 10 in Appendix D for more detail.

SPRING 2013 ADULT POPULATION PROJECTIONS
11
Table H
Spring 2013 Projections Active Parole and Outpatient Population
Supervised in California June 30, 2013 through June 30, 2018
June 30
Total Males
Total Females
Total
2013 45,963 3,154 49,117 2014 34,318 2,521 36,839 2015 27,570 2,148 29,718 2016 27,670 2,351 30,021 2017 28,162 2,515 30,677 2018 29,056 2,682 31,738
Comparison of Spring 2013 Projections to Fall 2012 Projections Table I compares the Spring 2013 Projections with the Fall 2012 Projections for the active parole population. The active parole population is projected to be sometimes lower and sometimes higher than forecasted in the Fall 2012 Projections but, overall, the Spring 2013 population is projected to be very close to the Fall 2012 population. It is important to note that even though the institution population is projected to be higher than in Fall 2012 due to an increase in felon new admissions, much of this increase will not impact the parole population. This is because the additional new admissions expected are primarily low-level offenders who will eventually be released to PRCS rather than parole. On June 30, 2013, the parole population is projected to be 49,117, which is less than one percent (97) lower than projected in the Fall 2012 Projections. By June 30, 2018, the active parole population is projected to be 1.4 percent (437) lower than projected in the Fall 2012 Projections. Actual and projected movements for male and female active felon parole populations are displayed in Tables 11 and 12 in Appendix D.

SPRING 2013 ADULT POPULATION PROJECTIONS
12
Table I Spring 2013 Projections vs. Fall 2012 Projections
Active Parole and Outpatient Population Supervised in California
June 30, 2013 through June 30, 2018
June 30 Spring 2013 Projections
Fall 2012 Projections Difference
2013 49,117 49,214 -97 2014 36,839 36,488 351 2015 29,718 29,115 603 2016 30,021 29,896 125 2017 30,677 31,305 -628 2018 31,738 32,175 -437
Figure 2 shows the actual and projected active parole and outpatient population for 2003 through 2018. As shown in the chart, the parole population peaked in 2007 and has been decreasing ever since. This decrease is due to the discharge of deported parolees in 2009, the implementation of non-revocable parole in 2010, and the passage of Realignment in 2011. As displayed in Table I, the Spring 2013 Projections are very close to the Fall 2012 Projections.
20,000
40,000
60,000
80,000
100,000
120,000
140,000
Po
pu
lati
on
June 30
Figure 2Active Parole and Outpatient Population
June 30, 2003 - June 30, 2018
Actual
Spring 2013
Fall 2012

SPRING 2013 ADULT POPULATION PROJECTIONS
13
Felon Active Parole Movement Trends As was the case in the Fall 2012 projections, the Spring 2013 projections assume discharge reviews at six months for non-serious, non-violent, non-sex registrant parolees, in line with Realignment. Also, like the Fall 2012 projections, the Spring 2013 projections assume all non-serious, non-violent, non-sex registrant parolees will be discharged from parole by October 1, 2014. Recently enacted legislation changes the period of parole for most felons whose commitment offense occurs on or after July 1, 2013 from a period of not exceeding three years to a fixed length of three years. This is expected to contribute to an increase in the parole population in later years. More information about legislation considered in the Spring 2013 Projections is available in Appendix A. Actual and projected parole discharges and other parole movements for male and female felon active parolees are displayed in Tables 11 and 12 in Appendix D.

SPRING 2013 ADULT POPULATION PROJECTIONS
14
APPENDICES

SPRING 2013 ADULT POPULATION PROJECTIONS
15
Appendix A
Significant Chaptered Legislation, Initiatives, Propositions and Policy Changes
Legislation The following legislation was chaptered in 2012 and will have an impact on the state prison system. Whenever possible, the impacts of these bills were included in the Spring 2013 Projections.
Chapter 7, Statutes of 2012 [Assembly Bill 324]. Expands the class of persons who may
be committed to the Department of Corrections and Rehabilitation, Division of Juvenile Facilities (DJF) to include a ward who has committed a specified sex offense, or who was previously found to have committed specified serious or violent offense or a specified sex offense. Additionally, this bill would authorize the chief of the DJF to enter into contracts with counties for the DJF to provide housing to a ward who was in the custody of the DJF on December 12, 2011, and whose commitment was recalled under specific circumstances. This legislation contains an urgency clause. An impact of this bill has not been incorporated into the Population Projections.
Chapter 43, Statutes of 2012
[Senate Bill 1023, (Committee on Budget and Fiscal Review)] Makes the following offenses punishable by imprisonment in the state prison: o Sale of a controlled substance to a minor in a park (H&SC § 11353.7). o Harmful matter, seduction of a minor, as specified (PC § 288.2). o Repeat violation of various sex offenses with children under 16 or 14 years of age
(PC §647.6) o Breaking and entering to molest or annoy a child under 18 years of age (PC § 647.6) o Solicitation to commit by force or violence rape, sodomy, oral copulation, or other
similar offenses, as specified (PC § 653f) o Escape from custody causing serious bodily injury to a peace officer (PC § 836.6) o Escape from a mental hospital (PC § 4536) o Evasion of police by driving the wrong way on a highway (VC § 2800.4) o Purchase, possession or ownership of body armor, as specified (PC § 31360) The impact on these offenses has been incorporated into the Population Projections. Specifies that a parolee held in a local jail is under the sole legal custody and jurisdiction of the local county facility even if placed in an alternative custody program by the Sheriff. When released from the local jail or county alternative custody program, the parolee shall be returned to the parole supervision of the CDCR for the duration of the parole period. The impact of this portion of the bill has not been incorporated into the Population Projections. Clarifies the law regarding cases where a person is on bail for a primary felony offense, and is accused of a second felony offense while on bail. If an individual is ultimately found guilty of both offenses, and the first offense would receive prison time rather than jail time, then the term of the second offense shall be served consecutive to the term of the first offense and be served in prison rather than jail. Also, specifies that for any concurrent term of imprisonment in the state prison for any one crime, the term for all crimes shall be served in state prison.

SPRING 2013 ADULT POPULATION PROJECTIONS
16
The impact of this portion of the bill has not been incorporated into the Population Projections. Provides that persons with an offense commitment prior to the effective date of this bill (June 27, 2012), after serving their prison term, released to parole, and on parole continuously for a specified period may be discharged as follows: o Persons who are non-serious, non-violent or non-sex registrants – on parole
continuously for 6 months; discharged, unless CDCR recommends retaining on parole.
o Persons who are sex registrants, or serious – on parole continuously for 1 year; discharged, unless CDCR recommends retaining on parole.
o Persons who are violent, and whose parole period does not exceed 3 years – on parole continuously for 2 years; discharged, unless CDCR recommends retaining on parole.
o Persons who are violent, and whose parole period does not exceed 5 years – on parole continuously for 3 years; discharged, unless CDCR recommends retaining on parole.
An impact of this portion of the bill has been incorporated into the Population Projections. Provides that persons with an offense commitment prior to July 1, 2013, after serving their prison term, shall be released to parole for a period not exceeding 3 years, unless the commitment offense was one of the specified violent offenses, in which case the person shall be released to parole for a period not exceeding 10 years. An impact of this portion of the bill has been incorporated into the Population Projections. Provides that persons with an offense commitment on or after July 1, 2013, after serving their prison term, shall be released to parole for a period of 3 years, unless the commitment offense was one of the specified violent offenses, in which case the person shall be released to parole for a period of 10 years. An impact of this portion of the bill has been incorporated into the Population Projections.
Chapter 828, Statutes of 2012 [Senate Bill 9]. Authorizes a prisoner who was under
18 years of age at the time of committing an offense for which the prisoner was sentenced to life without parole to submit a petition for recall and resentencing to a sentencing court, and to the prosecuting agency, as specified. Prohibits a prisoner who tortured his or her victim or whose victim was a public safety official, as defined, from filing a petition for recall and resentencing. Requires the petition to include a statement from the defendant that includes, among other things, his or her remorse and work towards rehabilitation. Establishes certain criteria, at least one of which shall be asserted in the petition, to be considered when a court decides whether to conduct a hearing on the petition for recall and resentencing and additional criteria to be considered by the court when deciding whether to grant the petition. Requires the court to hold a hearing if the court finds that the statements in the defendant’s petition are true, as specified. This bill would be applied retroactively. An impact of this bill has not been incorporated into the Population Projections.

SPRING 2013 ADULT POPULATION PROJECTIONS
17
The following Realignment legislation was chaptered in 2011 and continues to have a significant impact on the state prison system.
Chapter 15, Statutes of 2011
[Assembly Bill 109, (Committee on Budget; Blumenfield, Chair)] Provided that a felony is a crime that is punishable with death, by imprisonment in the state prison, or notwithstanding any other provision of law, by imprisonment in a county jail for more than one year. Generally provided that felonies are punishable by imprisonment in a county jail for 16 months, 2, or 3 years. This bill provided exceptions to imprisonment in a county jail for a variety of felonies, including serious felonies and violent felonies, as defined, felonies requiring registration as a sex offender, and when the defendant has a prior conviction for a serious or violent felony, or a felony subjecting the defendant to registration as a sex offender, among other exceptions. This bill contained other related provisions and other existing laws.
Chapter 39, Statutes of 2011 [Assembly Bill 117, (Committee on Budget; Blumenfield, Chair)] The passage of Chapter 15 of the Statutes of 2011, provided that certain felonies shall be punishable by incarceration in a county jail. This bill provided that certain specified felonies would continue to be punishable by incarceration in state prison. This bill made other technical changes and contained other related provisions and other existing laws.
The impact of Realignment legislation has been incorporated into the Population Projections, and some of its impact is now in trend.

SPRING 2013 ADULT POPULATION PROJECTIONS
18
Initiatives Proposition 36 – Three Strikes Law
Revises three strikes law to impose life sentence only when new felony conviction is serious or violent. Authorizes re-sentencing for offenders currently serving life sentences if third strike conviction was not serious or violent and judge determines sentence does not pose unreasonable risk to public safety. Continues to impose life sentence penalty if third strike conviction was for certain non-serious, non-violent sex or drug offenses or involved firearm possession. Maintains life sentence penalty for felons with non-serious, non-violent third strike if prior convictions were for rape, murder, or child molestation. This proposition was passed into law on November 6, 2012 and will have an impact on the prison population but the impact has not been incorporated into the Population Projections.
Policy Changes Currently, there are no new policy changes that have been implemented that will have an impact on the State prison system.

SPRING 2013 ADULT POPULATION PROJECTIONS
19
Appendix B
Methodology and Technical Notes The CDCR Office of Research uses the most current data and prevailing methodologies to produce these population projections. External experts are periodically employed to review the methodologies as a means of continual improvement of the techniques applied. Although the CDCR institution and parole population projections are designed to be as accurate as possible, most corrections population experts agree that projections beyond two to three years are difficult at best.b Most experts also agree that micro-simulation models provide the most accurate long-term projections. To forecast future population levels, Adult Population Projections first utilizes projected new admissions and then a micro-simulation model to project the number of offenders who will be returned to prison, and how long they and current inmates will stay. The model simulates the expected movements (e.g., from institution to parole, from parole to discharge) and lengths of stay at each stage for each individual offender, one felon at a time. Movements and lengths of stay are based upon historical trend data input into the model. The simulation process continues until each felon either dies, discharges, or his or her next move is beyond the projection period. When one of these conditions occur the model returns to the main program for the next felon until it has processed all offenders projected in the system. Offender movement in the modeling process is based on major factors that affect the population, such as new admissions from court, length of stay in prison, length of stay on parole, and rate of return to prison from parole. This process requires the application of sound and reasonable assumptions and provides realistic projections of trends that are grounded in historical and current data.
The California population data is based on demographic data obtained from the California Department of Finance.c This population data is provided for calendar year midpoints (July 1). For the purposes of this report, data for two points in time were averaged to afford a closer fit to the state fiscal year. The Spring 2013 Population Projections used state population data for all years of the projections cycle.
b See, for example, “Public Safety, Public Spending: Forecasting America’s Prison Population, 2007-2011.”
Public Safety Performance, The Pew Charitable Trusts, February 2007 (Available at http://www.pewcenteronthestates.org), and also, Butts, J., and Adams, W. 2001 (March). Anticipating space needs in juvenile detention and correctional facilities. Washington, DC: U.S. Department of Justice, Office of Justice Programs, Office of Juvenile Justice and Delinquency Prevention.
c State of California, Department of Finance, Race/Hispanics Population with Age and Gender Detail, 2000–2010. Sacramento, California, September 2012 and Interim Population Projections for California and Its Counties 2010-2050, Sacramento, California, May 2012.

SPRING 2013 ADULT POPULATION PROJECTIONS
20
Appendix C
Glossary of Terms Used in Projections
ADP (Average Daily Population): The average population per day for a stated population for a specified time period, usually one year.
ADMISSION: The first commitment from court for felons and civil narcotic addicts.
CCC: Community Correctional Center
CNA (Civil Narcotic Addict): An offender civilly committed to CDCR for treatment of narcotic addiction per Welfare and Institutions Code 3000 et seq.
CO-OPS (Cooperative Cases): Cases provided parole supervision through the Interstate Compact agreement between California and other states.
COP (Continued on Parole): Parolees who are returned to CDCR custody and are returned to parole without having revocation time assessed and their parole revoked.
DIAGNOSTIC (County Diagnostic Case): An offender placed by the court in CDCR custody for a pre-sentence diagnostic evaluation (Penal Code Section 1203.03).
DJJ “M” Cases: Youth offenders under Division of Juvenile Justice jurisdiction currently housed in adult facilities.
DOF: Department of Finance
DISCHARGE: When an offender is no longer under the jurisdiction of the CDCR.
DSL: Cases that fall under the Determinate Sentencing Law.
FELON: A person convicted of a felony offense and sentenced to state prison by the court.
ICSS (Inmate Classification Score System): Security level classification system implemented on October 15, 2002.
LEVEL I, II, III, IV: The security level, and therefore the facility level, assigned to inmates based on their ICSS score ranges. The higher the score, the higher the security level.
MEAN: The sum of individual values divided by the number of cases; an average of all values.
NA (New Admission): See Admission.
OUTPATIENT: A civil narcotic addict on parole.
PAL (Parolee-At-Large): A felon parolee who absconds (hides) from parole supervision.
PAROLE: After the prison term is served, offenders are supervised in the community by CDCR for an established period up to the statutory maximum.
SPRING 2013 ADULT POPULATION PROJECTIONS
21
PAROLEE: A felon released from confinement in state prison to supervision in the community.
PENDING REVOCATION: A parolee who has been charged with violating a condition of parole and placed in CDCR custody pending investigation to determine if revocation time will be assessed.
PHU: Protective Housing Unit.
PV-RTC (Parole Violator-Returned To Custody): A parolee who has violated the conditions of parole and has been returned to prison.
PV-WNT (Parole Violator-Returned With a New Term): A parolee who has received a court sentence for a new crime and been returned to prison.
RAL (Releasee-At-Large): A civil narcotic addict (CNA) on outpatient (parole) status who absconds from CDCR supervision.
RECEPTION CENTER: An institution designated by the director as a center for the reception of prisoners newly committed to CDCR.
SAFEKEEPER: County prisoners housed in state prison during sentencing when the county facility does not have adequate facilities to provide for the prisoner.
SERIOUS/VIOLENT(S/V): Serious, as defined in Penal Code (PC) 1192.7(c) and 1192.8, and Violent as defined in PC 667.5(c).
SHU: Security Housing Unit.
SUSPENSION: The interruption of a parole period, usually by absconding. Time on suspension is not credited to the period of parole.

SPRING 2013 ADULT POPULATION PROJECTIONS
22
Appendix D
Tables 1 though 14

Estimates and Statistical Analysis SectionOffender Information Services Branch
California Department of Corrections and RehabilitationFebruary 28, 2013
As of June 30 Total
Total Males
Male Felons
Male
Addicts1
Male
Others2Total
FemalesFemale Felons
Female
Addicts1
Female
Others2
Actual
2003 160,931 150,851 149,449 1,104 298 10,080 9,752 270 582004 163,500 152,859 151,493 1,086 280 10,641 10,339 261 412005 164,179 153,323 152,016 966 341 10,856 10,528 283 452006 172,561 160,812 159,616 908 288 11,749 11,335 366 482007 173,312 161,424 160,325 800 299 11,888 11,571 281 36
2008 170,973 159,581 158,681 656 244 11,392 11,131 222 392009 167,832 156,805 155,986 615 204 11,027 10,761 238 282010 165,817 155,721 154,995 554 172 10,096 9,869 198 292011 162,368 152,803 152,206 419 178 9,565 9,409 131 252012 135,238 128,829 128,476 235 118 6,409 6,287 102 20
Projected
2013 131,071 125,244 125,121 0 123 5,827 5,807 0 202014 129,427 123,687 123,569 0 118 5,740 5,720 0 202015 129,148 123,342 123,229 0 113 5,806 5,787 0 192016 129,854 124,059 123,951 0 108 5,795 5,776 0 192017 131,095 125,170 125,067 0 103 5,925 5,906 0 192018 132,006 126,004 125,905 0 99 6,002 5,984 0 18
1 Civil Narcotic Addict commitments.2 Others include county diagnostic cases, other state/federal prisoners, county safekeepers and Juvenile Justice (JJ) wards.
Spring 2013 Adult Population Projections
Table 1Institution Population
June 30, 2003 through June 30, 2018

Estimates and Statistical Analysis SectionOffender Information Services Branch
California Department of Corrections and RehabilitationFebruary 28, 2013
Table 2
As of June 30 Total
Total Males
Male Felons
Male
Outpatients1
Male
Others2Total
FemalesFemale Felons
Female
Outpatients1
Female
Others2
Actual
2003 116,173 103,371 99,937 2,034 1,400 12,802 11,976 636 190 2004 112,685 100,399 97,311 1,628 1,460 12,286 11,563 533 190 2005 115,371 102,783 99,930 1,473 1,380 12,588 11,946 458 184 2006 116,563 103,551 100,850 1,327 1,374 13,012 12,422 419 171 2007 126,330 112,057 109,506 1,264 1,287 14,273 13,581 504 188
2008 125,097 111,399 109,080 1,071 1,248 13,698 13,075 427 196 2009 111,202 98,401 96,201 948 1,252 12,801 12,230 357 214 2010 94,748 86,042 84,000 785 1,257 8,706 8,174 322 210 2011 90,813 82,943 80,967 685 1,291 7,870 7,367 299 204 2012 69,435 64,372 62,457 545 1,370 5,063 4,659 228 176
Projected
2013 49,117 45,963 44,364 0 1,599 3,154 2,939 0 215 2014 36,839 34,318 32,632 0 1,686 2,521 2,301 0 220 2015 29,718 27,570 25,857 0 1,713 2,148 1,925 0 223 2016 30,021 27,670 25,944 0 1,726 2,351 2,127 0 224 2017 30,677 28,162 26,426 0 1,736 2,515 2,290 0 225 2018 31,738 29,056 27,311 0 1,745 2,682 2,457 0 225
Note: These projections do not include non-revocable parolees.1 Civil Narcotic Addict commitments.2 Others include county diagnostic cases, other state/federal prisoners, county safekeepers and Juvenile Justice (JJ) wards.
Spring 2013 Adult Population Projections
Active Parole and Outpatient PopulationSupervised in California
June 30, 2003 through June 30, 2018

Estimates and Statistical Analysis SectionOffender Information Services Branch
California Department of Corrections and RehabilitationFebruary 28, 2013
ActualJune 30 Sep 30 Dec 31 Mar 31 Jun 30 Sep 30 Dec 31 Mar 31 Jun 30
2012 2012 2012 2013 2013 2013 2013 2014 2014Male Population Felons 128,476 127,018 126,764 126,156 125,121 124,610 124,606 124,005 123,569
Addicts1235 127 120 121 0 0 0 0 0
Others2118 124 125 124 123 121 120 119 118
Total Male 128,829 127,269 127,009 126,401 125,244 124,731 124,726 124,124 123,687
Female Population Felons 6,287 5,982 5,860 5,839 5,807 5,805 5,798 5,755 5,720
Addicts1102 88 47 40 0 0 0 0 0
Others220 23 19 20 20 20 20 20 20
Total Female 6,409 6,093 5,926 5,899 5,827 5,825 5,818 5,775 5,740
Total Population Felons 134,763 133,000 132,624 131,995 130,928 130,415 130,404 129,760 129,289
Addicts1 337 215 167 161 0 0 0 0 0
Others2 138 147 144 144 143 141 140 139 138 Total 135,238 133,362 132,935 132,300 131,071 130,556 130,544 129,899 129,427
1 Civil Narcotic Addict commitments.2 Others include county diagnostic cases, other state/federal prisoners, county safekeepers and Juvenile Justice (JJ) wards.
Note: Data through December 2012 are actual.
Spring 2013 Adult Population Projections
Table 3Institution Population
Fiscal Years 2012-13 through 2013-14
Fiscal Year 2012-2013 Fiscal Year 2013-2014
Estimates and Statistical Analysis SectionOffender Information Services Branch
California Department of Corrections and RehabilitationFebruary 28, 2013
First Second Third Fourth FY First Second Third Fourth FYQuarter Quarter Quarter Quarter Average Quarter Quarter Quarter Quarter Average
Male Population Felons 127,550 127,013 126,488 125,543 126,649 124,838 124,638 124,208 123,770 124,364
Addicts1187 120 119 92 130 0 0 0 0 0
Others2125 128 125 123 125 122 121 119 118 120
Total Male 127,862 127,261 126,732 125,758 126,904 124,960 124,759 124,327 123,888 124,484
Female Population Felons 6,107 5,937 5,860 5,821 5,931 5,815 5,792 5,779 5,738 5,781
Addicts194 65 42 33 59 0 0 0 0 0
Others222 23 20 20 21 20 20 20 20 20
Total Female 6,223 6,025 5,922 5,874 6,011 5,835 5,812 5,799 5,758 5,801
Total Population Felons 133,657 132,950 132,348 131,364 132,580 130,653 130,430 129,987 129,508 130,145
Addicts1 281 185 161 125 189 0 0 0 0 0
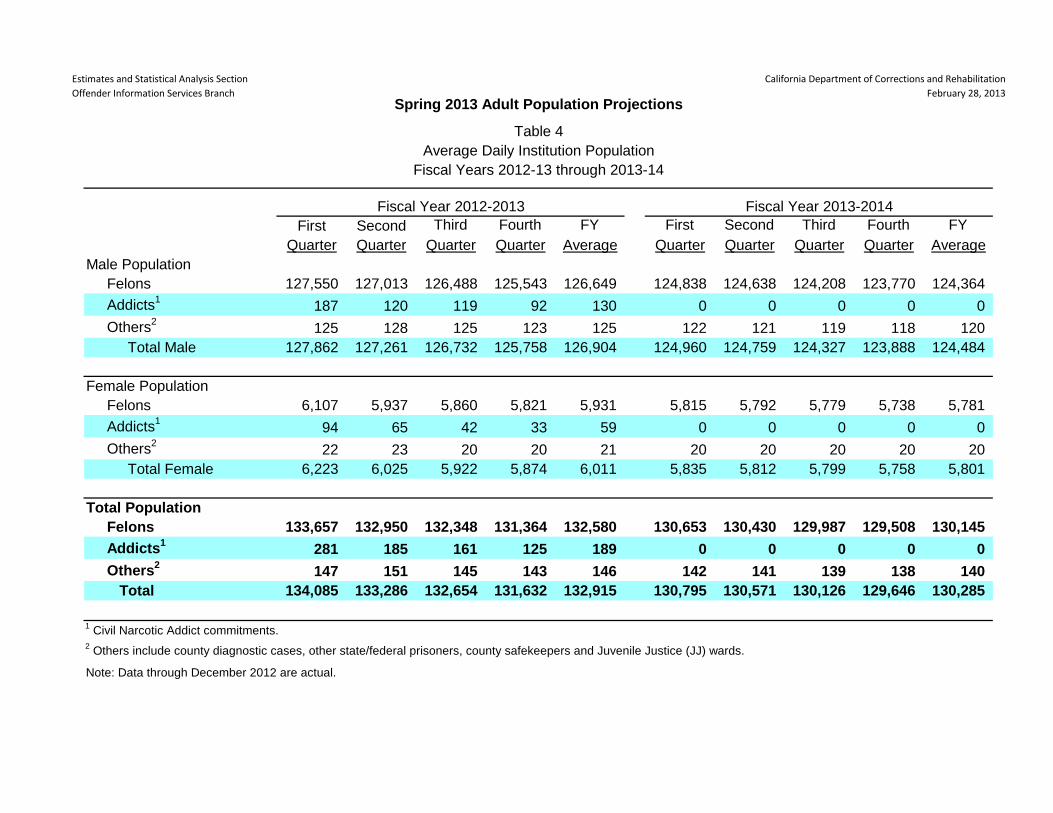
Others2 147 151 145 143 146 142 141 139 138 140 Total 134,085 133,286 132,654 131,632 132,915 130,795 130,571 130,126 129,646 130,285
1 Civil Narcotic Addict commitments.2 Others include county diagnostic cases, other state/federal prisoners, county safekeepers and Juvenile Justice (JJ) wards.
Note: Data through December 2012 are actual.
Fiscal Year 2012-2013 Fiscal Year 2013-2014
Spring 2013 Adult Population Projections
Table 4Average Daily Institution Population
Fiscal Years 2012-13 through 2013-14

Estimates and Statistical Analysis SectionOffender Information Services Branch
California Department of Corrections and RehabilitationFebruary 28, 2013
Fiscal Fiscal Reception Level Level Level Level Special Housing TotalYear Quarter Center I II III IV PHU SHU Total Population
2012-13 September 30 10,612 15,146 32,344 34,308 28,709 13 5,886 5,899 127,018 December 31 10,010 15,411 36,888 32,541 26,151 14 5,749 5,763 126,764 March 31 8,950 14,861 39,129 32,393 25,215 14 5,594 5,608 126,156 June 30 9,588 14,226 40,268 31,575 24,151 14 5,299 5,313 125,121
2013-14 September 30 10,002 13,968 41,532 30,805 23,184 14 5,105 5,119 124,610 December 31 10,116 14,004 42,963 30,276 22,228 14 5,005 5,019 124,606 March 31 9,837 13,911 42,911 30,329 22,091 14 4,912 4,926 124,005 June 30 10,077 13,700 42,733 30,306 21,942 14 4,797 4,811 123,569
2014-15 June 30 10,072 13,815 42,618 30,470 21,735 14 4,505 4,519 123,229
2015-16 June 30 10,002 14,398 42,822 30,787 21,587 13 4,342 4,355 123,951
2016-17 June 30 10,025 14,812 43,385 30,956 21,655 12 4,222 4,234 125,067
2017-18 June 30 10,027 15,275 43,528 31,090 21,802 12 4,171 4,183 125,905
Note: Data through December 2012 are actual.
Spring 2013 Adult Population Projections
Table 5Projected Placement Needs for Male Felon Institution Population
Fiscal Years 2012-13 through 2017-18
Estimates and Statistical Analysis SectionOffender Information Services Branch
California Department of Corrections and RehabilitationFebruary 28, 2013
Fiscal Fiscal Reception Level Level Level Level Special Housing TotalYear Quarter Center I II III IV PHU SHU Total Population
2012-13 September 30 10,736 15,146 32,471 34,308 28,709 13 5,886 5,899 127,269 December 31 10,135 15,411 37,008 32,541 26,151 14 5,749 5,763 127,009 March 31 9,074 14,861 39,250 32,393 25,215 14 5,594 5,608 126,401 June 30 9,711 14,226 40,268 31,575 24,151 14 5,299 5,313 125,244
2013-14 September 30 10,123 13,968 41,532 30,805 23,184 14 5,105 5,119 124,731 December 31 10,236 14,004 42,963 30,276 22,228 14 5,005 5,019 124,726 March 31 9,956 13,911 42,911 30,329 22,091 14 4,912 4,926 124,124 June 30 10,195 13,700 42,733 30,306 21,942 14 4,797 4,811 123,687
2014-15 June 30 10,185 13,815 42,618 30,470 21,735 14 4,505 4,519 123,342
2015-16 June 30 10,110 14,398 42,822 30,787 21,587 13 4,342 4,355 124,059
2016-17 June 30 10,128 14,812 43,385 30,956 21,655 12 4,222 4,234 125,170
2017-18 June 30 10,126 15,275 43,528 31,090 21,802 12 4,171 4,183 126,004
Note: Reception Center includes others as defined on Table 1. Level II includes civil narcotic addict commitments.
Note: Data through December 2012 are actual.
Spring 2013 Adult Population Projections
Table 6Projected Placement Needs for Total Male Institution Population
Fiscal Years 2012-13 through 2017-18

Estimates and Statistical Analysis SectionOffender Information Services Branch
California Department of Corrections and RehabilitationFebruary 28, 2013
Fiscal Year
Fiscal Quarter
Total Intake
From Court
PV-WNT
PV-RTC
Other
Intake1Total Outgo
First Parole
PV-RTC Parole
Other
Outgo2Gain/ Loss
Population End of Qtr
2011-12 Jul-Sep 24,983 8,526 3,613 12,765 79 26,345 10,909 13,210 2,226 -1,362 150,828Oct-Dec 9,855 5,929 2,297 1,560 69 22,166 3,966 6,516 11,684 -12,311 139,149Jan-Mar 7,750 5,549 1,992 151 58 14,812 3,714 1,627 9,471 -7,062 131,914Apr-Jun 7,977 5,967 1,829 130 51 11,530 3,736 549 7,245 -3,553 128,476
Total 50,565 25,971 9,731 14,606 257 74,853 22,325 21,902 30,626 -24,288
2012-13 Jul-Sep 8,185 6,247 1,881 14 43 9,689 3,646 140 5,903 -1,504 127,018Oct-Dec 8,394 6,622 1,723 13 36 8,794 3,645 23 5,126 -400 126,764Jan-Mar * 7,314 5,749 1,544 3 18 7,924 3,708 9 4,207 -610 126,156Apr-Jun * 7,564 6,176 1,375 4 9 8,599 4,000 2 4,597 -1,035 125,121
Total 31,457 24,794 6,523 34 106 35,006 14,999 174 19,833 -3,549
2013-14 Jul-Sep * 7,537 6,252 1,268 3 14 8,048 3,675 1 4,372 -511 124,610Oct-Dec * 7,557 6,293 1,246 4 14 7,561 3,454 2 4,105 -4 124,606Jan-Mar * 7,052 5,807 1,223 4 18 7,653 3,500 1 4,152 -601 124,005Apr-Jun * 7,364 6,228 1,117 3 16 7,800 3,628 1 4,171 -436 123,569
Total 29,510 24,580 4,854 14 62 31,062 14,257 5 16,800 -1,552
* Projected
1 Other intake includes JJ 'M' cases and transfers from other states.2 Other outgo includes discharges and death.
Spring 2013 Adult Population Projections
Table 7Movement of Male Felon Institution Population
Fiscal Years 2011-12 through 2013-14
Estimates and Statistical Analysis SectionOffender Information Services Branch
California Department of Corrections and RehabilitationFebruary 28, 2013
Fiscal Year
Fiscal Quarter
Total Intake
From Court
PV-WNT
PV-RTC
Other
Intake1Total Outgo
First Parole
PV-RTC Parole
Other
Outgo2Gain/ Loss
Population End of Qtr
2011-12 Jul-Sep 2,398 1,196 277 921 4 2,607 1,033 945 629 -209 9,266Oct-Dec 769 512 116 136 5 2,196 286 374 1,536 -1,427 7,902Jan-Mar 514 432 74 6 2 1,585 242 78 1,265 -1,071 6,852Apr-Jun 565 474 84 4 3 1,149 258 17 874 -584 6,287
Total 4,246 2,614 551 1,067 14 7,537 1,819 1,414 4,304 -3,291
2012-13 Jul-Sep 526 463 58 1 4 847 225 3 619 -321 5,982Oct-Dec 607 527 68 2 10 731 254 1 476 -124 5,860Jan-Mar * 553 484 62 0 7 574 262 1 311 -21 5,839Apr-Jun * 560 486 72 0 2 592 254 0 338 -32 5,807
Total 2,246 1,960 260 3 23 2,744 995 5 1,744 -498
2013-14 Jul-Sep * 552 488 61 0 3 554 247 0 307 -2 5,805Oct-Dec * 557 489 63 0 5 564 241 0 323 -7 5,798Jan-Mar * 548 491 55 0 2 591 266 0 325 -43 5,755Apr-Jun * 529 493 34 0 2 564 256 0 308 -35 5,720
Total 2,186 1,961 213 0 12 2,273 1,010 0 1,263 -87
* Projected
1 Other intake includes JJ 'M' cases and transfers from other states.2 Other outgo includes discharges and death.
Spring 2013 Adult Population Projections
Table 8Movement of Female Felon Institution Population
Fiscal Years 2011-12 through 2013-14

Estimates and Statistical Analysis SectionOffender Information Services Branch
California Department of Corrections and RehabilitationFebruary 28, 2013
ActualJune 30 Sep 30 Dec 31 Mar 31 Jun 30 Sep 30 Dec 31 Mar 31 Jun 30
2012 2012 2012 2013 2013 2013 2013 2014 2014
Male Population
Felons 62,457 56,678 51,842 47,245 44,364 40,855 37,824 35,238 32,632
Outpatients1545 540 459 374 0 0 0 0 0
Others21,370 1,384 1,505 1,553 1,599 1,632 1,655 1,673 1,686
Total Male 64,372 58,602 53,806 49,172 45,963 42,487 39,479 36,911 34,318
Female Population
Felons 4,659 4,113 3,695 3,292 2,939 2,689 2,473 2,376 2,301
Outpatients1228 215 200 164 0 0 0 0 0
Others2176 187 212 213 215 217 218 219 220
Total Female 5,063 4,515 4,107 3,669 3,154 2,906 2,691 2,595 2,521
Total Population
Felons 67,116 60,791 55,537 50,537 47,303 43,544 40,297 37,614 34,933 Outpatients1 773 755 659 538 0 0 0 0 0
Others2 1,546 1,571 1,717 1,766 1,814 1,849 1,873 1,892 1,906
Total 69,435 63,117 57,913 52,841 49,117 45,393 42,170 39,506 36,839
1 Civil Narcotic Addict commitments and releasees.2 Others include co-ops and other state/federal parolees.
Note: Data through December 2012 are actual.
Note: These projections do not include non-revocable parolees.
Spring 2013 Adult Population Projections
Table 9California Supervised Parole and Outpatient Population
Fiscal Years 2012-13 through 2013-14
Fiscal Year 2012-2013 Fiscal Year 2013-2014

Estimates and Statistical Analysis SectionOffender Information Services Branch
California Department of Corrections and RehabilitationFebruary 28, 2013
First Second Third Fourth FY First Second Third Fourth FYQuarter Quarter Quarter Quarter Average Quarter Quarter Quarter Quarter Average
Male Population
Felons 59,559 54,062 49,516 45,787 52,231 42,594 39,314 36,528 33,900 38,084
Outpatients1540 484 419 286 432 0 0 0 0 0
Others21,377 1,454 1,525 1,577 1,483 1,616 1,644 1,665 1,680 1,651
Total Male 61,476 56,000 51,460 47,650 54,146 44,210 40,958 38,193 35,580 39,735
Female Population
Felons 4,390 3,865 3,484 3,102 3,710 2,798 2,593 2,437 2,339 2,542
Outpatients1223 207 183 125 185 0 0 0 0 0
Others2181 203 212 214 203 216 217 219 220 218
Total Female 4,794 4,275 3,879 3,441 4,098 3,014 2,810 2,656 2,559 2,760
Total Population
Felons 63,949 57,927 53,000 48,889 55,941 45,392 41,907 38,965 36,239 40,626
Outpatients1 763 691 602 411 617 0 0 0 0 0
Others2 1,558 1,657 1,737 1,791 1,686 1,832 1,861 1,884 1,900 1,869
Total 66,270 60,275 55,339 51,091 58,244 47,224 43,768 40,849 38,139 42,495
Note: These projections do not include non-revocable parolees.1 Civil Narcotic Addict commitments and releasees.2 Others include co-ops and other state/federal prisoners.
Note: Data through December 2012 are actual.
Fiscal Year 2012-2013 Fiscal Year 2013-2014
Spring 2013 Adult Population Projections
Table 10Average Daily California Supervised Parole and Outpatient Population
Fiscal Years 2012-13 through 2013-14

Estimates and Statistical Analysis SectionOffender Information Services Branch
California Department of Corrections and RehabilitationFebruary 28, 2013
Fiscal Year
Fiscal Quarter
Total Intake Paroled Reinstated
Other
Intake1Total Outgo DCH
PV-WNT
PV-RTC PALs2
Other
Outgo3Gain/ Loss
Population End of Qtr
2011-12 Jul-Sep 33,318 24,119 8,410 789 33,280 7,342 3,395 11,776 9,573 1,194 38 81,009Oct-Dec 19,416 10,482 8,731 203 20,171 6,653 2,177 1,548 9,057 736 -755 80,561Jan-Mar 15,849 5,341 10,320 188 20,727 7,252 1,915 151 10,863 546 -4,878 75,813Apr-Jun 15,011 4,285 10,550 176 28,399 15,226 1,750 130 10,992 301 -13,388 62,457
Total 83,594 44,227 38,011 1,356 102,577 36,473 9,237 13,605 40,485 2,777 -18,983
2012-13 Jul-Sep 14,197 3,786 10,256 155 19,875 7,595 1,817 14 10,182 267 -5,678 56,678Oct-Dec 12,616 3,668 8,877 71 17,468 6,833 1,669 13 8,778 175 -4,852 51,842Jan-Mar * 11,645 3,717 7,846 82 16,242 6,181 1,503 3 8,344 211 -4,597 47,245Apr-Jun * 11,350 4,002 7,261 87 14,231 5,279 1,319 4 7,430 199 -2,881 44,364
Total 49,808 15,173 34,240 395 67,816 25,888 6,308 34 34,734 852 -18,008
2013-14 Jul-Sep * 10,482 3,676 6,736 70 13,991 5,777 1,181 3 6,873 157 -3,509 40,855Oct-Dec * 9,725 3,456 6,202 67 12,756 5,200 1,153 4 6,252 147 -3,031 37,824Jan-Mar * 9,184 3,501 5,604 79 11,770 4,995 1,062 4 5,555 154 -2,586 35,238Apr-Jun * 8,792 3,629 5,087 76 11,398 5,083 913 3 5,279 120 -2,606 32,632
Total 38,183 14,262 23,629 292 49,915 21,055 4,309 14 23,959 578 -11,732
* Projected
1 Other intake includes transfers direct from court, interstate parole unit (ISPU), and co-ops.2 PALs are parolees-at-large with warrant issued (absconded from parole supervison).3 Other outgo includes transfer to ISPU and non-revocable parole, and deaths.
Spring 2013 Adult Population Projections
Table 11Movement of Male Felon Active Parole Population
Fiscal Years 2011-12 through 2013-14
Estimates and Statistical Analysis SectionOffender Information Services Branch
California Department of Corrections and RehabilitationFebruary 28, 2013
Fiscal Year
Fiscal Quarter
Total Intake Paroled Reinstated
Other
Intake1Total Outgo DCH
PV-WNT
PV-RTC PALs2
Other
Outgo3Gain/ Loss
Population End of Qtr
2011-12 Jul-Sep 2,818 1,920 761 137 2,930 810 231 836 823 230 -112 7,241Oct-Dec 1,415 637 754 24 1,795 696 97 135 755 112 -380 6,917Jan-Mar 1,196 320 857 19 1,803 703 65 6 945 84 -607 6,310Apr-Jun 1,131 275 842 14 2,785 1,851 79 3 818 34 -1,654 4,659
Total 6,560 3,152 3,214 194 9,313 4,060 472 980 3,341 460 -2,753
2012-13 Jul-Sep 1,081 229 838 14 1,612 726 53 1 807 25 -531 4,113Oct-Dec 924 255 662 7 1,352 626 66 2 640 18 -428 3,695Jan-Mar * 832 263 559 10 1,235 607 61 0 559 8 -403 3,292Apr-Jun * 725 254 460 11 1,078 520 70 0 478 10 -353 2,939
Total 3,562 1,001 2,519 42 5,277 2,479 250 3 2,484 61 -1,715
2013-14 Jul-Sep * 642 247 389 6 892 418 60 0 399 15 -250 2,689Oct-Dec * 620 241 373 6 836 393 57 0 382 4 -216 2,473Jan-Mar * 610 266 334 10 707 316 51 0 330 10 -97 2,376Apr-Jun * 567 256 301 10 642 299 32 0 304 7 -75 2,301
Total 2,439 1,010 1,397 32 3,077 1,426 200 0 1,415 36 -638
* Projected
1 Other intake includes transfers direct from court, interstate parole unit (ISPU), and co-ops.2 PALs are parolees-at-large with warrant issued (obsconded from parole supervison).3 Other outgo includes transfer to ISPU and non-revocable parole, and deaths.
Spring 2013 Adult Population Projections
Table 12Movement of Female Felon Active Parole Population
Fiscal Years 2011-12 through 2013-14
Estimates and Statistical Analysis SectionOffender Information Services Branch
California Department of Corrections and RehabilitationFebruary 28, 2013
As of June 30 Total
Under Age 35
Age 35-39
Age 40-44
Age 45-49
Age 50-54
Age 55-59
Age 60 and Over
Actual2003 149,449 73,676 24,916 22,697 14,528 7,394 3,405 2,8332004 151,493 74,157 24,299 22,923 15,242 8,052 3,743 3,0772005 152,016 73,347 23,739 22,673 16,213 8,618 4,103 3,3232006 159,616 76,153 24,225 23,151 17,776 9,734 4,880 3,6972007 160,325 75,440 23,504 22,599 18,641 10,693 5,297 4,1512008 158,681 73,509 22,604 21,639 18,946 11,612 5,698 4,6732009 155,986 71,418 21,530 20,736 18,836 12,174 6,152 5,1402010 154,995 70,561 20,795 19,958 18,488 12,761 6,661 5,7712011 152,206 68,640 19,912 19,002 17,819 13,332 7,183 6,3182012 128,476 55,660 16,789 15,661 14,884 12,055 6,992 6,435
Projected2013 125,121 52,700 16,336 15,114 14,175 12,319 7,481 6,9962014 123,569 50,613 16,298 14,576 13,850 12,447 8,008 7,7772015 123,229 49,544 16,130 14,416 13,764 12,342 8,522 8,5112016 123,951 48,425 16,390 14,601 13,743 12,426 8,988 9,3782017 125,067 48,158 16,362 14,621 13,838 12,441 9,424 10,2232018 125,905 47,800 16,179 14,650 13,921 12,216 9,923 11,216
Spring 2013 Adult Population Projections
Table 13Male Felon Institution Population by Age Group
June 30, 2003 through June 30, 2018

Estimates and Statistical Analysis SectionOffender Information Services Branch
California Department of Corrections and RehabilitationFebruary 28, 2013
As of June 30 Total
Under Age 35
Age 35-39
Age 40-44
Age 45-49
Age 50-54
Age 55-59
Age 60 and Over
Actual2003 9,752 4,186 1,979 1,817 979 478 190 1232004 10,339 4,473 2,102 1,865 1,064 478 209 1482005 10,528 4,486 2,034 1,894 1,166 567 222 1592006 11,335 4,842 2,029 2,034 1,383 622 256 1692007 11,571 4,895 2,014 1,998 1,518 674 266 2062008 11,131 4,784 1,774 1,819 1,484 744 316 2102009 10,761 4,700 1,566 1,683 1,442 783 357 2302010 9,869 4,388 1,341 1,398 1,284 842 369 2472011 9,409 4,126 1,319 1,318 1,205 833 355 2532012 6,287 2,739 801 800 810 585 297 255
Projected2013 5,807 2,515 756 691 699 578 296 2722014 5,720 2,380 738 701 684 605 318 2942015 5,787 2,394 729 685 697 616 350 3162016 5,776 2,357 768 675 662 590 366 3582017 5,906 2,386 789 691 675 590 389 3862018 5,984 2,361 820 691 701 619 389 403
Spring 2013 Adult Population Projections
Table 14Female Felon Institution Population by Age Group
June 30, 2003 through June 30, 2018
SPRING 2013 ADULT POPULATION PROJECTIONS
37
Acknowledgments
The population projections in this report were developed by Jenny Belnas and Shelley Buttler under the direction of Jacqui Coder and Jay Atkinson. Loran Sheley provided technical guidance and expertise. Joan Bruce, Estimates and Statistical Analysis Section (ESAS), contributed information on significant chaptered legislation and initiatives. Juan Villon, ESAS, prepared the population and movement tables. Many others within CDCR made contributions to the projections including staff from the Board of Parole Hearings, the Division of Adult Institutions, the Division of Adult Parole Operations, the Division of Rehabilitative Programs, and the Office of Legislation. This report was prepared by Jacqui Coder and initially reviewed by Loran Sheley. Cover designed by John Yessen. Images courtesy of CDCR Office of Public and Employee Communications: (top right) Bus 44 drives toward the vehicle sally port at CSP, Solano; (bottom left) Bus 44 departs Deuel Vocational Institution for San Quentin State Prison.


