California PATHWAYS: A Tool to Examine Long-Term Greenhouse Gas Reduction Scenarios California Air Resources Board Scoping Plan Update Workshop January 15 th , 2016 Snuller Price, Senior Partner
Transcript
California PATHWAYS: A Tool to Examine Long-Term Greenhouse Gas Reduction Scenarios
California Air Resources Board
Scoping Plan Update Workshop January 15th, 2016
Snuller Price, Senior Partner
2
Energy + Environmental Economics (E3)
San Francisco-based consultancy with 40 professionals focusing on electricity sector economics, regulation, planning and technical energy analysis
Broad client base includes utilities, regulators, government agencies, power producers, technology companies, and investors
Our experience has placed us at the nexus of planning, policy and markets
3
About the California PATHWAYS model
Data inputs and data sources
• Examples: Translating a policy into technology adoption assumptions in the model
Examples of model outputs
Key lessons learned so far
Next steps
Topics
ABOUT THE CALIFORNIA PATHWAYS MODEL
5
What is PATHWAYS?
Bottom-up, user-defined, non-optimized scenarios test “what if” questions
Economy-wide model captures interactions between sectors & path-dependencies
Annual time steps for infrastructure-based accounting simulates realistic stock roll over
Hourly treatment of electric sector
Tracks capital investments and fuel costs over time
Energy storage Allows for
development of realistic &
concrete GHG
reduction roadmaps
PATHWAYS does:
Compare user-defined policy and market adoption scenarios
PATHWAYS does not:
Optimize for lowest cost solutions
6
Included in model:
Physical accounting of energy flows within all sectors of the economy
Cost accounting, including energy infrastructure and fuel costs
GHG accounting
Physical representation of policy
Not included in model:
Structural/macroeconomic impacts
• Changes in the costs of goods and services, jobs, structural changes to economy
Societal cost impacts
• Climate benefits of GHG mitigation
Criteria Pollutants
What is PATHWAYS?
7
Basic Energy Modeling Framework
End-Use Energy Services Demand
End-Use Energy Demand
Electricity Supply Pipeline Supply Other Fuels (Gasoline,
Diesel, Hydrogen, etc.)
What is the % of renewables on
the grid?
How much do EVs cost
over the baseline
internal combustion
engine vehicle?
How many GHG
emissions are saved? Model Outputs
Demand Sectors
Supply Sectors
Stock Rollover
How much fuel of each type is
required to meet driving demand?
How many electric
vehicles are on the
road? How many miles do
Californians drive per
year (2010-2050)?
8
In-Depth Electricity Module Included in PATHWAYS
Energy storage
Workplace charging
9
What is the impact of the electric generation mix on the cost and feasibility of a low-carbon future in CA?
2012 Science Paper: “The Technology Path to Deep Greenhouse Gas Emissions Cuts by 2050”
“The Technology Path to Deep Greenhouse Gas Emissions Cuts by 2050: The Pivotal Role of Electricity,” Williams et al, Science (2012)
Compared renewables, nuclear, carbon capture and storage
Demonstrated a feasible pathway to 2050 goal with focus on electrification
10
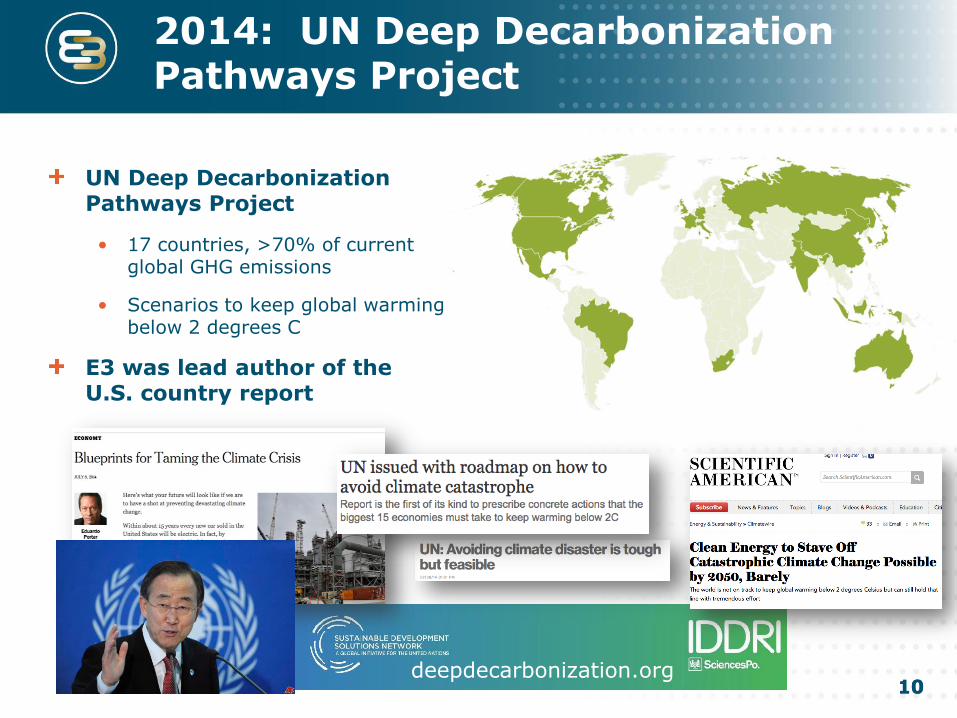
2014: UN Deep Decarbonization Pathways Project
UN Deep Decarbonization Pathways Project
• 17 countries, >70% of current global GHG emissions
• Scenarios to keep global warming below 2 degrees C
E3 was lead author of the U.S. country report
deepdecarbonization.org 10
11
2014-2015: The California PATHWAYS Project
Purpose
• To evaluate the feasibility and cost of a range of GHG reduction scenarios in California (prior to development of Governor’s 2030 goals)
Project sponsors
• California Air Resources Board, Energy Commission, Public Utilities Commission, Independent System Operator & the Governor’s Office
• Additional funding provided by the Energy Foundation
Team
• Energy & Environmental Economics with support from LBNL
Study results: https://ethree.com/public_projects/energy_principals_study.php 11
12
We Modeled Several Scenarios That Reach California’s 2050 GHG Goal
2050 goal: 80% below 1990
Current policies (Reference scenario) are expected to achieve 2020 goal
Examined Scenarios (E.g. Early Deployment, Straight Line scenarios) that achieve 2050 goals
2020 goal: 1990 GHG level
13
1. Reference current GHG policies, as of 2014
Timing Scenarios (achieve 80% below 1990 by 2050)
2. Straight Line distinguished by high renewable energy, fuel cell and battery electric
vehicles, energy efficiency and electrification
3. Early Deployment similar to Straight Line scenario but with more focus on near-term
air quality & GHG actions
4. Slower Commercial
Adoption
delay some higher-cost measures in commercial and trucking until
post-2030, accelerate adoption post-2030 to hit 2050 goal
Alternate Technology Scenarios (achieve 80% below 1990 by 2050)
5. Low Carbon Gas no building electrification, decarbonized pipeline gas
6. Distributed Energy achieves zero-net energy building goals w/ DG PV and grid storage
7. CCS phase-in of CCGTs with CCS post-2030
8. High BEV no fuel cell vehicles, focus on BEVs
Scenarios Evaluate GHG Reduction Timing and Energy Pathways to 2030 and 2050
DATA INPUTS AND DATA SOURCES
15
Model Inputs, Measures and Outputs
Calculated Outputs
e.g. Residential energy demand
Measures (Scenario Input Assumptions) e.g. Appliance efficiency changes
e.g. Changes in new construction
Intermediate Calculations
e.g. Number of residential households
Raw Data Inputs e.g. California population
e.g. Average number of people per household
Illustration of influence between exogenous variables and calculated end use energy services demand
• Energy use from procurement (including desalination, reclaimed water, conservation and groundwater), treatment, conveyance and wastewater-treatment of water
• Sector-Level GHGs Only, with reduction measures by GHG type consistent with CARB inventory categories (e.g. non-CO2 emissions from agriculture, methane from waste and manure, F-gases, etc.)
• Not currently explicitly modeled
17
Expansive Modeling of Supply Technologies and Fuels
Electricity Combined Heat & Power
Pipeline Gas
Liquid fuels Other fossil fuels
• Uranium • Hydro • Coal • Geothermal • Wind • Solar PV • Solar thermal • Natural Gas • Biomass • Biogas • Specified imports
(various types) • Unspecified
imports • Carbon capture &
sequestration
• Waste heat • Natural Gas • Hydrogen • Power to Gas • Biogas
Note: Pipeline gas can be compressed (CNG) liquefied (LNG) or remain as a gas
CEC California Energy Demand Forecast (to be updated from 2014 forecast)
Technology costs and performance
National Energy Modeling System (data used in support of Annual Energy Outlook 2013)
Residential appliance shares
California Residential Appliance Saturation Survey (KEMA, 2009)
Commercial appliance shares
California Commercial End Use Survey (CEUS, 2006)
Transportation Reference scenario data
EMFAC 2014
Vehicle shares
CARB VISION model scenarios developed for the Mobile Source Strategy Discussion Draft
Technology costs
National Academies Press, "Transitions to Alternative Vehicles and Fuels", and
“Assessment of Fuel Economy Technologies for Medium- and Heavy-Duty Vehicles”
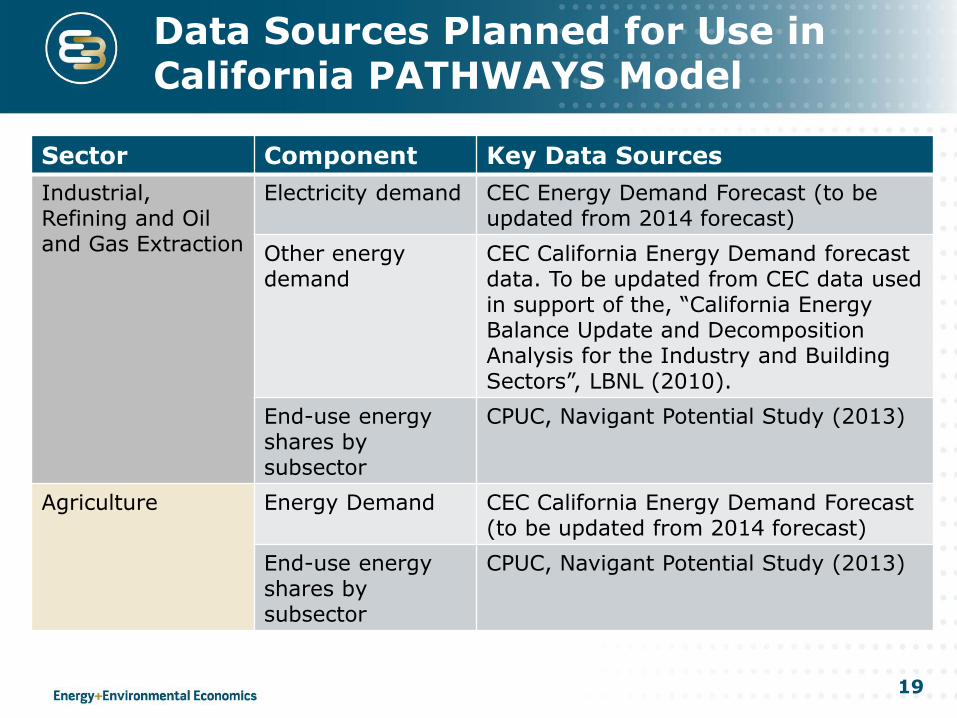
Data Sources Planned for Use in California PATHWAYS Model
19
Sector Component Key Data Sources
Industrial, Refining and Oil and Gas Extraction
Electricity demand CEC Energy Demand Forecast (to be updated from 2014 forecast)
Other energy demand
CEC California Energy Demand forecast data. To be updated from CEC data used in support of the, “California Energy Balance Update and Decomposition Analysis for the Industry and Building Sectors”, LBNL (2010).
End-use energy shares by subsector
CPUC, Navigant Potential Study (2013)
Agriculture Energy Demand CEC California Energy Demand Forecast (to be updated from 2014 forecast)
End-use energy shares by subsector
CPUC, Navigant Potential Study (2013)
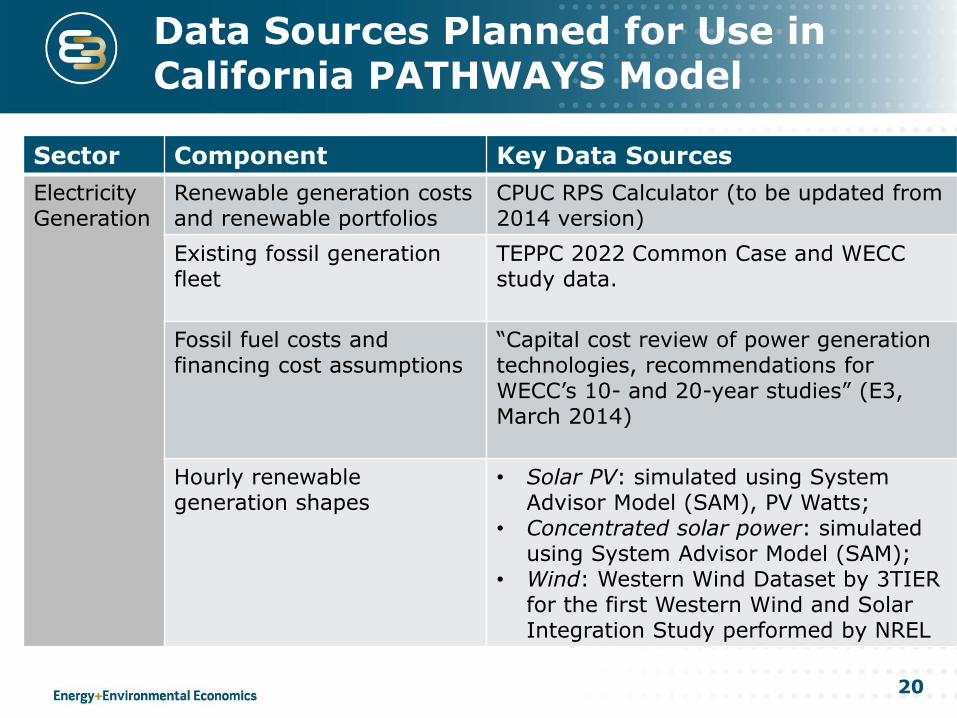
Data Sources Planned for Use in California PATHWAYS Model
20
Sector Component Key Data Sources
Electricity Generation
Renewable generation costs and renewable portfolios
CPUC RPS Calculator (to be updated from 2014 version)
Existing fossil generation fleet
TEPPC 2022 Common Case and WECC study data.
Fossil fuel costs and financing cost assumptions
“Capital cost review of power generation technologies, recommendations for WECC’s 10- and 20-year studies” (E3, March 2014)
Hourly renewable generation shapes
• Solar PV: simulated using System Advisor Model (SAM), PV Watts;
• Concentrated solar power: simulated using System Advisor Model (SAM);
• Wind: Western Wind Dataset by 3TIER for the first Western Wind and Solar Integration Study performed by NREL
Data Sources Planned for Use in California PATHWAYS Model
21
Sector Component Key Data Sources
Biomass and biofuels
Resource potential and biomass costs
DOE “U.S. Billion Ton Update: Biomass Supply for a Bioenergy and Bioproducts Industry” report (2011)
Biofuels conversion costs and efficiencies
Multiple sources in published literature, may be updated with more recent information.
Non-energy, non-CO2 GHGs
Subsector GHG emissions CARB's emissions inventory by IPCC category
Emission reduction measures
CARB Draft Short Lived Climate Pollutant Strategy (current scenario data are based on results of literature review by E3 and LBNL)
Other Fuel Price Projections EIA Annual Energy Outlook (AEO), to be updated from 2013 AEO
Population California Department of Finance
Hydrogen production Department of Energy. H2A Analysis. 2014.
Data Sources Planned for Use in California PATHWAYS Model
TRANSLATING POLICY INTO PATHWAYS
Intro
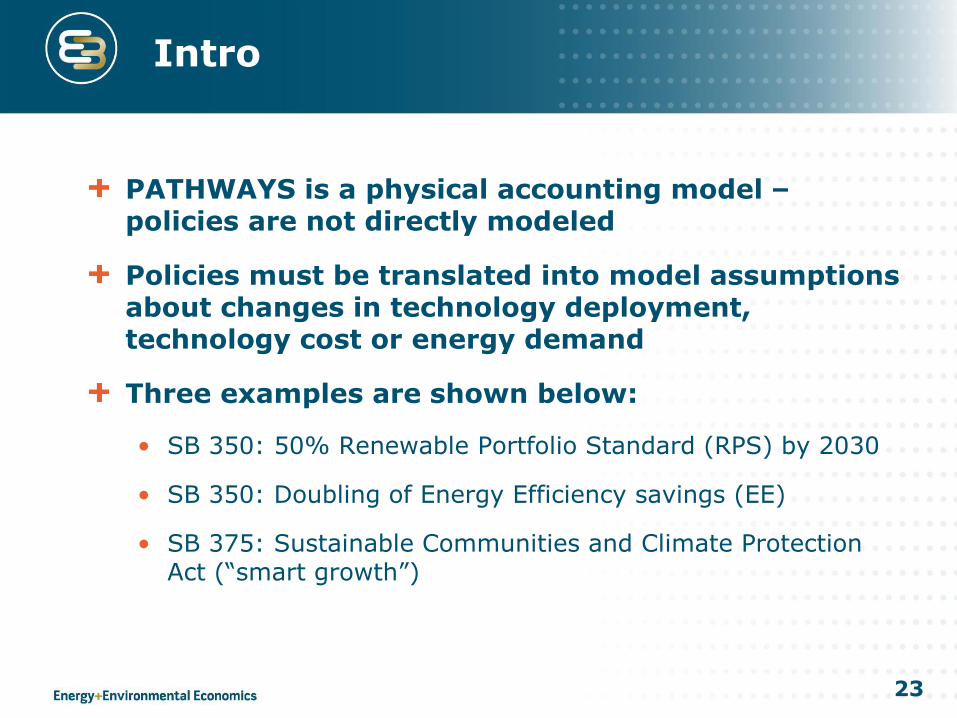
PATHWAYS is a physical accounting model – policies are not directly modeled
Policies must be translated into model assumptions about changes in technology deployment, technology cost or energy demand
Three examples are shown below:
• SB 350: 50% Renewable Portfolio Standard (RPS) by 2030
• SB 350: Doubling of Energy Efficiency savings (EE)
Renewable Portfolio Standard: Policy Translation Example
Policy
“the amount of electricity generated and sold to retail customers per year from eligible renewable energy resources be increased to 50% by December 31, 2030”
SB 350
PATHWAYS
• Select % of retail sales to be met with qualifying renewable generation by specific year
• Select mix of renewable technologies (pre-packaged portfolios are available)
• Add renewable integration solutions if desired (e.g. energy storage)
24
Translation
2030 Renewable Generation by Type (%) – Straight Line
Example Results of RPS policy
25
2015 & 2030 Annual Generation – Straight Line
26% 48% 56%
*
*Not included in RPS
Energy Efficiency: Policy Translation Example
Policy
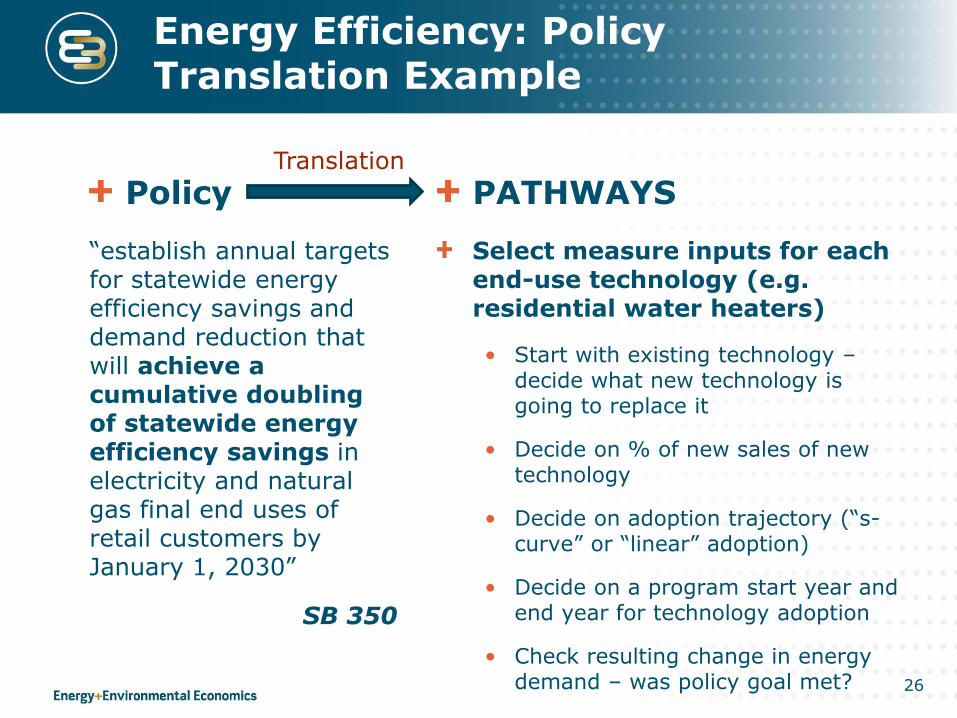
“establish annual targets for statewide energy efficiency savings and demand reduction that will achieve a cumulative doubling of statewide energy efficiency savings in electricity and natural gas final end uses of retail customers by January 1, 2030”
SB 350
PATHWAYS
Select measure inputs for each end-use technology (e.g. residential water heaters)
• Start with existing technology – decide what new technology is going to replace it
• Decide on % of new sales of new technology
• Decide on adoption trajectory (“s-curve” or “linear” adoption)
• Decide on a program start year and end year for technology adoption
• Check resulting change in energy demand – was policy goal met? 26
Translation
Example Results of Energy Efficiency Policy
27
Measuring Impacts of Energy Efficiency With Energy Demand in Buildings
28
Electric energy efficiency targets are modeled compared to a current policy (Reference)
Current efficiency
“Additional achievable energy efficiency” goals
High efficiency electric water & space heating
Buildings - Energy Demand
2015 Energy Principles outputs, subject to change in CARB Scoping Plan
Sustainable Communities SB 375: Policy Translation Example
Policy
“Adopt a sustainable communities strategy, as part of its regional transportation plan, as specified, designed to achieve certain goals for the reduction of greenhouse gas emissions from automobiles and light trucks in a region”
SB 375
PATHWAYS
Reduction in vehicle miles traveled relative to baseline
• % reduction in light-duty vehicle miles traveled by a specific year relative to the Reference scenario assumptions
Change in new construction mix for residential housing stock relative to baseline
• Start with existing housing stock type (e.g. single family home) – decide what new type is going to replace it (e.g. multi-family)
• Decide on % of new construction of new housing type
• Decide on adoption trajectory (“s-curve” or “linear” adoption)
• Decide on a program start year and end year for technology adoption
29
Translation
“Smart Growth” Assumptions Reduce VMT and Energy Demand in Transportation Sector
Note that vehicle miles traveled assumptions will be updated with EMFAC 2014 data
Vehicle Miles Traveled
2015 Energy Principles outputs, subject to change in CARB Scoping Plan
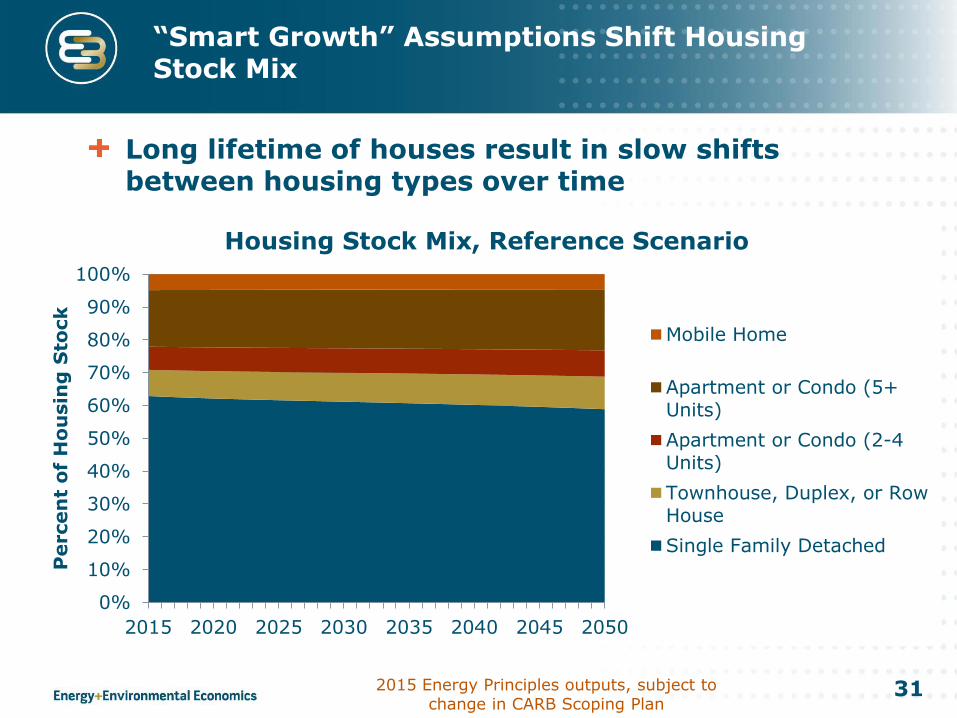
Long lifetime of houses result in slow shifts between housing types over time
31
0%
10%
20%
30%
40%
50%
60%
70%
80%
90%
100%
2015 2020 2025 2030 2035 2040 2045 2050
Percen
t o
f H
ou
sin
g S
tock
Housing Stock Mix, Reference Scenario
Mobile Home
Apartment or Condo (5+Units)
Apartment or Condo (2-4Units)
Townhouse, Duplex, or RowHouse
Single Family Detached
2015 Energy Principles outputs, subject to change in CARB Scoping Plan
EXAMPLES OF MODEL OUTPUTS
33
All outputs are tracked by sector, fuel and year
Greenhouse gas emissions
Energy demand
Energy supply
• Electricity generation, gas supply, biofuel mix
Technology stocks & sales
• Household appliances, vehicles
Cost
• Direct costs and savings by sector
• Household, commercial, industrial, trucking, busing, etc.
• Direct and indirect accounting of costs
• Total capital costs
• Total energy costs
• Electricity and natural gas rates
Categories of Model Outputs
34
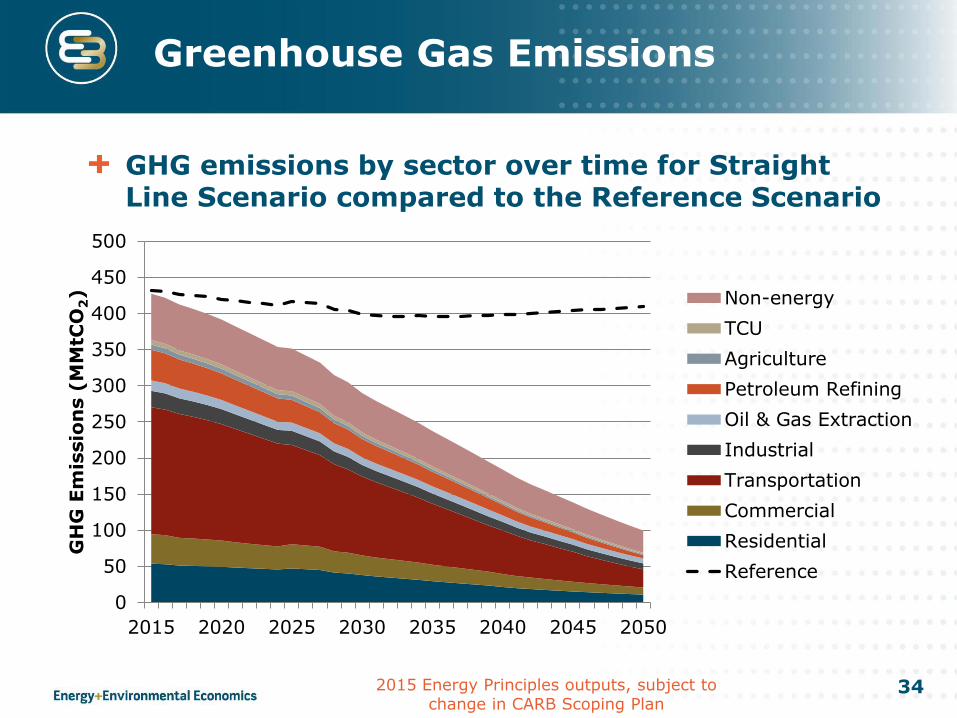
GHG emissions by sector over time for Straight Line Scenario compared to the Reference Scenario
Greenhouse Gas Emissions
2015 Energy Principles outputs, subject to change in CARB Scoping Plan
0
50
100
150
200
250
300
350
400
450
500
2015 2020 2025 2030 2035 2040 2045 2050
GH
G E
mis
sio
ns (
MM
tCO
2)
Non-energy
TCU
Agriculture
Petroleum Refining
Oil & Gas Extraction
Industrial
Transportation
Commercial
Residential
Reference
35
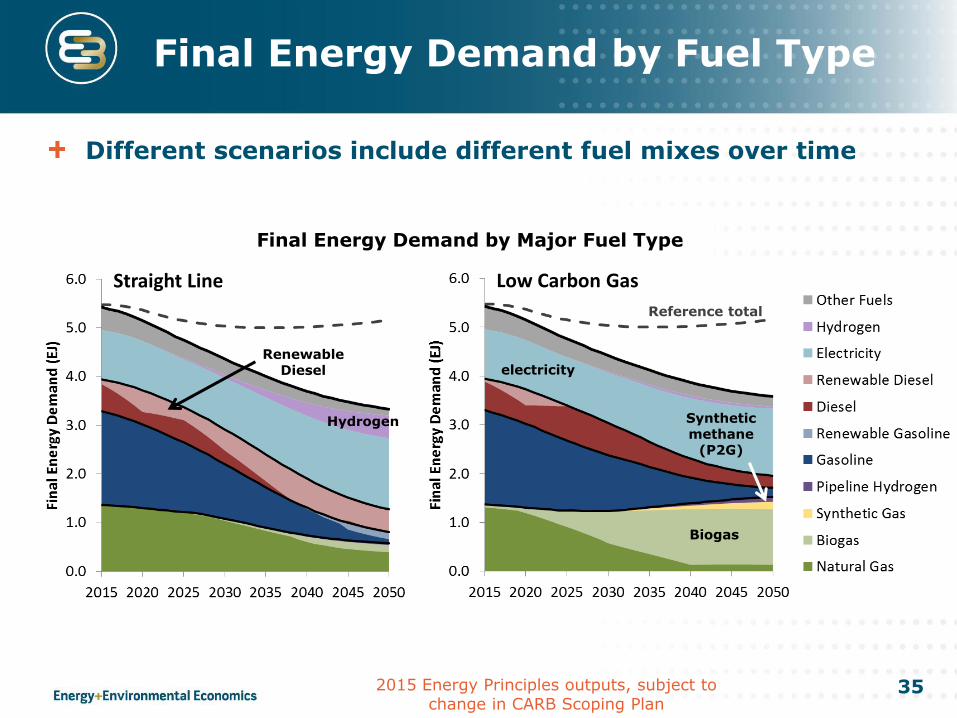
Final Energy Demand by Fuel Type
Different scenarios include different fuel mixes over time
Final Energy Demand by Major Fuel Type
Biogas
Renewable Diesel
Reference total
Straight Line Low Carbon Gas
Hydrogen
electricity
Synthetic methane
(P2G)
2015 Energy Principles outputs, subject to change in CARB Scoping Plan
36
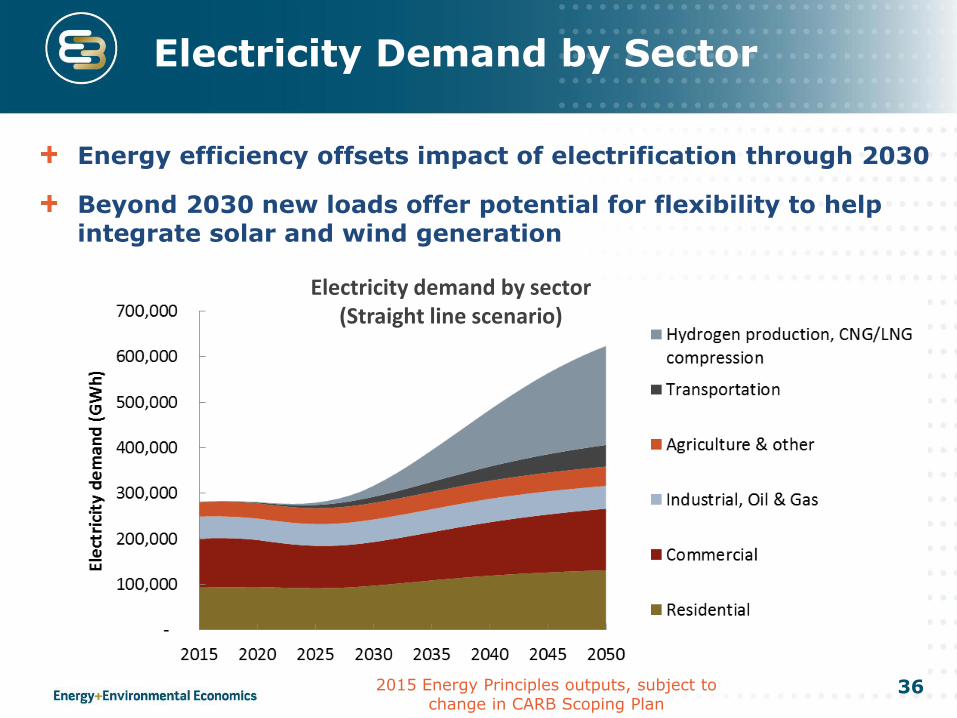
Electricity Demand by Sector
Energy efficiency offsets impact of electrification through 2030
Beyond 2030 new loads offer potential for flexibility to help integrate solar and wind generation
Electricity demand by sector (Straight line scenario)
2015 Energy Principles outputs, subject to change in CARB Scoping Plan
37
Light Duty Vehicle Fleet
2015 Energy Principles outputs, subject to change in CARB Scoping Plan
0%
10%
20%
30%
40%
50%
60%
70%
80%
90%
100%
2015 2020 2025 2030 2035 2040 2045 2050
Light Duty Vehicle Sales, Straight Line Scenario
Hydrogen Fuel Cell
BEV
PHEV25
Reference Gasoline LDV
0
5
10
15
20
25
30
35
40
2010 2015 2020 2025 2030 2035 2040 2045 2050
Millio
ns o
f V
eh
icle
s
Light Duty Vehicle Stock, Straight Line Scenario
Light duty vehicles stock and sales share by vehicle type in the Straight Line Scenario
38
Average Household Monthly Costs
Net Total: $8/mo/household 0.8% increase over Reference Scenario energy-related costs ($14/mo/household if assume all com. & industrial energy system costs flow through to households)
2015 Energy Principles outputs, subject to change in CARB Scoping Plan
39
Average Commercial Monthly Costs
$(20) $(10) $- $10 $20 $30 $40 $50
Electricity Bill
Natural Gas Bill
Vehicles Gas, Diesel, & Biofuels
Vehicle Electricity & Hydrogen Fuel
Vehicles
Appliances & Building EE
Net Total
Average Incremental Cost (2012$/mo/1,000sqft)
2030 Commercial Costs - Straight Line
2015 Energy Principles outputs, subject to change in CARB Scoping Plan
40
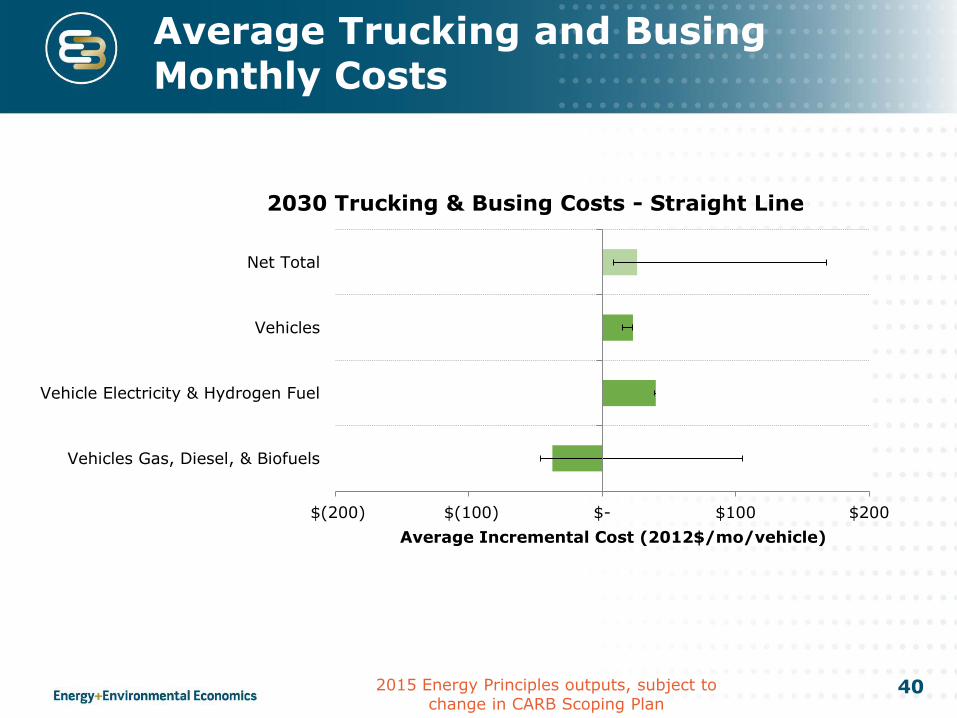
Average Trucking and Busing Monthly Costs
$(200) $(100) $- $100 $200
Vehicles Gas, Diesel, & Biofuels
Vehicle Electricity & Hydrogen Fuel
Vehicles
Net Total
Average Incremental Cost (2012$/mo/vehicle)
2030 Trucking & Busing Costs - Straight Line
2015 Energy Principles outputs, subject to change in CARB Scoping Plan
41
Average Incremental Industrial Costs
-0.5% 0.0% 0.5% 1.0% 1.5% 2.0%
Electricity Bill
Natural Gas Bill
Industrial EE
Net Total
Average Incremental Cost (% of Manufacturing Output)
2030 Industrial Costs - Straight Line
2015 Energy Principles outputs, subject to change in CARB Scoping Plan
KEY LESSONS LEARNED IN PRIOR WORK
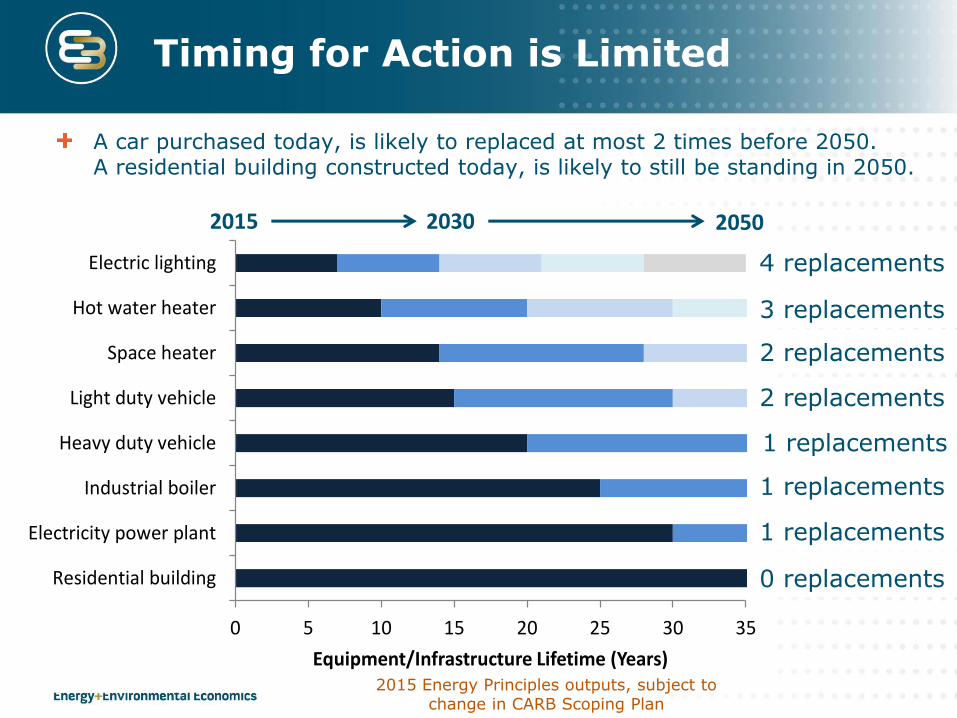
Timing for Action is Limited
A car purchased today, is likely to replaced at most 2 times before 2050. A residential building constructed today, is likely to still be standing in 2050.
0 5 10 15 20 25 30 35
Residential building
Electricity power plant
Industrial boiler
Heavy duty vehicle
Light duty vehicle
Space heater
Hot water heater
Electric lighting
Equipment/Infrastructure Lifetime (Years)
2015 2050
4 replacements
3 replacements
2 replacements
2 replacements
1 replacements
1 replacements
1 replacements
0 replacements
2030
2015 Energy Principles outputs, subject to change in CARB Scoping Plan
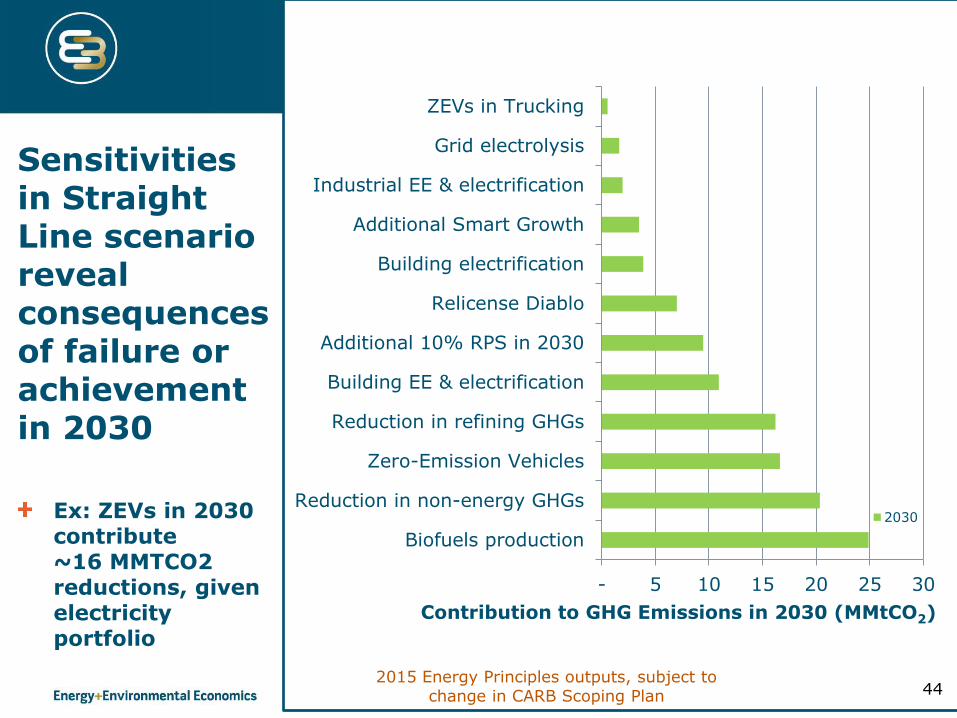
Sensitivities in Straight Line scenario reveal consequences of failure or achievement in 2030
Ex: ZEVs in 2030 contribute ~16 MMTCO2 reductions, given electricity portfolio
44 2015 Energy Principles outputs, subject to
change in CARB Scoping Plan
- 5 10 15 20 25 30
Biofuels production
Reduction in non-energy GHGs
Zero-Emission Vehicles
Reduction in refining GHGs
Building EE & electrification
Additional 10% RPS in 2030
Relicense Diablo
Building electrification
Additional Smart Growth
Industrial EE & electrification
Grid electrolysis
ZEVs in Trucking
Contribution to GHG Emissions in 2030 (MMtCO2)
2030
Sensitivities in 2050 show relative importance of carbon reduction strategies in long-term
45 2015 Energy Principles outputs, subject to
change in CARB Scoping Plan
- 20 40 60 80 100
Biofuels production
Reduction in non-energy GHGs
Zero-Emission Vehicles
Reduction in refining GHGs
Building EE & electrification
Additional 10% RPS in 2030
Relicense Diablo
Building electrification
Additional Smart Growth
Industrial EE & electrification
Grid electrolysis
ZEVs in Trucking
Contribution to GHG Emissions Reductions (MMtCO2)
2050
2030
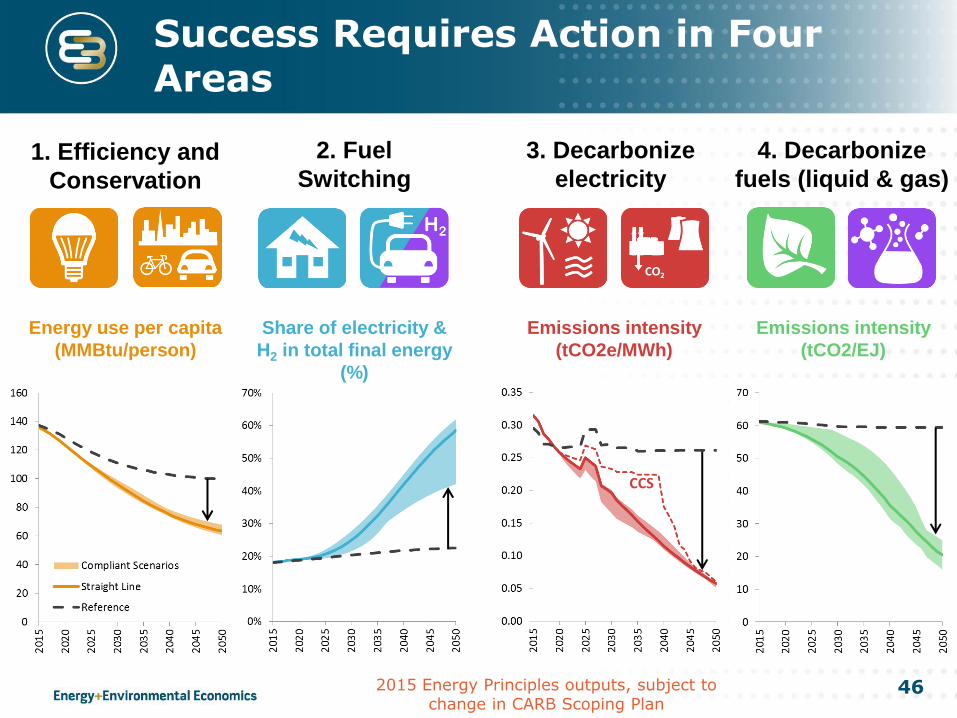
Success Requires Action in Four Areas
1. Efficiency and
Conservation
Energy use per capita
(MMBtu/person)
2. Fuel
Switching
Share of electricity &
H2 in total final energy
(%)
4. Decarbonize
fuels (liquid & gas)
Emissions intensity
(tCO2/EJ)
3. Decarbonize
electricity
Emissions intensity
(tCO2e/MWh)
CCS
46 2015 Energy Principles outputs, subject to change in CARB Scoping Plan
47
Key Carbon Reduction Strategy Observations from Prior Work
Electricity decarbonization – electricity policy must drive CA to near complete decarbonization by 2050
Renewable Fuel Standards – policy must encourage development of fuels produced from electricity and should direct biomass toward its most highly valued uses
Transportation – the majority of new light duty auto sales should be electric, fuel cell, or plug-in hybrid vehicles by 2030
Energy efficiency and electrification – building energy efficiency programs must unlock deeper savings
Be proactive on distributional cost impacts – key to sustaining a long term policy effort
NEXT STEPS
49
E3 is working with ARB to update the CA PATHWAYS Reference scenario and to develop new Scoping Plan scenarios
Revised model results will be translated into inputs to the macroeconomic analysis tool (REMI) to evaluate structural and jobs impacts
Outputs from REMI are planned to feed-back into additional PATHWAYS model runs
• Analytica California PATHWAYS model v.3.2.1. (Note that the model will be updated for the Scoping Plan Update analysis)
• PowerPoint of Energy Principals Scenario Results and supporting spreadsheets of inputs and outputs
Williams et al, “The Technology Path to Deep Greenhouse Gas Emissions Cuts by 2050: The Pivotal Role of Electricity”, Science 6 January 2011. https://www.sciencemag.org/content/335/6064/53.figures-only