California Regional Water Quality Control Board Central Coast Region Total Maximum Daily Loads for Fecal Coliform in Corralitos and Salsipuedes Creeks, Santa Cruz County, California Final Project Report March 20,2009 Item No. 17 Attachment No. 2 March 19-20, 2009 Meeting TMDLs Corralitos & Salsipuedes Creeks Watershed
Transcript
California Regional Water Quality Control Board Central Coast Region
Total Maximum Daily Loads for Fecal Coliform in Corralitos and Salsipuedes Creeks, Santa Cruz
Adopted by the California Regional Water Quality Control Board
Central Coast Region on ______________, 200x
Approved by the
State Water Resources Control Board on ______________, 200x
and the Office of Administrative Law on ______________,200x
and the United States Environmental Protection Agency
on ________________, 200x
CALIFORNIA REGIONAL WATER QUALITY CONTROL BOARD
CENTRAL COAST REGION 895 Aerovista Place, Suite 101, San Luis Obispo, California 93401 Phone � (805) 549-3147 http://www.waterboards.ca.gov/centralcoast/
To request copies of the Basin Plan Amendment and Total Maximum Daily Loads for Fecal coliform for Corralitos Creek, Santa Cruz County, California, please contact Kim Sanders at (805) 542-4771, or by email at [email protected]. Documents also are available at: http://www.waterboards.ca.gov/centralcoast/TMDL/303dandTMDLprojects.htm
iii
STATE OF CALIFORNIA
ARNOLD SCHWARZENEGGER, Governor LINDA S. ADAMS, Agency Secretary, California Environmental Protection Agency
State Water Resources Control Board
Tam Doduc, Chair Civil Engineer, Water Rights Gary Wolff, Vice Chair Professional Engineer,
Water Quality Charles R. Hoppin Water Quality
Arthur G. Baggett, Jr. Attorney, Water Supply & Water Rights
Frances Spivey-Weber Public Member
Dorothy Rice, Executive Director
California Regional Water Quality Control Board Central Coast Region
Jeffrey S. Young, Chair Water Supply Russell M. Jeffries, Vice
Chair Industrial Water Use
Leslie S. Bowker County Government Monica S. Hunter Public
Gary C. Shallcross Recreation, Fish or Wildlife David T. Hodgin Water Quality Daniel M. Press Water Quality John H. Hayashi Irrigated Agriculture
Vacant Municipal Government
Roger Briggs, Executive Officer Michael Thomas, Assistant Executive Officer
This report was prepared under the direction of
Lisa H. McCann Environmental Programs Manager Chris Rose, Senior Environmental Scientist
by
Kim Sanders, Environmental Scientist
with the assistance of
Angela Carpenter, Water Resource Control Engineer Larry Harlan, Environmental Scientist
Angela Schroeter, Senior Engineering Geologist and Mike Higgins, Associate Water Resources Control Engineer
iv
CONTENTS Contents ............................................................................................................................. iv
Tables................................................................................................................................. vi
Figures................................................................................................................................ vi
Table 1-1 Basin Plan designated beneficial uses for waterbodies in the Corralitos/Salsipuedes Creek Watershed ........................................................................ 6
Table 2-1 Land use in the Corralitos/Salsipuedes Creek Watershed................................. 9
Table 2-2 Corralitos Creek monthly mean flow in cubic feet per second at the USGS gauging station in Corralitos Creek at Freedom Boulevard (calculation period October 1, 1956 to September 30, 2006)....................................................................... 11
Table 3-1 CCAMP sampling locations and fecal coliform data analysis results ............. 14
Table 3-2 Santa Cruz County sample collection dates ....................................................... 16
Table 3-3 Santa Cruz County sampling locations and fecal coliform data analysis results................................................................................................................................... 17
Table 3-4 Coastal Watershed Council sampling locations and E. coli data analysis results................................................................................................................................... 18
Table 3-5 City of Watsonville sampling locations and fecal coliform data ....................... 19
Table 3-6 City of Watsonville sampling locations and E. coli data analysis results ....... 20
Table 3-7 Coastal Watershed Council E. coli Water Quality Data and Total Exceedances for Sampling Locations SALSI 21 and CORRA 23.............................. 23
Table 3-8 Land uses contributing flow to sampling locations for genetic source tracking and results of genetic analysis for wet and dry seasons in Watsonville Sloughs, 2003...................................................................................................................................... 24
Table 3-9 Land uses contributing flow to sampling locations for genetic source tracking and results of genetic analysis in Chorro and Los Osos Creeks, 2002..................... 25
Table 5-1 Seasonality of CCAMP fecal coliform data at Salsipuedes Creek at Riverside Drive Bridge (305 COR) sampling location from 2005 to 2006 .................................. 50
Table 5-2 Seasonality of the City’s E. coli data at downstream sampling locations collected during the wet season ...................................................................................... 51
Table 8-1 Allocations and Responsible Parties.................................................................... 56
FIGURES Figure 1-1 Location of Corralitos/Salsipuedes Creek Watershed .................................. 4 Figure 1-2 Streams of the Corralitos/Salsipuedes Creek Watershed, the City of
Watsonville, and the location of impaired reaches (indicated in red). ...................... 5 Figure 2-1 Corralitos/Salsipuedes Creek Watershed and land use.............................. 10 Figure 3-1 CCAMP (305 COR & 305 COR 2), Santa Cruz County (SCC 1 & SCC 2),
City of Watsonville (ECI & BVI), and CWC (CORRA 23 and SALSI 21) sampling locations in the Corralitos/Salsipuedes Creek Watershed ..................................... 15
Figure 3-2 The City’s downstream sampling locations in the Corralitos/Salsipuedes Creek Watershed................................................................................................... 21
Figure 4-1 Red outlined polygon denotes Salsipuedes Creek-adjacent area in which some onsite wastewater systems fail..................................................................... 34
APPENDIX A. FECAL COLIFORM AND E. COLI SAMPLING DATA AND ANALYSIS
Draft Project Report - Corralitos Creek Fecal coliform TMDL March 2009
vii
List of Acronyms and Abbreviations
Acronym/Abbreviation Name Basin Plan Water Quality Control Plan, Central
Coast Region FIB Fecal indicator bacteria Staff Staff of the Water Board TMDL Total Maximum Daily Load Water Board Central Coast Regional Water Quality
Control Board USEPA United State Environmental Protection
Agency USGS United States Geologic Survey
Draft Project Report - Corralitos Creek Fecal coliform TMDL March 2009
1
1 PROJECT DEFINITION
1.1 Introduction
The Corralitos Creek watershed is located in Santa Cruz County and includes the east side of the City of Watsonville. The watershed is an area of about 53 square miles (Figure 1-1) and is tributary to the Pajaro River. The Clean Water Act (CWA) requires the State to establish Total Maximum Daily Loads (TMDLs) for waters listed as impaired on the CWA section 303(d) list. TMDLs are required because Corralitos Creek was identified as impaired due to fecal coliform, and Corralitos Creek was placed on the CWA section 303(d) list of impaired waters. Salsipuedes Creek is not listed on the CWA section 303(d) list of impaired waters for fecal coliform. However, staff analyzed historic and recent data from Salsipuedes Creek and found that this Creek is impaired due to fecal coliform concentration exceeding water quality standards protective of water contact recreation. The Corralitos Creek 303(d) listing was erroneously based on water samples from Salsipuedes Creek. However, staff has confirmed that both Corralitos and Salsipuedes Creeks are impaired due to fecal coliform concentration exceeding water quality standards protective of water contact recreation, and TMDLs are, therefore, necessary in both Corralitos and Salsipuedes Creeks. Salsipuedes Creek is an approximately 6.5 mile creek draining to the Pajaro River. Corralitos Creek is tributary to Salsipuedes Creek, having a confluence approximately 2.25 miles upstream from the confluence with the Pajaro River (Figure 1-2). Staff determined the impaired reaches for these Creeks include: 1) all reaches of Corralitos Creek downstream from Browns Valley Bridge, and 2) all reaches of Salsipuedes Creek (Figure 1-2). The entire watershed is referred to hereafter as the Corralitos/Salsipuedes Creek watershed; however, each individual Creek and Subwatershed is referred to as necessary. Section 303(d) of the Clean Water Act requires the State to establish the TMDLs for fecal coliform at a level necessary to attain water quality standards. The State must also incorporate into the TMDLs seasonal variations and a margin of safety that takes into account any lack of knowledge concerning the relationship between pollutant loading and water quality. Although a TMDL is a total maximum daily load, typically there is neither time nor resources available to measure daily loads throughout the year. Therefore, water quality is often measured either on a monthly basis or approximately five times every month. Water quality samples collected at these intervals are representative of daily water quality. Taking a representative sample is a scientifically accepted way to get
Draft Project Report - Corralitos Creek Fecal coliform TMDL March 2009
2
information about a subject that is too costly to investigate on a daily basis. Various entities collected the data analyzed in this report either monthly or approximately five times per month. This is a Draft Final Project Report (Report) in which staff concluded the sources responsible for elevated levels of fecal indicator bacteria (fecal coliform and/or Escherichia coli (E. coli)) in Corralitos and Salsipuedes Creeks, the numeric targets, TMDLs, wasteload and load allocations, implementation plan, monitoring plan, and future project tracking and implementation to attain water quality standards. Staff incorporated public comments received at a meeting with stakeholders in June 2006 in response to a staff presentation on preliminary project report findings. Staff is proposing that the Corralitos/Salsipuedes Creek watershed be subject to two existing prohibitions (Domestic Animal Waste Discharge Prohibition and Human Fecal Material Discharge Prohibition). Regulating domestic animal waste and human waste discharges through prohibitions is consistent with the Policy for Implementation and Enforcement of the Nonpoint Source Pollution Control Program.
1.2 The Central Coast Water Board’s Vision
The Central Coast Water Board’s Vision statement is: Healthy Functioning Watersheds. Staff determined TMDLs for fecal coliform in Corralitos and Salsipuedes Creeks are essential for reaching our Vision. The Vision represents a focusing of our approach – a framework for how we conduct business and achieve measurable results. The Vision structures our work towards our highest water quality priorities; strategically aligns us with the anticipated challenges and opportunities in water quality; and positions our agency to respond nimbly to unexpected situations. We will maximize our effectiveness by setting measurable goals and specific objectives, implementing the objectives, tracking our progress toward achieving goals and objectives, measuring and reporting the results of implementation, and adapting to the feedback our tracking provides. The following are the Central Coast Water Board’s three measurable goals: MEASUREABLE GOAL 1 (MG1): By 2025, 80% of the Aquatic Habitat is healthy; and the remaining 20% exhibits positive trends in key parameters. MEASUREABLE GOAL 2 (MG2): By 2025, 80% of lands within any watershed will be managed to maintain proper watershed functions, and the remaining 20% will exhibit positive trends in key watershed parameters. MEASUREABLE GOAL 3 (MG3): By 2025, 80% of groundwater will be clean, and the remaining 20% will exhibit positive trends in key parameters.
Draft Project Report - Corralitos Creek Fecal coliform TMDL March 2009
3
Staff determined TMDLs for fecal coliform in Corralitos Creek align with MG1 because decreasing fecal coliform in Corralitos and Salsipuedes Creeks will result in healthier aquatic habitat. Decreasing the amount of fecal coliform makes aquatic habitat healthier by creating a place for humans, who could get sick from high concentrations of fecal coliform, to safely recreate. Staff concluded this project is also aligned with MG2, as responsible parties will develop pathogen management plans as a result of the implementation plan in this Report. These management plans will directly help maintain healthy watershed functions. Staff proposes attenuation of dysfunctional onsite wastewater systems and sewage collection systems in the implementation plan. These systems can affect groundwater. Therefore, staff concluded this project aligns with MG3 in addition to MG1 and MG2.
1.3 Listing Basis
Data from the Central Coast Ambient Monitoring Program (CCAMP) prompted the CWA 303(d) listing of Corralitos Creek in 2002. Data from CCAMP sampling location (305 COR), located on Salsipuedes Creek approximately 0.25 miles upstream of the Pajaro River, indicated exceedance of the Basin Plan water quality objective protecting water contact recreation (REC1) in four of the 13 monthly samples collected from December 1997 to December 1998. In this case, staff found that Salsipuedes Creek was impaired by fecal coliform because greater than ten percent of the samples exceeded the water quality objective protecting REC1 (State Water Resources Control Board, 2004).
Draft Project Report - Corralitos Creek Fecal coliform TMDL March 2009
4
Monterey Bay
MONTEREY CO
FRESNO CO
SAN BENITO CO
MERCED CO
SANTA CLARA CO
SANTACRUZ CO
STANISLAUS CO
5 0 5 10 15 Miles
N
Pajaro River Watershed
Corralitos Creek Watershed
Streams
Counties
Legend
Figure 1-1 Location of Corralitos/Salsipuedes Creek Watershed
Draft Project Report - Corralitos Creek Fecal coliform TMDL March 2009
5
Figure 1-2 Streams of the Corralitos/Salsipuedes Creek Watershed, the City of Watsonville, and the location of impaired reaches (indicated in red).
N
Draft Project Report - Corralitos Creek Fecal coliform TMDL March 2009
6
1.4 Beneficial Uses
The beneficial uses of Corralitos/Salsipuedes Creek are identified in the Basin Plan and shown in Table 1-1.
Table 1-1 Basin Plan designated beneficial uses for waterbodies in the Corralitos/Salsipuedes Creek Watershed
Waterbody Name
REC1 REC2 WILD COLD WARM MIGR SPWN COMM MUN AGR IND GWR
Corralitos Creek
X X X X X X X X X X X X
Salsipuedes Creek
X X X X X X X X X X
Source: Regional Water Quality Control Board, Basin Plan 1994, p. II-6.
Water Contact Recreation (REC1): Uses of water for recreational activity involving body contact with water, where ingestion of water is reasonably possible. These uses include, but are not limited to, swimming, wading, water-skiing, skin and scuba diving, surfing, white water activities, fishing, or use of natural hot springs. Non-Contact Water Recreation (REC2): Uses of water for recreational activities involving proximity to water, but not normally involving bodily contact with water, where ingestion of water is reasonably possible. These uses include, but are not limited to, picnicking, sunbathing, hiking, beachcombing, camping, boating tidepool and marine life study, hunting, sightseeing, or aesthetic enjoyment in conjunction with the above activities. Wildlife Habitat (WILD): Uses of water that support terrestrial ecosystems. Cold Fresh Water Habitat (COLD): Uses of water that support cold water ecosystems including, but not limited to, preservation or enhancement of aquatic habitats, vegetation, fish or wildlife, including invertebrates. Warm Fresh Water Habitat (WARM): Uses of water that support warm water ecosystems. Migration of Aquatic Organisms (MIGR): Uses of water that support habitats necessary for migration or other temporary activities by aquatic organisms, such as anadromous fish. Spawning, Reproduction, and/or Early Development (SPWN): Uses of water that support high quality aquatic habitats suitable for reproduction and early development of fish. Commercial and Sport Fishing (COMM): Uses of water for commercial or recreational collection of fish, shellfish, or other organisms.
Draft Project Report - Corralitos Creek Fecal coliform TMDL March 2009
7
Municipal and Domestic Supply (MUN): Uses of water for community, military, or individual water supply systems including, but not limited to, drinking water supply. Agricultural Supply (AGR): Uses of water for farming, horticulture, or ranching including, but not limited to, irrigation, stock watering, or support of vegetation for range grazing. Industrial Service Supply (IND): Uses of water for industrial activities that do not depend primarily on water quality including, but not limited to, mining, cooling water supply, hydraulic conveyance, gravel washing, fire protection, or oil well repressurization.
Groundwater Recharge (GWR): Uses of water for natural or artificial recharge of groundwater for purposes of future extraction, maintenance of water quality, or halting of saltwater intrusion into freshwater aquifers. Groundwater recharge includes recharge of surface water underflow.
1.5 Water Quality Objectives
1.5.1 Central Coast Region’s Water Quality Control Plan Water Quality Objectives
The Central Coast Region’s Water Quality Control Plan (Basin Plan) states, “Controllable (emphasis added) water quality shall conform to the water quality objectives contained herein. When other conditions cause degradation of water quality beyond the levels or limits established as water quality objectives, controllable conditions shall not cause further degradation of water quality.” The Basin Plan contains fecal coliform water quality objectives and the United States Environmental Protection Agency (USEPA) recommends water quality criteria for E. coli. The USEPA determined that E. coli is an appropriate substitute for fecal coliform. Both fecal coliform and E. coli are used as fecal indicator bacteria (FIB) and are referred to as such throughout this document. The specific Basin Plan fecal coliform water quality objectives (CCRWQCB, 1994, pg. III-3) and their associated beneficial uses for a particular waterbody are:
1.5.1.1 Water Contact Recreation (REC-1):
Fecal coliform concentration, based on a minimum of not less than five samples for any 30-day period, shall not exceed a log mean of 200 MPN per 100mL, nor shall more than 10% of total samples during any 30-day period exceed 400 MPN per 100mL. The REC-1 beneficial use was impaired in reaches of Corralitos/Salsipuedes Creek. The water quality objectives for this beneficial use are the most stringent of the recreational beneficial uses. Therefore, protecting the REC-1 beneficial use results
Draft Project Report - Corralitos Creek Fecal coliform TMDL March 2009
8
protecting other recreational uses with less-stringent water quality standards for fecal coliform.
1.5.1.2 Non-Contact Water Recreation (REC-2):
Fecal coliform concentration, based on a minimum of not less than five samples for any 30-day period, shall not exceed a log mean of 2000 MPN per 100mL, nor shall more than 10% of samples collected during any 30-day period exceed 4000 MPN per 100mL.
1.5.1.3 Other Applicable Beneficial Uses
The Basin Plan does not include explicit FIB numeric objectives for the other surface water beneficial uses. 1.5.2 United States Environmental Protection Agency
Water Quality Criteria
The Basin Plan does not include water quality objectives for E. coli. However, the USEPA recommends E. coli not exceed a geometric mean of 126 Colony Forming Units (CFU) per 100 mL, generally based on not less than five samples spaced over a 30-day period (USEPA, Ambient Water Quality Criteria for Bacteria-1986, January 1986). The USEPA determined that E. coli is an appropriate substitute for fecal coliform.
Draft Project Report - Corralitos Creek Fecal coliform TMDL March 2009
9
2 WATERSHED DESCRIPTION
2.1 Location, Hydrologic Features, and Elevation
The Corralitos/Salsipuedes Creek watershed is located in the southeastern portion of Santa Cruz County and includes the eastern side of the City of Watsonville (Figure 1-1 and Figure 1-2). Corralitos Creek is an approximately 11-mile long waterbody that has a confluence with Salsipuedes Creek, an approximately 6.5-mile waterbody, just south of College Lake (a seasonal lake). From there Salsipuedes Creek flows to the Pajaro River approximately 2.25 miles to the south. Together, Corralitos Creek and Salsipuedes Creek drain approximately 53 square miles of land. Figure 1-2 details the drainage network of Corralitos Creek, Salsipuedes Creek, and College Lake and shows proximity to the City of Watsonville and Watsonville Sloughs. Elevation in the watershed ranges from approximately 2,600 feet above mean sea level (msl) in the upper watershed to approximately 30 feet above msl at the confluence with the Pajaro River. Elevation in the impaired reaches (as described in Section 1.1 Introduction) ranges from approximately 400 feet above msl to approximately 30 feet above msl.
2.2 Land Use
Staff obtained Geographic Information System (GIS) land use data from the Multi-Resolution Land Characterization (MRLC)/National Land Cover Data (NLCD) database and subsequently grouped the data into land use categories. Various governmental agencies created the MRLC/NLCD data through the use of satellite imagery. Staff used this data that represents land uses between 1988 and 1994. Staff presented these land uses because fecal coliform concentrations were associated with certain land uses. Land uses in the watershed included forest and open space (81%), with smaller areas of irrigated agriculture (7%), low intensity residential (5%), pasture (4%), and urban lands (2%). Table 2-1 presents land use types and areas.
Table 2-1 Land use in the Corralitos/Salsipuedes Creek Watershed
Land Use Acres Approximate Percent of
Watershed
Low Intensity Residential 1652 5
Urban 726 2
Forest/Open Space 28150 81
Pasture 1359 4
Agriculture 2586 7
Bare Rock/Extraction 69.8 0.2
Open Water/Wetlands 188.3 0.5
TOTALS 34,730.4 100
Draft Project Report - Corralitos Creek Fecal coliform TMDL March 2009
10
Figure 2-1 Corralitos/Salsipuedes Creek Watershed and land use
Draft Project Report - Corralitos Creek Fecal coliform TMDL March 2009
11
2.3 Climate
A Mediterranean climate prevails in the Corralitos/Salsipuedes watershed. Summers are warm and dry, cooled at times by fog at lower elevations due to the proximity of the Pacific Ocean. Winters are cool and wet, but rainfall is variable. Most of the average annual rainfall of approximately 22.6 inches falls between December and February.
2.4 Flow
Data from a United States Geologic Survey (USGS) gauging station in Corralitos Creek at Freedom Boulevard indicated that the highest flow on average is in February of each year (Table 2-2). The USGS data indicated that the lowest rate of flow typically occurs in August. Watershed researcher, Dr. Marc Los Huertos, Assistant Professor in the Division of Science and Environmental Policy California State University Monterey Bay and Researcher for the Center for Agroecology and Sustainable Food Systems, noted that Corralitos Creek dries up in the summer north of the gauging station (personal communication, March 2, 2007). Debie Chirco-MacDonald of the Coastal Watershed Council (CWC) said that flow ceased upstream of the CWC’s sampling location (CORRA 23; Figure 3-1) on Pista Lane. This location is approximately 1 mile north of the USGS gauging station. Water Board staff, Mary Adams, indicated that flowing water is constant throughout the year approximately four miles upstream of the USGS gauge (personal communication, March 12, 2007). Therefore, staff concluded that Corralitos Creek typically becomes dry somewhere between Browns Valley Bridge and the Pista Lane sampling location in the summer.
Table 2-2 Corralitos Creek monthly mean flow in cubic feet per second at the USGS gauging station in Corralitos Creek at Freedom Boulevard (calculation period October 1, 1956 to September 30, 2006)
U. S. Geological Survey Surface Water Monthly Statistics, March 15, 2007
During field reconnaissance staff observed that Salsipuedes Creek flows through an approximately 8-foot culvert located underneath East Lake Avenue, approximately 0.25 mile north of the confluence of Corralitos Creek and Salsipuedes Creek
Year Jan Feb Mar Apr May Jun Jul Aug Sep Oct Nov Dec
Draft Project Report - Corralitos Creek Fecal coliform TMDL March 2009
12
(October 27, 2006). Staff observed the culvert just south of seasonal College Lake (that only fills with water during the wet season). Approximately 0.75 mile of Salsipuedes Creek is channelized through College Lake in the dry season when the Lake is used to grow irrigated crops. Staff concluded that the large culvert suggests a high rate of flow comes from Salsipuedes Creek and College Lake in the wet season.
Draft Project Report - Corralitos Creek Fecal coliform TMDL March 2009
13
3 DATA ANALYSIS
3.1 Data and Information Sources
Staff relied on data and information provided by the following entities or sources: � Central Coast Ambient Monitoring Program (CCAMP), � County of Santa Cruz � Coastal Watershed Council � City of Watsonville � Geographic Information System analysis of land uses, and � Genetic studies from Morro Bay and Watsonville Slough watersheds
Data used in the below analyses is included in Appendix A.
3.2 Data Analysis Methods
Staff used two methods for analyzing the data in this Report. Staff analyzed the fecal coliform data using a program titled “Fecal Coliform Investigation and Analysis Spreadsheet” (FECIA; Riverson, 2003). FECIA is a fully automated spreadsheet designed to assist in characterization and quantification of fecal indicator bacteria (FIB) instream water quality objective exceedances. Staff compared the observed data against specified values equal to water quality objectives to determine the magnitude and nature of exceedances. Staff used the FECIA program to generate the data analysis figures and tables located in Appendix A of this Report. Staff generated figures for each sampling location. Figures display the water contact recreation beneficial use maximum water quality objective only. None of the samples collected amounted to greater than five samples in a 30-day period, the sampling rate necessary to calculate a geometric mean. Therefore, staff did not use the geometric mean water quality objective for fecal coliform. Staff also generated tables that summarized data on a monthly basis for each sampling location. The second method staff used for analyzing E. coli data was an Excel spread sheet. Where the data allowed, staff calculated the geomean for each set of five samples in a 30-day period. Two Coastal Watershed Council E. coli sample sets contained eight samples collected in an approximate one-year period. In this case, staff used Excel to calculate the geomean of all eight samples at each location to conduct data analysis. Although there was not enough data to analyze according to recommended USEPA water quality criteria, staff felt the analysis was sufficient for indicating the presence or absence of high levels of FIB. Appendix A includes the data and statistics for E. coli. Please see Section 3.3.5 for more information regarding data analysis methods.
Draft Project Report - Corralitos Creek Fecal coliform TMDL March 2009
14
3.3 Water Quality Data and Analysis
3.3.1 Central Coast Ambient Monitoring Program Data
3.3.1.1 Data Collection
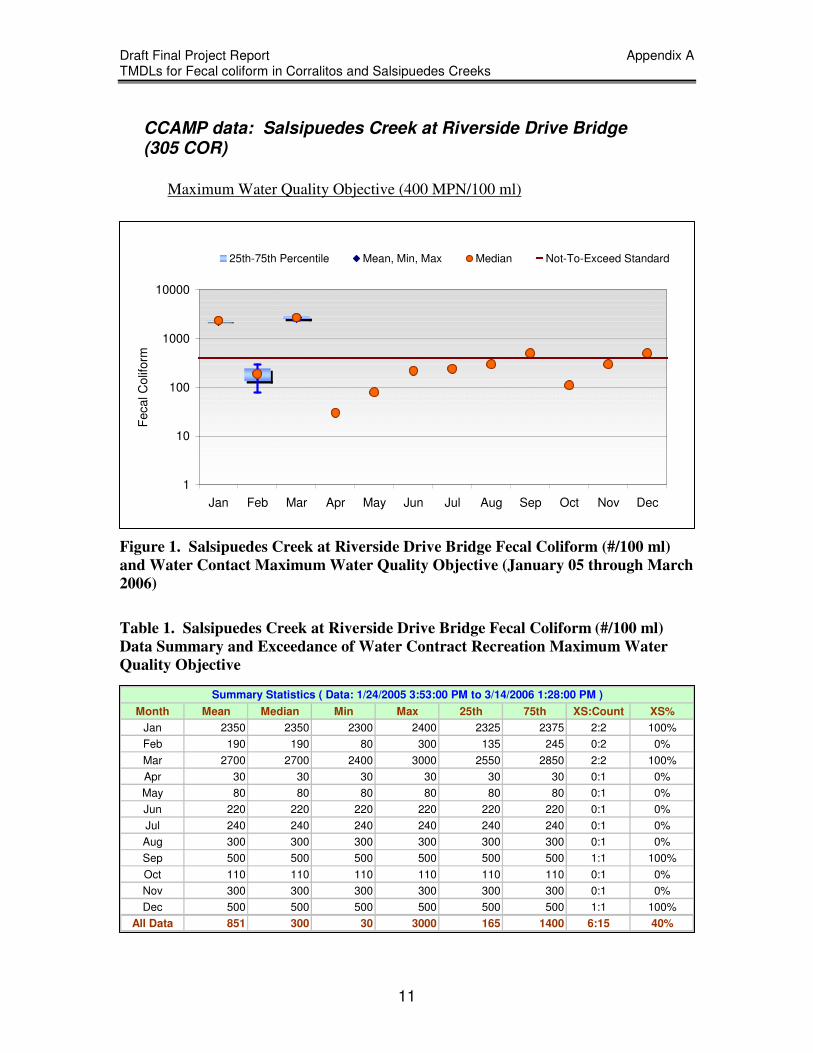
The Water Board’s CCAMP staff conducted approximately monthly monitoring at two sampling locations from 2005 to 2006. CCAMP staff sampled one location on Salsipuedes Creek at the Riverside Drive Bridge approximately two miles downstream of the confluence of Salsipuedes and Corralitos Creeks (305 COR; Figure 3-1). Location 305 COR was within a largely urban, low intensity residential and agricultural land use setting. It was also approximately 0.25 miles upstream of the confluence of the Pajaro River and Salsipuedes Creek. CCAMP staff sampled a second location on Corralitos Creek at Browns Valley Bridge (305 COR2). This sampling location was approximately 8.5 miles upstream of 305 COR. Land uses surrounding 305 COR2 included low intensity residential, irrigated agriculture, pasture, and forest/open space land uses.
3.3.1.2 Data Analysis Results
Six of the 15 samples (40 percent) collected from 305 COR exceeded the fecal coliform maximum water quality objective (Table 3-1). The maximum value collected at this location was 3,000 MPN/100 mL, but the median value was 300 MPN/100 mL, which is below the maximum water quality objective of 400 MPN/100 mL. Samples collected from 305 COR2 exceeded the maximum water quality objective twice in the 11 samples (18 percent). The maximum value was 30,000 MPN/100 mL; however, the median value was 130 MPN/100 mL, which was lower than both the maximum water quality objective and the geometric mean water quality objective (200 MPN/100 mL).
Table 3-1 CCAMP sampling locations and fecal coliform data analysis results
Fecal coliform Maximum Water Quality Objective
(400 MPN) Sampling Location Number
Location
% Exceedances Total Number
of Samples
Period of Record
305 COR Salsipuedes Creek at Riverside Drive Bridge
40 15
305 COR2 Corralitos Creek at
Browns Valley Bridge 18 11
Approximately Monthly from
January 2005 to March 2006
Draft Project Report - Corralitos Creek Fecal coliform TMDL March 2009
15
Figure 3-1 CCAMP (305 COR & 305 COR 2), Santa Cruz County (SCC 1 & SCC 2), City of Watsonville (ECI & BVI), and CWC (CORRA 23 and SALSI 21) sampling locations in the Corralitos/Salsipuedes Creek Watershed
SALSI 21
CORRA 23
Draft Project Report - Corralitos Creek Fecal coliform TMDL March 2009
16
3.3.2 Santa Cruz County Data
3.3.2.1 Data Collection
Santa Cruz County Environmental Health Services staff collected fecal coliform data from Corralitos/Salsipuedes Creek between 1975 and 2006. Staff considered the most recent data collected (from 2003 to 2006) in this Report because watershed conditions and land uses have changed since 1975 (Table 3-2). Staff concluded that data collected prior to 2003 may not be representative of current conditions; however, staff included historic data in Appendix A. The County sampled two locations. The Corralitos Creek at Browns Valley Bridge (SCC 2) sampling location was the same as the CCAMP sampling location of the same name (but the CCAMP location was identified by the code 305 COR2; Figure 3-1). The Corralitos Creek at Rider Creek (SCC 1) sampling location was located approximately 2.0 miles upstream of SCC 2. Land use upstream of SCC 1 was primarily forest/open space. Low intensity residential, irrigated agriculture, pasture, and forest/open space land uses were upstream of SCC 2.
Table 3-2 Santa Cruz County sample collection dates
Period of Record Sampling Location Number
Location Month Year
January to April and September to December
2003
January to December 2004
January to December 2005
SCC 1 Corralitos Creek at Rider Creek
January to October 2006
January to April, November and December
2003
January to May, September, November, and December
2004
January to July, September, and December
2005
SCC 2 Corralitos Creek
at Browns Valley Bridge
January to October 2006
3.3.2.2 Data Analysis Results
The County’s data indicated that two of 46 and two of 36 samples (four and six percent, respectively) exceeded maximum water quality objectives at both SCC 1 and SCC 2, respectively (Table 3-3). The median was 40 MPN/100 mL and 53 MPN/100 mL at the two sampling locations, respectively.
Draft Project Report - Corralitos Creek Fecal coliform TMDL March 2009
17
Table 3-3 Santa Cruz County sampling locations and fecal coliform data analysis results
3.3.3 Coastal Watershed Council Data
3.3.3.1 Data Collection
The Coastal Watershed Council (CWC) provided E. coli data from 2003 through 2004. CWC volunteers collected data in the Corralitos/Salsipuedes watershed from four locations. The number of data points collected at two of the locations was negligible (n = 3 at each location) therefore, staff included only data collected at the remaining locations. Eight samples were collected from each of the two remaining locations over a one year period. Approximately 1.0 mile upstream of the intersection of Green Valley and Corralitos Creek was the first location, Corralitos Creek at Pista Lane /7226 Freedom Blvd. (CORRA 23; Figure 3-1). This location typically had minimal flow during the dry season. According to Debie Chirco-MacDonald of CWC, a pool formed near CORRA 23. CWC sampled above the pool in flowing water. Chirco-MacDonald said that they always sampled in flowing water, although sometimes it was just a trickle. She also said that upstream from CORRA 23 the water was very shallow and beyond that flow ceased. CORRA 23 was down stream of low intensity residential, agriculture, pasture, and forest/open space land uses. Just downstream of the confluence of Corralitos and Salsipuedes Creeks was the second location, Salsipuedes Creek at East Lake Avenue Bridge (SALSI 21). Land uses upstream of this location were primarily agriculture, pasture, low intensity residential, and urban.
3.3.3.2 Data Analysis Results
The geomean that staff calculated from the CWC data exceeded the recommended USEPA water quality criteria at each sampling location (Table 3-4). The geomean at CORRA 23 was 392 MPN/100 mL, and the geomean at SALSI 21 was 201 MPN/100 mL.
Fecal coliform Maximum Water Quality Objective
(400 MPN) Sampling Location Number Location % Exceedances
Number of Samples
Period of Record
SCC 1 Corralitos Creek at Rider
Creek 4 46
SCC 2 Corralitos Creek
at Browns Valley Bridge 6 36
See Table 3-2
Draft Project Report - Corralitos Creek Fecal coliform TMDL March 2009
18
Table 3-4 Coastal Watershed Council sampling locations and E. coli data analysis results
3.3.4 City of Watsonville Data
3.3.4.1 Data Collection
The City of Watsonville (City) provided FIB (fecal coliform data and/or E. coli data). City staff collected FIB data at two water intake facilities at Browns Valley and Eureka Canyon (BVI & ECI, respectively; Figure 3-1). Water Board staff referred to these two sampled facilities in this Report as the City’s upstream sampling locations. The City collected the data from June 1998 to April 2006. However, because staff concluded the earlier data may not represent current watershed conditions, staff analyzed monthly data from January 2003 to April 2006. BVI and ECI were approximately 1.5 miles north of the County’s and CCAMP’s Browns Valley Bridge sampling locations. However, BVI was on Browns Creek upstream of the confluence of Corralitos and Browns Creeks, and ECI was on Corralitos Creek. Both sampling locations were downstream of low intensity residential and forest/open space land uses. BVI was also downstream of irrigated agriculture. The City’s E. coli data came from six water samples collected at each of five sampling locations between January 4 and February 9, 2005 (the City’s downstream sampling locations). They were distributed from approximately four miles upstream of the confluence of Salsipuedes Creek and the Pajaro River to just upstream of the confluence of the two waterbodies (Figure 3-2). The sampled reach was downstream of low intensity residential, urban, irrigated agriculture, pasture, and forest/open space land uses. BVI was also downstream of irrigated agriculture land uses in Figure 2-1. The City of Watsonville volunteered to collect these water samples to help determine specific reaches with high levels of FIB.
3.3.4.2 Data Analysis Results
Fecal coliform data from the City of Watsonville indicated that five of 40 samples (13 percent) and three of 40 samples (eight percent) at the ECI and BVI, respectively, exceeded the maximum water quality objective (Table 3-5). The maximum values
E. coli Geometric Mean Recommended Water Quality Criteria (126 MPN/100 mL)
Sampling Location Number Location
% Exceedances
Number of Samples
Sets
Number of
Samples in Each
Set
Period of Record
SALSI 21 Salsipuedes Creek at East
Lake Avenue Bridge 100 1 8
CORRA 23
Corralitos Creek at Pista Lane /7226 Freedom Blvd.
100 1 8
Periodically from
November 2003 to
November 2004
Draft Project Report - Corralitos Creek Fecal coliform TMDL March 2009
19
were 2,400 and 1,600 MPN/100mL, and the medians were 51 and 130 MPN/100mL at ECI and BVI, respectively.
Table 3-5 City of Watsonville sampling locations and fecal coliform data
analysis results
Fecal coliform Maximum Water Quality Objective
(400 MPN) Sampling Location Number Location % Exceedances Number of
Samples Period of Record
ECI Eureka Canyon Intake
13 40
BVI Browns Valley Intake
8 40
Monthly from January 2003 to
April 2006
The City’s E. coli water samples exceeded recommended USEPA recommended water quality criteria at each of the City’s downstream sampling locations (Table 3-6). Geomean values increased from 143 to 342 MPN/100 mL as the Corralitos/Salsipuedes Creek coursed downstream. The highest E. coli values resulted from a rain event that took place on January 26, 2005. The values for this day skewed the geomean at each location. The maximum value during the rain event was 4,106 MPN/100 mL at the most downstream location, Salsipuedes Creek just upstream of the Pajaro River Confluence (CC 5).
Draft Project Report - Corralitos Creek Fecal coliform TMDL March 2009
20
Table 3-6 City of Watsonville sampling locations and E. coli data analysis results
E. coli Geometric Mean Recommended Water Quality Criteria (126 MPN/100mL)
Sampling Location Number Location % Exceedances
Number of Sample Sets
Number of Samples in Each Set
Period of Record
CC 1 Corralitos Creek
at Green Valley Rd. 100 2 5
CC 2 Corralitos Creek just
upstream of Salsipuedes Creek
100 2 5
CC 3
Salsipuedes Creek at Lake Ave. (just downstream of the confluence of Corralitos and
Salsipuedes Creeks)
100 2 5
CC 4 Salsipuedes Creek at Riverside Drive Bridge
(just upstream of the bridge) 100 2 5
CC 5 Salsipuedes Creek
just upstream of Pajaro River Confluence
100 2 5
Approximately every 7 days
from January 4, 2005 to
February 9, 2005
Draft Project Report - Corralitos Creek Fecal coliform TMDL March 2009
21
Figure 3-2 The City’s downstream sampling locations in the Corralitos/Salsipuedes Creek Watershed
Draft Project Report - Corralitos Creek Fecal coliform TMDL March 2009
22
3.3.5 E. coli Data Revisited
Since the data analysis section and the writing of the majority of this report were completed, the USEPA revised their recommendation on asserting impairment using E. coli data. USEPA recommended having at least three samples in a 30-day period to apply the geometric mean criteria of 126 MPN/100mL. If three samples in a 30-day period were not available, USEPA recommended using the concentration of 235 MPN/100mL as a benchmark, and that impairment can be asserted if the number of exceedances is five or greater. Water Board staff reevaluated the E. coli data in the above data analysis and concluded that USEPA’s revised recommendations did not change the conclusions made in this report. Staff came to this conclusion via the following. Staff concluded E. coli data collected by the City of Watsonville was sufficient to be analyzed using the 126MPN/100mL benchmark and left the above analysis as is. Staff determined there was not enough data collected by the Coastal Watershed Council (CWC) to use the 126MPN/100mL benchmark, therefore staff used the 235 MPN/100mL benchmark. Recall that eight samples were collected from the two CWC sites over an approximate 1 year period (Table 3-4). Using the new criteria, staff determined that the CWC data showed impairment at CORRA 23, similar to the analysis performed with the previous criteria. Staff used the data from SALSI 21 to determine this location did not show impairment based on the new criteria. Only four of the eight samples exceeded 235 MPN/100mL. However, because more recent FIB data from SALSI 21 and surrounding sites indicated impairment, staff concluded the reach upstream, downstream, and including this site was impaired. Staff displayed the CWC data and the number of E. coli exceedances below. This and all other data can also be found in Appendix A.
Draft Project Report - Corralitos Creek Fecal coliform TMDL March 2009
23
Table 3-7 Coastal Watershed Council E. coli Water Quality Data and Total Exceedances for Sampling Locations SALSI 21 and CORRA 23.
Sampling Location Date
E. coli MPN/100 mL
11/05/03 662
03/08/04 161
05/26/04 185
07/06/04 226
08/12/04 285
09/22/04 243
10/07/04 437 Total Exceedances of
235/100mL:
SALSI 21
11/08/04 20 4
11/05/03 322
03/08/04 20
05/26/04 441
07/06/04 1333
08/12/04 201
09/22/04 855
10/07/04 4611 Total Exceedances of
235/100mL:
CORRA 23
11/08/04 187 5
3.4 Relationship of Genetic Studies to Land Use in Other Watersheds
Genetic microbial source tracking is primarily useful in identifying the number of different fecal sources in a watershed, but can also assist in prioritizing implementation actions. Water Board staff used genetic data in multiple watersheds to assist in determining sources and identifying implementation actions. These methods however, are expensive and time-consuming, especially if multiple waterbodies are in question. In watersheds where there is a mosaic of land uses, microbial source tracking is not a reliable method for tying sources to land uses because the same animal sources can originate from more than one land use. Moreover, determining relative contributions by genetic methods may also not be reliable and may not change the approach to solving the problem. Water Board staff evaluated results of genetic studies conducted in other Central Coast Region watersheds to assist in characterizing sources of fecal coliform contamination in the Corralitos/Salsipuedes Creek watershed. The discussion below includes an analysis of land use influence on FIB concentrations in two watersheds
Draft Project Report - Corralitos Creek Fecal coliform TMDL March 2009
24
with similar land uses: the Watsonville Slough watershed and the Morro Bay watershed. A study conducted in the Watsonville Slough watershed (Hager et al, 2005) determined that all land uses were associated with exceedances of water quality objectives. Staff examined the association of dominant land use in subwatersheds of the Watsonville Sough watershed where water quality objectives were exceeded. Staff concluded that these exceedances occurred in summer and/or winter regardless of dominant land uses (Table 3-8). Staff found a consistent depression of the bird component of fecal coliform with wet conditions. This pattern was also found in the Morro Bay watershed. Data suggested that winter runoff introduced additional FIB from non-bird sources, reducing the proportion of bird FIB from 98 to 38 percent in one subwatershed of the Watsonville Slough. While the findings in Table 3-8 confirmed contributions from terrestrial sources, they did not definitively indicate which land use contributed which terrestrial source. Stated another way, staff could not easily correlate terrestrial sources (dog, cow, human) with available land use data. The data from the Watsonville Slough study also indicated that urban land uses were commonly associated with concentrations of E. coli in excess of recommended water quality criteria (urban land use was located upstream of Struve Slough, a waterbody that exceeded water quality objectives). Furthermore, staff implicated urban land uses as sources of controllable fecal material from dogs and humans based on analysis of genetic sources and associated land uses.
Table 3-8 Land uses contributing flow to sampling locations for genetic source tracking
and results of genetic analysis for wet and dry seasons in Watsonville Sloughs, 2003.
Source: Hager, et al., 2004, and SH&G, et al., 2003.
Rabbits Human
s Dogs Birds Cows
Land use (Percent of subwatershed) Dry Wet Dry Wet Dry Wet Dry Wet Dry Wet
Struve Slough Percent of Sample
Urban 45%
Commercial 45%
Agricultural 10%
0 0 0 3 2 21 98 38 0 38
Lower Watsonville Slough
Agricultural 85%
Undeveloped 15% 0 0 0 0 6 28 94 20 0 52
Upper Harkins Slough
Undeveloped 65%
Grazing 20%
Rural Residential 10%
Agricultural 5%
0 0 1 2 47 9 52 18 0 71
Draft Project Report - Corralitos Creek Fecal coliform TMDL March 2009
25
California Polytechnic State University, San Luis Obispo (2002) conducted a genetic fingerprinting study in the Morro Bay watershed. Data collected from Chorro and Los Osos Creeks in the Morro Bay watershed suggested that bovine (cow) sources contributed the majority (31 percent) of E. coli in Chorro Creek, a watershed with 63 percent rangeland (Table 3-9). Bovine sources contributed similar levels of E. coli during both wet and dry weather sampling, as did all sources, therefore staff did not distinguish between wet and dry sources of data in Table 3-9. In Los Osos Creek, a watershed with a mixture of urban, rangeland, and agriculture, no single source exceeded 20 percent of the total.
Table 3-9 Land uses contributing flow to sampling locations for genetic source tracking and results of genetic analysis in Chorro and Los Osos Creeks, 2002
The land uses (pasture, urban, low intensity residential, irrigated agriculture, and open space) addressed in this project are similar to those in the Watsonville Slough and Morro Bay watersheds. While it was not possible to definitively determine which sources were originating from each land use because each watershed had multiple land uses, staff transferred some of the conclusions from these studies to the watersheds addressed in this Report. Staff summarized them in the following section.
3.5 Water Quality Data and Genetic Data Analysis Summary
The City of Watsonville, Santa Cruz County, and CCAMP collected fecal coliform data in Corralitos and Salsipuedes Creeks. Additionally, the City of Watsonville and
Avian Cow Dog Human Land use
Percent of subwatershed Percent of sample isolates identified for
each animal source
Chorro Creek
Urban 5.4%
Rangeland 62.8%
Agricultural 6.1%
Brushland 17.0%
Woodland 8.7%
11 31 6 13
Los Osos Creek
Urban 16.9%
Rangeland 37.3%
Agricultural 18.8%
Brushland 3.3%
Woodland 16.8%
20 8 12 19
Draft Project Report - Corralitos Creek Fecal coliform TMDL March 2009
26
the CWC collected E. coli data to help isolate the location of the sources of fecal coliform by detecting differences in FIB concentrations between sampling locations. Staff concluded the following from the data presented in Section 4 Source Analysis. • Staff determined the impaired reaches of Corralitos and Salsipuedes Creeks that
are the subject of this project report and the implementation plan in Section 10. The impaired reaches are illustrated in Figure 1-2 and further explained in the following two bulleted points.
• Staff concluded that Corralitos Creek was impaired downstream of SCC2 (Figure 3-1 and 1-2). Staff noted that there was no sampling location within the five-mile reach from SCC2 to CORRA 23 (the most upstream location exhibiting impairment). Staff determined that E. coli concentrations increased somewhere within the five mile reach and that fecal coliform concentrations increased somewhere between SCC2 and CC1.
• Staff determined all reaches of Salsipuedes Creek were impaired. Staff determined the E. coli geomean at the CWC sampling location SALSI 21, directly downstream of the confluence of Corralitos and Salsipuedes Creeks, was lower than the E. coli geomean from CORRA 23, approximately 2.75 miles upstream of the confluence. Contrastingly, staff noted that the geomean of the City’s downstream E. coli data (from sampling locations CC3 and CC4) increased by approximately 72 to 129 MPN/100mL after the confluence of the two Creeks. Staff concluded that neither the decrease nor increase in E. coli levels were significant enough to come to a conclusion regarding the contribution of E. coli from Salsipuedes Creek. Also, staff did not have data to analyze from Salsipuedes Creek upstream of the confluence with Corralitos Creek where data showed impairment. Therefore, staff determined the entire reach of Salsipuedes Creek was impaired.
• FIB concentrations generally increased as Corralitos and Salsipuedes Creeks coursed downstream and the land uses changed from predominantly forest/open space to urban.
• Fecal coliform data collected by the City of Watsonville, Santa Cruz County, and CCAMP in the upper Corralitos Subwatershed (sampling locations ECI, BVI, SCC 1, SCC 2, and 305 COR2) indicated that although there were exceedances of the maximum water quality objective, they were few. Therefore staff did not find impairment in the upper reach of Corralitos Creek (upstream of sampling location SCC 2 on Figure 3-1).
• E. coli data collected at the City’s downstream locations (CC1 through CC5) indicated there were exceedances of the recommended USEPA E. coli geometric mean water quality criteria downstream of Browns Valley Bridge sampling location (SCC 2; Figure 3-1). Exceedances occurred at sampling locations from CC1 (Figure 3-2) downstream to CC5. Geometric mean values generally increased slightly at each sampling location in a downstream direction.
• The geomean of data collected at the CWC sampling locations also indicated exceedances of the recommended USEPA E. coli water quality criteria downstream of SCC 2 (Figure 3-1). Exceedances occurred at two sampling locations: (1) CORRA 23, and (2) SALSI 21.
Draft Project Report - Corralitos Creek Fecal coliform TMDL March 2009
27
• The farthest downstream CCAMP sampling location 305 COR exceeded the fecal coliform maximum water quality objective in 40 percent of the 15 samples indicating impairment at this location.
• While genetic methods are among the ways to identify different fecal sources of fecal coliform in a waterbody, Water Board staff concluded a genetic study was not warranted to proceed with TMDL development and begin implementation in the Corralitos/Salsipuedes Creek watershed. Instead, staff extrapolated conclusions from previous genetic studies to this study. Those conclusions included the following:
� Specific sources (e.g. dog, human) likely originated from more than one land use.
� While staff could not easily correlate sources with land use data, staff noted exceedances of water quality objectives with all land uses.
� Natural sources (wild animals or multiplication of fecal coliform in the environment, e.g. deposited in sediment or organic matter during a past pollution event; see Section 4.1.8 Natural Sources for more details) could potentially, alone, cause exceedances of water quality objectives.
Draft Project Report - Corralitos Creek Fecal coliform TMDL March 2009
28
4 SOURCE ANALYSIS This section discusses FIB sources in the Corralitos/Salsipuedes watershed that likely reached Corralitos and Salsipuedes Creeks. Staff discussed the ways various sources reached Corralitos and Salsipuedes Creeks. Staff relied on information presented in Section 3 Data Analysis and considered the following:
� wastewater spill data, � proposed and existing management programs, � United States Geologic Survey 7.5 minute topographic maps (Watsonville
West and Watsonville East Quadrangles) and Santa Cruz County Compass Map,
� field observations, � land use data � connections between land use and genetic sources from past studies, � the permitted facilities in the watershed, � relationships between seasonal conditions and FIB concentration, and � connections between land use and seasonal conditions.
Staff also integrated information from conversations with and/or reports by staff at County of Santa Cruz Health Services Agency, City of Watsonville Public Works, Salsipuedes Sanitary District, Freedom County Sanitation District, Coastal Watershed Council, the Santa Cruz County Resource Conservation District, and various Farming and Livestock related Agencies.
4.1 Source Categories and Source Organisms of Fecal Indicator Bacteria
4.1.1 Storm Drain Discharges to Municipally Owned and Operated Storm Sewer Systems Required to be Covered by an NPDES Permit (MS4s)
Staff concluded storm drain discharges transfer FIB to surface waterbodies. These discharges potentially contain human waste from municipal collection system sewage spills and leaks (discussed in Section 4.1.6 Sanitary Sewer Collection System Spills and Leaks). Discharges also contain urban runoff that has the potential to contain pet waste and dumpster leachate, which is a controllable source. Urban runoff may also contain bird, rodent, and other wildlife waste. Staff considers these sources controllable to some extent (as explained in Section 4.1.1.2 Controllable Wildlife Waste and Transport Mechanisms). Based on land use surrounding the impaired reach of the Creeks, much of which is urban, ribotyping studies in similar watersheds (Section 3.4 Relationship of Genetic Studies to Land Use in Other Watersheds), and the additional sources of data listed above (under Source Analysis), staff concluded that the following sources were likely in the storm drain discharge from the Corralitos/Salsipuedes Creek watershed.
Draft Project Report - Corralitos Creek Fecal coliform TMDL March 2009
29
4.1.1.1 Pet Waste Transport Mechanisms
Staff determined pet wastes reached waterbodies of the Corralitos/Salsipuedes watershed via storm drain discharges during wet seasons. Staff also considered that during dry seasons pet waste reached storm drains if it was deposited on sidewalks, parking lots or other similar surfaces. From these surfaces waste could have been washed to surface waters through car washing water, excess irrigation, or similar water sources. Staff observed dogs and dog walkers while visiting the Corralitos/Salsipuedes watershed. Staff concluded that because they observed dog walkers who did not pick up their dog’s waste in other watersheds, this activity occurred in this watershed.
Sign and broken “mutt-mitt” dispenser in Pajaro Levee Park, adjacent to Salsipuedes Creek (October 27, 2006). The County of Santa Cruz prohibits animal owners to allow animals to defecate on any public property and requires the animal’s owner to dispose of solid waste resulting from an act in violation of this section (6.12.080 Animal defecation prohibited). The City of Watsonville also has an ordinance regarding dog waste. Regardless of these ordinances, Water Board staff concluded it was likely that FIB from this source reached Corralitos/Salsipuedes Creek. The Implementation Plan in Section 10 Implementation Plan recommends methods to minimize this source.
Draft Project Report - Corralitos Creek Fecal coliform TMDL March 2009
30
Dog walker in Pajaro Levee Park adjacent to Salsipuedes Creek (October 27, 2006).
4.1.1.2 Controllable Wildlife Waste and Transport Mechanisms
The Water Board can regulate anthropogenic activities that attract wildlife, thereby controlling to some extent, the activities of wildlife. For example, human activities such as littering attract wildlife. Wildlife forages through litter and may defecate in the same place that they found the litter such as a city sidewalk or road shoulder. Landscaping runoff, wash water, or storm water runoff may cause the feces or FIB from the feces to enter surface waters. Furthermore, in other watersheds, such as the Soquel Lagoon watershed, microbial source tracking data suggests that rodents and other wildlife contribute FIB to surface waters in areas of urban land use (Central Coast Regional Water Quality Control Board, 2006). Littering and other activities that attract wildlife, in addition to transport mechanisms such as wash water and landscaping runoff, are controllable human activities, and controlling these activities will result in the control of wildlife. The Implementation Plan in Section 10 Implementation Plan recommends methods to minimize controllable wildlife.
4.1.1.3 Trash Receptacle Leachate
When it rains, rainwater can enter trash receptacles (private residential trash cans and larger commercial dumpsters) and discharge leachate. This occurs when receptacles are uncovered and/or containers leak. Receptacles may contain animal waste because wildlife and domestic animals leave waste while scavenging through uncovered receptacles. Property owners also discard yard waste from pets or waste
Draft Project Report - Corralitos Creek Fecal coliform TMDL March 2009
31
from cat boxes into trash receptacles. People also use trash receptacles to discard diapers. FIB contained in these sources may reach storm drains and surface waters in the wet season. During dry seasons, FIB may reach surface waters when trash-holding areas are hosed off or washed. Wash water may reach storm water drains and surface waters. The City of Watsonville and the County of Santa Cruz are municipalities with residential and commercial land uses. These municipalities provide trash collection services to residences and commercial properties within the Corralitos/Salsipuedes watershed. Since these properties produce trash, there is potential for trash containers on these properties to leak, crack, or be knocked over and to discharge FIB to sidewalks or parking lots or other impervious surfaces and ultimately to the storm water system. The Implementation Plan in Section 10 Implementation Plan recommends methods to reduce FIB contributions in the Creeks from trash receptacle leachate. 4.1.2 Homeless Person/Encampment Discharges (Not Regulated by a
Permit for Storm Water Discharges)
Homeless persons generate human fecal waste. Santa Cruz County staff, Santa Cruz County Sheriff’s Center and Water Board staff observed homeless persons and encampments in Corralitos and Salsipuedes Creeks. Staff concluded homeless persons were a source of FIB in Corralitos and Salsipuedes Creeks. Santa Cruz County and CCAMP monitoring staff reported to Water Board staff that homeless persons were, and currently exist, in Corralitos and Salsipuedes Creeks. Staff concluded that there were homeless persons on multiple private properties and on public property within riparian areas. Sergeant Christine Swannack of the South Santa Cruz County Sheriff’s Center “sweeps” homeless people from the Creeks twice a year. The numbers decrease gradually due to the sweeps but as of a conversation with Swannack on October 11, 2006 homeless persons still used the areas. She said that she always found homeless under the bridge at Airport Blvd. and Corralitos Creek and for approximately 0.25 mile north of this location. She also found homeless people at Green Valley Road and Corralitos Creek. Swannack indicated that most were single males who went to the Creeks to drink alcoholic beverages and also spent the night there. Water Board staff observed human waste on the Salsipuedes Creek banks just upstream and downstream of and under the Riverside Drive Bridge on separate occasions within the last year (May 24, 2006 and October 27, 2006). Staff saw evidence, such as sleeping pads, suggesting people spent the night in these locations. Staff also noted two storm water discharge outlets approximately 20 feet upstream of the Riverside Drive Bridge. It was highly likely that storm water flow in addition to rising Creek flow through this area washed debris, including human waste, from the banks into the Creek during the wet season. Furthermore, Water Board staff observed homeless persons climbing onto a tree that extends over
Draft Project Report - Corralitos Creek Fecal coliform TMDL March 2009
32
Salsipuedes Creek. The homeless persons used the tree to defecate directly into the Creek water. Staff noted the easy access to the Creeks because of its roadside location in some reaches. Parks built around Corralitos Creek that included the levees as walkways also encouraged access in some locations. Staff noted signs prohibiting use of Corralitos Creek after sunset and consumption of alcoholic beverages in these locations. Because homeless persons and their waste existed within the Corralitos/Salsipuedes Creek system, Water Board staff determined it was highly likely that their waste reached surface waters. Staff concluded that actions to reduce FIB from homeless persons in Corralitos/Salsipuedes Creek are necessary. Actions are included in Section 10 Implementation Plan. 4.1.3 Pet Waste (Not Regulated by a Permit for Storm Water Discharges)
Staff concluded that pet waste in areas that do not drain to MS4s likely contributed FIB to surface waters in the Corralitos/Salsipuedes watershed. Staff discussed pet waste within MS4s in Section 4.1.1.1 Pet Waste Transport Mechanisms. Pet waste that is directly deposited to surface waters from riparian areas is not regulated by MS4s. Staff observed leashed dogs walking along the levee of Salsipuedes Creek within Pajaro River Levee Trail Park (October 27, 2006). There were no fences between the Creek itself and the levees making easy access to the Creek in several stretches from adjacent streets. Staff observed only one sign near the Creek asking dog walkers to pick up their dog’s waste (October 27, 2006). Staff also noted a broken and rusted dispenser that once provided plastic bags for this purpose. Furthermore, staff observed other watersheds in which dog walkers did not pick up their waste in riparian areas. Staff concluded similar activities occur in this watershed. Max Alford, a volunteer helping to address homeless problems in the Corralitos/Salsipuedes watershed for the South Santa Cruz County Sheriff’s Center, observed 30 to 40 cats at one time within the impaired reach of Corralitos Creek near CORRA 23 (personal communication, January 3, 2007). Alford suspected that the cats were pets of illegal immigrants who abandoned them when they moved from the area. Staff concluded that pet waste in areas that do not drain to municipally owned and operated storm sewer systems required to be covered by MS4s, was a source of fecal coliform that can be controlled and is proposing additional actions in Section 10 Implementation Plan.
Draft Project Report - Corralitos Creek Fecal coliform TMDL March 2009
33
4.1.4 Onsite Wastewater System Discharges
Septic systems, also known as onsite wastewater systems, are potential sources of FIB to surface waters. Staff concluded that onsite wastewater system failures were a likely source of FIB that caused exceedance of water quality objectives. Typically during dry periods, sewage from failing onsite wastewater systems does not reach surface waters unless a failure occurs very close to a Creek or a tributary. During the wet season while the ground is saturated with water it is possible that FIB in surfacing effluent from failing onsite wastewater systems flows to ditches, or overland, and into creeks. Staff concluded it is also possible that partially treated sewage from a leachfield may reach surface waters through flow out of a soil bank, e.g., a road cut, and into a creek, or ditch that connects with a creek. Failures from seven different onsite wastewater systems occurred in one area of the watershed from 1993 to 2005 (John Ricker, County of Santa Cruz Environmental Health Services, personal communication, June 14, 2007). The County also provided record of surfacing effluent from several of the onsite wastewater systems in the Delaney community during the same time period. The area in which Ricker reported onsite system failures was adjacent to Salsipuedes Creek and known as the Delaney community (Figure 4-1). The Delaney community is on soil with very slow permeability and in which septic tank leach fields do not function properly (United States Department of Agriculture Soil Survey of Santa Cruz County, California, August 1980). Also, the area slopes gently toward the Creek (USGS 7.5 minute series topographical map; Watsonville East Quadrangle). The assessor parcels on this soil type are within the boundaries of State Highway 152 to the southeast, Foothill Road to the northeast (excluding assessor parcel numbers 05155107 and 05155106), Salsipuedes Creek to the northwest, and up to, but not including The County Fairgrounds to the southwest. There were approximately 30 homes relying on onsite wastewater systems located in this type of soil (Santa Cruz County Interactive GIS website, 2007). Some of the dysfunctional onsite wastewater systems in the Delaney community were replaced with alternate systems. In September of 2008, John Ricker commented that there may be additional potential problems in the winter, and that there are three parcels on which they will conduct follow-up checks. Ricker also noted that the County will also conduct a general check of the area. Numerous additional onsite wastewater systems existed along both Corralitos and Salsipuedes Creeks in the impaired portion of the watershed. Many factors lead staff to be suspicious about additional onsite wastewater systems, such as:
o Onsite wastewater system life expectancy may have been exceeded. Many homes (and staff assumes onsite wastewater systems as well) in the impaired areas were approximately 20 and probably 30 or 40 years old (John Ricker, personal communication, April 19, 2007). Septic tanks have estimated life spans that depend on the type of material used to build them. Typical
Draft Project Report - Corralitos Creek Fecal coliform TMDL March 2009
34
materials range in life expectancy from 15 to 45 years. The most common types of tanks are built from concrete that can function indefinitely. However,
Figure 4-1 Red outlined polygon denotes Salsipuedes Creek-adjacent area in which some onsite wastewater systems failed.
Draft Project Report - Corralitos Creek Fecal coliform TMDL March 2009
35
concrete can develop leaks for reasons such as shifting ground, poor quality of the concrete itself and the seals, a faulty joint between the top and body, or it may leak from the time it is created due to poor construction (Kahn et al, 2000).
o The Corralitos/Salsipuedes watershed is located near a major fault that causes the ground to shift. A major earthquake occurred in 1989. Staff also suspects additional shifting since then, all of which may have compromised onsite wastewater systems.
o Groundwater in the watershed was poorly mapped and there were clay lenses throughout the watershed (Brian Lockwood, Assistant Hydrologist, Pajaro Valley Water Management Agency, personal communication, May 2007). Clay lenses may cause groundwater to perch. Perched shallow groundwater can lead to onsite wastewater system failure.
o Staff concluded there were many onsite wastewater systems close enough to the Creeks to pose a threat to water quality if they were to malfunction.
o According to Preliminary Report; An Evaluation of Wastewater Disposal and Water Quality in the San Lorenzo River Watershed (Environmental Health Service, Health Services Agency, County of Santa Cruz, September, 1989), leachfields fail. The evaluation was a survey of wastewater disposal and water quality in the San Lorenzo watershed. The survey found that 6% of onsite wastewater systems had leachfield failures. Of the 6%, 80% were systems with no previous record of problems. Although staff received updated information that the observed onsite wastewater system failure rate in the San Lorenzo River Watershed has declined since 2003 (failure rate of 1-2%), staff concluded it was important to recognize the significance of the above information. Just because there is no record of a problem (an observed failure) does not mean the leachfield is functioning properly.
Staff concluded that onsite wastewater systems in the Delaney community were a likely source of FIB contributing to water quality impairment in Salsipuedes Creek. Staff will continue to accept information on the potential failure of onsite wastewater systems in areas outside of the Delaney community and within the Corralitos/Salsipuedes Creek watershed. Methods to minimize onsite wastewater systems as a source are included in Section 10 Implementation Plan. 4.1.5 Farm Animals and Livestock Operations Discharges
There is evidence from other watersheds supporting the conclusion that FIB from animals such as horses and livestock that are in proximity to a waterbody are transported to the respective waterbody through storm water runoff. Staff observed horses and goats, and had evidence that other livestock were located within the Corralitos/Salsipuedes Creek watershed. Staff determined that FIB from these livestock operations likely contributed to exceedance of water quality objectives in Corralitos and Salsipuedes Creeks.
Draft Project Report - Corralitos Creek Fecal coliform TMDL March 2009
36
Darlene Din with the Central Coast Agricultural Task Force noted that there were many small horse operations in the watershed (personal communication, August 31, 2006). Dr. Marc Los Huertos (Assistant Professor in the Division of Science and Environmental Policy California State University Monterey Bay and Researcher for the Center for Agroecology and Sustainable Food Systems) indicated that he observed chickens wandering near Corralitos Creek (personal communication, March 19, 2007). Livestock operations that staff observed were small (two or three animals to a site) with the exception of the Santa Cruz County Fairgrounds, approximately 1 mile northeast of the confluence of Salsipuedes and Corralitos Creeks. Although, staff observed only one horse at this facility, there were signs that several animals use the site and research of Fairground activities revealed several farm animal events throughout the year (2007). Also, staff did not see management practices in place that would keep runoff from the manure area from entering surface waters. Staff observed some operations in the watershed that drained to either Corralitos Lagoon or Pinto Lake, both of which lack outlets and do not connect to Corralitos Creek (staff observation on October 27, 2006). However, staff observed a goat pen at the top of the Corralitos Creek bank. The goat pen was located between Freedom Boulevard and Corralitos Creek and upstream of Airport Boulevard (within the lower portion of the watershed where the impairment occurred; March 14, 2007). Aerial photography from the Santa Cruz County Interactive GIS website from 2003 also showed grazing land and pen-type facilities within approximately 600 to 700 feet of Salsipuedes Creek in the watershed.
Draft Project Report - Corralitos Creek Fecal coliform TMDL March 2009
37
Goat pen and shelter, and goats along Corralitos Creek adjacent to top-of-bank (goats are in background, center; April 6, 2007).
Close-up of goats on Corralitos Creek adjacent to top-of-bank (April 6, 2007).
Because farm animals and livestock and their waste existed within the watershed in proximity to Corralitos/Salsipuedes Creek, Water Board staff determined it was likely that FIB from their waste reached surface waters. Staff concluded that actions to reduce FIB from livestock operations in Corralitos and Salsipuedes Creeks are necessary. Actions are included in Section 10 Implementation Plan.
Draft Project Report - Corralitos Creek Fecal coliform TMDL March 2009
38
4.1.6 Sanitary Sewer Collection System Spills and Leaks
Water Board staff concluded that collection system spills in the last five years contributed FIB to Corralitos and Salsipuedes Creeks. Three collection systems operated within Corralitos/Salsipuedes Creek watershed: 1) Salsipuedes Sanitary District (SSD), 2) the City of Watsonville Collection System (CWCS), maintained by their Public Works and Utilities Department, and 3) Freedom County Sanitation District (FCSD). Staff addressed the first and third systems through Waste Discharge Requirement (WDR) Order No. R3-2003-0041. Staff addressed the second system through NPDES Permit No. CA0048216. All three districts were tributary to the City of Watsonville Waste Water Treatment Plant (WWTP) that was outside the Corralitos/Salsipuedes Creek watershed boundaries. Areas of the Corralitos/Salsipuedes Creek watershed not connected to one of the three collection systems relied on onsite wastewater systems or seepage pits. Wastewater from collection systems can reach surface waters from sewer line overflows (spills) or leaks. Sewage spills can occur when roots, grease buildup, hair, or other debris block sewer lines. Wastewater can leak from cracked lines or lines with faulty connections. Rainfall and groundwater infiltration into lines with these conditions contribute to sewer system overflow (or spills) during the wet season. Infiltration can result in a greater amount of flow than the line and connected pump stations were designed to handle. The entry of rainwater into the system through illicit openings (inflow) can produce the same result. When sewer lines are blocked or leaking, sewage may run onto the street, into gutters, and into storm drains. Conversely, sewage exfiltration potential exists in dry seasons. Exfiltration occurs when sewage leaks from lines underground. These types of leaks often go unnoticed and FIB can be transported to surface waters.
4.1.6.1 Collection System Spills
All three sanitation districts had very few spills in the last five years with only some of the spills reaching the Creeks. The SSD had four spills from 2003 to 2006. Sewage from a 500 gallon SSD spill reached Salsipuedes Creek in 2006. It was unknown whether or not another spill in 2006 of less than 500 gallons reached surface waters. There was no storm drain located near the spill and a nearby lawn reportedly absorbed at least some of the overflow. The SSD also had one spill of less than 50 gallons in 2005 and one spill in 2003 of 215 gallons, both of which did not reach surface waters. Staff determined there were no spills within the district from May of 2007 to present that were within the Corralitos/Salsipuedes Creek watershed. There were no spills in 2006 from the CWCS including the portion of the district not within the Corralitos/ Salsipuedes Creek watershed. Furthermore, none of the CWCS spills from 2003 to 2005 or in 2007 occurred within the Corralitos/Salsipuedes Creek watershed. The FCSD had four total spills from 2002 to 2007. Five gallons of sewage from a 200 gallon spill reached Corralitos Creek in 2005. There were two spills in 2004,
Draft Project Report - Corralitos Creek Fecal coliform TMDL March 2009
39
one of which did not affect the Creek. FCSD staff did not determine if the second spill of 175 gallons reached surface waters or not, although the spill did travel into a storm drain. A fourth spill that occurred in the FCSD in 2003 did not flow to surface waters.
4.1.6.2 Additional Collection System Operations
Staff spoke with Joanne Turnquist, District Manager of the SSD, and reviewed information she provided (communication with Turnquist occurred on several occasions from August to December, 2006). Staff concluded the SSD addressed problems that arose in the SSD including those near surface waters in a timely manner. The SSD was a small district serving approximately 500 sewer connections. The SSD was up to date with repairs until the initiation of work on this Report (June 2006). They repaired, or will repair as soon as possible, collection line problems that arose from approximately June to December 2006 including those near the Creek. Water Board staff determined that the SSD promptly resolved collection system problems. However, the response protocol and training described/required in their annual report regarding their Infiltration/Inflow and Spill Prevention Program (Salsipuedes Sanitary District, January 29, 2008) was inadequate. Staff found that the spill prevention program did not describe getting ahead (or downstream) of the spill, when a spill occurred. However, staff was told that the SSD will call the spill response contractor and advise them to implement spill containment procedures, if they are not currently employing actions that prevent spilled sewage from entering natural waterways (Water Board Staff communication with Mike Higgins, June 11, 2008). Staff also found through the SSD’s annual report that “training is non-existent” and that the SSD is depending and waiting on the City of Watsonville to contact them regarding training opportunities, implying that their own spill response staff was not trained. Staff was informed that the SSD’s contractor is trained (Water Board Staff communication with Mike Higgins, June 11, 2008). Private lateral problems lead to some of the collection system problems in the SSD. Laterals are discussed in Section 4.1.7 Private Sewer Laterals Connected to Municipal Sanitary Sewer Collection Systems. The CWCS operates under a Sewer System Management Plan that is a requirement of the NPDES permit for the Wastewater Treatment Plant (that is not within this watershed). Bob Geyer of the City of Watsonville indicated that the Department of Public Works completed a sewer capacity and assurance analysis that was a complete infiltration and inflow (I & I) system analysis, but that did not include televising (inspecting with a camera) the lines (personal communication, November 10, 2006). He also reported that staff televised the lines as problems developed. The CWCS received the capacity and assurance analysis report in February 2007.
Draft Project Report - Corralitos Creek Fecal coliform TMDL March 2009
40
Staff concluded the report did not identify any capacity improvement projects in the CWCS near the Creeks that needed to be addressed. Geyer also reported to staff that as a result of the Loma Prieta earthquake in 1989, most of the collection system was replaced. Furthermore, Jim Crawley, City of Watsonville sewer system chief, told staff that the City has a new video truck with a Global Positioning System, and that they plan to begin to video survey the sewers within the next few months (Water Board staff communication with Mike Higgins, June 10, 2008). However, Bob Geyer also informed staff that “in portions of the collection system near the Creeks some groundwater infiltration was getting into the collection system due to the high groundwater levels in that area. Perched groundwater was above the depths of the sewers causing groundwater to flow into the sewers preventing exfiltration from the sewers (personal communication, December 20, 2006).” Water Board staff determined that the CWCS operated satisfactorily and that the proactive televising of their collection system should prevent problems including those that may arise due to the decrease of the level of groundwater and exfiltration from sewer lines. The FCSD provided information that I & I occurred in several locations in an area East of Green Valley Road between Amesti Road and Mesa Verde Drive. Although this area was not near the Creeks it contained tributaries that connected to College Lake and Salsipuedes Creek. However, it was approximately three miles from Salsipuedes Creek through those tributaries. Rachel Lather of the FCSD informed staff they will concentrate on the I & I problems in this area within the next year (personal communication, December 21, 2006). Another priority for the FCSD that they included in the current fiscal year budget was pump station upgrades and improvements, and minor sewer repairs. FCSD staff made pump station improvements based on flow modeling prior to I & I improvements because of the greater gain from controlling spills from this upgrade than the benefits realized from I & I repairs (personal communication, Rachel Lather, August 17, 2006). The capacity and assurance analysis conducted for the City of Watsonville included analysis of the FCSD lines. As mentioned above, the report showed no problems in areas near the Creeks with the exception of some infiltration occurring from perched groundwater infiltrating the lines but preventing exfiltration from the sewers. There was one high priority improvement project identified in the report in the FCSD, in the same area as mentioned above (along Green Valley Road near tributaries to College Lake). The FCSD submitted a Collection System Management Plan (CSMP) per the requirements of the WDR in September of 1999. The plan summarized who inspects the system and how it is inspected, assumptions about the system used to project long term Capital Improvement Projects, and the basis for priority of
Draft Project Report - Corralitos Creek Fecal coliform TMDL March 2009
41
replacement. Staff determined that FCSD had an adequate CSMP based on how the CSMP describes their prompt attention to collection system problems and efficient emergency response protocol. Staff concluded that sewage from spills due to collection system failure in the SSD and FCSD was a source of fecal coliform in Corralitos and Salsipuedes Creeks. The SSD and FCSD are required to implement the strategies discussed in Section 10 Implementation Plan. Additionally, the SSD and FCSD are required to monitor water quality. 4.1.7 Private Sewer Laterals Connected to Municipal Sanitary Sewer
Collection Systems
Lateral pipes that connect private property to a sanitary sewer collection system can develop leaks due to offsets, faulty connections, and/or cracks or chips in the pipes themselves. Laterals leaking far away from surface waters may soak into the surrounding soil and go unnoticed. However, leaks in proximity of surface waters could reach surface waters during the wet season when the ground becomes saturated or in locations where a groundwater conduit exists. Staff concluded it was highly probable that private laterals in all three sanitary sewer districts within the Corralitos/Salsipuedes watershed leaked outwardly and that during the wet season wastewater was transported to Corralitos and Salsipuedes Creeks. Information from two of the three sanitation districts identified laterals as contributors to collection system problems including the cause of sewage spills. Bob Geyer, Assistant Director of Public Works for the City of Watsonville, indicated that usually the problems in laterals were blockages, but occasionally roots growing through the lateral caused them to fail (personal communication, August 31, 2006). Furthermore, information contained in the City of Watsonville Storm Water Management Program (SWMP) Draft indicated that, “smoke testing recently conducted by the City revealed numerous leaks in the laterals serving residences and some businesses.” District Manager of the Salsipuedes Sanitary District, Joanne Turnquist, indicated that laterals identified in their videotape of the sanitary system as well as through field observation caused sanitary system problems. Roots growing through the laterals or laterals offset from the house sometimes caused the problem (personal communication, November 6, 2006). Staff determined that an offset lateral or one with roots growing through it probably leaked outwardly. The Freedom County Sanitation District (FCSD) did not provide information about the condition of laterals. However, Water Board staff has enough evidence (including televising the laterals and or connections) from other watersheds that laterals to houses of approximately the same age (houses within the City of Watsonville as mentioned above) leaked to suggest that laterals connected to the FCSD also leaked. Additionally, staff found evidence that infiltration and inflow (I & I) due to laterals contributed from 43 to 50 percent of total I & I in sanitary systems in
Draft Project Report - Corralitos Creek Fecal coliform TMDL March 2009
42
the literature regarding laterals (Sanitary Sewer Overflow Cooperative Agreement Workgroup of the Water Environment Federation, 1999). This supports the conclusion that laterals leaked within the FCSD as well, in proximity of surface waters. Furthermore, no specific program to improve the condition of laterals connected to the FCSD existed. The City of Watsonville’s SWMP proposes approving an ordinance requiring inspection of sewer laterals on residential and commercial properties at the time the property is sold. The City also proposes inspectors report their findings to Public Works. If the property owner does not have repairs made, the City will hold escrow until the property owner completes the required work.
Staff concluded that private laterals leaked and were a likely source of FIB in Corralitos and Salsipuedes Creeks. Staff determined that implementation actions to reduce contributions from this source are necessary. The Implementation Plan in Section 10 recommends methods to minimize this source. 4.1.8 Natural Sources
Natural sources of FIB include wildlife such as birds, rodents, squirrels, skunk, deer, and any other animals present in a watershed that produce fecal matter that may enter surface waters. Natural sources also include potential in-stream reproduction of fecal coliform (Byappanahalli, Shively, Nevers, Sadowsky, and Whitman, 2003) that may have been deposited in sediment or organic material during past pollution input. Sand and sediment can serve as temporal sources and sinks of human and waterfowl-derived E. coli (Ishii et al, 2007). FIB that was historically deposited in sediment may remain in the sediment as a creek dries, then entrain when water flow resumes. Staff considered that stagnant or low flow conditions possibly contributed to the high fecal coliform levels in the Creek, particularly at and upstream of CORRA 23. A reach upstream of CORRA 23 and downstream of Brown’s Valley Bridge is known to dry up on a seasonal basis. FIB may multiply in stagnant ponds, particularly if the water temperature increases (Santa Cruz County, 2006). Stagnation is not a source, but is a condition that may lead to increased fecal coliform production. FIB that are a result of instream reproduction may constitute a naturalized source of fecal coliform stream loads. The scope and extent of this source, and the potential for regrowth of microbial indicators deposited in sediment or organic matter in the watershed is largely unknown at present. Staff considered the FIB resulting from regrowth and multiplication from controllable sources to be a naturalized source. Staff does consider these fecal coliforms controllable, insofar as the parent coliforms are controllable sources. Staff distinguishes natural sources from controllable wildlife sources, the latter of which are those caused or influenced by human activity, such as littering or leaving trash receptacles accessible to wildlife. Staff discussed controllable wildlife sources
Draft Project Report - Corralitos Creek Fecal coliform TMDL March 2009
43
above (Section 4.1.1.2 Controllable Wildlife Waste and Transport Mechanisms), and included measures to minimize their contribution to FIB loading in the Implementation Plan in Section 10 Implementation Plan. Every genetic finger printing analysis performed in other watersheds in the central coast region identified natural wildlife sources as a fecal coliform source. Therefore, staff expects Corralitos and Salsipuedes Creeks also had contributions of fecal coliform from natural wildlife sources that lead to water quality impairment. Water quality samples from the upper watershed (upstream of Corralitos Creek at Brown’s Valley Bridge) did not indicate impairment of Basin Plan fecal coliform water quality objectives. Land use in this upstream reach was predominantly forest and open space with a small amount of low intensity residential. Staff concluded natural wildlife sources are present on land upstream of this reach including the riparian and wetland habitat around the Creek. However, water quality objectives may have been attained because pervious surfaces and denser vegetation associated with open space and low intensity residential land use minimized FIB transport from this source to the Creek. In the lower impaired reach of Corralitos Creek (downstream of Corralitos Creek at Brown’s Valley Bridge), staff had difficulty distinguishing between natural sources and controllable wildlife sources because more urban and low intensity residential land uses existed there. However, there was riparian habitat and agricultural land, where natural sources may be present; therefore, staff assumed that both natural sources and controllable wildlife sources of FIB existed in the lower reach and contributed to impairment. Staff concluded that although natural sources contributed to the impairment, it was probable that if there were only natural sources in the lower watershed (and no humans, impermeable infrastructure, or controllable wildlife), they would not cause impairment of water quality. 4.1.9 Other Sources Considered
Water Board staff considered possible contributions from irrigated agricultural land use because it was the third most prominent land use after urban and low intensity residential and because staff did not have information regarding the practices of each agricultural facility. Staff concluded that contributions from irrigated agriculture were insignificant. First of all, staff determined the application of raw manure on agricultural fields in this watershed was rare (based on conversations with various agricultural associated organizations and individuals listed at the beginning of Section 4 Source Analysis). Staff also concluded it was likely that the application of organic compost containing animal feces was rare and that many growers used synthetic fertilizers. Furthermore, organic compost must be certified to be commercially sold. When compost is created from organic materials containing animal feces, producers use methods such as “turning under” the compost pile, restricting the size of the pile, and taking periodic temperature readings to ensure that fecal coliform are minimized.
Draft Project Report - Corralitos Creek Fecal coliform TMDL March 2009
44
Staff also considered FIB loading from farm workers in irrigated agricultural operations, however staff noted porta-potties located in proximity to field workers during field reconnaissance (October 27, 2006). Trucks equipped with trailers moved the porta-potties as the workers moved. Staff had no evidence to suggest that the porta-potties did not function correctly; therefore, staff concluded FIB loading from field workers was insignificant. Water Board staff is continuing to consider this conclusion as we evaluate irrigated agricultural practices in the region. Staff is also coordinating with U.C. Davis and the Department of Health Services to investigate the possibility of irrigated agricultural land use as a source of fecal coliform in surface water. Staff also considered sources such as illicit discharges. These types of sources alone may or may not cause impairment of water quality. Max Alford, a volunteer helping to address homeless problems for the South Santa Cruz County Sheriff’s Center, informed staff of illicit discharge of sewage into Salsipuedes Creek in September of 2005 (personal communication, January 3, 2007). He also said that sometimes in the dry season he noted water flowing at the Corralitos Creek at Pista Lane /7226 Freedom Blvd. sampling location (CORRA 23). Alford found this unusual because he typically noted that Corralitos Creek was dry in that area during the dry season. Furthermore, Alford also noted the discharge of well water to Corralitos Creek at a downstream location. Staff concluded that occasional illicit discharges occurred in Corralitos and Salsipuedes Creeks.
4.2 Permitted Facilities Not Considered a Source of Indicator Bacteria
4.2.1 Facilities Subject to Discharge Permits
The Water Board issued Waste Discharge Requirements (WDRs), in addition to those issued to the Sanitation Districts, for three facilities in the Corralitos/Salsipuedes watershed. Two facilities had WDRs for food processing wastewater discharges to land: 1) Ariel Mushroom Farms, and 2) Rider and Sons. A third facility, Monte Vista Christian School, had a WDR for onsite wastewater discharges to land. These facilities were authorized to discharge treated wastewater to land. It is assumed that such discharges were likely to percolate to groundwater after being filtered by soil. Staff discussed the conditions of these facilities and their permit compliance with Senior Water Board staff and concluded that they were not a source of FIB in the Creeks for the following reasons. At the time of their most recent annual inspection, the berms surrounding the wastewater ponds at all three facilities were functioning and in good condition with no signs of overflow. The wastewater from Rider and Sons and Aerial Mushroom Farms was not considered a source of fecal coliform because the two facilities process fruit and mushrooms. Furthermore, none of the facilities discharged to surface waters.
Draft Project Report - Corralitos Creek Fecal coliform TMDL March 2009
45
4.3 Source Analysis Conclusions
Staff identified the source organisms and source categories that staff concluded as likely having contributed to the fecal coliform impairment in the reaches identified in Figure 1-2 (Table 4-1). Staff estimated the relative order of sources that contributed FIB to the Creeks. The sources are ranked in Table 4-1 beginning with the largest source first. The relative order was a staff estimate only. Staff noted that there were uncertainties associated with such estimates. For example, staff cannot be certain of the magnitude and location of private lateral leaks.
Table 4-1 Corralitos/Salsipuedes Watershed Indicator Source Organisms and Source Categories
Source Organism Source Category
Examples include: dog, cat, raccoon, skunk,
opossum, bird (including fowl), and human
Storm drain discharges (including controllable wildlife sources, as defined in Section 4.1.1.2 Controllable Wildlife
Waste and Transport Mechanisms) to municipally owned and operated storm sewer systems
required to be covered by an NPDES Permit WQ Order No. 2003-0005-DWQ (MS4s)
Human Homeless person/encampments discharge
(not regulated by a permit for storm water discharges)
Examples include: cat and dog
Pet waste (not regulated by a permit for storm water discharges)
Examples include: horse, goat, emu, and
chicken Farm animal and livestock discharges
Human Onsite wastewater system discharges
Human Sanitary sewer collection system
spills and leaks (required to be covered by WDR Order No. R3-2003-0041)
Human Private laterals connected to municipal sanitary
Natural sources (as defined in Section 4.1.8 Natural Sources)
Draft Project Report - Corralitos Creek Fecal coliform TMDL March 2009
46
Human (unknown) Illicit discharges (as defined in Section 4.1.9 Other Sources Considered)
Staff based the order on the information in Sections 3 Data Analysis and 4 Source Analysis of this Report. As stated previously, staff used water quality data, discharger data and reports, land use data, ribotyping results from similar watersheds, field reconnaissance work, and conversations with County, City, and Water Board staff to complete the source analysis conclusions. Staff concluded it was difficult to prioritize sources since there were so many variables affecting any one source in the watershed. Storm drain discharges (a point source) likely contributed the most FIB to Corralitos and Salsipuedes Creeks. Urban, low intensity residential, and agricultural (irrigated row crops) land uses were the dominant land uses in the impaired reach. This is supported by field reconnaissance and the land use map (Figure 2-1). As stated above, Water Board staff does not have reason to believe that agricultural land use was a source of FIB in the Creeks. Thus, the greatest land uses draining to the impaired reach were urban and low intensity residential. Sources of surface water FIB such as natural sources and anthropogenic sources (dogs, cats, humans, and controllable wildlife as defined in Section 4.1.1.2 Controllable Wildlife Waste and Transport Mechanisms), also identified in ribotyping analysis for the Soquel Lagoon (Central Coast Regional Water Quality Control Board, 2006), live and defecate in urban areas. There was a direct connection between these sources and the Creeks via storm water and other sources of water that flow to storm drains from impervious urban and low intensity residential areas. Staff concluded that urban storm water was the largest source of FIB in the Creeks because storm water drained from one of the largest land uses (low intensity residential and urban) upstream of the impaired reach. Staff concluded controllable wildlife sources were also a source of FIB to Corralitos and Salsipuedes Creeks. Bacteria indicators from this nonpoint and point source ranked similarly to the contribution from storm water because controllable wildlife occurred in similar areas as storm water (within urban and low intensity residential land uses) and storm water transported some of the waste from these sources to surface waters. Additionally, the Creeks attracted controllable wildlife who defecated directly into the Creek systems. Homeless persons in areas not drained by MS4s lived within riparian areas in the Corralitos/Salsipuedes watershed. Based on the information gathered for this Report staff concluded homeless persons, a nonpoint source, also contributed a considerable amount of FIB. Staff considered FIB contributions from homeless persons secondary to storm drain discharges and controllable wildlife sources. County staff located homeless persons in several locations of the Creeks. Staff
Draft Project Report - Corralitos Creek Fecal coliform TMDL March 2009
47
concluded homeless persons existed in a smaller area than urban land use; however, they contributed FIB directly to the Creeks because they lived near it and defecated in it. Staff concluded pet waste (a nonpoint source) in areas that do no drain to MS4s ranks similar to homeless waste because pet waste was also a direct contribution to surface waters. Since 30 to 40 cats were observed at one time in the Creek system, and no mutt mitts were provided, staff considered pet waste as a prominent source. Researchers working in the watershed observed livestock, a nonpoint source, in Corralitos Creek and staff observed livestock in a pen located at the top of the Creek bank. Staff also observed sporadic livestock operations in proximity to Salsipuedes Creek. Staff concluded that livestock were a slightly less significant source of FIB than pets, since livestock were generally not observed in such large numbers within the Creek system. Staff determined that onsite wastewater systems (a nonpoint source in this case) were a source of FIB that was less significant than livestock. Although both sources occurred near creeks, staff determined that because livestock were sometimes found in the creek and because their feces were deposited directly onto the substrate surface near the creek, onsite systems were a lesser source. Staff found onsite systems to be similar in significance to sanitary sewer systems and laterals. Staff concluded that the sanitary sewer systems were likely one of the least significant sources of FIB in the Creeks. Although the sanitary districts were located within approximately the same land that generated storm water runoff, the storm drain system drained to the Creeks and the collection systems generally did not. The sources above were generally more directly connected to surface waters. Also, most of the impaired reach was located over 0.5 miles from the collection systems. Failure of the collection systems caused wastewater to reach the Creeks, however staff considered it one of the lesser sources. Similar to the sanitary sewer systems, staff considered private laterals one of the lesser contributors of FIB. According to the sanitary districts laterals were known to be leaking, but because of the proximity of the laterals to the creek (similar to the collection system), staff considered them as a lesser source. Natural, or, uncontrollable sources of FIB also existed within the watershed. Staff considered this source the least significant source of fecal coliform in the Creeks. Although natural nonpoint sources probably existed throughout the watershed and used the Creek’s riparian habitat directly, there were likely less of them in the lower watershed where staff observed less riparian habitat and very little open space. There were more pervious surfaces and vegetation to filter FIB in the upper watershed where there was likely more natural uncontrollable wildlife. Staff determined water quality objectives and recommended criteria were met in the upper Corralitos Subwatershed. Therefore, staff concluded that where natural sources
Draft Project Report - Corralitos Creek Fecal coliform TMDL March 2009
48
were most prevalent these sources contributed a load of FIB that by themselves did not exceed water quality standards. Staff concluded that illicit sources contributed fecal coliform to Corralitos and Salsipuedes Creeks. Staff could not identify illicit sources; therefore, staff could not determine where they rank relative to the other fecal coliform sources.
Draft Project Report - Corralitos Creek Fecal coliform TMDL March 2009
49
5 CRITICAL CONDITIONS AND SEASONAL VARIATION
Many factors contributed to the Corralitos/Salsipuedes Creek impairment. These factors included the following: 1) discharge of FIB to waterbodies in the Corralitos/Salsipuedes watershed; 2) stream flow transmission; and 3) survival and possible instream FIB population growth. Staff concluded there are several uncertainties with FIB. Stream flow may serve to either increase or dilute FIB concentrations. Stagnant pools may be areas where FIB concentration increases due to increased reproduction that may be a result of an increase in temperature or lack of circulation (Santa Cruz County, 2006).
5.1 Critical Conditions
Staff speculated that stagnation might be critical to increasing the level of E. coli to exceed recommended water quality criteria during the dry season. E. coli levels were high during the dry season at the Corralitos Creek at Pista Lane /7226 Freedom Blvd. sampling location (CORRA 23). Max Alford, a volunteer helping to address homeless problems for the South Santa Cruz County Sheriff’s Center, noted that although he occasionally observed water in Corralitos Creek in the dry season, the Creek typically dried up in the reach associated with CORRA 23 during this season (personal communication, January 3, 2007). A low flow study on Corralitos Creek upstream of this reach indicated that the Creek dries up somewhere upstream of Varni Road but flow returns to the Creek channel somewhere between Varni Road and Green Valley Road (Northwest Hydraulic Consultants, 2006). CORRA 23 was located in this reach (between Varni Road and Green Valley Road). Water Board staff speculated that the reach between Varni Road and Green Valley Road may have contained low flow areas prior to completely drying. These areas may have increased in temperature due to low flow and lack of circulation, creating an environment conducive to the reproduction of E. coli (Santa Cruz County, 2006) deposited during a historic loading event. Staff determined that the extent to which low flow conditions influenced E. coli concentrations was unknown and thus this was not considered a critical condition.
5.2 Seasonal Variations
Staff analyzed fecal coliform and E. coli data from the impaired reach of Corralitos/Salsipuedes Creek on a seasonal basis. Water Quality data collected from CORRA 23 to just upstream of the Pajaro River suggested that season influenced levels of fecal coliform and E. coli in the watershed. However, staff concluded there was not enough evidence throughout the watershed to say that variation in FIB levels was due to season.
Draft Project Report - Corralitos Creek Fecal coliform TMDL March 2009
50
Water samples collected during the wet season (October through April) from the CCAMP Salsipuedes Creek at Riverside Drive Bridge (305 COR) sampling location exhibited the majority (83 percent) of high levels of fecal coliform in 2005 and 2006 (Table 5-1). The City collected downstream E. coli data during a period of approximately one month during the wet season in 2005. This data exhibited a spike, during which E. coli levels exceeded the recommended geomean water quality criteria for E. coli (126 MPN/100mL) at all five sampling locations (CC1 through CC5; Table 5-2). The spike occurred during a rain event on January 26, 2005. CWC E. coli data collected in 2003 and 2004 at CORRA 23 exhibited high levels (four out of eight or 50 percent) during what is typically the dry season. CORRA 23 was the most upstream sampling location in this study and was approximately 1 mile upstream of the City’s Corralitos Creek at Green Valley Road sampling location (CC1).
Table 5-1 Seasonality of CCAMP fecal coliform data at Salsipuedes Creek at Riverside Drive Bridge (305 COR) sampling location from 2005 to 2006
Date Fecal coliform MPN/100 mL
Wet or Dry Season
1/24/05 2400 Wet
2/22/05 300 Wet
3/23/05 2400 Wet
4/19/05 30 Wet
5/17/05 80 Dry
6/14/05 220 Dry
7/19/05 240 Dry
8/17/05 300 Dry
9/13/05 500 Dry
10/12/05 110 Wet
11/9/05 300 Wet
12/6/05 500 Wet
1/10/06 2300 Wet
2/21/06 80 Wet
3/14/06 3000 Wet
Note: Shaded rows indicate samples that exceeded the maximum fecal coliform water quality objective.
Draft Project Report - Corralitos Creek Fecal coliform TMDL March 2009
51
Table 5-2 Seasonality of the City’s E. coli data at downstream sampling locations collected during the wet season
Date Sampling Location
E. coli MPN/100 mL
1/4/2005 CC-1 55
1/12/2005 CC-1 38
1/19/2005 CC-1 39
1/26/2005 CC-1 3448
2/2/2005 CC-1 215
2/9/2005 CC-1 85
1/4/2005 CC-2 64
1/12/2005 CC-2 75
1/19/2005 CC-2 64
1/26/2005 CC-2 2909
2/2/2005 CC-2 69
2/9/2005 CC-2 110
1/4/2005 CC-3 109
1/12/2005 CC-3 58
1/19/2005 CC-3 81
1/26/2005 CC-3 1956
2/2/2005 CC-3 91
2/9/2005 CC-3 92
1/4/2005 SC-4 234
1/12/2005 SC-4 171
1/19/2005 SC-4 39
1/26/2005 SC-4 2723
2/2/2005 SC-4 144
2/9/2005 SC-4 646
1/4/2005 SC-5 203
1/12/2005 SC-5 226
1/19/2005 SC-5 53
1/26/2005 SC-5 4106
2/2/2005 SC-5 154
2/9/2005 SC-5 621
Shaded rows indicate rain event during sampling on January 26, 2005.
Draft Project Report - Corralitos Creek Fecal coliform TMDL March 2009
52
5.2.1 Seasonal Variations Conclusion
Two groups of data suggested a seasonal component in the sources of fecal coliform and E. coli. Levels of E. coli exceeded recommended water quality criteria at several locations within an approximate four mile reach in the City’s downstream data set from 2005 that bracketed a rain event. E. coli levels were low until the rain event, spiked during the event, and generally decreased again after the rain event within the sample period. The data is strong in suggesting rainfall had an influence on fecal coliform concentration in the Creeks because on the day the rain fell the concentrations were high. However, this study took place during only one season, the wet season. Therefore staff cannot necessarily conclude that season had an influence since there is no dry season data with which to compare this data. However, based on this study, rainfall had an influence and rainfall in this geographic area typically occurred during the wet season. CCAMP’s data set included monthly monitoring samples from January 2005 to March 2006. Since CCAMP collected the majority of samples with high levels during the wet season staff concluded that it was possible this season and its associated rainfall influenced the levels of fecal coliform in Salsipuedes Creek. However, because the sample set generally spanned only one year, staff could not definitively conclude that season had an affect on levels of fecal coliform in Salsipuedes Creek. Although, the wet season seemed to influence water quality within one reach, and the dry season in another, seasonality was not obvious enough to support the TMDLS in one season or the other. Therefore, the TMDLS and the allocations in Sections 8.1 TMDLs and 8.2 Wasteload and Load Allocations of this Report apply year round. Strategies to reduce FIB loading in the wet season (described in Section 10 Implementation Plan) also apply in the dry season.
Draft Project Report - Corralitos Creek Fecal coliform TMDL March 2009
53
6 NUMERIC TARGET
The Basin Plan contains fecal coliform water quality objectives. These water quality objectives are in place to protect the water contact recreational beneficial use. The numeric target used to develop the TMDLs for Corralitos and Salsipuedes Creeks is:
Fecal coliform concentration, based on a minimum of not less than five samples for any 30-day period, shall not exceed a log mean of 200 MPN per 100 mL, nor shall more than 10 percent of samples collected during any 30-day period exceed 400 MPN per 100 mL.
If responsible parties demonstrate that controllable sources of fecal coliform are not contributing to exceedance of water quality objectives in receiving waters when all control measures are in place, and fecal coliform levels remain high, staff may conduct investigations (e.g., genetic studies to isolate sources or other appropriate monitoring) to determine if the high levels of fecal coliform are due to uncontrollable sources. If this is the case, staff may re-evaluate the targets and allocations. For example, staff may propose the approval of a site-specific objective by the Water Board. Staff will base the site-specific objective on evidence that natural uncontrollable sources alone were the cause of exceedances of the Basin Plan water quality objective for fecal coliform.
7 LINKAGE ANALYSIS
The goal of the linkage analysis is to establish a link between pollutant loads and resulting water quality. This, in turn, supports that the loading capacity specified in the TMDLs will result in attaining the water quality objectives. For these TMDLs, staff determined this link is established because the numeric target concentrations are the same as the water quality objectives (and TMDLs), expressed as concentrations. Staff identified sources of FIB that caused the elevated concentrations of FIB in the receiving waterbodies. Therefore, staff concluded reductions in FIB loading from these sources should cause a reduction in the measured fecal coliform concentrations. The numeric targets are protective of the recreational beneficial use. Hence, staff concluded the TMDLs define appropriate water quality.
Draft Project Report - Corralitos Creek Fecal coliform TMDL March 2009
54
8 TMDL CALCULATION AND ALLOCATIONS
8.1 TMDLs
A TMDL is the pollutant loading capacity that a water body can accept while protecting beneficial uses. Usually, TMDLs are expressed as loads (mass of pollutant calculated from concentration multiplied by the volumetric flow rate), but in the case of FIB, it is more logical for TMDLs to be based on concentration. TMDLs can be expressed in terms of either mass per time, toxicity, or other appropriate measure [40 CFR §130.2(I)]. Concentration based TMDLs make more sense in this situation because the public health risks associated with recreating in contaminated waters scales with organism concentration, and FIB are not readily controlled on a mass basis. Therefore, staff is proposing concentration-based TMDLs for FIB in Corralitos and Salsipuedes Creeks. The TMDLs for all impaired waters of Corralitos and Salsipuedes Creeks are concentration-based TMDLs applicable to each day of all seasons equal to the following: Fecal coliform concentration, based on a minimum of not less than five samples for any 30-day period, shall not exceed a log mean of 200 MPN per 100 mL, nor shall more than 10 percent of samples collected during any 30-day period exceed 400 MPN per 100 mL.
Draft Project Report - Corralitos Creek Fecal coliform TMDL March 2009
55
8.2 Wasteload and Load Allocations
The allocations for each non-natural (controllable) source and corresponding responsible party are equal to the numeric targets shown in Section 6 Numeric Target. The allocations and responsible parties are listed in Table 8-1. The allocations are receiving water allocations applicable to all responsible parties. For all sources not containing human fecal material the allocation is:
Fecal coliform concentration, based on a minimum of not less than five samples for any 30-day period, shall not exceed a log mean of 200 MPN per 100 mL, nor shall more than 10 percent of samples collected during any 30-day period exceed 400 MPN per 100 mL.
For all sources containing human fecal material the allocation is
Fecal coliform concentration shall not exceed zero MPN per 100mL.
The allocation for natural sources is also equal to the TMDL concentrations in Table 8-1. The parties responsible for the allocation to non-natural (controllable) sources are not responsible for the allocation to natural sources. Although responsibility cannot be assigned to natural sources, they contributed to fecal coliform in the Creeks and thus staff assigned an allocation to them. There is no evidence that leads staff to conclude that natural sources alone caused impairment. Staff will evaluate data collected through implementation of these TMDLs and the Regional Board Ambient Monitoring Program during TMDL compliance to check if those assumptions are valid.
Draft Project Report - Corralitos Creek Fecal coliform TMDL March 2009
56
Table 8-1 Allocations and Responsible Parties
Waterbody Assigned Allocation
Responsible Party (Source Organism or Source
Category)
Receiving Water Fecal Coliform
Allocation
WASTE LOAD ALLOCATIONS
Corralitos1 and
Salsipuedes Creeks2
Santa Cruz County and City of Watsonville
(Storm drain discharges to municipally owned and operated storm sewer
systems required to be covered by an NPDES permit WQ Order No. 2003-
0005-DWQ (MS4s))
Wasteload Allocation 1
Corralitos1 and
Salsipuedes Creeks2
Freedom County Sanitation District (Corralitos Creek only) and
Salsipuedes Sanitary District (Salsipuedes Creek only)
(Sanitary sewer collection system spills and leaks required to be covered
by WDR Order No. R3-2003-0041)
Wasteload Allocation 2
Corralitos1 and
Salsipuedes Creeks2
Owners of private sewer laterals (Private sewer laterals connected to municipal sanitary sewer collection
system)
Wasteload Allocation 2
LOAD ALLOCATIONS
Corralitos1 and
Salsipuedes Creeks2
Owners and/or operators of land that have homeless persons/encampments
(Discharges from homeless persons/encampments (not regulated
by a permit for storm water discharges))
Load Allocation 2
Corralitos1 and
Salsipuedes Creeks2
Owners/operators of land used for/containing pets
(Pet waste not regulated by a permit for storm water discharges)
Load Allocation 1
Corralitos1 and
Salsipuedes Creeks2
Owners of land used for/containing farm animals and livestock
(Farm animals and livestock waste discharges)
Load Allocation 1
Salsipuedes Creek (upstream of confluence with Corralitos
Creek)
Owners of onsite wastewater systems whose systems are within
a specified area3
(Onsite wastewater system discharges)
Load Allocation 2
Corralitos1 and
Salsipuedes Creeks2
Natural sources Load Allocation 1
Wasteload/Load Allocation 1: Fecal coliform concentration, based on a minimum of not less than five samples for any 30-day period, shall not exceed a log mean of 200 MPN/100mL, nor shall more than ten percent of total samples during any 30-day period exceed 400 MPN/100 mL.
Wasteload/Load Allocation 2: Allocation of zero; no loading allowed from this source.
1 All reaches of Corralitos Creek downstream of Browns Valley Bridge
2 All reaches of Salsipuedes Creek
3 The specified area is within the boundaries of State Highway 152 to the southeast, Foothill Road to the
northeast (excluding assessor parcel numbers 05155107 and 05155106), Salsipuedes Creek to the northwest, and up to, but not including The County Fairgrounds to the southwest.
Draft Project Report - Corralitos Creek Fecal coliform TMDL March 2009
57
If responsible parties demonstrate that controllable sources of FIB are not contributing to exceedance of water quality objectives in receiving waters when all source control measures are in place, and FIB levels remain high, staff may conduct investigations (e.g., genetic studies to isolate sources or other appropriate monitoring) to determine if the high level of FIB is due to natural uncontrollable sources. If this is the case, staff will consider re-evaluating the targets and allocations. For example, staff may propose the Water Board approve a site-specific objective. Staff will base the site-specific objective on evidence that natural uncontrollable sources alone were the cause of exceedances of the Basin Plan water quality objective for fecal coliform.
8.3 Margin of Safety
These TMDLs require a margin of safety component that accounts for the uncertainty about the relationship between the pollutant loads and the quality of the receiving water (CWA 303(d) (1) (C)). For FIB in Corralitos/Salsipuedes Creek, staff established a margin of safety implicitly through the use of protective numeric targets based on approved water quality objectives (approved by the USEPA). The protective numeric targets are, in this case, the numeric water quality objectives protective of the beneficial uses in Corralitos and Salsipuedes Creeks. The fecal coliform TMDLs for the Corralitos/Salsipuedes Creek watershed are set equal to the water quality objective for water contact recreation. The Central Coast Region Water Quality Control Plan states that, “controllable water quality shall conform to the water quality objectives. When other conditions cause degradation of water quality beyond the levels or limits established as water quality objectives, controllable conditions shall not cause further degradation of water quality” (Basin Plan, p. III-2). Because staff set the allocations for controllable sources at the water quality objective, if achieved, these allocations will by definition achieve the water quality objectives for the receiving water. Thus, in these TMDLs there is no uncertainty that controlling the load from controlled sources will positively affect water quality by reducing the FIB contribution. However, in certain locations there is a possibility that natural, or uncontrollable, sources occur at levels exceeding water quality objectives. And while it is controllable water quality conditions (“actions or circumstances resulting from man’s activities” (Basin Plan, p. III-2)) that must conform to water quality objectives, receiving water quality contains discharge from both controllable and natural sources. The ability to differentiate the controllable from the natural sources is the chief uncertainty in these TMDLs.
Staff conservatively assigned allocations to onsite wastewater systems. Although staff did not have definitive evidence linking FIB sources from onsite wastewater systems to surface waters, staff conservatively concluded that onsite wastewater systems were a source of FIB.
Draft Project Report - Corralitos Creek Fecal coliform TMDL March 2009
58
9 PUBLIC PARTICIPATION
Staff communicated with personnel from the County of Santa Cruz, City of Watsonville, Salsipuedes and Freedom County Sanitation Districts, Coastal Watershed Council, the Santa Cruz County Resource Conservation District, the Santa Cruz County Agricultural Commissioner’s Office, California Cattlemen’s Association, Santa Cruz County Horsemen’s Association, Santa Cruz County Farm Bureau, Community Alliance of Family Farmers, University of California Cooperative Extension, and Organic Materials Review Institute. Water Board staff created a stakeholder group by contacting the City of Watsonville, County of Santa Cruz, resource conservation organizations, and watershed working groups. Staff also gathered what they thought were the appropriate names from the Water Board’s Interested Parties List for the Pajaro Watershed (of which Corralitos is a subwatershed). Additionally, staff solicited additional names of interested parties from all of the above named groups and continues to add names to the stakeholder list if they, Water Board staff communicated with stakeholders, August 3, 2004, through a conference call regarding the “Proposition 13 Grant” (from the State pursuant to the Costa-Machado Water Act of 2000). During the call, staff and stakeholders discussed current water quality monitoring efforts throughout the County of Santa Cruz including those in the Corralitos/Salsipuedes Creek watershed. They also discussed new sites that should be sampled in this watershed. Staff also met with City of Watsonville staff to discuss the possibility of future City sampling on Corralitos Creek on August 19, 2004. Water Board staff attended a Watershed Assessment and Enhancement Planning Meeting with stakeholders on March 9, 2006 led by Donna Bradford of Santa Cruz County. The purpose of the meeting was to review existing information regarding data collection, water diversions, and current projects to improve water quality in Corralitos and Browns Creeks. At a public meeting on June 26, 2006, Water Board staff presented Preliminary Project Report findings. Water Board staff incorporated public comments received at this meeting into this document where appropriate. Staff also scoped issues pursuant to the California Environmental Quality Act at this June 26 meeting. Staff will prepare environmental documents indicating any potential environmental impacts and considering alternative allocations schemes or implementation strategies prior to soliciting formal public comments on these TMDLs and implementation plan. Staff also developed cost estimates for the reasonably foreseeable methods of compliance with the implementation plan proposed to achieve the allocations. Staff circulated the revised Draft Project Report for comments from the State Board Basin Planning Unit, State Scientific Peer Review and USEPA staff. Water board staff considered comments received from these reviewers while preparing this Draft
Draft Project Report - Corralitos Creek Fecal coliform TMDL March 2009
59
Final Project Report. This Draft Final Project Report and other related Basin Plan Amendment Documents will be posted for a formal 45-day public review and comment period. Staff will incorporate public comments received during this time into the final project report. Staff is currently scheduled to present this project to the Central Coast Water Board at a public meeting in March 2009.
Draft Project Report - Corralitos Creek Fecal coliform TMDL March 2009
60
10 IMPLEMENTATION PLAN
10.1 Introduction
The purpose of the Implementation Plan is to describe the steps necessary to reduce fecal coliform loads and to achieve these TMDLs. The Implementation Plan identifies the following: 1) actions expected to reduce fecal coliform loading, 2) parties responsible for taking these actions, 3) regulatory mechanisms by which the Water Board will assure these actions are taken, 4) reporting and evaluation requirements that will indicate progress toward completing the actions, 5) a timeline for initiation and completion of implementation actions, and 6) a cost estimate for the actions. All actions proposed utilize either: 1) mechanisms that are already required by the Central Coast Water Board, or 2) two Basin Plan prohibitions (Domestic Animal Waste Discharge Prohibition and Human Fecal Material Discharge Prohibition). Staff is recommending using the two prohibitions for human fecal material and domestic animal waste because they are the appropriate administrative authority to address these sources of waste discharge consistent with the State Water Resources Control Board’s Nonpoint Source Pollution Control policy.
10.2 Implementation Actions
Staff concluded the following proposed actions are necessary for Corralitos and Salsipuedes Creeks to attain fecal coliform water quality standards. Staff presented the actions associated with the corresponding source. 10.2.1 Storm Drain Discharges to Municipally Owned and Operated
Storm Sewer Systems Required to be Covered by an NPDES Permit (MS4s)
The Central Coast Water Board will address fecal indicator bacteria (FIB), e.g., fecal coliform and/or other indicators of pathogens, discharged from the County of Santa Cruz’s and City of Watsonville’s municipal separate storm sewer system by regulating the County of Santa Cruz and City of Watsonville under the provisions of the State Water Resource Control Board’s General Permit for the Discharges of Storm Water from Small Municipal Separate Storm Sewer Systems (General Permit) (NPDES No. CAS000004). The proposed enrollment date for the County of Santa Cruz and City of Watsonville under the General Permit as a small municipal separate storm sewer system (MS4) is March 2009. As enrollees the County of Santa Cruz and City of Watsonville must develop and implement a Storm Water Management Plan (SWMP) that controls urban runoff discharges into and from its MS4. To address the County of Santa Cruz’s and City of Watsonville’s TMDL wasteload allocation, the Central Coast Water Board will require the County of Santa Cruz and City of Watsonville to specifically target FIB in urban runoff through incorporation of a Wasteload Allocation Attainment Plan in its SWMP.
Draft Project Report - Corralitos Creek Fecal coliform TMDL March 2009
61
The Central Coast Water Board will require that the Wasteload Allocation Attainment Plan be a thorough plan designed to guide the implementation of activities that will achieve TMDL wasteload allocations. The required principle components of the Wasteload Allocation Attainment Plans are outlined below.
1. A detailed description of a strategy that will be used to guide BMP selection, assessment, and implementation, to ensure that BMPs implemented will be effective at abating pollutant sources, reducing pollutant discharges, and achieving TMDL wasteload allocations.
2. Identification of sources of the impairment within the municipality’s jurisdiction, including specific information on various source locations and their magnitude within the jurisdiction.
3. Prioritization of sources within the jurisdiction, based on suspected contribution to the impairment, ability to control the source, and other pertinent factors.
4. Identification of BMPs that will address the sources of impairing pollutants and reduce the discharge of impairing pollutants.
5. Prioritization of BMPs, based on suspected effectiveness at abating sources and reducing impairing pollutant discharges, as well as other pertinent factors.
6. Identification of BMPs to be implemented, including an implementation schedule. For each BMP, identify any milestones to be used for tracking implementation, as well as any measurable goals to be used to assess implementation efforts. Expected BMP implementation for the future implementation years should be included to the extent possible, with the understanding that future BMP implementation plans may change as new information is obtained.1
7. An analysis exhibiting the connection between BMP implementation and TMDL wasteload allocation attainment, based on the expected wasteload reductions attributable to the BMPs to be implemented.
8. A detailed description of a monitoring program to be implemented to assess discharge and receiving water quality and BMP effectiveness, including a schedule for implementation of the monitoring program. At a minimum, the water quality monitoring program should be consistent with any monitoring program information included in the TMDL documentation.
9. A reporting program that includes evaluation as to whether current best management practices are progressing toward achieving the wasteload allocations by thirteen years after the TMDLs are approved by OAL.
10. A detailed description of how BMP and plan effectiveness will be assessed. The description should incorporate the assessment methods described in the California Stormwater Quality Association’s Municipal Stormwater Program Effectiveness Assessment Guide.
11. A detailed description of how the plan will be modified to improve upon BMPs determined to be ineffective during the effectiveness assessment.
1 Municipalities currently implementing programs to attain wasteload allocations are encouraged to
build upon existing BMPs, milestones, and time-schedules.
Draft Project Report - Corralitos Creek Fecal coliform TMDL March 2009
62
12. A detailed description of information to be included in annual reports.2 13. A detailed description of how the municipality will collaborate with other
agencies, stakeholders, and the public to develop and implement the Wasteload Allocation Attainment Plan.
14. Any other items identified by TMDL Project Reports or Resolutions or currently being implemented to address TMDL provisions.
The Central Coast Water Board will require that the Wasteload Allocation Attainment Plan be submitted at one of the following milestones, whichever occurs first:
1. Within one year of approval of the TMDLs by the Office of Administrative Law; 2. When required by any other Water Board-issued storm water requirements
(e.g., when the Phase II Municipal Storm Water Permit is renewed). For an MS4 entity that is enrolled under the General Permit at the time of Wasteload Allocation Attainment Plan submittal, the Wasteload Allocation Attainment Plan must be incorporated into the SWMP when it is submitted. For an MS4 entity that is not enrolled under the General Permit at the time of Wasteload Allocation Attainment Plan submittal, the Wasteload Allocation Attainment Plan must be incorporated into the SWMP when the SWMP is approved by the Central Coast Water Board. The Executive Officer or the Central Coast Water Board will require information that demonstrates implementation of the actions described above, pursuant to applicable sections of the California Water Code and/or pursuant to authorities provided in the General Permit for storm water discharges. Recommended Storm Water Pollution Prevention Measures Staff developed the following general recommendations for measures the County of Santa Cruz and City of Watsonville can use to address discharges of runoff that may collect accumulated FIB while traveling to storm drains and creeks.
1. Eliminate over watering and runoff of irrigation water into the street; 2. Wash cars at carwashes or locations that will not run into the street; 3. Discharge wash water from carpet cleaning, mop buckets, floor mat
washing, etc. to the sanitary sewer; 4. Clean up spills with mops or absorbent material rather than washing spills
into a gutter or storm drain inlet; 5. Provide education regarding preventing discharges to storm drains; 6. Maintain a street sweeping program; 7. Regularly clean storm drains to remove silt and organic material
accumulations, particularly before the first storm of the season.
2 Wasteload Allocation Attainment Plans, annual reports, and related documents are expected to be
used by Water Board staff to assess TMDL implementation (e.g., TMDL Triennial Reviews).
Draft Project Report - Corralitos Creek Fecal coliform TMDL March 2009
63
Additional recommendations that staff developed for specific FIB sources: Pet Wastes The County of Santa Cruz has an ordinance enforcing pet waste pick-up. While these ordinances are commonly enforced in public places, pet waste, including waste from cats, on a pet owner’s property or residence may also be at risk of entering waterbodies (e.g. backyards abutting waterways, or defecation directly in waterbody) if not disposed of properly. Therefore, the County of Santa Cruz and City of Watsonville should undertake additional measures to educate residents and homeowners whose properties abut riparian areas and waterbodies regarding the vulnerability of these areas to pollution from domestic dog, cat, and other pet waste. Dumpster Leachate and Controllable Bird, Rodent, and Other Wildlife Waste Staff proposes the County of Santa Cruz and City of Watsonville include management practices that specifically address dumpsters/receptacles serving restaurants or other facilities within the County’s and City’s jurisdiction to eliminate discharge leachate. Additionally, the County and City should consider ways to eliminate other controllable sources from rodents, birds, or other wildlife. For example, they should require that dumpsters always be covered and be replaced when leaks occur. Private Laterals The County of Santa Cruz and City of Watsonville should evaluate the contributions of FIB from private laterals and develop appropriate measures to reduce FIB loading from private laterals. Public Education The County of Santa Cruz and City of Watsonville should identify how they will educate the public, what best management practices they will use to educate the public, and goals for the public education and outreach program. The County and City should specifically target education to landowners regarding management measures to minimize leaks from private laterals, onsite wastewater systems and homeless encampment discharges. New Development The County of Santa Cruz and City of Watsonville should develop and implement low impact development principles and practices for new and redevelopment to minimize and prevent addition of new FIB sources.
The Policy for Implementation and Enforcement of the Nonpoint Source Pollution Control Program requires the Central Coast Water Board to regulate all nonpoint sources (NPS) of pollution using the administrative permitting authorities provided by
Draft Project Report - Corralitos Creek Fecal coliform TMDL March 2009
64
the Porter-Cologne Water Quality Control Act. The permitting authorities include waste discharge requirements (WDR), waivers of WDR, and prohibitions. The Central Coast Water Board will use the Human Fecal Material Discharge Prohibition to address sources of human fecal material. Owners of land that contains homeless persons and/or homeless encampments in the Corralitos/Salsipuedes Creeks watershed must comply with the Human Fecal Material Discharge Prohibition. Owners of land with homeless persons must demonstrate to the satisfaction of the Executive Officer or the Water Board that they are in compliance with the Human Fecal Material Discharge Prohibition; compliance with the Human Fecal Material Discharge Prohibition implies compliance with the load allocation for these TMDLs. Within three years of approval of these TMDLs by the Office of Administrative Law, the Executive Officer will notify owners of lands containing homeless persons of the requirement to comply with the Human Fecal Material Discharge Prohibition. In his notification, the Executive Officer will also describe owner’s/operator’s options for demonstrating compliance with the Human Fecal Material Discharge Prohibition; pursuant to California Water Code 13267 and within six months of the notification by the Executive Officer, owner/operators will be required to submit the following for approval by the Executive Officer or the Water Board:
1) Clear evidence that the owner/operator is and will continue to be in compliance with the Human Fecal Material Discharge Prohibition; clear evidence could be documentation submitted by the owner to the Executive Officer validating current and continued compliance with the Prohibition, or A plan for compliance with the Human Fecal Material Discharge Prohibition. Such a plan must include a list of specific management practices that will be implemented to control discharges containing fecal material from homeless persons. The Plan must also describe how implementing the identified management practices are likely to progressively achieve the load allocation for homeless persons, with the ultimate goal achieving the load allocation no later than three years from the date of the Executive Officer’s notification to the owner requiring compliance. The plan must include monitoring and reporting to the Central Coast Water Board, demonstrating the progress towards achieving load allocations for discharges from homeless persons, and self-assessment of this progress, or
2) Submittal of a Report of Waste Discharge pursuant to California Water Code Section 13260 (as an application for waste discharge requirements; WDRs).
10.2.3 Domestic Animal Waste Discharges (Not Regulated by a
Permit for Storm Water Discharges)
The Policy for Implementation and Enforcement of the Nonpoint Source Pollution Control Program requires the Central Coast Water Board to regulate all nonpoint sources (NPS) of pollution using the administrative permitting authorities provided by
Draft Project Report - Corralitos Creek Fecal coliform TMDL March 2009
65
the Porter-Cologne Water Quality Control Act. These include waste discharge requirements (WDR), waivers of WDR, and prohibitions. The Central Coast Water Board will use the Domestic Animal Waste Discharge Prohibition to address sources of fecal material from domestic animals. Owners and/or operators of lands used for/containing domestic animals in the Corralitos/Salsipuedes Creeks watershed must comply with the Domestic Animal Waste Discharge Prohibition; compliance with the Domestic Animal Waste Discharge Prohibition implies compliance with the load allocation for these TMDLs. Within three years of approval of these TMDLs by the Office of Administrative Law, the Executive Officer will notify owners and/or operators of lands used for/containing domestic animals of the requirement to comply with the Domestic Animal Waste Discharge Prohibition. In his notification, the Executive Officer will also describe the owner’s/operator’s of lands containing domestic animals options for demonstrating compliance with the Domestic Animal Waste Discharge Prohibition; pursuant to California Water Code section 13267 and within six months of the notification by the Executive Officer, owners/operators of lands containing domestic animals will be required to submit the following for approval by the Executive Officer or the Water Board:
1) Clear evidence that the owner/operator of lands containing domestic animals is and will continue to be in compliance with the Domestic Animal Waste Discharge Prohibition; clear evidence could be documentation submitted by the owner/operator to the Executive Officer validating current and continued compliance with the Prohibition, or
2) A plan for compliance with the Domestic Animal Waste Discharge Prohibition. Such a plan must include a list of specific management practices that will be implemented to control discharges containing fecal material from domestic animals. The plan must also describe how implementing the identified management practices are likely to progressively achieve the load allocations to domestic animals, with the ultimate goal achieving the load allocations no later than thirteen years after Office of Administrative Law approval of these TMDLs. The plan must include monitoring and reporting to the Central Coast Water Board, demonstrating the progress toward achieving load allocations for discharges from domestic animals, and a self-assessment of this progress. The plan may be developed by an individual discharger or by or for a coalition of dischargers in cooperation with a third-party representative, organization, or government agency acting as the agents of owners/operators of lands containing domestic animals, or
3) Submittal of a Report of Waste Discharge pursuant to California Water Code Section 13260 (as an application for waste discharge requirements; WDRs or National Pollutant Discharge Elimination System (NPDES permit).
Draft Project Report - Corralitos Creek Fecal coliform TMDL March 2009
66
10.2.4 Onsite Wastewater System Discharges
The Policy for Implementation and Enforcement of the Nonpoint Source Pollution Control Program requires the Central Coast Water Board to regulate all nonpoint sources (NPS) of pollution using the administrative permitting authorities provided by the Porter-Cologne Water Quality Control Act. These include waste discharge requirements (WDR), waivers of WDR, and prohibitions. The Central Coast Water Board will use the Human Fecal Material Discharge Prohibition to address sources of human fecal material. Owners of onsite wastewater systems within the following described area must comply with the Human Fecal Material Discharge Prohibition. The subject implementation area is within the boundaries of State Highway 152 to the southeast, Foothill Road to the northeast (excluding assessor parcel numbers 05155107 and 05155106), Salsipuedes Creek to the northwest, and up to but not including The County Fairgrounds to the southwest. Owners of onsite wastewater systems must demonstrate to the satisfaction of the Executive Officer or the Water Board that they are in compliance with the Human Fecal Material Discharge Prohibition; compliance with the Human Fecal Material Discharge Prohibition implies compliance with the load allocation for these TMDLs. Within three years of approval of these TMDLs by the Office of Administrative Law, the Executive Officer will notify owners of onsite wastewater systems (owners) in the area described above of the requirement to comply with the Human Fecal Material Discharge Prohibition. In his notification, the Executive Officer will also describe owner’s options for demonstrating compliance with the Human Fecal Material Discharge Prohibition; pursuant to California Water Code 13267 and within six months of the notification by the Executive Officer, owners will be required to submit the following for approval by the Executive Officer or the Water Board:
1) Clear evidence that the owner is and will continue to be in compliance with the Human Fecal Material Discharge Prohibition; clear evidence could be certification by the County of Santa Cruz, or similar, that the owners onsite wastewater system is in compliance with the Human Fecal Material Discharge Prohibition, or
2) A schedule for compliance with the Human Fecal Material Discharge Prohibition. The compliance schedule must include a monitoring and reporting program and milestone dates demonstrating progress towards compliance with the Human Fecal Material Discharge Prohibition, with the ultimate milestone being compliance with the Human Fecal Material Discharge Prohibition no later than three years from the date of the Executive Officer’s notification to the owner requiring compliance, or
3) Submittal of a Report of Waste Discharge pursuant to California Water Code Section 13260 (as an application for waste discharge requirements; WDRs).
4) Clear evidence of current or scheduled compliance with the Human Fecal Material Discharge Prohibition (as described in number-1 and number-2 above, respectively) through the submittal of the required information, e.g. by
Draft Project Report - Corralitos Creek Fecal coliform TMDL March 2009
67
the County of Santa Cruz, acting as the voluntary agents of owners/operators of onsite wastewater systems. Note that an owner of an onsite wastewater system cannot demonstrate compliance with the Human Fecal Material Discharge Prohibition through this option if: 1) the County of Santa Cruz is not their voluntary agent, or 2) if the owner/operator of the private lateral does not choose the County of Santa Cruz as their agent, or, 3) the Executive Officer or Water Board does not approve the evidence submitted by the County of Santa Cruz on behalf of the owners/operators of private laterals.
10.2.5 Sanitary Sewer Collection System Spills and Leaks
The Freedom County Sanitation District (FCSD) and the Salsipuedes Sanitary District (SSD) in the Corralitos/Salsipuedes Creeks watershed must comply with the Human Fecal Material Discharge Prohibition; compliance with the Human Fecal Material Discharge Prohibition implies compliance with their load allocation for these TMDLs. To comply with the Human Fecal Material Discharge Prohibition, the FCSD and the SSD must continue to implement their Collection System Management Plan and Infiltration/Inflow and Spill Prevention Program (herein referred to as the Plan and Program), respectively, as required by Waste Discharge Requirements (WDRs) (Order No. R3-2003-0041). In addition, the FCSD and SSD are also required to improve maintenance of their sewage collection systems, including identification, correction, and prevention of sewage leaks in portions of the collection systems that run through or adjacent to, impaired surface waters within the Corralitos/Salsipuedes Creek Watershed. To this end, within six months following adoption of these TMDLs by the Office of Administrative Law, the Executive Officer will issue a letter pursuant to Section 13267 of the California Water Code requiring: 1) submittal within one-year, a technical report that describes how and when FCSD and SSD will conduct improved collection system maintenance in portions of the collection system most likely to affect impaired surface water bodies, with the end result being compliance with the Human Fecal Material Discharge Prohibition, and 2) stream monitoring for fecal coliform or another fecal indicator bacteria, and reporting of these monitoring activities, and 3) annual reporting of self-assessment as to whether the FCSD and SSD are in compliance with the Human Fecal Material Discharge Prohibition.
10.2.6 Private Sewer Laterals Connected to Municipal Sanitary
Sewer Collection Systems
Individual owners and operators of private laterals to sanitary sewer collection systems are ultimately responsible for maintenance of their private laterals and are, therefore, responsible for complying with the Human Fecal Material Discharge
Draft Project Report - Corralitos Creek Fecal coliform TMDL March 2009
68
Prohibition; compliance with the Human Fecal Material Discharge Prohibition implies compliance with their load allocation for these TMDLs. Within three years of approval of these TMDLs by the Office of Administrative Law, the Executive Officer will notify owners and/or operators of private laterals to sanitary sewer collection systems (owners/operators of private laterals) of the requirement to comply with the Human Fecal Material Discharge Prohibition. In his notification, the Executive Officer will also describe the owner’s/operator’s of private laterals options for demonstrating compliance with the Human Fecal Material Discharge Prohibition; owners/operators of private laterals will be required, pursuant to California Water Code section 13267 and within six months of the notification by the Executive Officer, owners/operators of private laterals will be required to submit the following for approval by the Executive Officer or the Water Board, the following within six months of the notification by the Executive Officer:
1) Clear evidence that the owner/operator of private lateral is and will continue to be in compliance with the Human Fecal Material Discharge Prohibition; clear evidence could be certification by the County of Santa Cruz or City of Watsonville that owner/operator of private lateral is in compliance with the Human Fecal Material Discharge Prohibition, or
2) A schedule for compliance with the Human Fecal Material Discharge Prohibition. The compliance schedule must include a monitoring and reporting program and milestone dates demonstrating progress towards compliance with the Human Fecal Material Discharge Prohibition, with the ultimate milestone being compliance with the Human Fecal Material Discharge Prohibition no later than three years from the date of the Executive Officer’s notification to the owner/operator requiring compliance, or
3) Submittal of a Report of Waste Discharge pursuant to California Water Code Section 13260 (as an application for waste discharge requirements; WDRs or National Pollutant Discharge Elimination System (NPDES permit)), or,
4) Clear evidence of current or scheduled compliance with the Human Fecal Material Discharge Prohibition (as described in number-1 and number-2 above, respectively) through the submittal of the required information by County of Santa Cruz or the City of Watsonville, acting as the voluntary agents of owners/operators of private laterals. Note that an owner/operator of a private lateral cannot demonstrate compliance with the Human Fecal Material Discharge Prohibition through this option if: 1) the County of Santa Cruz or the City of Watsonville is not their voluntary agent, or 2) if the owner/operator of the private lateral does not choose the County of Santa Cruz or the City of Watsonville as their agent, or, 3) the Executive Officer or Water Board does not approve the evidence submitted by the County of Santa Cruz or the City of Watsonville on behalf of the owners/operators of private laterals.
Draft Project Report - Corralitos Creek Fecal coliform TMDL March 2009
69
10.3 Evaluation of Implementation Progress
Every three years, beginning three years after TMDLs are approved by the California Office of Administrative Law, the Central Coast Water Board will perform a review of implementation actions and monitoring results, and evaluations submitted by responsible parties of their progress toward achieving their allocations. The Central Coast Water Board will use annual reports, nonpoint source pollution control implementation programs, evaluations submitted by responsible parties, and other available information to determine progress toward implementing required actions and achieving the allocations and numeric target. The Central Coast Water Board may conclude that ongoing implementation efforts are insufficient to ultimately achieve the allocations and numeric target. If the Central Coast Water Board makes this determination, responsible parties must improve and increase their reporting, monitoring, and/or implementation efforts, as necessary, for their allocations and the numeric target to be achieved. The Central Coast Water Board may conclude, at the time of review, that implementation efforts are expected to result in achieving the allocations and numeric target. In that case, responsible parties must continue to implement existing and anticipated reporting, monitoring, and implementation efforts. Responsible parties will continue monitoring according to this plan for at least three years, at which time the Central Coast Water Board will determine the need for continuing or otherwise modifying the monitoring requirements. Responsible parties may also demonstrate that although water quality objectives are not being achieved in receiving waters, controllable sources of fecal indicator bacteria are not contributing to the exceedance. If this is the case, the Central Coast Water Board may re-evaluate the numeric target and allocations. For example, the Central Coast Water Board may pursue and approve a site-specific objective. The site-specific objective would be based on evidence that natural sources alone were the cause of exceedances of the Basin Plan water quality objective for fecal indicator bacteria. Three-year reviews will continue until the water quality objectives are achieved. The compliance schedule for achieving the TMDLs and numeric target is 13 years after the date of approval by the California Office of Administrative Law. It is essential that the TMDLs are achieved according to this schedule in order for these TMDLs and implementation plan to remain consistent with the timeline for achieving the three measurable goals of the Central Coast Water Board’s Vision of Healthy Functioning Watersheds. The Water Board envisions achieving the three measurable goals by 2025. The Office of Administrative Law may approve these TMDLs within approximately one year after Water Board approval. If the Water Board approves these TMDLs in March of 2009, and the Office of Administrative Law approves them in approximately early 2010, then the TMDLs should be realized by approximately 2023.
Draft Project Report - Corralitos Creek Fecal coliform TMDL March 2009
70
10.4 Economic Considerations
10.4.1 Overview
Porter-Cologne requires that the Water Board take economic considerations, into account when requiring pollution control requirements (Public Resources Code, Section 21159 (a) (3) (c)). The Water Board must analyze what methods are available to achieve compliance and the costs of those methods. Staff identified a variety of costs associated with implementation of these TMDLs. Costs for implementation fall into four broad categories: (1) planning or program development actions, e.g., establishing nonpoint source implementation programs, conducting assessments, etc., (2) implementation of management practices for permanent to semi-permanent features, and 3) TMDL inspections/monitoring; and 4) reporting costs. Water Board staff had difficulty anticipating costs for several reasons. Staff determined that many of the actions, such as review and revision of policies and ordinances by a governmental agency, could incur no significant costs beyond the program budgets of those agencies. However, other actions such as establishing nonpoint source implementation programs and establishing assessment work plans carry discrete costs. Staff determined that cost estimates are further complicated by the fact that some implementation actions are necessitated by other regulatory requirements (e.g., Phase II Storm Water) or are actions anticipated regardless of TMDL adoption. Therefore staff’s assignment of all of these costs to TMDL implementation would be inaccurate. 10.4.2 Cost Estimates
10.4.2.1 Storm Drain Discharges to Municipally Owned and Operated Storm Sewer Systems Required to be Covered by an NPDES Permit (MS4s)
The State Water Resources Control Board adopted an NPDES General Permit for storm water discharge. The General Permit requires smaller State municipal dischargers, such as the County of Santa Cruz and the City of Watsonville, to develop and implement a Storm Water Management Plan (SWMP). As of the date of writing this Report, both the County and City submitted a SWMP for the Water Board’s approval, but the Water Board had not yet approved the SWMPs. Note: Because the County of Santa Cruz and the City of Watsonville are required to develop a SWMP independent of the TMDLs, the below costs would be incurred regardless of the implementation requirements in this project report. Planning or Program Development Actions: Water Board staff estimates no significant costs beyond the local agency program budget.
Draft Project Report - Corralitos Creek Fecal coliform TMDL March 2009
71
Implementation: To implement the requirements of the TMDLs, the Water Board may ask local agencies to develop additional management measures for fecal coliform reduction; identify measurable goals and time schedules for implementation; develop a monitoring program; and assign responsibility for each task. The specifics of the storm water program efforts and corresponding costs will not be known until Water Board adoption of the SWMP occurs. An estimate of the storm water program efforts and their associated costs are provided below. The University of Southern California conducted a survey of NPDES Phase I Storm Water Costs in 2005 (Center for Sustainable Cities, University of Southern California, 2005). The SWMP submitted by the County of Santa Cruz and the City of Watsonville is for Phase II. They determined the cost per California household ranged from $18 to $46. However, these costs were just to keep the existing plan running and did not include start-up costs which may increase the total cost per household. According to storm water unit staff, recently approved Phase II SWMPs in Region Three ranged from $21 to $130 per household. Storm water unit staff reported that the wide range of costs in both cases was based on many factors including the amount of revenue generated by the municipality, the size of the area covered by the SWMP, and because some municipalities did not include the cost of programs such as street sweeping that are already accounted for in other program budgets, while other municipalities did include this cost. It was difficult for staff to estimate the cost of a SWMP for the above reasons. To get a rough idea of how much a SWMP program would cost in the Corralitos watershed, staff calculated an average cost from the range of costs for recently approved Phase II SWMPs in Region Three ($21 in the City of Seaside to $130 in the City of Monterey). Staff calculated an average annual cost of $77 per household. Staff used this cost per household to estimate the cost per year of SWMP implementation in the City of Watsonville and the unincorporated portion of the County of Santa Cruz within the SWMP permit area and within the Corralitos watershed:
City of Watsonville: 11,381 households (U.S. Census Bureau, 2007) x $77 (cost per household) = $876,337 per year Unincorporated portion of the County of Santa Cruz within the SWMP permit area and within the Corralitos watershed: 1,899 householdsa x $77 (cost per household) = $146,223 per year a Staff calculated this number of households based on estimates of the population of the
approximately four communities north and east of the City of Watsonville. The population of one of the four communities, Corralitos, was 2,431 (Wikipedia, 2006) at the time of the 2000 census. Staff estimated the population of the three other communities (along the north end of Green Valley Road, straddling College Road, and straddling Casserly Road). Staff determined that together the three communities amounted to approximately 2 times the population of Corralitos. Staff used the following equation to calculate the population of the unincorporated portion of the County of Santa Cruz within the SWMP permit area and within the Corralitos watershed: 2,431 (population of Corralitos) x 3 = 7,293.
Draft Project Report - Corralitos Creek Fecal coliform TMDL March 2009
72
Staff assumed there were 3.84 persons per household (U.S. Census Bureau, 2007) and used the following equation to calculate number of households in the same area: 7,293 total persons/3.84 per household = 1,899 households.
Additional implementation measures or management programs may be needed for fecal coliform reductions. Staff does not know the specific measures at this time. However, in the California Regional Water Quality Control Board, San Francisco Bay Region’s Pathogens in the Napa River Watershed Total Maximum Daily Load, June 14, 2006, Marin County estimated additional pathogen-specific measures would result in a two to 15 percent increase to their annual SWMP program budget. Therefore staff estimates the total cost between the following minimum and maximum ranges:
City of Watsonville: $876,337 cost per year x 2% minimum increase = $17,526.74 minimum cost increase per year $876,337 cost per year x 15 % maximum increase = $131,450.55 maximum cost increase per year Unincorporated portion of the County of Santa Cruz within the SWMP permit area and within the Corralitos watershed: $146,223 cost per year x 2 % minimum increase = $2924.46 minimum cost increase per year $146,223 cost per year x 15% maximum increase = $21,993 maximum cost increase per year
Inspections/Monitoring: Water Board staff is proposing that municipalities monitor storm drain discharges. The purpose of the monitoring is to determine the effectiveness of management measures. The Water Board will not impose a monitoring requirement of effluent on the County of Santa Cruz or the City of Watsonville. Water Board staff estimated monitoring will cost the County and City approximately $4,400 per year. According to John Ricker County of Santa Cruz Environmental Health Services, the cost of sampling is $40 for sample collection and field analysis plus $20 for each fecal coliform sample (personal communication, September 18, 2007), for a total of $60 per sample. Staff proposed the County and City sample each storm drain 10 times per year. Staff also estimated approximately four storm water sample sites will be analyzed per year. Therefore, staff estimated the total water sampling cost per year at approximately $2,400 ($60/sample x 10 samples x 4 sites). This cost will also be partly shared by the Freedom County Sanitation District who is also responsible for storm water sampling. Water Board staff also assumed County staff resources will cost $200 per sampling day. Therefore total sampling costs per year including staff resources would cost $4,400 ($2,400 + ($200/sampling day x 10 sampling days/year)). Reporting: The County and City- are required to report independent of the TMDLs under Phase II of the municipal SWMP. Therefore, staff did not estimate the costs for reporting.
Draft Project Report - Corralitos Creek Fecal coliform TMDL March 2009
73
10.4.2.2 Homeless Person/Encampment Discharges (Not Regulated by a Permit for Storm Water Discharges)
Planning or Program Development Actions: Staff concluded the approaches used to control homeless encampment waste may range from land owner to land owner and included 1) installing barriers, and 2) participating with local agencies to develop a comprehensive watershed-wide solution. Water Board staff estimated the planning cost for an approach such as installing barriers may require approximately eight hours of land owner time. Landowners may devote more time to comprehensive watershed-wide approaches. Implementation: Landowners will develop the methods used to control these wastes as part of their nonpoint source pollution control implementation program. Options include hiring security to patrol areas used by homeless, maintaining portable toilets, installing fencing and or deterrent landscaping. The web site http://www.security-ess.com/DesignDetail.html indicates the cost of security guards range from $25 - $40 per hour. This service provides guards for a six hour minimum per guard per day. Staff contacted a service that provides portable toilets for $95 per month (staff communication with Ace Portable Services, Santa Cruz, Ca., January 23, 2007). Staff also contacted a service that provides security fences. The cost of a six foot chain link fence with 3 strands of barbed wire on the top is $1,800 per 100 feet or $15,000 per 1,000 feet (staff communication with Affordable Fence Company, Santa Cruz, Ca., January 23, 2007). Inspections/Monitoring: Land owners could utilize various approaches to inspect lands for homeless encampments. Cost is dependant upon whether the land owner inspects their own property or local service companies are hired to provide inspection services. The cost for security guards (above) can be used to estimate this cost. If landowners determine that monitoring is necessary, the estimates included above in Storm Drain Discharges-Private Lateral Upgrade can be used to estimate cost. Reporting: The Water Board will identify properties potentially containing homeless encampments during the implementation phase of these TMDLs. All land owners identified during this phase as having homeless encampments are required to submit triennial reports to the Water Board. All land owners identified shall also submit a report documenting that measures are in place and effectively minimizing discharges or demonstrating that no discharge is occurring from homeless encampments. Water Board staff estimated this report will require approximately eight hours of land owner time.
10.4.2.3 Pet Waste (Not Regulated by a Permit for Storm Water Discharges)
Planning or Program Development Actions: Central Coast Water Board staff estimated no significant costs to plan or develop this implementation requirement.
Draft Project Report - Corralitos Creek Fecal coliform TMDL March 2009
74
Implementation: Staff determined that bags that can be used to pick up waste are available starting at approximately $2.50 to $4.50 per box. The following website sells biodegradable dog waste pickup bags for 3.99 per box of thirty bags: http://www.alphadogtoys.com/biodegradable_dog_waste_bags.html. Plastic bags from grocery stores or other stores that can be reused for picking up waste are typically available at no cost (with a purchase from the store). Inspections/Monitoring: Staff estimated no significant cost for inspections and monitoring of discharge of pet waste because staff concluded this can be easily done by walking the property. The time it takes to inspect the property increases as the property size increases. Reporting: All responsible parties are required to submit triennial reports to the Water Board. All responsible parties shall submit a report documenting that measures are in place and effectively minimizing discharges or demonstrating that no discharge is occurring from pet waste. Water Board staff estimate this report will require approximately three hours or less of land owner time.
10.4.2.4 Onsite System Discharges
Planning or Program Development Actions: Owners of onsite wastewater systems will repair, replace with an alternate system, pump on a consistent basis, or enhance their onsite wastewater systems to control wastes from these sources as part of their Nonpoint Source Implementation Program. Rafael Sanchez, Senior Environmental Specialist, County of Santa Cruz, gave staff the following fee information (personal communication, June 12, 2007): County of Santa Cruz Fees for Onsite System Activities: Standard repaira $861 Standard upgrade $2,049 Enhanced treatment system $2,049 Alternate system repaira $1,187 Alternate system upgrade $2,569 a
Repairs are less expensive because the County subsidizes some of the cost due to the health risk associated
with malfunctioning systems.
Implementation: One method of repair is the installation of an intermittent sand filter. In Santa Cruz County the price to install an intermittent sand filter ranged from approximately $18,000 to $25,000 or more. The cost of replacing a leach line was approximately $5,000 (Repair of Failure/Malfunction Survey, California State University, Chico, January 2003). A-1 Septic Service, Inc. in Santa Cruz County provided information that it is necessary to get a bid from a licensed contractor regarding the type of repair or upgrade that an onsite system requires (personal communication, June 25, 2007). A-1 Septic Service, Inc. said that just like building a house or any other major
Draft Project Report - Corralitos Creek Fecal coliform TMDL March 2009
75
project, there are no set costs because no two jobs are alike. Repairs and upgrades need to be individually bid. A-1 Septic Service, Inc. also estimated pumping for maintenance at a range of $495 to $990 depending on the size of pumping truck that is required. Additional fees may apply (personal communication, June 15, 2007). Service calls are billed at $125/hour, and labor to uncover tanks is billed at $95 to $125/hour. Inspections/Monitoring: A -1 Septic Service, Inc. also estimated the price range for pumping for a real estate inspection: $595 to $1090. If onsite system owners determine that monitoring is necessary the estimates included above in Storm Drain Discharges-Private Lateral Upgrade can be used to estimate the cost. Reporting: Owners of onsite wastewater systems subject to implementation and reporting are within the boundaries of State Highway 152 to the southeast, Foothill Road to the northeast (excluding assessor parcel numbers 05155107 and 05155106), Salsipuedes Creek to the northwest, and up to, but not including The County Fairgrounds to the southwest. The owners of onsite wastewater systems in this area shall submit a report documenting that there are no prohibited discharges originating from the owner’s and/or operator’s onsite system that enter the applicable waters of the State. Water Board staff estimated this report will require approximately eight hours of onsite system owner time.
10.4.2.5 Farm Animals and Livestock Discharges
Planning or Program Development Actions: Staff determined that the cost to develop fecal coliform control measures at these facilities will vary from site to site depending upon constraints present at each site. Water Board staff estimates approximately eight hours is necessary for planning control actions. Program Implementation: Staff concluded there are a variety of methods owners of farm animals and livestock can use to control wastes including livestock exclusion barriers, stables for horses, corrals, and manure bunkers at locations that prevent runoff from entering surface waters. 1. Livestock Exclusion Barriers: According to the USEPA, the cost of permanently excluding livestock from areas where animal waste can impact surface waters ranges from $2,474/mi to $4,015/mi (Guidance Specifying Management Measures for Sources of Nonpoint Pollution in Coastal Waters. 840-B-92-002, United States Environmental Protection Agency, January 1993). 2. Horse Stables: Horses can be boarded at stables. According to the American Miniature Horse Association, miniature horses can be boarded in a professional stable for $50 to $150 per month per horse and full size horses can be boarded for
Draft Project Report - Corralitos Creek Fecal coliform TMDL March 2009
76
$200 to $550 per month per horse. The cost depends on the facilities, pasture, and riding opportunities (http://www.amha.com/MarketTools/Profitibility.html). 3. Corral Cost: According to a Progressive Farmer website, a corral (excluding the head gate) can cost less than $7,000. Gates cost, at the most, between $3,000 and $4,000 (http://www.progressivefarmer.com/farmer/animals/article/0,24672,1113452,00.html). 4. Manure Bunker Costs: Ecology Action has worked with landowners to install manure bunkers. Manure bunkers help prevent storm waters from infiltrating the manure thereby causing runoff of pollutants from the manure. According to Ecology Action, the average cost for constructing a manure bunker on properties in the Aptos Creek watershed was approximately $4000. (Each bunker was constructed on an existing cement slab, or a new one was poured and employed some type of cover - either a permanent roof or a tarp.) The cost of bunker construction varies greatly depending on the size and materials choice. When looking at bunkers for the entire program, costs ranged from $3000 to $15,000 (Reference: E-mail dated 5-1-2007 from Jennifer Harrison of Ecology Action). Inspections/Monitoring: Staff concluded the landowner cost for inspections/monitoring will vary depending upon the elements of the nonpoint source implementation program. The cost could be low if daily property walks occur to assess and prevent discharges. Costs are higher if a landowner performs water quality monitoring. Reporting: Water Board staff estimated it would take approximately eight hours of land owner time to prepare a report to the Water Board. This report is required every three years.
10.4.2.6 Sanitary Sewer Collection System Spills and Leaks
All sanitary sewer activities specified in the Basin Plan amendment are currently required under the existing Water Board permits and corresponding requirements. No new costs are anticipated as a result of these TMDLs.
10.4.2.7 Private Sewer Lateral Upgrade
Implementation: According to the County of Santa Cruz, Environmental Health Service Water Resources Program’s March 2006 Assessment of Sources of Bacterial Contamination at Santa Cruz County Beaches (Proposition 13 Report) the cost to repair a leaking private lateral is estimated to be $5,000. Inspections/Monitoring: According to the Proposition 13 Report, the cost to test for leaking private laterals is approximately $1,000.
Draft Project Report - Corralitos Creek Fecal coliform TMDL March 2009
77
Reporting: All responsible parties shall submit a report documenting that their private sewer lateral was inspected and/or repaired or replaced and is effectively minimizing fecal coliform discharges. Water Board staff estimated this report will require approximately six hours or less of land owner time.
Draft Project Report - Corralitos Creek Fecal coliform TMDL March 2009
78
11 MONITORING PLAN
11.1 Introduction
The Monitoring Plan outlines the monitoring sites, frequency of monitoring, and parties responsible for monitoring. The monitoring proposed below for complying with the TMDLs is the minimum staff finds is necessary. However, if a change in these requirements is warranted after the TMDLs are approved; the Executive Officer and/or the Central Coast Water Board will require such changes.
11.2 Monitoring Sites, Frequency, and Responsible Parties
The following monitoring plan proposes specific monitoring sites, frequency, and indicators to be monitored. Staff will work with parties responsible for monitoring when the implementation and monitoring phase of the project commences, and will make revisions, if appropriate, to the monitoring plan outlined below. Central Coast Water Board will require the responsible parties to perform fecal coliform monitoring in receiving waters as shown in Table 11-1. Staff also proposes fecal coliform monitoring for storm water. The County of Santa Cruz will develop and propose the monitoring sites for approval by the Executive Officer of the Central Coast Water Board. The purpose of storm drain sampling is to assess the effectiveness of management measures. Storm drain samples will not be used to determine if the TMDL is attained. The Central Coast Water Board will use receiving water samples to determine compliance. Monitoring activities will commence as directed by the Executive Officer of the Central Coast Water Board. Each party responsible for monitoring will be required to provide the data to the Central Coast Water Board. Table 11-1 includes more than one listed responsible party that will conduct monitoring in some locations. This reflects the fact that multiple parties or potential sources of fecal coliform are known and thus multiple parties shall share responsibility for monitoring.
Draft Project Report - Corralitos Creek Fecal coliform TMDL March 2009
79
11.3 Monitoring Sites, Frequency, and Responsible Parties
Table 11-1 Required Monitoring
Responsible Party Monitoring Site Sampling
Period
Number of Samples Per
Sampling Period
Constituent (#/100 mL)
RECEIVING WATER MONITORING
Weekly 1
County of Santa Cruz
Corralitos Creek at Varni Road, upstream
and downstream of storm drain (Two sites)
One month in each of the last three years of
sampling 1
5 Fecal coliform
Weekly 1
City of Watsonville Corralitos Creek
at Pista Lane (One Site)
One month in each of the last three years of
sampling 1
5
Fecal coliform
Weekly 1 Fecal coliform City of Watsonville
(downstream location only), and Freedom County Sanitation District (upstream location
only)
Corralitos Creek at Green Valley Road,
upstream and downstream of storm
drain (Two Sites)
One month in each of the last three years of
sampling 1
5 Fecal coliform
Weekly 1
Salsipuedes Sanitary District
Salsipuedes Creek, downstream of confluence with Corralitos Creek
(One Site)
One month in each of the last three years of
sampling 1
5
Fecal coliform
Weekly 1
Salsipuedes Sanitary District
Salsipuedes Creek at Lakeview Road
(One Site)
One month in each of the last three years of
sampling 1
5
Fecal coliform
Weekly 1
City of Watsonville
Salsipuedes Creek downstream of
Riverside Drive Bridge (One Site)
One month in each of the last three years of
sampling 1
5
Fecal coliform
STORM WATER MONITORING
Dry Season 5 County of Santa Cruz
Storm Drain at Varni Road (One Site) Wet Season 5
Fecal coliform
Draft Project Report - Corralitos Creek Fecal coliform TMDL March 2009
80
Responsible Party Monitoring Site Sampling
Period
Number of Samples Per
Sampling Period
Constituent (#/100 mL)
Dry Season 5 City of Watsonville
and Freedom County Sanitation
District
Storm Drain at Thicket Lane and
Green Valley Road (One Site) Wet Season 5
Fecal coliform
Dry Season 5
City of Watsonville
One Storm Drain (to be determined) that empties into
Salsipuedes Creek near Lakeview Road
(One Site) Wet Season 5
Fecal coliform
Dry Season 5 Fecal coliform
City of Watsonville
One Storm Drain (to be determined)
that empties into
Salsipuedes Creek immediately upstream
of the Pajaro River Confluence (One Site)
Wet Season 5 Fecal coliform
1 Responsible Party must determine which month will produce samples with the best representation of water quality conditions, i.e., not at the end of major storm events, not when Creek is dry.
Where landowners need to demonstrate their activity is not passing fecal material into waters, landowner monitoring for fecal coliform may provide evidence of complying with load allocations. Landowners have the option of performing individual monitoring or participating in a cooperative monitoring program. Individual landowner monitoring can comprise either water quality monitoring or other forms of monitoring (such as a report documenting visual site inspections supported by site photos). Central Coast Water Board staff will review data every three years to determine compliance with the TMDL. If the Executive Officer determines additional monitoring is needed, the Executive Officer shall request it pursuant to Section 13267 of the California Water Code.
Draft Project Report - Corralitos Creek Fecal coliform TMDL March 2009
81
11.4 Reporting
The parties responsible for implementation and monitoring will incorporate the results of monitoring efforts in reports filed pursuant to the NPDES permit, Small MS4 Storm Water Permit, Nonpoint Source Implementation Program, or other correspondence as requested by the Central Coast Water Board pursuant to California Water Code Section 13267 or 13383. If reporting changes become necessary based on staff’s assessment of the TMDL implementation progress, the Executive Officer of the Central Coast Water Board will require such changes. At a minimum, the Central Coast Water Board will evaluate monitoring reporting data and implementation reporting information every three years.
Draft Project Report - Corralitos Creek Fecal coliform TMDL March 2009
82
12 PROJECT STATUS MANAGEMENT State Board Basin Planning Unit staff reviewed this Draft Project Report in October 2008. Water Board staff considered comments received from these reviewers while preparing the Draft Final Project Report. A State Scientific Peer Reviewer reviewed the Draft Project Report in July, 2008. Staff made minor changes based on the Scientific Peer review with regard to growth of E. coli in sediment, and de-emphasizing the reliability of microbial source tracking in quantifying FIB source contributions. Staff anticipates that this Draft Final Project Report will be posted for formal public review and comment in November 2008 and is currently scheduled to present it to the Central Coast Water Board for approval in March 2009. Staff anticipates that the full in-stream positive effect of all the management measures will be realized gradually. Staff therefore set a goal for TMDL attainment of thirteen years after the TMDLs become effective (which is upon approval by the California Office of Administrative Law). The Central Coast Water Board staff estimation is based on the cost and difficulty inherent in identifying fecal coliform/E. coli sources from all sources. Some of the nonpoint source dischargers have never been educated regarding pollution sources from their properties or operations, nor have they ever been regulated for their pollution loading or waste discharges (e.g., owners of land underlying homeless encampments and owners of farm animals and livestock). The Central Coast Water Board staff estimation is also based on the uncertainty of the time required for water quality improvements resulting from best management practices to be realized. Storm water permits or nonpoint source implementation programs may include additional provisions that the Central Coast Water Board determines are necessary to control pollutants (CWA section 402(p)(3)(B)(iii)). The Central Coast Water Board will consider additional requirements if implementation of management practices do not result in achievement of water quality objectives.
Draft Project Report - Corralitos Creek Fecal coliform TMDL March 2009
83
13 REFERENCES
Byappanahalli, M., D. Shively, M. Nevers, M. Sadowsky, R. Whitman. 2003. Growth and survival of Escherichia coli and enterococci populations in the macro-alga Cladophora (Chlorophyta). FEMS Microbiology Ecology 46 (2), 203–211. doi:10.1016/S0168-6496(03)00214-9
California Polytechnic State University, et al. 2002. Identifying the Sources of Escherichia coli Contamination to the Shellfish Growing Areas of the Morro Bay Estuary. March 15, 2002. California Wastewater Training & Research Center, California State University, Chico. 2003. Onsite Wastewater Treatment System; Repair of Failure/Malfunction Survey. January 2003. Center for Sustainable Cities, University of Southern California. 2005. NPDES Stormwater Cost Survey. January 2005. Central Coast Regional Water Quality Control Board. 1994. Water Quality Control
Plan for the Central Coastal Basin (Basin Plan), Regional Water Quality Control Board - Central Coast Region. September 1994.
Central Coast Regional Water Quality Control Board. 2006. Total Maximum Daily
Loads for Pathogens in Soquel Lagoon, Santa Cruz County, California, Final Project Report, Regional Water Quality Control Board - Central Coast Region. September 2006.
Coastal Watershed Council. 2003. Clean Streams Program: Corralitos Creek
Watershed. Final Annual Report, July–December 2003. Coastal Watershed Council, 2004. Clean Streams Program: Corralitos Creek
Watershed. Final Annual Report, March–December 2004. Hager, J., F. Watson, J. Le, and B. Olson. 2004. Watsonville Sloughs Pathogen
Problems and Sources. July 2004. Higgins, Mike. Central Coast Water Board Staff communication, June 11, 2008. Higgins, Mike. Central Coast Water Board Staff communication, June 10, 2008. Ishii, S., D. Hansen, R. Hicks, and M. Sadowsky. 2007. Beach Sand and Sediments
are Temporal Sinks and sources of Escherichia coli in Lake Superior. Environmental Science and Technology Vol. 41, No. 7, 2007.
Kahn, L., B. Allen, and J. Jones. 2000. The Septic System Owner’s Manual. Shelter
Publications, Inc., 2000. Bolinas, CA.
Draft Project Report - Corralitos Creek Fecal coliform TMDL March 2009
84
Northwest Hydraulic Consultants. 2006. Low Flow Monitoring on Corralitos Creek Downstream of City of Watsonville Diversion. November 2006. Riverson, J. 2003. Fecal Coliform Investigation and Analysis Spreadsheet (FECIA) [computer program]. Version 3, 8/25/2003. Tetra Tech, Inc., 2003. Fairfax, VA. Salsipuedes Sanitary District. Infiltration/Inflow and Spill Prevention Program Sewer System Management Plan, Annual Report. .January 29, 2008 Santa Cruz County, Environmental Health Service, Health Services Agency. 1989. Preliminary Report; An Evaluation of Wastewater Disposal and Water Quality in the San Lorenzo River Watershed. September 1989. County of Santa Cruz, Environmental Health Service Water Resources Program. 2006. Assessment of Sources of Bacterial Contamination at Santa Cruz County Beaches. March 2006. Santa Cruz County Environmental Health Services 2006. Observations in Macro and Micro Algae Contributions to Bacteria Populations and Implications for Beach Advisories. Santa Cruz County Environmental Health Services. November 2006. Santa Cruz County’s GIS Information Service. http://gis.co.santa-cruz.ca.us/internet/wwwgisweb/viewer.htm. Aerial imagery from 2003. State Water Resources Control Board. 2004. Water Quality Control Policy for Developing California’s Clean Water Act Section 303(d) List. Adopted September 2004. Swanson Hydrology & Geomorphology, Biotic Resources Group, Dana Bland &
Associates, Hagar Environmental Sciences, and VB Agricultural Services. 2003. Watsonville Sloughs Watershed Resource Conservation & Enhancement Plan. January 2003.
Sanitary Sewer Overflow Cooperative Agreement Workgroup of the Water
Environment Federation. 1999. Control of Infiltration and Inflow in Private Building Sewer Connections. Water Environment Federation 1999.
United States Census Bureau. 2007.
http://quickfacts.census.gov/qfd/states/06/0683668.html; State and County Quick Facts. January 2007.
United States Department of Agriculture Soil Conservation Service in cooperation
with University of California, Agricultural Experiment Station. 1980. Soil Survey of Santa Cruz County, California. August 1980.
Draft Project Report - Corralitos Creek Fecal coliform TMDL March 2009
85
United States Environmental Protection Agency. 1986. Ambient Water Quality Criteria for Bacteria-1986. January 1986
United States Geological Survey Surface Water Monthly Statistics. 2007. http://waterdata.usgs.gov/nwis. March 15, 2007 Wikipedia. 2006. http://en.wikipedia.org/wiki/Corralitos%2C_California. May 29,
2006.
Draft Final Project Report Appendix A TMDLs for Fecal coliform in Corralitos and Salsipuedes Creeks
1
APPENDIX A FECAL COLIFORM AND E. COLI
SAMPLING DATA AND ANALYSIS
SAMPLING DATA
CCAMP Fecal coliform Water Quality Data for Sampling Stations 305COR and 305COR2 (note: only data from 2003 to 2006 was used in data analysis for this Project Report)
Sampling Location Date
Fecal Coliform MPN/100 ml
12/18/97 5000
01/19/98 900
02/19/98 3000
03/12/98 80
05/27/98 80
06/30/98 70
07/31/98 300
09/03/98 240
09/30/98 2400
10/21/98 110
11/10/98 70
12/16/98 70 01/24/05 2400
02/22/05 300
03/23/05 2400
04/19/05 30
05/17/05 80
06/14/05 220
07/19/05 240
08/17/05 300
09/13/05 500
10/12/05 110
11/09/05 300
12/06/05 500
01/10/06 2300
02/21/06 80
305COR (Salsipuedes Creek
at Riverside Dr. Bridge)
03/14/06 3000
01/24/05 30 02/22/05 80
03/23/05 240
04/21/05 30
05/19/05 30000
06/16/05 500
07/21/05 130
12/08/05 80
01/12/06 50
02/23/06 130
305COR2 (Corralitos Creek at Browns Valley
Bridge)
03/16/06 300
Draft Final Project Report Appendix A TMDLs for Fecal coliform in Corralitos and Salsipuedes Creeks
2
Santa Cruz County Water Quality Data for Sampling Stations SCC1 and SCC2 (note: only data from 2003 to 2006 was used in data analysis for this Project Report)
Draft Final Project Report Appendix A TMDLs for Fecal coliform in Corralitos and Salsipuedes Creeks
6
Coastal Watershed Council E. coli Water Quality Data for Sampling Locations SALSI 21 and CORRA 23
Sampling Location Date
E. coli MPN/100 ml
11/05/03 662
03/08/04 161
05/26/04 185
07/06/04 226
08/12/04 285
09/22/04 243
10/07/04 437
SALSI 21
11/08/04 20
11/05/03 322
03/08/04 20
05/26/04 441
07/06/04 1333
08/12/04 201
09/22/04 855
10/07/04 4611
CORRA 23
11/08/04 187
Draft Final Project Report Appendix A TMDLs for Fecal coliform in Corralitos and Salsipuedes Creeks
7
City of Watsonville Fecal coliform Water Quality Data for Corralitos and Salsipuedes Creeks
Sampling Location Date
Fecal Coliform
MPN/100 ml Sampling Location Date
Fecal Coliform
MPN/100 ml
01/03 80 04/03 140
02/03 110 05/03 240
03/03 170 06/03 80
04/03 130 07/03 50
05/03 240 08/03 50
06/03 500 09/03 50
07/03 300 10/03 30
08/03 80 11/03 1600
09/03 170 12/03 50
10/03 170 01/04 23
11/03 240 02/04 170
12/03 23 03/04 30
01/04 140 04/04 50
02/04 2400 05/04 80
03/04 110 06/04 240
04/04 130 07/04 30
05/04 130 08/04 30
06/04 500 09/04 240
07/04 110 10/04 70
08/04 110 11/04 30
09/04 500 12/04 140
10/04 130 01/05 75
11/04 130 02/05 107
12/04 23 03/05 31
01/05 54 04/05 187
02/05 88 05/05 147
03/05 58 06/05 51
04/05 79 07/05 43
05/05 142 08/05 74
06/05 173 09/05 29
07/05 582 10/05 49
08/05 81 11/05 11
09/05 55 12/05 34
10/05 119 01/06 22
11/05 23 02/06 32
12/05 40 03/06 525
01/06 10 04/06 576
02/06 11
03/06 134
ECI (Eureka Canyon Intake)
04/06 273
01/03 50
02/03 110 BVI (Browns Valley Intake)
03/03 80
BVI (Browns Valley Intake)
Draft Final Project Report Appendix A TMDLs for Fecal coliform in Corralitos and Salsipuedes Creeks
8
City of Watsonville E. coli Water Quality Data for Corralitos and Salsipuedes Creeks
Sampling Location Date E. coli
MPN/100 ml
CC-1 (Corralitos Creek at Green Valley Rd) 01/04/05 55 CC-2 (Corralitos Creek just upstream of Salsipuedes Cr.) 01/04/05 64 CC-3 (Salsipuedes Creek at Lake Ave.) 01/04/05 109 CC-4 (Salsipuedes Creek at Riverside Drive Bridge) 01/04/05 234 CC-5 (Salsipuedes Creek just upstream of Pajaro River Confluence) 01/04/05 203 CC-1 (Corralitos Creek at Green Valley Rd) 01/12/05 38 CC-2 (Corralitos Creek just upstream of Salsipuedes Cr.) 01/12/05 75 CC-3 (Salsipuedes Creek at Lake Ave.) 01/12/05 58 CC-4 (Salsipuedes Creek at Riverside Drive Bridge) 01/12/05 171 CC-5 (Salsipuedes Creek just upstream of Pajaro River Confluence) 01/12/05 226 CC-1 (Corralitos Creek at Green Valley Rd) 01/19/05 39 CC-2 (Corralitos Creek just upstream of Salsipuedes Cr.) 01/19/05 64 CC-3 (Salsipuedes Creek at Lake Ave.) 01/19/05 81 CC-4 (Salsipuedes Creek at Riverside Drive Bridge) 01/19/05 39 CC-5 (Salsipuedes Creek just upstream of Pajaro River Confluence) 01/19/05 53 CC-1 (Corralitos Creek at Green Valley Rd) 01/26/05 * 3448 CC-2 (Corralitos Creek just upstream of Salsipuedes Cr.) 01/26/05 * 2909 CC-3 (Salsipuedes Creek at Lake Ave.) 01/26/05 * 1956 CC-4 (Salsipuedes Creek at Riverside Drive Bridge) 01/26/05 * 2723 CC-5 (Salsipuedes Creek just upstream of Pajaro River Confluence) 01/26/05 * 4106 CC-1 (Corralitos Creek at Green Valley Rd) 02/02/05 215 CC-2 (Corralitos Creek just upstream of Salsipuedes Cr.) 02/02/05 69 CC-3 (Salsipuedes Creek at Lake Ave.) 02/02/05 91 CC-4 (Salsipuedes Creek at Riverside Drive Bridge) 02/02/05 144 CC-5 (Salsipuedes Creek just upstream of Pajaro River Confluence) 02/02/05 154 CC-1 (Corralitos Creek at Green Valley Rd) 02/09/05 85 CC-2 (Corralitos Creek just upstream of Salsipuedes Cr.) 02/09/05 110 CC-3 (Salsipuedes Creek at Lake Ave.) 02/09/05 92 CC-4 (Salsipuedes Creek at Riverside Drive Bridge) 02/09/05 646
CC-5 (Salsipuedes Creek just upstream of Pajaro River Confluence) 02/09/05 621
* Field notes indicated rain event during sampling on January 26, 05
Draft Final Project Report Appendix A TMDLs for Fecal coliform in Corralitos and Salsipuedes Creeks
9
DATA ANALYSIS
Staff used two methods to analyze fecal coliform and E. coli water quality data. Staff
analyzed the fecal coliform data using a program titled “Fecal Coliform Investigation and
Analysis Spreadsheet” (FECIA; Riverson, 2003). FECIA is a fully automated
spreadsheet designed to assist in characterization and quantification of fecal coliform
instream water quality objective exceedances. Staff compared the observed data against
specified values equal to water quality objectives to determine the magnitude and nature
of exceedances. Staff used the FECIA program to generate the data analysis figures and
tables contained in this section of the appendix. Figures display the water contact
recreation beneficial use maximum water quality objective for fecal coliform only (as a
bold horizontal line). Staff determined, none of the samples collected amounted to
greater than five in a 30-day period, the rate necessary to calculate a geometric mean.
Therefore, staff did not use the geometric mean water quality objective for fecal coliform.
Staff used a second method, an Excel spread sheet, for analyzing E. coli data. Staff
calculated the geomean for each set of five samples in a 30-day period. Staff also used
Excel to calculate the percent of exceedances for data sets of less than five samples in a
30-day period. Two Coastal Watershed Council E. coli sample sets contained eight
samples collected in an approximate one-year period. In this case, staff used Excel to
calculate the geomean of all eight samples at each location. Although there was not
enough data to analyze according to USEPA water quality criteria, staff felt the analysis
was sufficient for indicating the presence or absence of high levels of indicator bacteria.
Statistics that staff generated from the analysis are included in this section of the
appendix.
Tables below each figure display statistical data on a monthly basis including the mean,
median, minimum, maximum, number of exceedances of the water contact recreation
water quality objective versus the sample count (XS:Count), and the percent sample
exceedance (XS%) of the water quality objective. Note that when the table analyzed
geometric means, the column entitled “mean” was actually the “mean of the geometric
mean.” The mean value for the maximum water quality objective or criterion is the
actual mean value of the samples collected.
Draft Final Project Report Appendix A TMDLs for Fecal coliform in Corralitos and Salsipuedes Creeks
10
CCAMP data: Salsipuedes Creek at Riverside Drive Bridge (305 COR)
Geometric Mean Water Quality Objective (200 MPN/100 ml)
There was not enough water quality data collected at the Salsipuedes Creek at Riverside
Drive Bridge sampling station to calculate geometric means.
Draft Final Project Report Appendix A TMDLs for Fecal coliform in Corralitos and Salsipuedes Creeks
11
CCAMP data: Salsipuedes Creek at Riverside Drive Bridge (305 COR)
Maximum Water Quality Objective (400 MPN/100 ml)
Figure 1. Salsipuedes Creek at Riverside Drive Bridge Fecal Coliform (#/100 ml)
and Water Contact Maximum Water Quality Objective (January 05 through March
2006)
Table 1. Salsipuedes Creek at Riverside Drive Bridge Fecal Coliform (#/100 ml)
Data Summary and Exceedance of Water Contract Recreation Maximum Water
25th-75th Percentile Mean, Min, Max Median Not-To-Exceed Standard
Draft Final Project Report Appendix A TMDLs for Fecal coliform in Corralitos and Salsipuedes Creeks
12
CCAMP data: Corralitos Creek at Browns Valley Bridge (305 COR2)
Geometric Mean Water Quality Objective (200 MPN/100 ml)
There was not enough water quality data collected at the Corralitos Creek at Browns
Valley Bridge sampling station to calculate geometric means.
Draft Final Project Report Appendix A TMDLs for Fecal coliform in Corralitos and Salsipuedes Creeks
13
CCAMP Data: Corralitos Creek at Browns Valley Bridge (305 COR2)
Maximum Water Quality Objective (400 MPN/100 ml)
Figure 2. Corralitos Creek at Browns Valley Bridge Fecal Coliform (#/100 ml) and
Water Contact Maximum Water Quality Objective (January 05 through March
2006)
Table 2. Corralitos Creek at Browns Valley Bridge Fecal Coliform (#/100 ml) Data
Summary and Exceedance of Water Contract Recreation Maximum Water Quality
Objective
Month Mean Median Min Max 25th 75th XS:Count XS%
Jan 40 40 30 50 35 45 0:2 0%
Feb 105 105 80 130 93 118 0:2 0%
Mar 270 270 240 300 255 285 0:2 0%
Apr 30 30 30 30 30 30 0:1 0%
May 30000 30000 30000 30000 30000 30000 1:1 100%
Jun 500 500 500 500 500 500 1:1 100%
Jul 130 130 130 130 130 130 0:1 0%
Aug 0 0 0 0 0 0 0:0 n/a
Sep 0 0 0 0 0 0 0:0 n/a
Oct 0 0 0 0 0 0 0:0 n/a
Nov 0 0 0 0 0 0 0:0 n/a
Dec 80 80 80 80 80 80 0:1 0%
All Data 2870 130 30 30000 65 270 2:11 18%
Summary Statistics ( Data: 1/24/2005 2:26:00 PM to 3/16/2006 11:06:00 AM )
0.01
0.1
1
10
100
1000
10000
100000
Jan Feb Mar Apr May Jun Jul Aug Sep Oct Nov Dec
Fecal colif
orm
25th-75th Percentile Mean, Min, Max Median Not-To-Exceed Standard
Draft Final Project Report Appendix A TMDLs for Fecal coliform in Corralitos and Salsipuedes Creeks
14
Santa Cruz County Data: Corralitos Creek at Rider Creek (SCC1)
Geometric Mean Water Quality Objective (200 MPN/100 ml)
There was not enough water quality data collected at the Corralitos Creek at Rider Creek
sampling station to calculate geometric means.
Draft Final Project Report Appendix A TMDLs for Fecal coliform in Corralitos and Salsipuedes Creeks
15
Santa Cruz County Data: Corralitos Creek at Rider Creek (SCC1)
Maximum Water Quality Objective (400 MPN/100 ml)
1
10
100
1000
Jan Feb Mar Apr May Jun Jul Aug Sep Oct Nov Dec
Fecal C
olif
orm
25th-75th Percentile Mean, Min, Max Median Not-To-Exceed Standard
Figure 3. Corralitos Creek at Rider Creek Fecal Coliform (#/100 ml) and Water
Contact Maximum Water Quality Objective (periodically from January 2003
through October 2006)
Table 3. Corralitos Creek at Rider Creek Fecal Coliform (#/100 ml) Data Summary
and Exceedance of Water Contract Recreation Maximum Water Quality Objective
Month Mean Median Min Max 25th 75th XS:Count XS%
Jan 18 20 10 20 18 20 0:4 0%
Feb 186 118 50 460 73 231 1:4 25%
Mar 35 35 5 65 24 46 0:4 0%
Apr 34 33 30 40 30 39 0:6 0%
May 35 23 15 80 19 39 0:4 0%
Jun 82 59 50 160 50 91 0:4 0%
Jul 69 40 16 150 28 95 0:3 0%
Aug 23 23 10 36 17 30 0:2 0%
Sep 57 75 5 88 30 88 0:5 0%
Oct 185 55 10 620 33 208 1:4 25%
Nov 65 40 5 150 23 95 0:3 0%
Dec 203 295 5 310 150 303 0:3 0%
All Data 81 40 5 620 20 79 2:46 4%
Summary Statistics ( Data: 1/13/2003 to 10/11/2006 )
Draft Final Project Report Appendix A TMDLs for Fecal coliform in Corralitos and Salsipuedes Creeks
16
Santa Cruz County Data: Corralitos Creek at Browns Valley Bridge (SCC2)
Geometric Mean Water Quality Objective (200 MPN/100 ml)
There was not enough water quality data collected at the Corralitos Creek at the Browns
Valley Bridge sampling station to calculate geometric means.
Draft Final Project Report Appendix A TMDLs for Fecal coliform in Corralitos and Salsipuedes Creeks
17
Santa Cruz County Data: Corralitos Creek at Browns Valley Bridge (SCC2)
Maximum Water Quality Objective (400 MPN/100 ml)
Figure 4. Corralitos Creek at Browns Valley Bridge Fecal Coliform (#/100 ml) and
Water Contact Maximum Water Quality Objective (periodically from January 2003
through October 2006)
Table 4. Corralitos Creek at Browns Valley Bridge Fecal Coliform (#/100 ml) Data
Summary and Exceedance of Water Contract Recreation Maximum Water Quality
Objective
1
10
100
1000
10000
Jan Feb Mar Apr May Jun Jul Aug Sep Oct Nov Dec
Fecal Coliform
25th-75th Percentile Mean, Min, Max Median Not-To-Exceed Standard
Month Mean Median Min Max 25th 75th XS:Count XS%
Jan 40 38 30 55 35 44 0:4 0%
Feb 313 123 40 965 48 388 1:4 25%
Mar 35 20 5 95 9 46 0:4 0%
Apr 57 43 25 120 40 64 0:6 0%
May 109 98 20 220 61 145 0:4 0%
Jun 108 108 80 135 94 121 0:2 0%
Jul 193 193 80 305 136 249 0:2 0%
Aug 85 85 85 85 85 85 0:1 0%
Sep 476 64 25 1340 45 702 1:3 33%
Oct 5 5 5 5 5 5 0:1 0%
Nov 45 45 40 50 43 48 0:2 0%
Dec 110 140 40 150 90 145 0:3 0%
All Data 135 53 5 1340 39 120 2:36 6%
Summary Statistics ( Data: 1/13/2003 to 10/11/2006 )
Draft Final Project Report Appendix A TMDLs for Fecal coliform in Corralitos and Salsipuedes Creeks
18
Coastal Watershed Council Data: Corralitos Creek at Pista Lane/7226 Freedom Blvd. and Salsipuedes Creek at East Lake Avenue Bridge (SALSI 21 and CORRA 23)
Geometric Mean Water Quality Objective (126 MPN/100 ml)
Table 5. Corralitos Creek at Pista Lane/7226 Freedom Blvd. and Salsipuedes Creek
at East Lake Avenue Bridge E. coli (#/100 ml) Data Summary and Geometric Mean
of all 8 samples at each location (periodically from November 2003 through
November 2004).
Location Date E. coli Geomean
11/05/03 322
03/08/04 20
05/26/04 441
CORRA 23 (Corralitos Creek At Pista Lane/7226 Freedom Blvd.) 07/06/04 1333
08/12/04 201
09/22/04 855
10/07/04 4611
11/08/04 187
392
11/05/03 662
03/08/04 161
SALSI 21 (Salispuedes Creek at East Lake Avenue Bridge) 05/26/04 185
07/06/04 226
08/12/04 285
09/22/04 243
10/07/04 437
11/08/04 20
201
Draft Final Project Report Appendix A TMDLs for Fecal coliform in Corralitos and Salsipuedes Creeks
19
City of Watsonville Data: Browns Valley Intake (BVI)
Geometric Mean Water Quality Objective (200 MPN/100 ml)
There was not enough water quality data collected at the Browns Valley Intake sampling
station to calculate geometric means.
Draft Final Project Report Appendix A TMDLs for Fecal coliform in Corralitos and Salsipuedes Creeks
20
City of Watsonville Data: Browns Valley Intake (BVI)
Maximum Water Quality Objective (400 MPN/100 ml)
Figure 5. Corralitos Creek at Browns Valley Intake Fecal Coliform (#/100 ml) and
Water Contact Maximum Water Quality Objective (January 2003 through April
2006)
Table 6. Corralitos Creek at Browns Valley Intake Fecal Coliform (#/100 ml) Data
Summary and Exceedance of Water Contract Recreation Maximum Water Quality
Objective
1
10
100
1000
10000
Jan Feb Mar Apr May Jun Jul Aug Sep Oct Nov Dec
Fe
ca
l C
olif
orm
25th-75th Percentile Mean, Min, Max Median Not-To-Exceed Standard
Month Mean Median Min Max 25th 75th XS:Count XS%
Jan 43 37 22 75 23 56 0:4 0%
Feb 105 109 32 170 88 125 0:4 0%
Mar 167 56 30 525 31 191 1:4 25%
Apr 238 164 50 576 118 284 1:4 25%
May 156 147 80 240 114 194 0:3 0%
Jun 124 80 51 240 66 160 0:3 0%
Jul 41 43 30 50 37 47 0:3 0%
Aug 51 50 30 74 40 62 0:3 0%
Sep 106 50 29 240 40 145 0:3 0%
Oct 50 49 30 70 40 60 0:3 0%
Nov 547 30 11 1600 21 815 1:3 33%
Dec 75 50 34 140 42 95 0:3 0%
All Data 141 51 11 1600 32 140 3:40 8%
Summary Statistics ( Data: 1/3/2003 to Sep-05 )
Draft Final Project Report Appendix A TMDLs for Fecal coliform in Corralitos and Salsipuedes Creeks
21
City of Watsonville Data: Eureka Canyon Intake (ECI)
Geometric Mean Water Quality Objective (200 MPN/100 ml)
There was not enough water quality data collected at the Eureka Canyon Intake sampling
station to calculate geometric means.
Draft Final Project Report Appendix A TMDLs for Fecal coliform in Corralitos and Salsipuedes Creeks
22
City of Watsonville Data: Eureka Canyon Intake (ECI)
Maximum Water Quality Objective (400 MPN/100 ml)
Figure 6. Corralitos Creek at Eureka Canyon Intake Fecal Coliform (#/100 ml) and
Water Contact Maximum Water Quality Objective (January 2003 through April
2006)
Table 7. Corralitos Creek at Eureka Canyon Intake Fecal Coliform (#/100 ml) Data
Summary and Exceedance of Water Contract Recreation Maximum Water Quality
Objective
1
10
100
1000
10000
Jan Feb Mar Apr May Jun Jul Aug Sep Oct Nov Dec
Fecal C
olif
orm
25th-75th Percentile Mean, Min, Max Median Not-To-Exceed Standard
Month Mean Median Min Max 25th 75th XS:Count XS%
Jan 71 67 10 140 43 95 0:4 0%
Feb 652 99 11 2400 69 683 1:4 25%
Mar 118 122 58 170 97 143 0:4 0%
Apr 153 130 79 273 117 166 0:4 0%
May 171 142 130 240 136 191 0:3 0%
Jun 391 500 173 500 337 500 2:3 67%
Jul 331 300 110 582 205 441 1:3 33%
Aug 90 81 80 110 81 96 0:3 0%
Sep 242 170 55 500 113 335 1:3 33%
Oct 140 130 119 170 125 150 0:3 0%
Nov 131 130 23 240 77 185 0:3 0%
Dec 29 23 23 40 23 32 0:3 0%
All Data 214 130 10 2400 80 171 5:40 13%
Summary Statistics ( Data: 1/3/2003 to Sep-05 )
Draft Final Project Report Appendix A TMDLs for Fecal coliform in Corralitos and Salsipuedes Creeks
23
City of Watsonville Data: Downstream Sampling Locations (CC1 through CC5)
Geometric Mean Water Quality Objective (126 MPN/100 ml)
Table 8. Downstream sampling locations E. coli (#/100 ml) Data Summary and
Geometric Mean (periodically from November 2003 through November 2004)
Date Sampling Location E. coli
E. coli MPN/100 ml Geomean
Sample Set 1 (first five
samples at each location)
E. coli MPN/100 ml Geomean
Sample Set 2 (last five
samples at each location)
01/04/05 CC-1 55
01/12/05 CC-1 38
01/19/05 CC-1 39
01/26/05* CC-1 3448
02/02/05 CC-1 215 143
02/09/05 CC-1 85 156
01/04/05 CC-2 64
01/12/05 CC-2 75
01/19/05 CC-2 64
01/26/05* CC-2 2909
02/02/05 CC-2 69 144
02/09/05 CC-2 110 160
01/04/05 CC-3 109
01/12/05 CC-3 58
01/19/05 CC-3 81
01/26/05* CC-3 1956
02/02/05 CC-3 91 156
02/09/05 CC-3 92 150
01/04/05 SC-4 234
01/12/05 SC-4 171
01/19/05 SC-4 39
01/26/05* SC-4 2723
02/02/05 SC-4 144 228
02/09/05 SC-4 646 279
01/04/05 SC-5 203
01/12/05 SC-5 226
01/19/05 SC-5 53
01/26/05* SC-5 4106
02/02/05 SC-5 154 274
02/09/05 SC-5 621 342
* Field notes indicated rain event during sampling on January 26, 05