California School Dashboard Release: Suspension Rate and English Learner Progress Indicators Presented by the Analysis, Measurement, and Accountability Reporting Division November 7, 2017 TOM TORLAKSON State Superintendent of Public Instruction
Transcript
California School Dashboard Release: Suspension Rate and
English Learner Progress Indicators
Presented by the Analysis, Measurement, and Accountability
Reporting DivisionNovember 7, 2017
TOM TORLAKSONState Superintendent of Public Instruction
Second Release of State Indicators
• The Suspension Rate Indicator and English Learner Progress Indicator (ELPI) were released for private preview on November 8.
–College/Career Indicator (CCI) and Graduation Rate Indicator were released on November 1.
• Private preview Web addresses and passwords were sent to Dashboard and Secure Accountability Coordinators.
2California Department of Education
Agenda
• Overview of the California School Dashboard and Accountability System
• Suspension Rate Indicator• New Methodology for Small Student
Populations• ELPI
California Department of Education
3
Overview of the California School Dashboard and Accountability System
California Department of Education 4
California School Dashboard
5
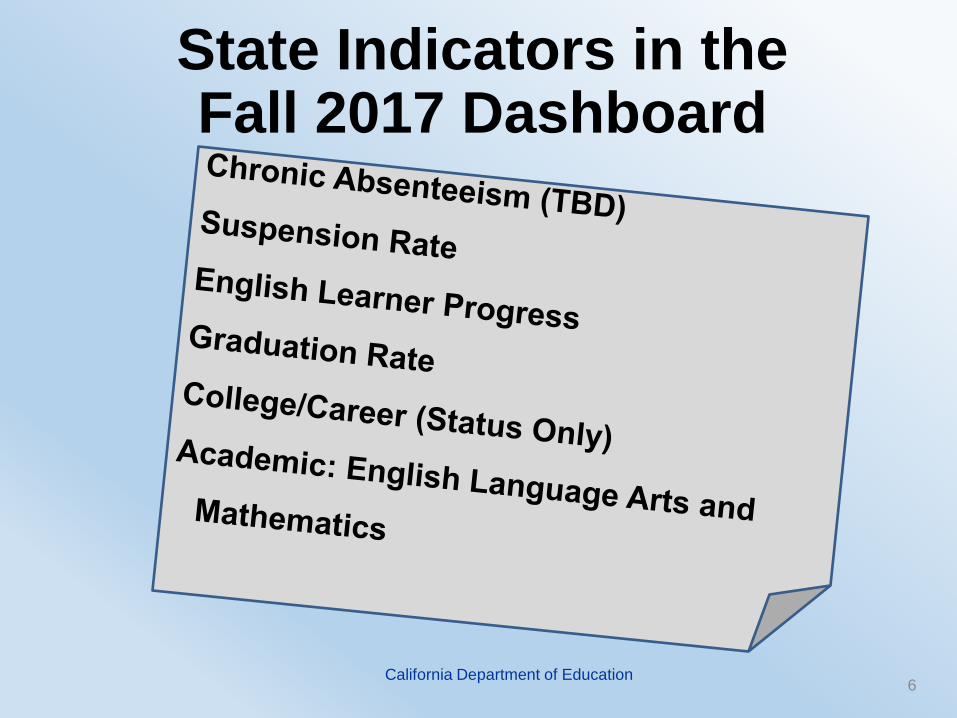
• The California School Dashboard (Dashboard)reports: Six State Indicators:
oData collected statewide. oCalifornia Department of Education (CDE)
uploads the data into the Dashboard.Four Local Indicators:
oData collected by the local educational agencies (LEAs).
oLEAs upload the data into the Dashboard.
State Indicators in theFall 2017 Dashboard
6California Department of Education
Performance Levels (Colors)• LEAs, schools, and student groups receive
performance levels (or colors) for each state indicator.
• At least two years of data (Status and Change) are required to receive a color:
oStatus: Current dataoChange: The difference between current year
and prior year(s) of data
7California Department of Education
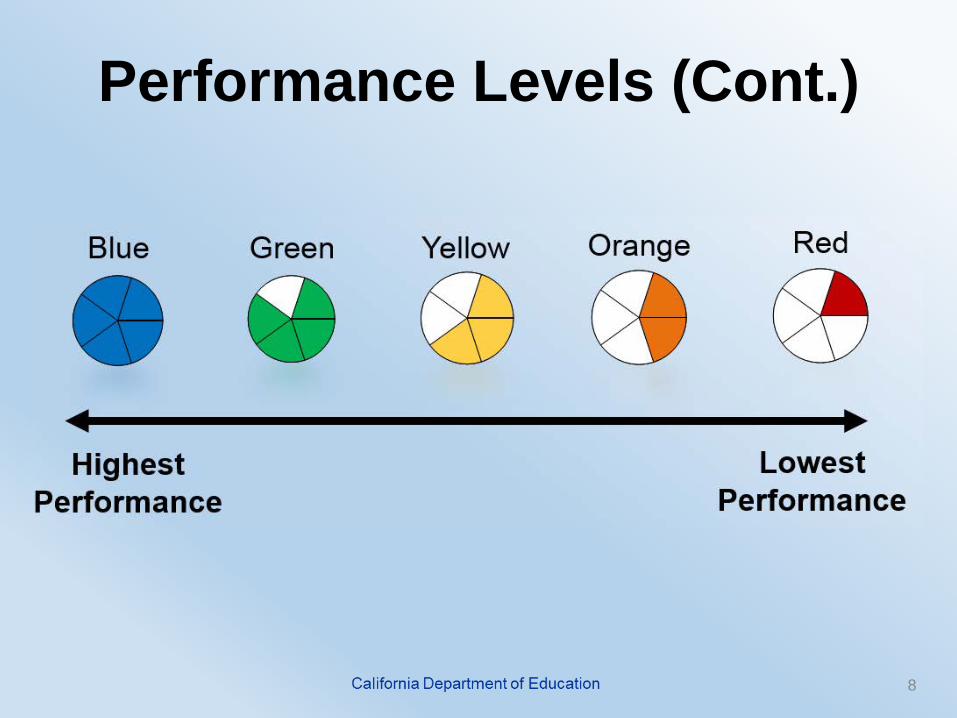
Performance Levels (Cont.)
8
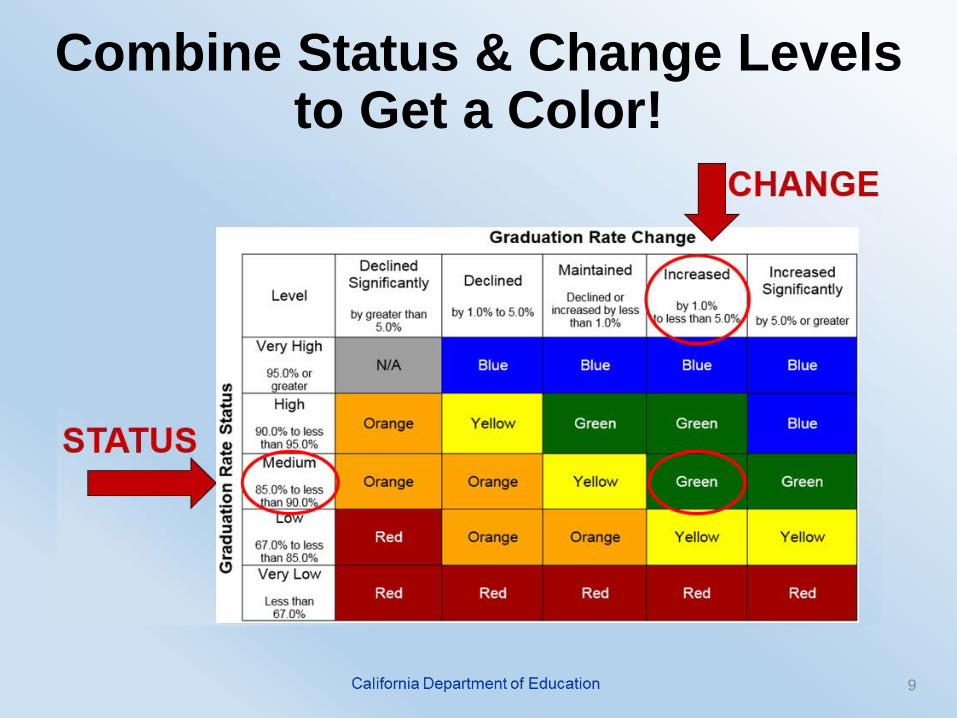
Combine Status & Change Levelsto Get a Color!
9
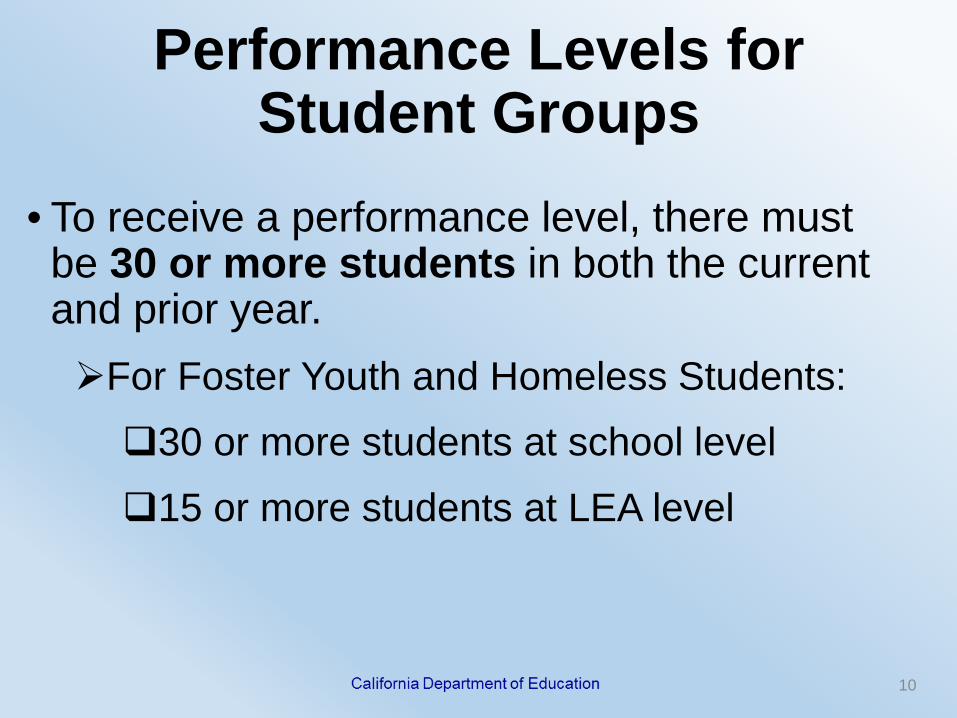
Performance Levels for Student Groups
• To receive a performance level, there must be 30 or more students in both the current and prior year. For Foster Youth and Homeless Students:30 or more students at school level15 or more students at LEA level
10
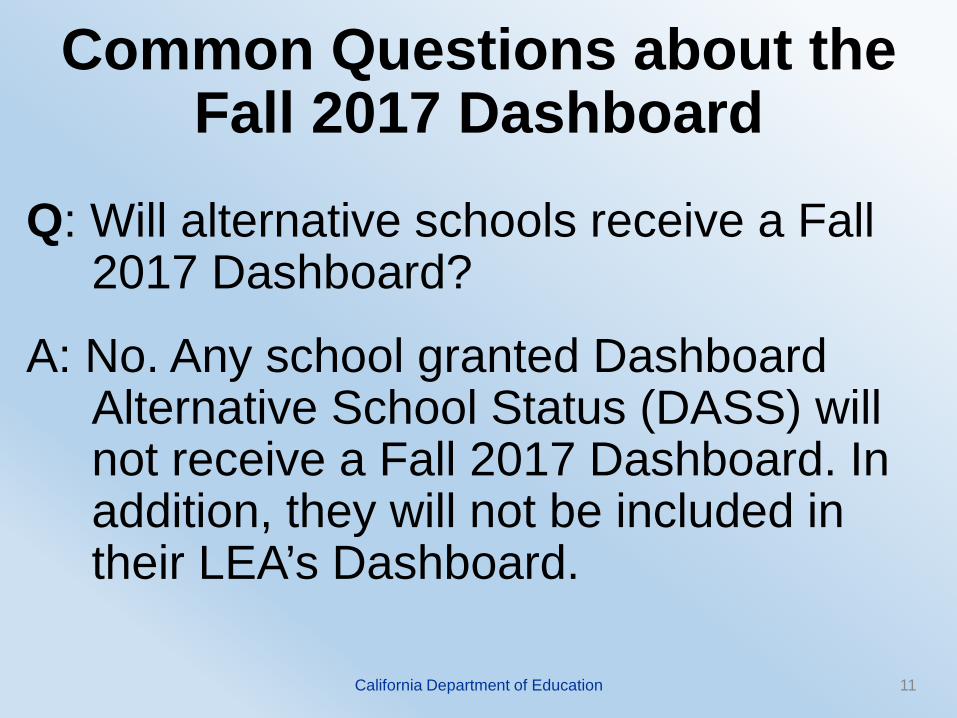
Common Questions about the Fall 2017 Dashboard
Q: Will alternative schools receive a Fall 2017 Dashboard?
A: No. Any school granted Dashboard Alternative School Status (DASS) will not receive a Fall 2017 Dashboard. In addition, they will not be included in their LEA’s Dashboard.
11California Department of Education
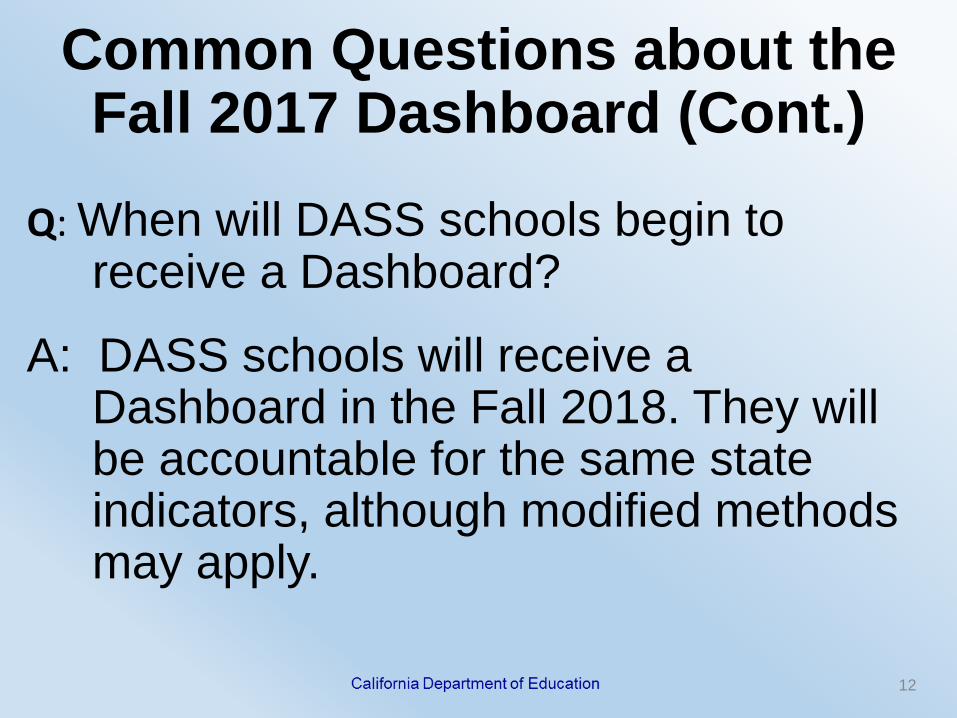
Common Questions about the Fall 2017 Dashboard (Cont.)
12
Q: When will DASS schools begin to receive a Dashboard?
A: DASS schools will receive a Dashboard in the Fall 2018. They will be accountable for the same state indicators, although modified methods may apply.
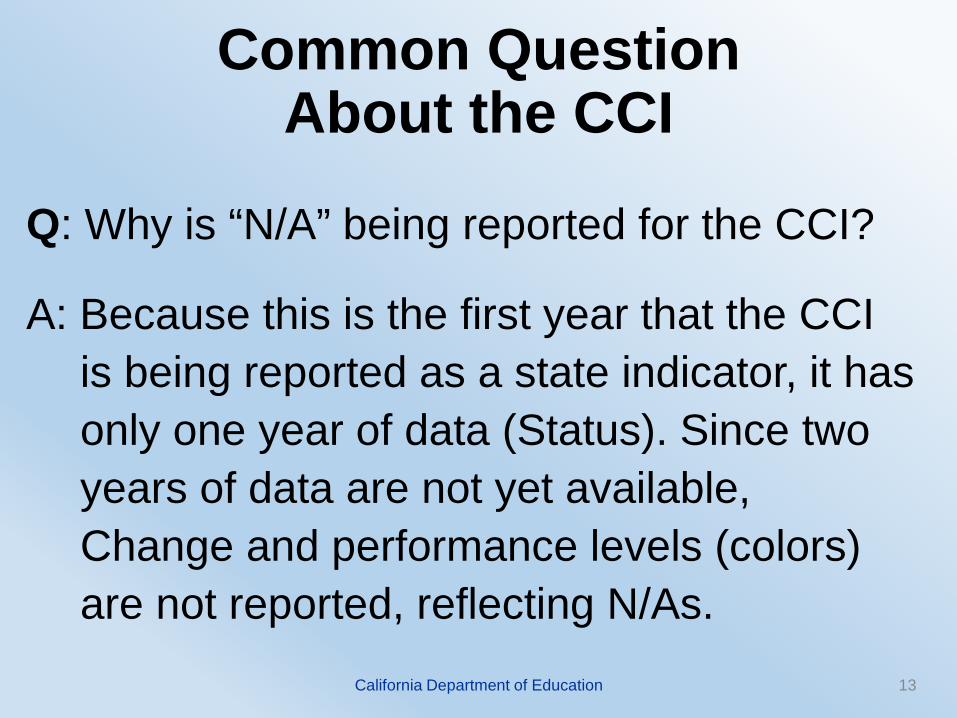
Common Question About the CCI
13
Q: Why is “N/A” being reported for the CCI?
A: Because this is the first year that the CCI is being reported as a state indicator, it has only one year of data (Status). Since two years of data are not yet available, Change and performance levels (colors) are not reported, reflecting N/As.
California Department of Education
Suspension Rate Indicator
California Department of Education 14
Suspension Rate IndicatorGrades K–12
LEAs, schools, and student groups will receive a performance level (or color) if there are 30 or more students cumulatively enrolled in both Status and Change.
California Department of Education 15
Cumulative Enrollment
• Total number of students who, at any time during the school year, enrolled in a school.Example: A student who enrolls in a school
on March 7 and transfers out on March 10 would be counted in the school’s cumulative enrollment.
16
Suspension Rate Rules• Multiple Suspensions for One Student: A
student who is suspended multiple times is only counted as suspended once.
• “In-School” Suspensions: Both “in-school” and “out-of-school” suspension are counted in the numerator of the suspension rate calculation.
California Department of Education 17
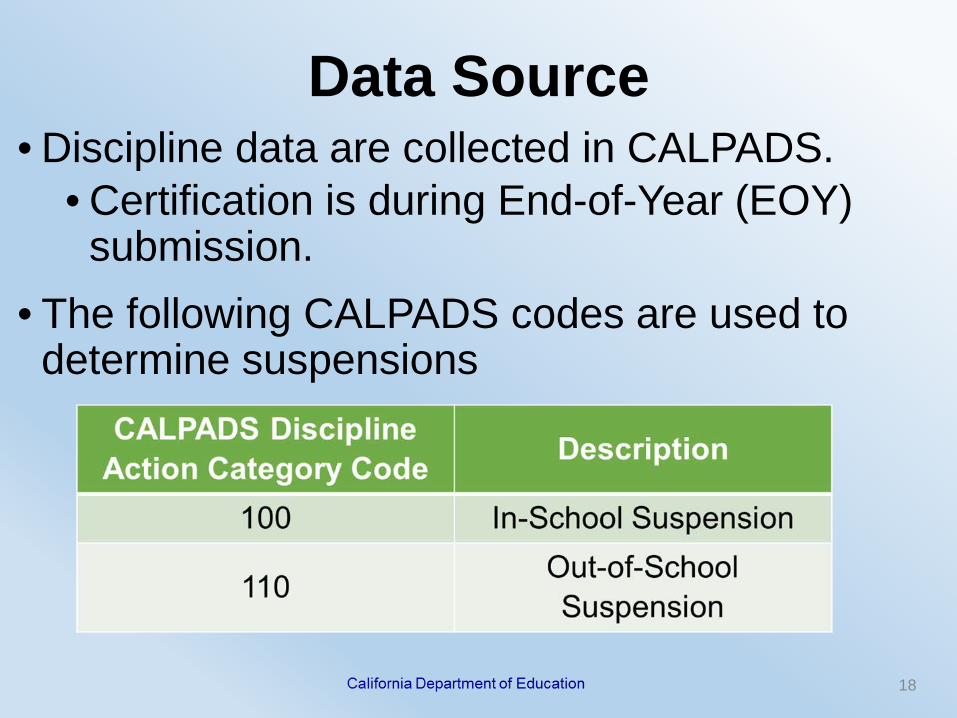
Data Source• Discipline data are collected in CALPADS.
• Certification is during End-of-Year (EOY) submission.
• The following CALPADS codes are used to determine suspensions
18
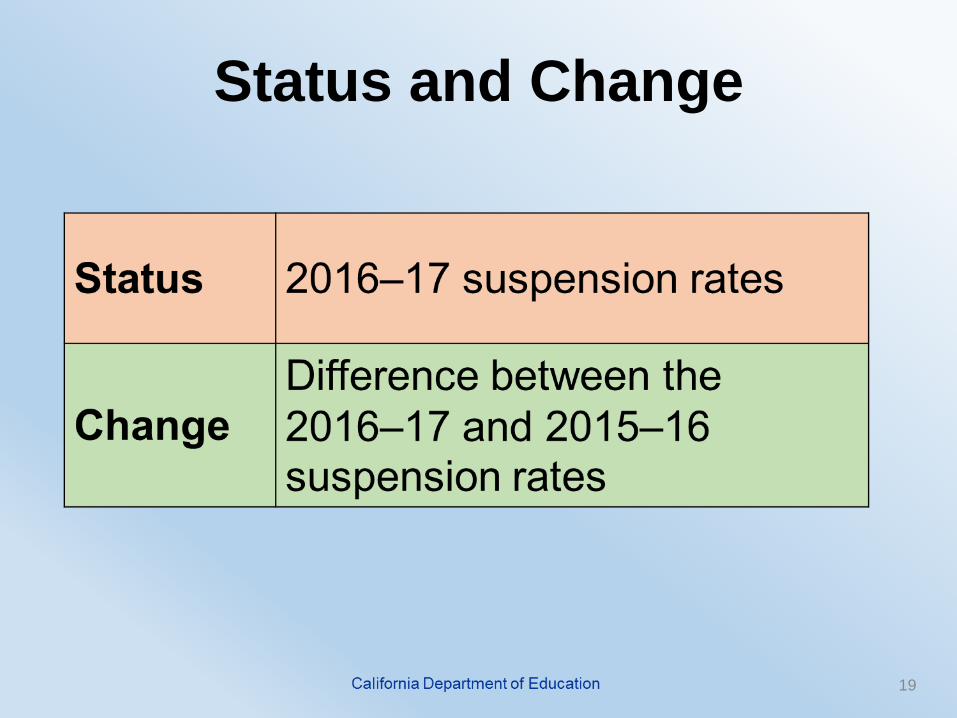
Status and Change
19
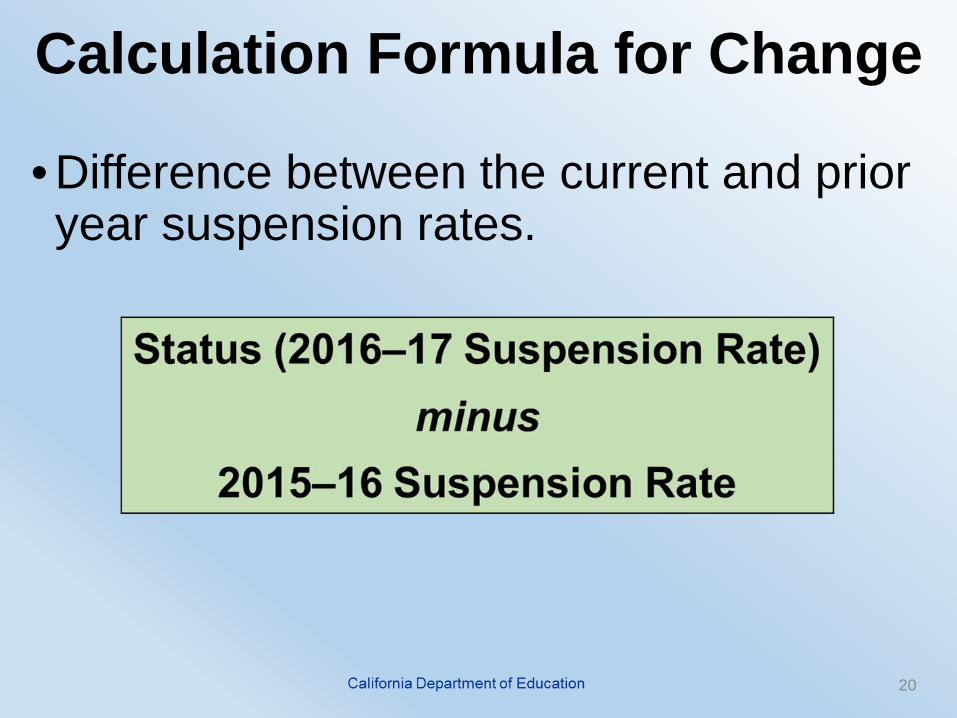
Calculation Formula for Change
20
• Difference between the current and prior year suspension rates.
Key Differences
• Reverse Goal: –Desired outcome is low suspension rate
and low percent for Status and Change.
• Multiple cut scores–Based on LEA and school type
21
Multiple Cut Scores
22
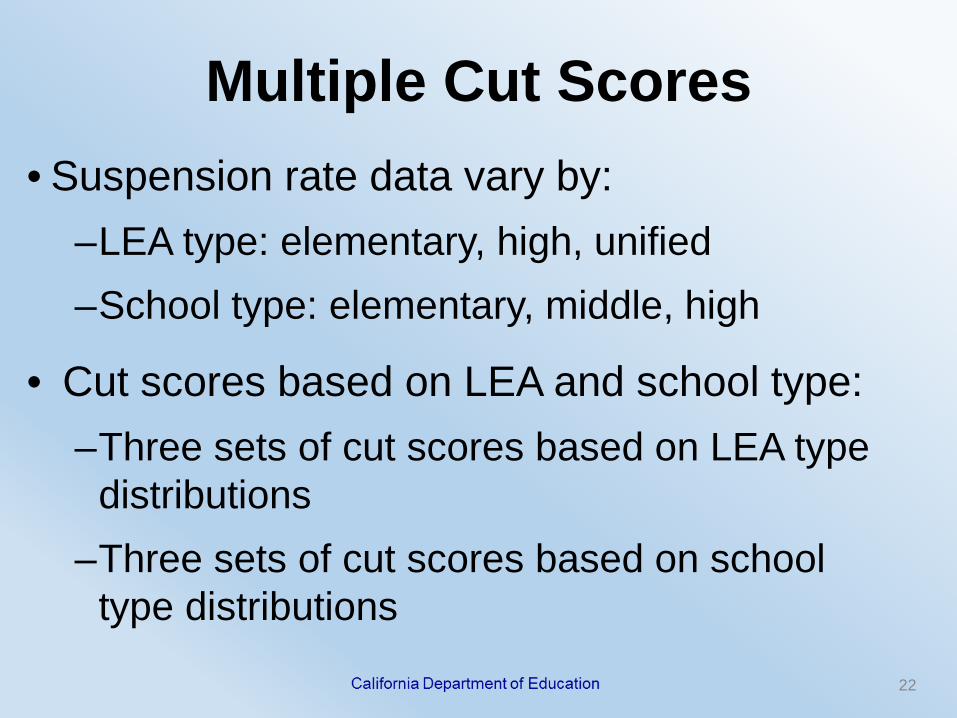
• Suspension rate data vary by:–LEA type: elementary, high, unified–School type: elementary, middle, high
• Cut scores based on LEA and school type:–Three sets of cut scores based on LEA type
distributions–Three sets of cut scores based on school
type distributions
Charter Schools and Single School Districts
• Charter schools and single school districts will only receive and be held accountable for school-level performance for this indicator because:
–Under the LCFF, charter schools are treated as districts.
–Under the ESSA, single school districts are treated as schools.
23LCFF: Local Control Funding FormulaESSA: Every Student Succeeds Act California Department of Education
Six Sets of Colored Tables
24
• Having six different sets of cut scores results in six different five-by-five colored tables.
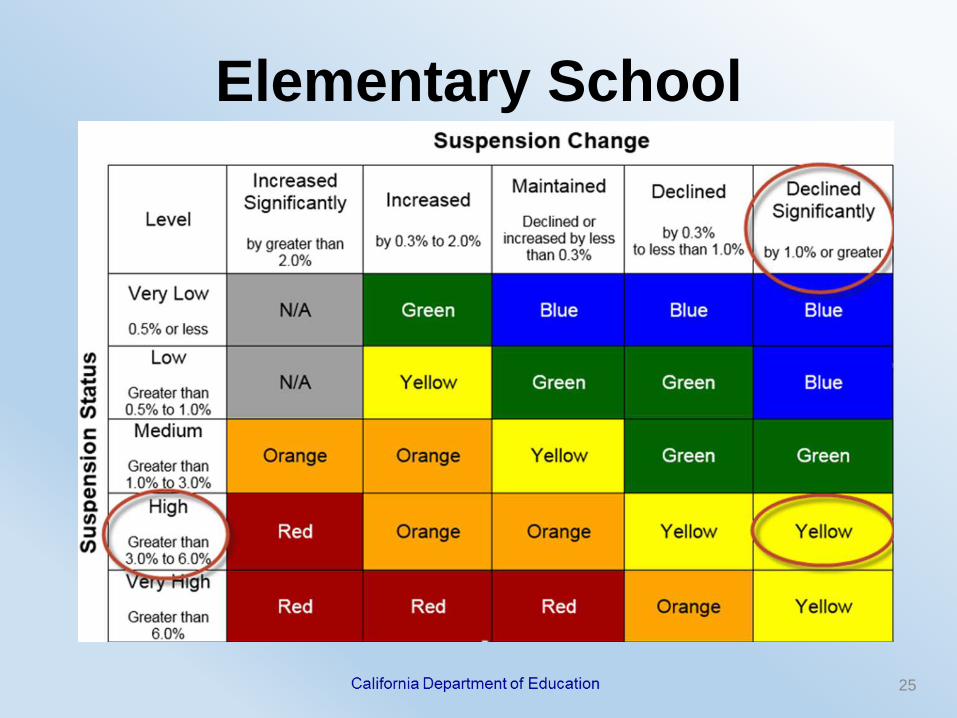
Elementary School
25
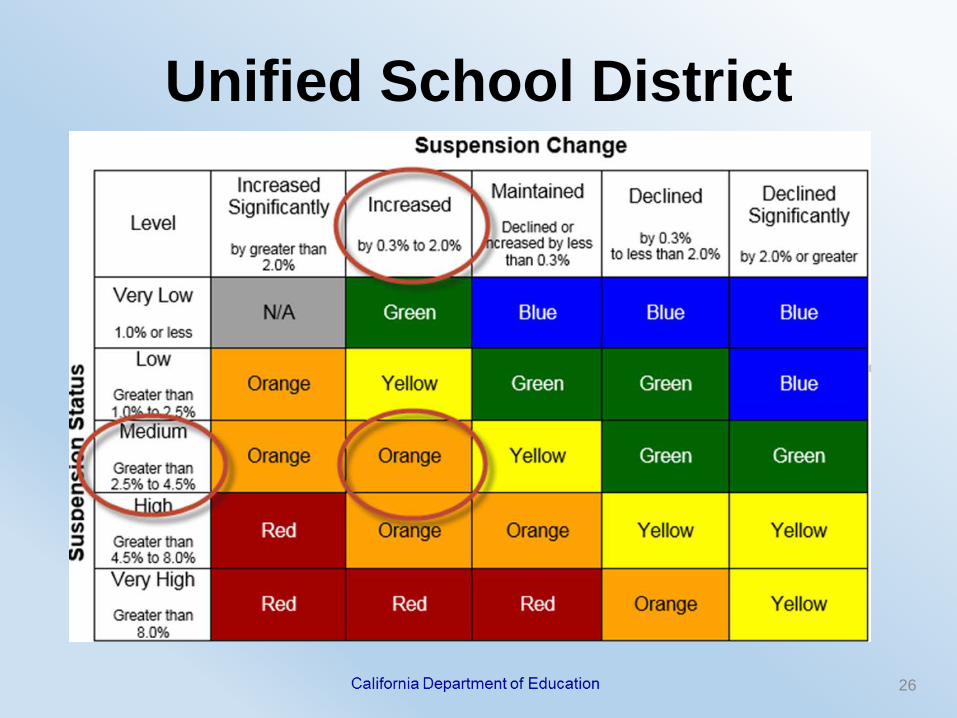
Unified School District
26
Automatic Assignment ofPerformance Level (Color)
• Schools that do not certify (or submit) suspension data in CALPADS are automatically assigned an performance level.
Note: The CDE will recommend that the SBE change this business rule—starting with the Fall 2018 Dashboard—to assign a Red performance level if data are not certified.
California Department of Education 27
Common Questions on the Suspension Rate Indicator
28
Q: Why is the number of students reported in the Suspension Indicator different from the number of students enrolled at my site?
A: Cumulative enrollment is used to determine the suspension rate. This means that all students who were enrolled at the site, at any time during the school year, are counted.
New Methodology for Small Student Populations
California Department of Education 29
Small Student Populations• Schools and districts with small student
populations are more susceptible to large swings in the results.
• This can lead to an over-identification in both the Red and Blue performance levels, especially for: Graduation Rate IndicatorSuspension Rate Indicator
30California Department of Education
Safety Net Methodology
31
• A new methodology, called the “Safety Net,” prevents large swings triggered by results of just a few students.
• Methodology will be applied when N size is less than 150.
Defining N Size at Indicator Level
• N size is based on the number of students at the indicator level rather than the number of students enrolled.Graduation: Number of students in the cohort
Suspension: Number of students cumulatively enrolled
California Department of Education 32
Application of Safety Net Methodology
• Removes the “Increased Significantly” and “Declined Significantly” Change levels from the performance level determinations.
• Small student populations will only receive one of three Change levels for the graduation and suspension rate indicators:IncreasedMaintainedDeclined
33California Department of Education
Adjusted Grid for Small Student Populations
34
English Learner Progress Indicator
California Department of Education 35
English Learner Progress Indicator (ELPI)
Grades 1–12• LEAs, schools, and EL students will receive a
performance level (or color) if there are 30 or more students who took an annual California English Language Development Test (CELDT) in both Status and Change.
• This is the only state indicator where there are no student group data.
California Department of Education 36
Calculation of the ELPI
37
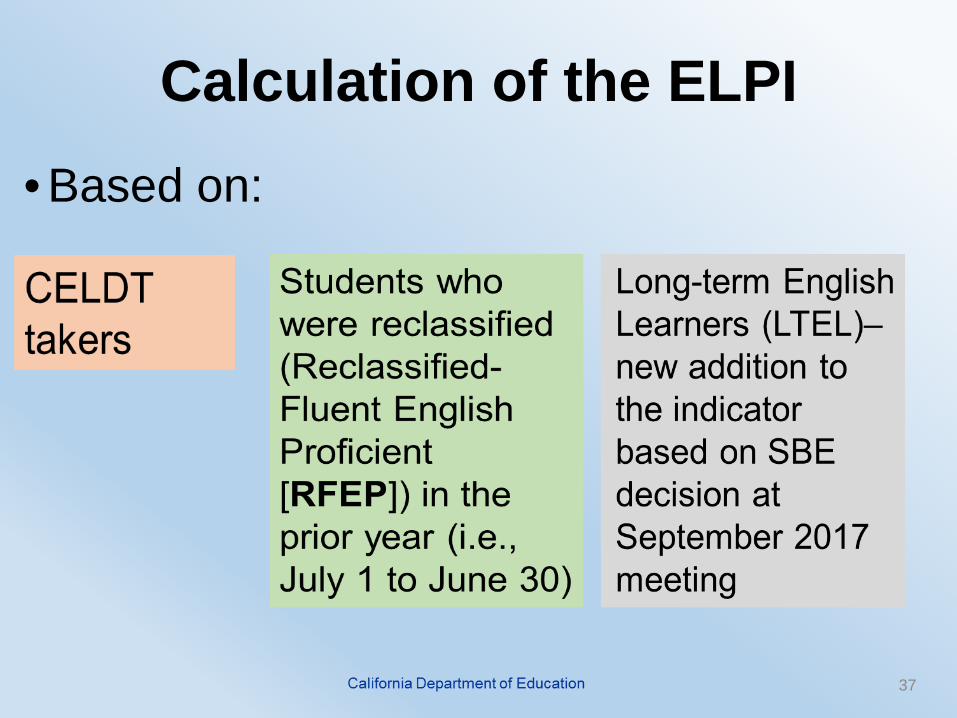
• Based on:
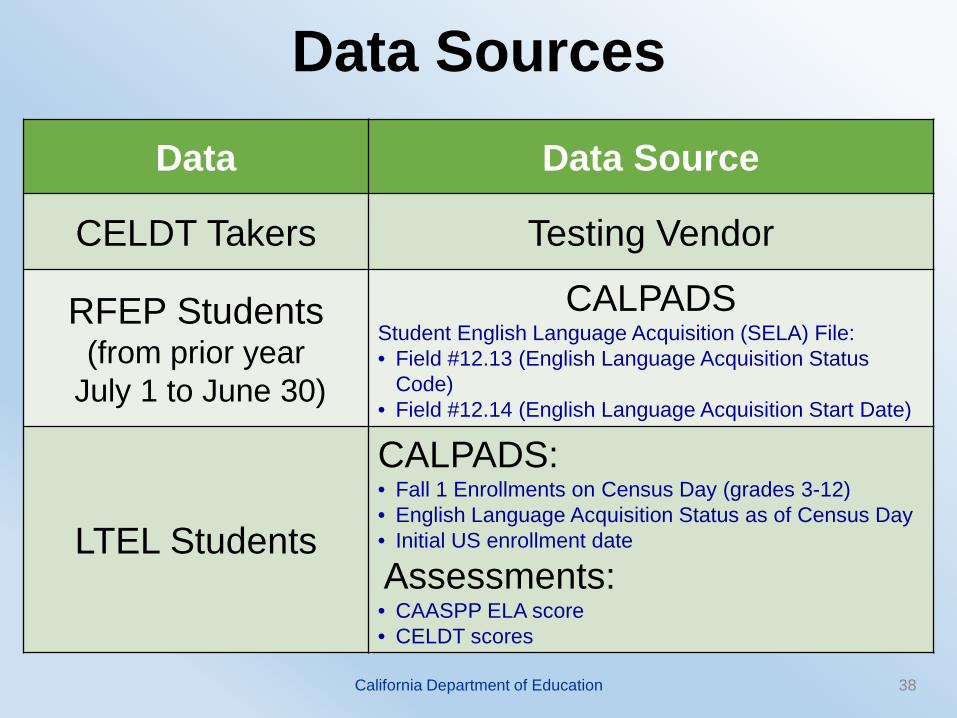
Data Sources
California Department of Education 38
Data Data Source
CELDT Takers Testing Vendor
RFEP Students(from prior year
July 1 to June 30)
CALPADSStudent English Language Acquisition (SELA) File: • Field #12.13 (English Language Acquisition Status
Code)• Field #12.14 (English Language Acquisition Start Date)
LTEL Students
CALPADS:• Fall 1 Enrollments on Census Day (grades 3-12)• English Language Acquisition Status as of Census Day• Initial US enrollment date
Assessments:• CAASPP ELA score• CELDT scores
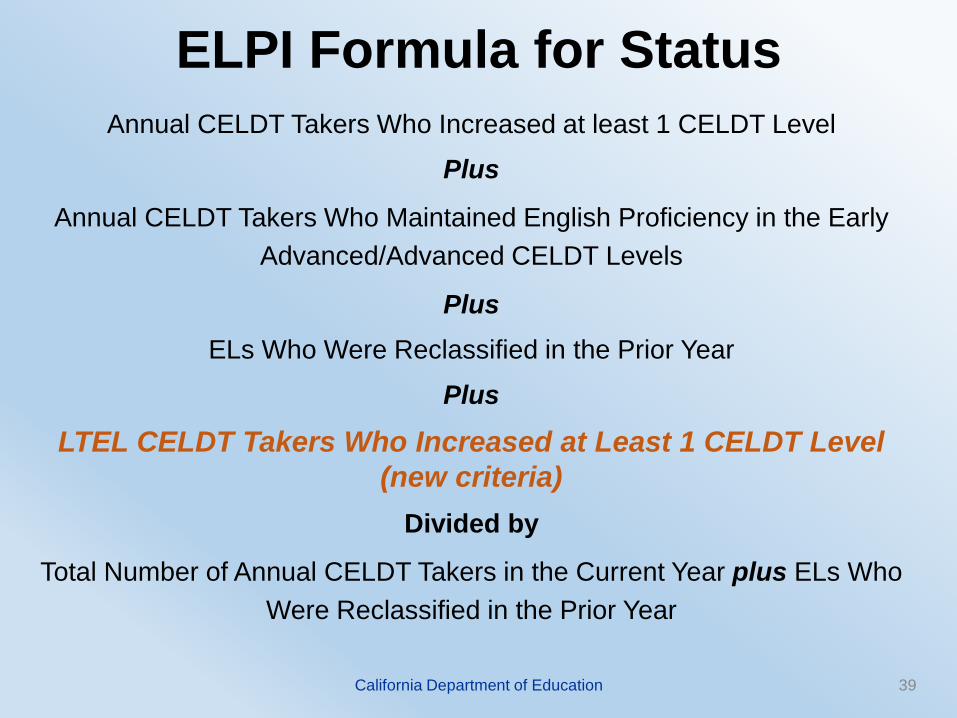
ELPI Formula for StatusAnnual CELDT Takers Who Increased at least 1 CELDT Level
Plus
Annual CELDT Takers Who Maintained English Proficiency in the Early Advanced/Advanced CELDT Levels
Plus ELs Who Were Reclassified in the Prior Year
Plus
LTEL CELDT Takers Who Increased at Least 1 CELDT Level (new criteria)
Divided by
Total Number of Annual CELDT Takers in the Current Year plus ELs Who Were Reclassified in the Prior Year
California Department of Education 39
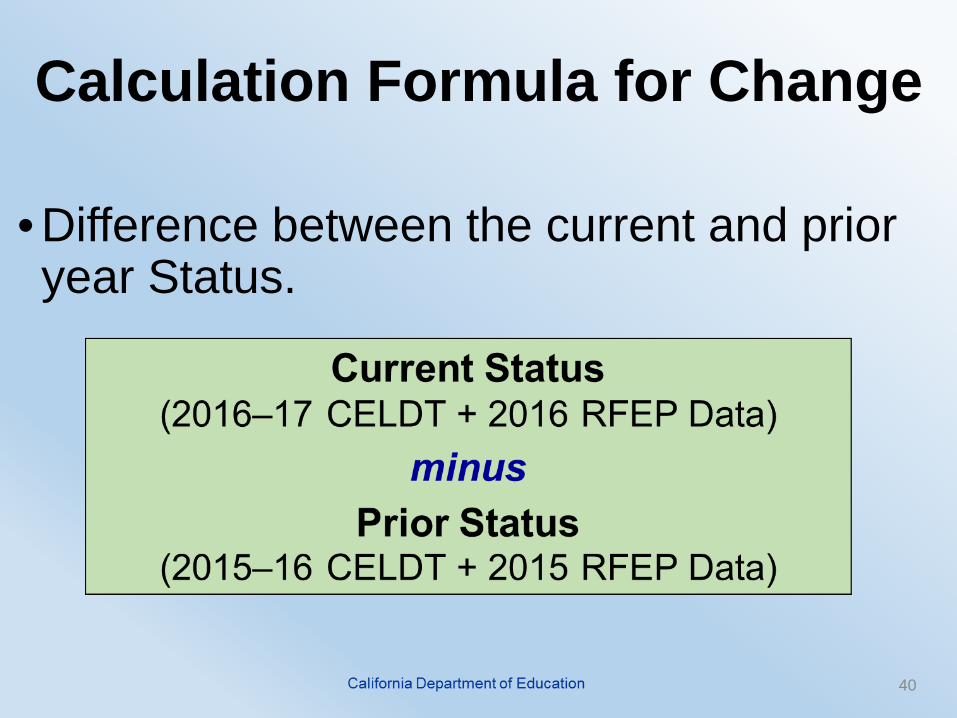
Calculation Formula for Change
40
• Difference between the current and prior year Status.
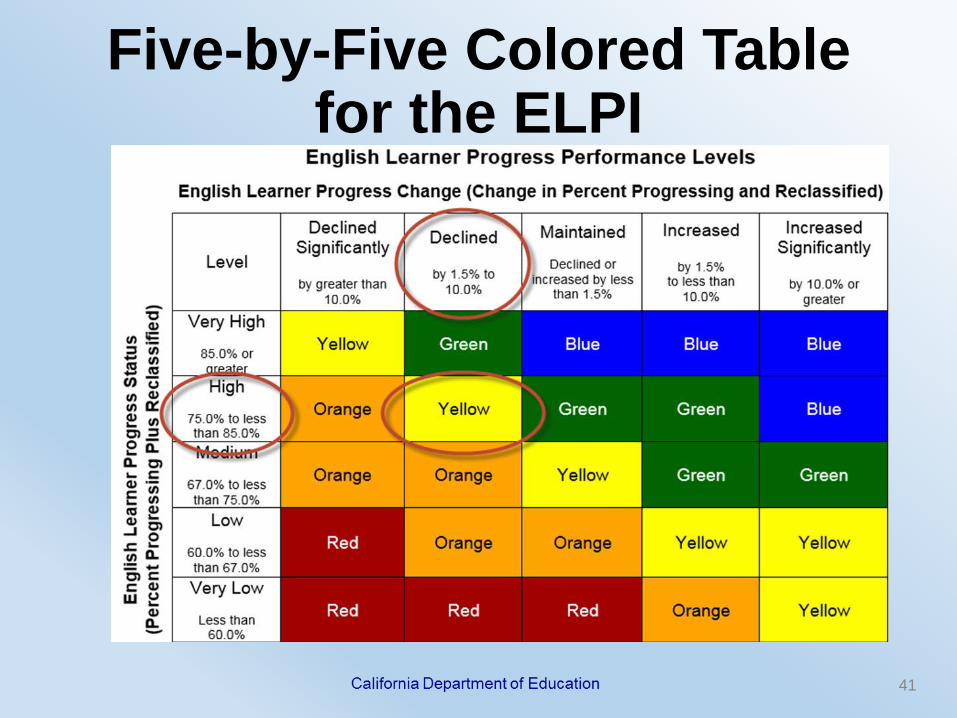
Five-by-Five Colored Table for the ELPI
41
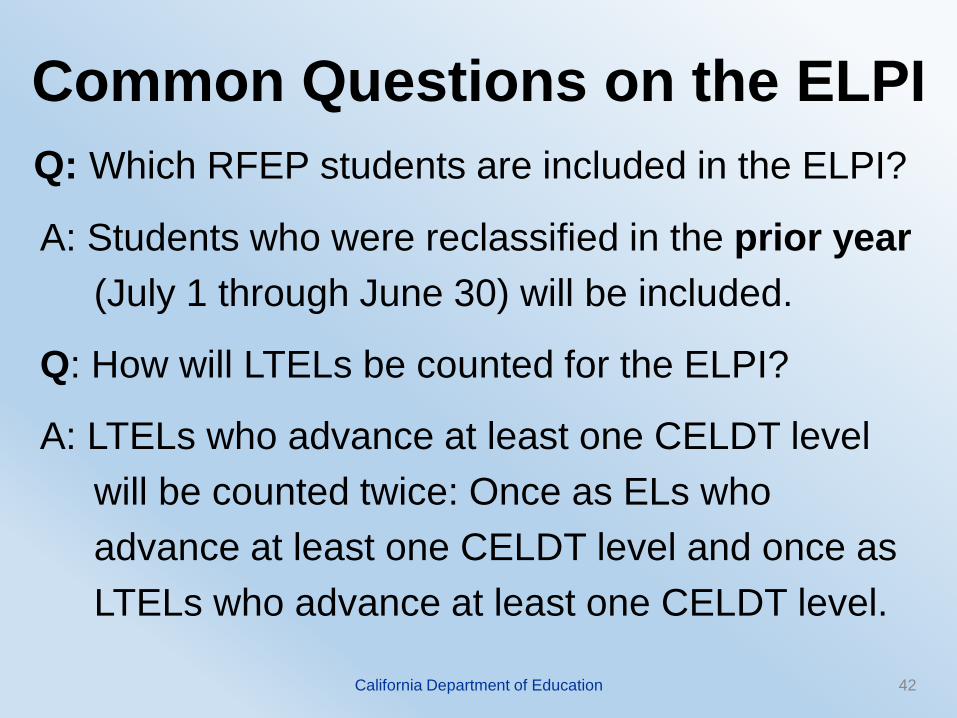
Common Questions on the ELPIQ: Which RFEP students are included in the ELPI?
A: Students who were reclassified in the prior year (July 1 through June 30) will be included.
Q: How will LTELs be counted for the ELPI?
A: LTELs who advance at least one CELDT level will be counted twice: Once as ELs who advance at least one CELDT level and once as LTELs who advance at least one CELDT level.
California Department of Education 42
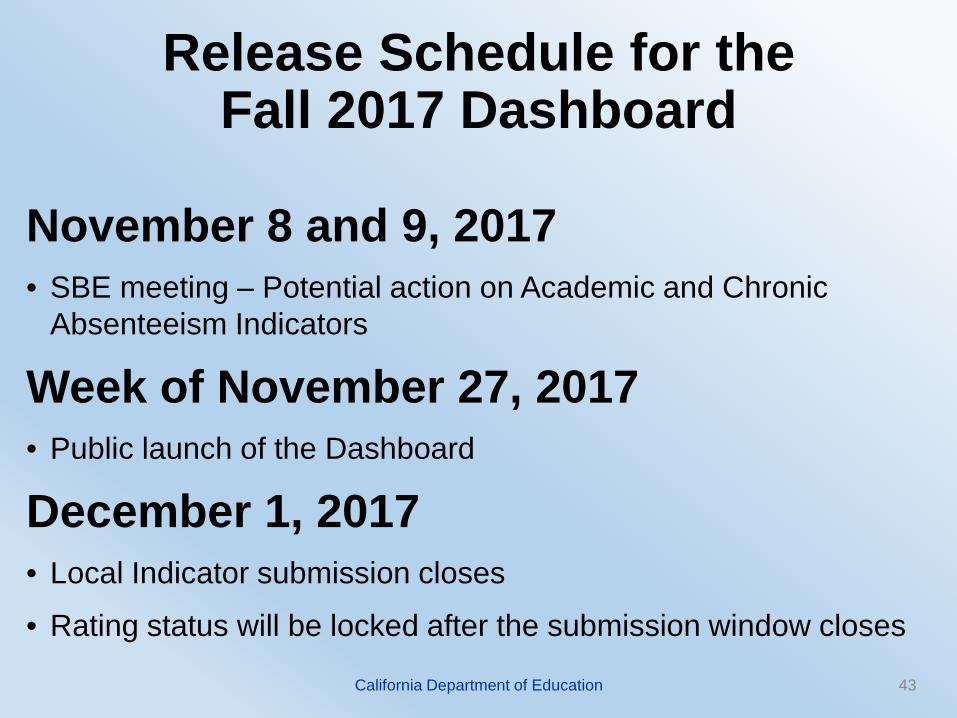
Release Schedule for the Fall 2017 Dashboard
November 8 and 9, 2017• SBE meeting – Potential action on Academic and Chronic
Absenteeism Indicators
Week of November 27, 2017• Public launch of the Dashboard
December 1, 2017• Local Indicator submission closes
• Rating status will be locked after the submission window closes
43California Department of Education
44
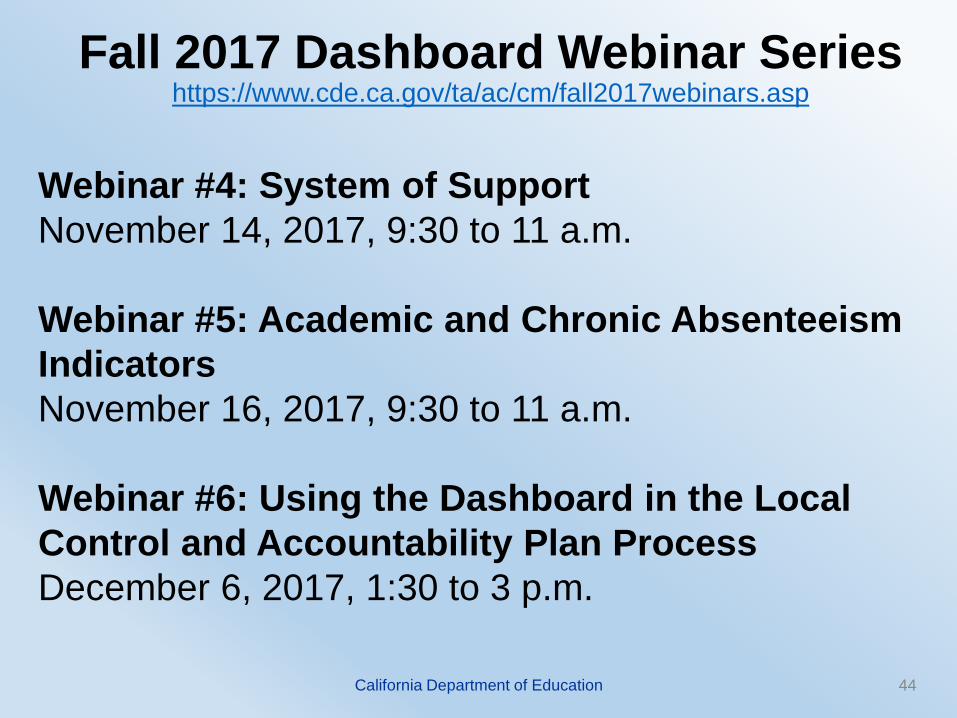
Fall 2017 Dashboard Webinar Serieshttps://www.cde.ca.gov/ta/ac/cm/fall2017webinars.asp
California Department of Education
Webinar #4: System of SupportNovember 14, 2017, 9:30 to 11 a.m.
Webinar #5: Academic and Chronic Absenteeism IndicatorsNovember 16, 2017, 9:30 to 11 a.m.
Webinar #6: Using the Dashboard in the Local Control and Accountability Plan ProcessDecember 6, 2017, 1:30 to 3 p.m.
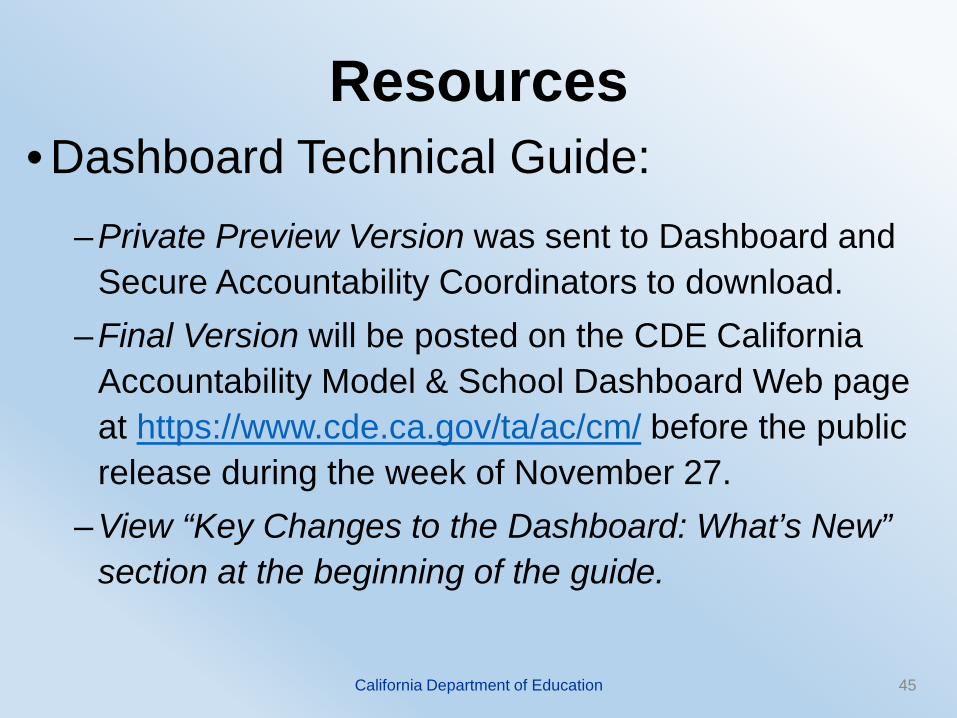
–Private Preview Version was sent to Dashboard and Secure Accountability Coordinators to download.
–Final Version will be posted on the CDE California Accountability Model & School Dashboard Web page at https://www.cde.ca.gov/ta/ac/cm/ before the public release during the week of November 27.
–View “Key Changes to the Dashboard: What’s New” section at the beginning of the guide.