72
California Senior Community Service Employment Program State Plan Modification 2018 Program Years 2016-19 (Stand-Alone)
California Senior Community Service
Employment Program State Plan Modification
2018
Program Years 2016-19 (Stand-Alone)
California SCSEP State Plan Modification PY 2016-19 California Department of Aging
Page 2 of 33
Acknowledgments The California Department of Aging (CDA), Senior Community Service Employment Program (SCSEP), would like to express its gratitude to all of those who contributed to crafting the California SCSEP State Plan (State Plan). Contributors included the National SCSEP grantees operating in California, Area Agencies on Aging (AAA), local SCSEP projects, the CDA Data Team, and other workforce entities.
CDA acknowledges the California Labor and Workforce Development Agency for providing the tools and resources necessary to enable CDA to identify workforce priorities for California’s SCSEP eligible workers. In addition, special thanks go to the California Employment Development Department (EDD), Labor Market Information Division (LMID), whose contributions were essential to this planning effort.

California SCSEP State Plan Modification PY 2016-19 California Department of Aging
Page 3 of 33
CONTENTS PAGE Section 1 Overview of SCSEP in California and State Plan 4 Section 2 Economic Projections and Impact 5 • State Long-term Projections for Jobs in Industries and
Occupations 5
• Strategic Training Plan for Participants to be Placed in Unsubsidized Employment
9
• State Current and Projected Employment Opportunities for SCSEP Participants
10
Section 3 Service Delivery and Coordination 13 • Actions and Coordination with Other Programs 13 • Long-Term Strategy to Engage Employers to Place
Participants in Unsubsidized Employment 16
• Strategy for Serving Minorities 16 • Community Service Needs and Locations 17 • Design Improvement of SCSEP Services to Meet Goals 18 • Strategy for Continuous Improvement in Entered Employment
Level of Performance 20
Section 4 Location and Population Served, Including Equitable Distribution 21 • Localities and Populations Where Projects are Most Needed 21 • Equitable Distribution Changes from Prior Year 23 • Equitable Distribution Imbalances and Corrective Steps 24 • State’s Long-Term Strategy for Achieving Equitable
Distribution 28
• Ratio of Eligible Individuals in Each County and State Total Eligibility Population
29
• Relative Distribution of Eligible Individuals 31 • Avoidance of Disruption of Service 33 Appendices Appendix A: CDA SCSEP Area Agency on Aging Sub-Grantee
Directory Appendix B: National SCSEP Grantees Operating in California Directory Appendix C: Governor Delegation of Authority Appendix D: Demographic and Labor Market Profile of Californians Age 55 and Older Appendix E: California Area Agencies on Aging Directory Appendix F: California Frontier, Rural and Urban Defined Areas Appendix G: Equitable Distribution (ED) Charts Appendix H: SCSEP Eligible Population Characteristics for Californians Age 55 and Older Appendix I: California Population Aged 55 and Over – Race/Ethnicity by County Appendix J: Public Notification and Comments

California SCSEP State Plan Modification PY 2016-19 California Department of Aging
Page 4 of 33
Section 1: Overview of the Senior Community Service Employment Program and Purpose of the State Plan The Senior Community Service Employment Program (SCSEP) is the only federally mandated job training program serving low-income workers age 55 years and older. SCSEP is authorized under the Older Americans Act (OAA) and administered by the U.S. Department of Labor, Employee and Training Administration (USDOL/ETA). The Government Accountability Office has identified SCSEP as one of only three federal workforce programs with no overlap or duplication. SCSEP’s 50-year success record stems from its dual purpose as a training program for low-income older workers and a source of subsidized staff trainees for community-based organizations. USDOL/ETA distributes SCSEP funds to 19 national SCSEP grantees and 56 state and territorial grantees. The national SCSEP grantees operate across multiple state jurisdictions and receive 78 percent of SCSEP federal funds. State and territorial SCSEP grantees receive the remaining 22 percent of SCSEP federal funds. Program-eligible older workers must be residents of California, 55 years of age or older, unemployed, and have total annual family income that does not exceed 125 percent of the federal poverty guidelines, currently $15,175 for an individual. Service priority is given to individuals meeting one or more of the following criteria:
o Is a veteran or a spouse of a veteran o Is 65 years of age or older o Has a disability o Has limited English proficiency o Has low literacy skills o Resides in a rural area o Has low employment prospects o Has failed to find employment after utilizing services provided under Title I
of the Workforce Innovation and Opportunities Act (WIOA) o Is homeless or at risk for homelessness
Eligible individuals receive part-time, subsidized job training through community service assignments (CSA) at non-profit organizations or governmental entities. The California Department of Aging (CDA) administers the State SCSEP grantee program, contracting with 14 Area Agencies on Aging (AAA) to provide SCSEP services (Appendix A). In addition to CDA, the following six national SCSEP grantees provide SCSEP services in California (Appendix B):

California SCSEP State Plan Modification PY 2016-19 California Department of Aging
Page 5 of 33
• Asociacion Nacional Pro Personas Mayores (ANPPM) • National Asian Pacific Center on Aging (NAPCA)
o Regular Grant o Set-Aside Grant1
• National Council on Aging (NCOA) • National Indian Council on Aging (NICOA)
o Set-Aside Grant1 • National Older Worker Career Center (NOWCC) • SER – Jobs for Progress National, Inc. (SER)
The California SCSEP State Plan Modification PY 2016 -2019 (State Plan Mod) describes how SCSEP and its partners meet the skills training, supportive services, and unsubsidized employment needs of eligible older workers. In addition, the State Plan Mod explains the roles SCSEP and its partners play in the California workforce development system as they relate to community service and private employment. It is the blueprint for preparing SCSEP participants for appropriate employment opportunities in industry sectors projecting growth within the State. The State Plan Mod covers the period April 9, 2018 through June 30, 2020. The OAA and federal regulations require the governor of each state to develop a strategic four-year State Plan in collaboration with the national SCSEP grantees, the aging network, and workforce entities operating within their state. Because CDA is California’s designated State Unit on Aging (SUA), Governor Edmund G. Brown Jr. delegated authority to Lora Connolly, CDA Director, to submit the State Plan on his behalf to USDOL/ETA. (Appendix C) Section 2: Economic Projections and Impact
• State Long-term Projections for Jobs in Industries and Occupations
According to the American Community Survey (ACS), California’s population totaled 37.6 million in 2014. The number of Californians age 55 and older totaled 9.3 million, comprising one quarter (24.7 percent) of the state’s total population. The population of Californians age 55 and older can be further broken down as follows: 4.4 million were age 55 through 64, 2.8 million were 65 through 74, and 2.1 million were age 75 and older. Figure 1 shows the age distribution of California’s total and working age populations.
1 The State Plan Mod will not address NAPCA or NICOA set-aside grants because regulations exempt them from the State planning process [20 CFR 641.320(b)].

California SCSEP State Plan Modification PY 2016-19 California Department of Aging
Page 6 of 33
Figure 1
Source: U.S. Census Bureau, American Community Survey, 2014. (Appendix D – LMID report, Demographic and Labor Market Profile of Californians Age 55 and Older.)
In 2014, older workers made up a much larger share of California’s eligible workforce, or the working age population age 16 and over, as compared to previous years. Nearly three out of every 10 (31.2 percent) working age Californians were age 55 and older in 2014. The share of older individuals in California’s working age population has grown over time. According to the U.S. Census Bureau’s Current Population Survey of Households (CPS) those age 55 and older comprised less than one-quarter (22.6 percent) of California’s working age population in 1991. The increasing share of older workers in the working age population reflects the aging of the baby boom generation. In 1991, less than one in 10 (9.5 percent) working age Californians was age 55 through 64. In 2014, nearly one of every seven (14.7 percent) working age Californians was age 55 through 64. The wave of baby boomers reaching retirement age will continue to grow in the near future. Figure 2 illustrates the employment of older working Californians in 2014 in the 12 industry sectors that are used by the CPS. The largest concentration of older working Californians was in the educational and health services sector, which employed over one-fifth (22.9 percent) of Californians age 55 and older, followed by the professional and business services (15.0 percent of older workers), and wholesale and retail trade (11.3 percent) sectors. These three sectors combined employed about half (49.2 percent) of older Californians in 2014.
Age 0-15 20.0%
Age 16-24 12.7%
Age 25-34 15.0% Age 35-44
13.7%
Age 45-54 13.8%
Age 55 and older
24.9%
California's Total Population in 2014
Age 16-24 15.8%
Age 25-34 18.7%
Age 35-44 17.1%
Age 45-54 17.2%
Age 55 and older
31.2%
California's Working Age Population in 2014

California SCSEP State Plan Modification PY 2016-19 California Department of Aging
Page 7 of 33
Figure 2
Source: U.S. Census Bureau, Current Population Survey of Households, 2014. (Appendix D – LMID report, Demographic and Labor Market Profile of Californians Age 55 and Older)
Table 1 illustrates twenty occupations that will employ the largest number of older workers in California. CDA and the national SCSEP Grantees with operations in California (statewide SCSEP network) are training participants through their CSA to enter the occupations highlighted in the table.
Table 1 Twenty Occupations That Employed the Most Older Working Californians in 2014
Occupation Number
Miscellaneous Managers 139,500 Personal Care Aides 97,600 Secretaries and Administrative Assistants 88,600
Elementary and Middle School Teachers 88,300 Retail Salespersons 84,200 Driver/Sales Workers and Truck Drivers 81,700 Registered Nurses 79,600 Janitors and Building Cleaners 71,100 First-Line Supervisors of Retail Sales Workers 64,800 Chief Executives and Legislators 61,300 Accountants and Auditors 60,500 Maids and Housekeeping Cleaners 55,000 Lawyers, and Judges, Magistrates, and Other Judicial Workers 51,100 Real Estate Brokers and Sales Agents 49,100 Bookkeeping, Accounting, and Auditing Clerks 49,000
Educational and Health Services, 904,800, 22.9%
Professional and Business Services,
591,800, 15.0%
Wholesale and Retail Trade, 447,600,
11.3% Manufacturing, 425,900, 10.8%
Financial Activities, 306,200, 7.7%
Other services, 235,500, 6.0%
Construction, 232,600, 5.9%
Leisure and Hospitality, 212,200,
5.4%
Transportation and Utilities, 211,500,
5.3%
Public Administration, 200,600, 5.1%
Information, 91,500, 2.3%
Agriculture, 87,500, 2.2%
Mining, 6,500, 0.2%
Industry Sector Employment of Older Working Californians Age 55 and Over in 2014
(Annual Average; Number of Workers; Percent of all Older Workers)

California SCSEP State Plan Modification PY 2016-19 California Department of Aging
Page 8 of 33
Occupation Number Postsecondary Teachers 48,500 Office Clerks, General 39,200 Miscellaneous Agricultural Workers, Including Animal Breeders 38,400 Grounds Maintenance Workers 38,100 Customer Service Representatives 37,700
Source: U.S. Census Bureau, American Community Survey, 2014. (Appendix D - LMID report, Demographic and Labor Market Profile of Californians Age 55 and Older) High-demand occupations require varied levels of expertise and have training requirements ranging from on-the-job employer training for entry-level wholesale trade occupations to advanced training coupled with a bachelor’s degree or higher for occupations in professional, scientific, and technical service industries. Figure 3 displays the 10 occupational groups that employed the largest numbers and shares of working Californians age 55 and older in 2014. Together, these 10 occupations employed nearly three-quarters (74.7 percent) of California’s working older workers in 2014.
Figure 3
Source: U.S. Census Bureau, American Community Survey, 2014. (Appendix D – LMID report, Demographic and Labor Market Profile of Californians Age 55 and Older)
179,900; 4.9%
197,600; 5.4%
198,400; 5.4%
205,500; 5.6%
214,100; 5.8%
218,600; 5.9%
241,700; 6.6%
379,800; 10.3%
450,000; 12.2%
463,100; 12.6%
0 200,000 400,000 600,000
Building, Grounds Cleaning and Maintenance Occs.
Personal care andService Occs.
Transportation and Material Moving Occs.
Production Occs.
Business and FinancialOperations Occs.
Healthcare Practitionerand Technical Occs.
Education, Training,and Library Occs.
Sales and Related Occs.
Office and AdministrativeSupport Occs.
Management Occs.
Older Workers By Occupational Group
Occ
upat
iona
l Gro
up (O
ccs.
)
The Ten Occupational Groups that Employed the Largest Number of Older California Workers Age 55 and Over in 2014
(Annual Average Data; Number of Older Workers; Percent of All Older Workers)

California SCSEP State Plan Modification PY 2016-19 California Department of Aging
Page 9 of 33
Nearly two-fifths (38.3 percent) of older workers in California were employed in professional, management, educational, business, or financial occupations. Management occupations employed the largest number and share (12.6 percent) of older California workers, followed closely by office and administrative support occupations (12.2 percent). The only other occupational group with an employment share of at least 10 percent and which employed more than 350,000 older workers was sales and related occupations (10.3 percent). These three occupational groups combined employed nearly 1.3 million older workers in 2014, or more than one-third (35.1 percent) of all older workers. Additional occupational groups employed between 4.9 percent and 6.6 percent of older Californians: education, training, and library occupations (6.6 percent); healthcare practitioner and technical occupations (5.9 percent); business and financial operations occupations (5.8 percent); production occupations (5.6 percent); transportation and material moving occupations (5.4 percent); personal care and service occupations (5.4 percent); and building and grounds clearing and maintenance occupations (4.9 percent). As a group, these seven occupational groups employed two-fifths (39.5 percent) of older California workers, or nearly 1.5 million workers age 55 and older. The 12 remaining occupational groups employed the remaining one-quarter of older workers, or 932,300 workers in total.
• Strategic Training Plan for Participants to be Placed in Unsubsidized
Employment In order to maximize SCSEP participant placement in unsubsidized employment in high demand jobs, the statewide SCSEP network will focus their on-the-job training opportunities and host agency recruitment efforts on agencies that can provide training for the following jobs:
o Administrative Assistants o Customer Service Representatives o Drivers o Food Service Workers o General Office Clerks o Home Health Aides o Janitors and Building Cleaners o Maids and Housekeeping Cleaners o Personal Care Aides o Retail Sales Clerks

California SCSEP State Plan Modification PY 2016-19 California Department of Aging
Page 10 of 33
Many lower-paying occupations require only short-term on-the-job training. The Bureau of Labor Statistics defines short-term on-the-job training as providing the skills needed for a worker to attain competency in an occupation that can be acquired during one month or less of on-the-job experience and informal training. Training is occupation-specific rather than job-specific. As a result, skills learned can be transferred to another job in the same occupation. This on-the-job training category includes employer-sponsored training programs. Short-term on-the-job training appears to be one strategy to meet new USDOL/ETA Workforce Innovation and Opportunity Act (WIOA) and SCSEP employment performance goals. California’s statewide SCSEP network is encouraging local SCSEP projects to use short-term on-the-job training to increase performance in the Entered Employment Core Performance Measure. The USDOL/ETA Older Workers Bulletin 04-04 describes on-the-job training as “obtaining an unsubsidized job with a public or private employer that requires specific skills that are not attainable through the regular community service assignment.”
• State Current and Projected Employment Opportunities for SCSEP Participants According to the California Employment Development Department (EDD)/Labor Market Information Division (LMID) chart, California - Fastest Growing Occupations 2012-2022, the occupations that appear to match SCSEP participants’ education and training levels include the following:
o Combined Food Preparation and Serving Workers including Fast Food o Cooks o Home Health Aides o Personal Care Aides o Physical Therapist Aides o Serving Workers
These occupations require an education level of either some college, or a high school diploma or equivalent, or less than a high school education. A review of the Program Year (PY) 2014 SCSEP Performance and Results QPR (SPARQ) database shows that eighty percent of California’s SCSEP participants meet the education and/or experience requirements of these occupations. Hourly wages for the six occupations range from California’s current minimum wage of $11.00 per hour to $14.78 per hour.

California SCSEP State Plan Modification PY 2016-19 California Department of Aging
Page 11 of 33
Table 2 illustrates the required level of education and on-the-job training needed by SCSEP participants to find unsubsidized employment in the fastest growing occupations.
Table 2
California Fastest Growing Occupations
Requiring a High School Diploma or Equivalent or Less than a High School Diploma
2012-20221
SOC Code* Occupational Title
Projected Employment
2022
Percent Change
2012-2022
Education and Training Levels
Entry Level Education2
Work Experience
On-the-Job
Training3
39-9021 Personal Care Aides 587,200 51.8% 8 None ST OJT
31-1011 Home Health Aides 62,400 39.0% 8 None ST OJT
31-2022 Physical Therapist Aides 7,900 33.9% 7 None ST OJT
43-6013 Medical Secretaries 88,400 29.1% 7 None MT OJT
35-2014 Cooks, Restaurant 150,600 28.8% 8 <5 years MT OJT
35-3021
Combined Food Preparation and Serving Workers, Including Fast Food 362,400 26.7% 8 None ST OJT
35-1012
First-Line Supervisors of Food Preparation and Serving Workers 105,900 24.7% 7 <5 years None
1Employment Development Department, Labor Market Information Division, Published: September 19, 2014, http://www.labormarketinfo.edd.ca.gov/file/occproj/cal$occfastest.xlsx 2 High school diploma or equivalent is represented by number seven and less than high school is represented by number 8. 3 ST OJT means short-term on-the-job training and MT OJT means Moderate-term on-the-job training.
CDA requested that the EDD/LMID to research occupational employment patterns among older Californians using 2014 ACS data from the U.S. Census Bureau. LMID compared the occupational employment pattern of older working Californians with the cohort of low-income older workers. These workers are defined as those Californians who are 55 and older and employed, but living at or below the 125 percent poverty level.

California SCSEP State Plan Modification PY 2016-19 California Department of Aging
Page 12 of 33
Of the nearly 3.7 million Californians age 55 and older who worked, 272,000 (7.4 percent) lived at or below the 125 percent poverty level. The occupational distribution of these workers was very different from that of older workers generally. Figure 4 shows the 10 occupational groups that employed the largest numbers and share of low-income older workers in California in 2014. These 10 occupational groups employed four out of every five (80.3 percent) low-income working older Californians in 2014.
Figure 4
Source: U.S. Census Bureau, American Community Survey, 2014. (Appendix D – LMID report, Demographic and Labor Market Profile of Californians Age 55 and Older)
Of the ten occupations where the largest numbers of low-income older workers are currently employed, the following occupational subgroups represent the typical SCSEP CSA in which participants are placed:
o Office and Administrative Support Administrative Assistants Medical Secretaries Office Clerks
12,000; 4.4%
12,700; 4.7%
15,200; 5.6%
17,400; 6.4%
20,500; 7.5%
21,400; 7.9%
23,600; 8.7%
27,400: 10.1%
32,800; 12.0%
35,700: 13.1%
0 10,000 20,000 30,000 40,000 50,000
Farming, Fishing, andForestry Occs.
Management Occs.
Construction andExtraction Occs.
Food Preparation andServing-Related Occs.
Production Occs.
Transportation andMaterial Moving Occs.
Office and AdministrativeSupport Occs.
Sales and Related Occs.
Building, Grounds Cleaning and Maintenance Occs.
Personal Care andService Occs.
Number and Share of Low Income Older Workers
Occ
upat
iona
l Gro
ups
(Occ
s.)
Ten Largest Occupational Groups for Californians Age 55 Years and Over Living At or Below the 125 Percent Poverty Level in 2014
(Annual Average Data; Number of Workers, Percent of Total)

California SCSEP State Plan Modification PY 2016-19 California Department of Aging
Page 13 of 33
o Sales and Related
Retail Sales Clerk Cashiers Customer Service
o Food Preparation and Serving Combined Food Preparation and Serving Workers including Fast
Food Cooks Serving Workers
o Building, Grounds and Maintenance Janitor Landscaping
o Personal Care and Services Home Health Aides Personal Care Aides Physical Therapist Aides
Section 3: Service Delivery and Coordination
• Actions and Coordination with Other Programs The statewide SCSEP network includes CDA and the national SCSEP grantees operating in California. This network coordinates with local Workforce Development Boards (LWDB) operating the American Job Centers (AJC) or One Stop Centers. WIOA regulations require the statewide SCSEP network to execute a Memorandum of Understanding (MOU) with the LWDB because SCSEP is a WIOA partner. The USDOL/ETA has acknowledged integration between WIOA and WIOA partners is one of their main goals, including SCSEP.
The MOU identifies the core services the LWDB will provide to SCSEP participants in their areas and the resources, including monetary resources, the local SCSEP project will provide to the LWDB. The WIOA partner integration in California is led by the California Workforce Development Board (CWDB) and EDD. CWDB and EDD provided CDA with the State WIOA MOU partner guidance1. EDD’s comprehensive guidance explained WIOA partner cost-sharing expectations for AJC services. The guidance established the EDD’s view of the infrastructure cost-sharing expectations of the MOU. CDA forwarded the EDD directive to the CDA sub-grantees and to the statewide SCSEP network.
1
EDD Directive WSD16-09, October 14, 2016, WIOA Phase II Memorandums of Understanding Comprehensive AJCCs: http://www.edd.ca.gov/jobs_and_training/pubs/wsd16-09.pdf

California SCSEP State Plan Modification PY 2016-19 California Department of Aging
Page 14 of 33
Regarding the new WIOA MOU requirements, CDA SCSEP projects expressed concerns with the overall process and the negotiations challenges they experienced with the LWDB about infrastructure costs. However, the National SCSEP grantees operating in the California reported that they did not have these issues during their MOU and infrastructure cost-sharing negotiations. In fact, some of the National SCSEP grantees were able to negotiate a minimal cost with the LWDB.
Other WIOA changes include removing the requirement for the LWDB to have a SCSEP representative on their Board, as previously required with the Workforce Investment Act. Without representation on the LWDB, it has become problematic for SCSEP to advocate for older workers. The statewide SCSEP network is developing other strategies to conduct advocacy and outreach to the LWDB to ensure older workers concerns are addressed. The AJCs provide basic core services to registered SCSEP participants. AJC core services include basic computer classes, employment search techniques, resume development, interview practice sessions, and access to the CalJOBs employment search database. These core services promote the participant confidence in their ability to find unsubsidized employment.
CDA is the SUA administering OAA services through contracts with California’s 33 AAAs (Appendix E) and coordinates SCSEP activities through SCSEP contracts with many of these agencies. AAAs collaborate with the State’s aging network to develop a community-based system to serve adults age 60 and older and their families. AAAs’ public planning processes include analyses of local trends and needs. CDA encourages the state SCSEP network to work with the AAAs to exchange ideas, to provide technical assistance on supportive services for older adults, and to refer SCSEP participants who are eligible for OAA services. These services include information and assistance, transportation, family caregiver support, respite, nutrition, legal assistance, and long-term care ombudsman.
According to the California State Plan on Aging – 2017-2021, CDA’s vision and mission aligns well with statewide SCSEP network goals. CDA envisions every Californian having the opportunity to enjoy wellness, longevity, and quality of life in strong, healthy communities. Its mission is to promote the independence and well-being of older adults, adults with disabilities, and families through:

California SCSEP State Plan Modification PY 2016-19 California Department of Aging
Page 15 of 33
o Access to information and services to improve the quality of their lives o Opportunities for community involvement o Support for family members providing care o Collaboration with other state and local agencies
CDA sub-grantees are mainly located in urban areas. However, the national SCSEP grantees operating in the State’s rural areas are coordinating with the LWDB in these areas. SCSEP projects located in rural areas have more challenges because employment opportunities are not as extensive as in urban areas. (Appendix F) Furthermore, older individuals living in rural areas do not have access to the public transportation necessary for them to take advantage of the employment and training opportunities available in larger population centers. Transportation access issues are compounded by the time and/or distance involved in traveling between the older individual’s home and job training site, high fuel and vehicle maintenance costs, and the ever increasing demand for limited transportation services by a growing population of older adults. One possible solution to these challenges is mobility management, which manages transportation resources through a systems approach that emphasizes:
o Movement of people instead of vehicles. o Customer needs and the discrete travel needs of individual consumers. o Focus on the entire trip, not just a portion of the trip to improve the
effectiveness, efficiency, and quality of the travel services delivered. o Improvements to the information that is available about transportation
services. Mobility management programs are varied and can include volunteer drivers, subsidized taxi fares, public transit passes, mobility training, vehicle repair, or gas vouchers. SCSEP projects may find that Uber or Lyft is a viable solution to transportation issues in some areas. CDA has worked with AAAs to develop a Mobility Management Implementation Plan. This plan details how AAAs can reduce the challenges associated with limited mobility and may assist SCSEP grantees to support program participants in meeting their transportation needs.
Rural SCSEP projects are aware of these challenges and work to overcome them through collaboration with the LWDB, recruitment of host agencies in remote areas, and providing supportive services.
California SCSEP State Plan Modification PY 2016-19 California Department of Aging
Page 16 of 33
• Long-term Strategy to Engage Employers to Place Participants in Unsubsidized Employment Local SCSEP projects train participants to help them develop the skills and experience necessary to be competitive in the current labor market. They have established cooperative relationships between the local AJC, host agencies, and public and private employers. Coordination and co-location of services at the AJCs helps to identify suitable job openings in high-demand occupations. Local projects make every effort to establish rapport with employers who offer reliable career pathways and are willing to develop and maintain working partnerships.
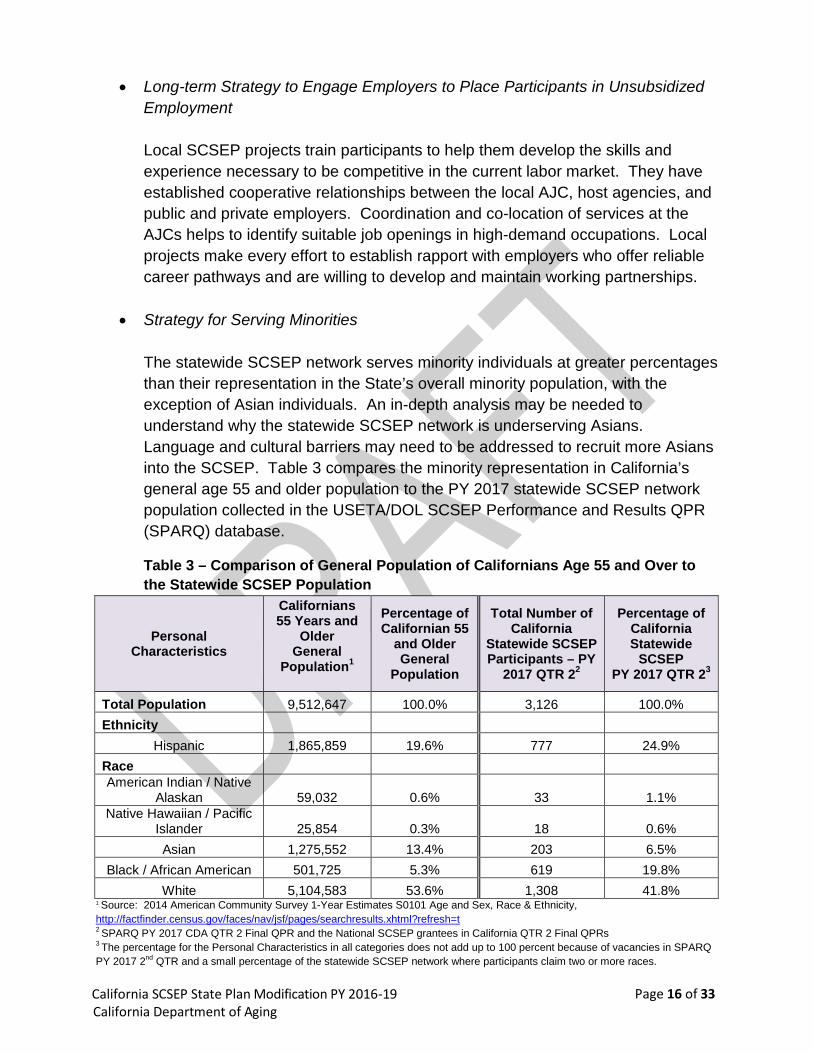
• Strategy for Serving Minorities The statewide SCSEP network serves minority individuals at greater percentages than their representation in the State’s overall minority population, with the exception of Asian individuals. An in-depth analysis may be needed to understand why the statewide SCSEP network is underserving Asians. Language and cultural barriers may need to be addressed to recruit more Asians into the SCSEP. Table 3 compares the minority representation in California’s general age 55 and older population to the PY 2017 statewide SCSEP network population collected in the USETA/DOL SCSEP Performance and Results QPR (SPARQ) database.
Table 3 – Comparison of General Population of Californians Age 55 and Over to the Statewide SCSEP Population
Personal Characteristics
Californians 55 Years and
Older General
Population1
Percentage of Californian 55
and Older General
Population
Total Number of California
Statewide SCSEP Participants – PY
2017 QTR 22
Percentage of California Statewide
SCSEP PY 2017 QTR 23
Total Population 9,512,647 100.0% 3,126 100.0% Ethnicity
Hispanic 1,865,859 19.6% 777 24.9% Race
American Indian / Native Alaskan 59,032 0.6% 33 1.1%
Native Hawaiian / Pacific Islander 25,854 0.3% 18 0.6% Asian 1,275,552 13.4% 203 6.5%
Black / African American 501,725 5.3% 619 19.8% White 5,104,583 53.6% 1,308 41.8%
1 Source: 2014 American Community Survey 1-Year Estimates S0101 Age and Sex, Race & Ethnicity, http://factfinder.census.gov/faces/nav/jsf/pages/searchresults.xhtml?refresh=t 2 SPARQ PY 2017 CDA QTR 2 Final QPR and the National SCSEP grantees in California QTR 2 Final QPRs 3 The percentage for the Personal Characteristics in all categories does not add up to 100 percent because of vacancies in SPARQ PY 2017 2nd QTR and a small percentage of the statewide SCSEP network where participants claim two or more races.

California SCSEP State Plan Modification PY 2016-19 California Department of Aging
Page 17 of 33
• Community Service Needs and Locations The statewide SCSEP network and their partner agencies identify community service needs through several means. The local projects identify these needs by participating in community needs assessments, information and referral networking, and local planning processes. They also review workforce data to determine which community services might also provide training that is transferable to businesses with high-growth employment opportunities. Project directors often live and work in the communities they serve and have direct knowledge of both participants’ abilities and interests and community employers’ unmet needs. In some areas of California, SCSEP staff serve on the LWDB. The statewide SCSEP network has provided training to project directors to develop their skills in implementing an effective employer outreach program. Project directors market SCSEP services and the skills of job-ready participants to private employers and host agencies, thereby increasing the number of participant exits to unsubsidized employment. Some projects also are working on establishing national employer relationships. California’s SCSEP grantees have established cooperative agreements among the local AJCs, community service agencies, and non-profit organizations. Coordination and co-location of services at the AJCs helps to identify suitable job openings. Every effort is made to establish rapport with employers who offer reliable career pathways and are willing to develop and maintain a working partnership. The local SCSEP project director is responsible for ongoing recruitment of host agency sites. They make SCSEP community outreach contacts by networking at local job fairs, health fairs, senior centers, the Social Security Administration, State and county employers, and non-profit organizations. Host sites offering job placements in retail sales, technical occupations, managerial occupations, food preparation, and healthcare are preparing participants for unsubsidized employment in these occupations. The statewide SCSEP network is continuously refining its strategies for job development to guide employer outreach and participant job readiness. SCSEP projects attend older adult collaborative meetings to network with local employers and recruit host agencies. Other projects use the local AAA

California SCSEP State Plan Modification PY 2016-19 California Department of Aging
Page 18 of 33
Information and Assistance resource guide to make contacts with potential host agencies. Still others use the newspaper, word of mouth, community meetings, and the Chamber of Commerce to recruit host agencies. The statewide SCSEP network continuously refines its expertise on the basic elements of job development including skills assessment, resume writing, Individual Employment Plan development, computer training, job placement, and retention. SCSEP accomplishes this through workshops, video conferences, and one-on-one coaching of paid and participant staff. While assisting SCSEP participants to secure unsubsidized employment is one important program objective, the statewide SCSEP network recognizes the importance of community service for those who may not find unsubsidized employment. Participants value the self-esteem and the social interactions they receive in their community service assignment. The statewide SCSEP network recognizes the value of community service. The total number of community service hours for the statewide SCSEP network is tallied in the SPARQ database. For example, in PY 2016 the total number of community service hours provided nationally by all SCSEP grantees was 33,458,196 hours. In that same year, the statewide SCSEP network provided 1,885,002 community service hours or 5.6 percent of the total nationwide community service hours. Participant training hours support social services and other services provided in communities throughout the State. Community service placements are a win/win opportunity for both the host agencies that benefit from the participants’ assistance in providing local services and the participants themselves whose placement gives them the training and work experience needed to find an unsubsidized position.
• Design Improvement of SCSEP Services to Meet Goals In PY 2016, the CWDB made the decision to submit a WIOA Integrated State Plan to the USDOL/ETA instead of a WIOA Combined State Plan. This decision impacted CDA to continue to submit a stand-alone SCSEP State Plan to USDOL/ETA. CDA recently contacted CWDB to request the inclusion of SCSEP in the next WIOA State Plan scheduled in PY 2020. One major benefit of the statewide SCSEP network being included in the WIOA Combined State Plan is SCSEP information would reach a wider number of employment based programs and training stakeholders in the State.

California SCSEP State Plan Modification PY 2016-19 California Department of Aging
Page 19 of 33
To begin work on the stand-alone State Plan Mod, CDA contacted the national SCSEP grantees operating in the State to solicited suggestions, ideas, and comments they thought should be included in the State Plan Mod. On March 7, 2018, CDA conducted a conference call with representatives of the national SCSEP grantees with operations in the State. The discussion focused on the State Plan Mod process. CDA provided a copy of Prep Talk: Two-Year State Plan Modification authored by Christine Shelton of the National SCSEP office, and discussed the significant changes that must be addressed in the State Plan Mod. CDA narrowed the questions of significant changes to the following areas:
1. How has the National SCSEP competition affected your organization in
California? a. Equitable Distribution? b. Disruption of services?
2. How has the WIOA integration, MOUs with LWDBs, and the required shared infrastructure costs affected your organization in California?
3. What, if any, are the challenges or positive outcomes your organization in
California has experience because of California’s high minimum wage?
4. How has the recent federal funding cuts affected your organization in California? a. How did organization handle over enrollment? b. Did your California organization experience any disruption of
SCSEP services? In a follow-up email, CDA requested responses to these questions. The National SCSEP grantees responses have been compiled and integrated into the State Plan Mod. One area impacting the statewide SCSEP network is California’s high minimum wage. The statewide SCSEP network reported that higher wages have positive effects on the participants, their budgets, and their self-esteem. However, to accommodate the higher wages, the statewide SCSEP network must adjust their projects enrollment and training hours downward to ensure funding through the end of the grant period.
As of January 2018, the State minimum wage is $11.00 per hour, with some local ordinance even higher. In comparison, the current federal minimum wage is $7.25 per hour. More challenges are ahead for the statewide SCSEP network because the California’s minimum wage will cap at $15.00 per hour by January 2021.

California SCSEP State Plan Modification PY 2016-19 California Department of Aging
Page 20 of 33
The scheduled $15.00 per hour minimum wage will reduce the number of authorized ED positions in the State by more than 50 percent. CDA’s SCSEP sub-grantees over the years have expressed difficulty justifying ever-increasing wage costs while serving fewer and fewer participants. CDA attributes the termination of three AAA SCSEP sub-grantees contracts to the higher minimum wage costs. CDA is conducting a Request for Proposal (RFP) for the three areas that include Fresno/Madera, San Mateo, and Stanislaus Counties for a total of 41 authorized positions. CDA expects the contracts for these counties to be in place by July 1, 2018. Another area affecting the statewide SCSEP network’s performance goals is the California’s “Healthy Families/Healthy Workplace Act” which requires that all employees in California receive 24 hours of annual paid sick leave. According to the California Department of Industrial Relations, which administers State labor law, SCSEP participants are beneficiaries of the paid sick leave law even though they are trainees in a federal program. CDA contacted the National SCSEP Office for guidance regarding this law. The National SCSEP Office confirmed CDA would have to abide by State law.
The high cost of workers’ compensation insurance in California is another administrative challenge facing the State SCSEP network. According to the Insurance Journal, California’s workers’ compensation rates are the most expensive in the United States: $3.48 per $100 of payroll.1 With SCSEP administrative costs fixed at 13.5 percent of the grant award, the statewide SCSEP network is trying continuously to find solutions to these challenges.
• Strategy for Continuous Improvement in Entered Employment Level of Performance The Entered Employment performance goal challenges some of CDA’s SCSEP sub-grantees. During the 2008 recession California’s unemployment rate was one of the highest in the country when compared to other states’ unemployment rates. The State unemployment rate for February 2018 is 4.5 percent2, which is still higher than the February 2018 national unemployment rate of 4.1 percent.3
Regardless, many of the CDA sub-grantees have successfully exceeded their Entered Employment performance goals. CDA staff conducted an analysis of why these CDA SCSEP sub-grantees were successful in meeting unsubsidized employment goals for their participants. Their success appears to correlate to the following:
1 Source: http://www.insurancejournal.com/news/west/2015/08/05/377607.htm 2 Source: http://www.labormarketinfo.edd.ca.gov/file/lfmonth/countyur-400c.pdf 3 Source: https://data.bls.gov/timeseries/LNS14000000
o
California SCSEP State Plan Modification PY 2016-19 California Department of Aging
Page 21 of 33
o Contracting SCSEP services directly with an AJC or One Stop Center o Forming Job Clubs for their participants o Fostering local employer relationships o Collaborating with other employment programs o Participating in Job Fairs
In PY 2014, CDA provided two regional job development trainings to the SCSEP sub-grantees. The national SCSEP grantees received invitations to attend this training as well. The Northern California Regional Training occurred March 25-26, 2015, at CDA in Sacramento. Attendees included CDA’s SCSEP sub-grantees, AARP, NICOA, and SER – Jobs for Progress. The Southern California Regional Training occurred April 8-9, 2015, at the Los Angeles County AAA. Attendees included CDA SCSEP sub-grantees, ANPPM, and NAPCA. Training topics included:
o Job Development Presentations from AARP, Sacramento Employment and Training
Agency, Sacramento County Workforce, California Indian Manpower Consortium, Jewish Family Service of San Diego, Los Angeles County WIOA Business Services, Los Angeles County CalWORKs
o Workers Compensation Presentations from the Department of Industrial Relations
o Strategies for Attaining Performance Goals o Data Validation o Open Discussion about Job Development
Section 4: Location and Population Served, Including Equitable Distribution
• Localities and Populations Where Projects are Most Needed The USDOL/ETA ensures that the provision of SCSEP services is equitable within the State through an Equitable Distribution (ED) plan, in accordance with the OAA. USDOL/ETA uses county census data and annual program within the State through an Equitable Distribution (ED) plan, in accordance with the OAA. USDOL/ETA uses county census data and annual program appropriations to calculate the allocation of authorized positions for each county in the State. The number of authorized positions is proportional to the number of eligible people in the county when compared to the eligible State population. California is divided into three main socioeconomic areas: the large urban centers located near the coast; the agricultural centers located mid-State; and,

California SCSEP State Plan Modification PY 2016-19 California Department of Aging
Page 22 of 33
the rural areas located in Northern California and along the eastern mountain counties of the State. Each of these areas has unique challenges for the statewide SCSEP network. California is the most populous state in the United States, and has the highest number of SCSEP eligible older individuals. According to 2014 ACS, more than 1,250,000 Californians were 55 years or older and had an income of 125 percent or less of the federal poverty guidelines. The 2014 ACS estimates that there are 272,000 low-income employed older Californians. Consequently, there were approximately 978,000 Californians eligible for the program in 2014. Authorized positions are needed in California’s urban areas, including Los Angeles, San Diego and the San Francisco Bay Area where, large concentrations of program-eligible minority and most-in-need individuals live. In PY 2016, there were 3,417 SCSEP authorized positions in California; this number is the total statewide SCSEP network’s authorized positions. Thirty-one percent or 1,052 of the State’s authorized positions were located in Los Angeles County, 13.8 percent or 473 of the authorized positions were located in the San Diego area including Orange County, and 13.9 percent or 478 of the authorized positions were located in the San Francisco Bay Area. The total number of authorized positions located in these three urban areas came to 2,003 or 58.6 percent of California’s authorized positions. See Appendix H to view the demographics of the State’s 58 counties. California’s agricultural regions have large populations of low-income workers, many of whom experience seasonal unemployment. SCSEP is needed in these areas because many in the eligible SCSEP population have barriers to employment that include limited English proficiency, low literacy skills, or low educational attainment. California’s agricultural areas tend to have higher unemployment rates than its affluent coastal areas. . Rural areas have an even greater need of SCSEP services because of the social isolation of older individuals living in these areas and the limited employment opportunities that are available. In addition, older individuals living in rural areas do not have access to the public transportation that would make it easier for them to take advantage of employment and training opportunities. Transportation issues are compounded by fuel costs, vehicle maintenance costs, and the time and/or distance involved in traveling between a participant’s home and the training site. Rural SCSEP projects must consider these additional factors when a participant is assigned to a host agency.

California SCSEP State Plan Modification PY 2016-19 California Department of Aging
Page 23 of 33
NOWCC and SER Jobs for Progress provide the majority of SCSEP services to the State’s rural areas. In PY 2017, the, the statewide SCSEP network served 209 SCSEP participants in rural areas or 6.7 percent of the total authorized positions in California.1 NOWCC and SER Jobs for Progress coordinate with the LWDBs in their rural areas to meet the challenges of SCSEP participants living in these remote areas. (Appendix F)
• Equitable Distribution Changes from Prior Year
During PY 2016 and into part of PY 2017 grant year, the USDOL/ETA conducted the National SCSEP Competition. This competition occurs every four years. In California, the national competition resulted in a reduction in the number of national SCSEP grantees from eight grantees to five grantees. The State lost the following national SCSEP grantees: AARP, Experience Works, and Senior Service America. These grantees provided decades of success administering SCSEP in the State: CDA applauds the service, innovation, and collaboration each one of these national SCSEP grantees provided CDA and the participants in their programs. Regarding the current five national SCSEP grantees that now form the statewide SCSEP network, NOWCC is the only new national SCSEP grantee in the State. NOWCC’s administers SCSEP in rural Northern California counties north of Sacramento, California. ANPPM, NAPCA, NCOA, and SER-Jobs for Progress received additional territories and authorized positions as a result of the National SCSEP Competition. These grantees are experienced SCSEP administrators and are respected, capable CDA partners. During the State Plan Mod conference call and in a follow-up email, CDA inquired how the National SCSEP Competition affected the statewide SCSEP networks projects with regard to ED and to disruption of services. Again, the responses from the national SCSEP grantees to these questions were positive. They did not have any disruption of services when they were transitioning into a new area because they worked with the previous grantee to ensure participants experience a seamless transfer to their programs. Their main concern was over enrollment in their new counties. The PY 2017 SCSEP federal appropriations were reduced by 8.5 percent from the previous year. To minimize the disruption of services because of federal cuts, the statewide SCSEP network immediately froze enrollment, used attrition methods, and cut participant training hours.

California SCSEP State Plan Modification PY 2016-19 California Department of Aging
Page 24 of 33
1 Total statewide SCSEP network rural participant data from SPARQ PY 2017 2nd QTR Final QPRs.
• Equitable Distribution Imbalances and Corrective Steps Historically CDA contracted exclusively with the State’s AAA sub-grantees to provide OAA services. Effective 2017, the USDOL/ETA realigned participant slots to match current census data, changing the overall equitable distribution of authorized positions in the State. The National SCSEP Competition facilitated the equitable distribution realignment. CDA and the National SCSEP Office collaborated on an Equitable Distribution Implementation Plan to ensure CDA’s equitable distribution is in alignment with the USDOL/ETA equitable distribution report. Unfortunately, several CDA sub-grantees made the decision to relinquish SCSEP because of the loss of authorized positions in their service areas. CDA is conducting an RFP to secure SCSEP providers in the areas where the CDA AAA sub-grantee relinquished their program. In PY 2017, the following 14 AAAs provide State SCSEP services:
• Division of Aging, Marin County Department of Health and Human
Services (CA005) • Alameda County Area Agency on Aging (CA009) • Sourcewise Community Resource Solutions (CA010) • San Joaquin County Department of Aging (CA011) • Fresno-Madera Area Agency on Aging (CA014) • Kings-Tulare Area Agency on Aging (CA015) • Ventura County Area Agency on Aging (CA018) • Los Angeles County Area Agency on Aging (CA019) • San Bernardino County Department of Aging & Adult Services (CA020) • County of Riverside Office on Aging (CA021) • Orange County Office on Aging (CA022) • County of San Diego Aging and Independence Services (CA023) • City of Los Angeles Department of Aging (CA025) • Stanislaus County Department of Aging and Veterans Services (CA030)
In addition, the five national SCSEP grantees with operations in California serve the following areas: • Asociacion Nacional Pro Personas Mayores (ANPPM)
o Provides SCSEP services to large urban counties with a large Hispanic presence, including Ventura, Los Angeles, Monterey, San Luis Obispo, Santa Barbara, and San Bernardino

California SCSEP State Plan Modification PY 2016-19 California Department of Aging
Page 25 of 33
• National Asian Pacific Center on Aging (NAPCA) – Regular Grant and Set-
Aside Grant o Provides SCSEP services to urban counties with a large Asian and Pacific
Islander presence including San Francisco, San Mateo, Santa Clara, Los Angeles, Sacramento, Alameda, Contra Costa, Solano, Sonoma, Napa, and Orange
• National Council on the Aging, Inc. (NCOA) o Provides SCSEP services to the San Francisco Bay Area counties of
Marin, San Francisco, San Mateo, Santa Clara, Santa Cruz, and San Benito, and the central valley counties of Fresno, Kings, Merced, and Tulare
• National Indian Council on Aging, Inc. (NICOA) – Set-Aside Grant o Provides SCSEP services to counties with a large Native American
presence, including, San Diego, Los Angeles, Riverside, and San Bernardino
• National Older Worker Career Center (NOWCC) o Provides SCSEP services to the central valley counties, the rural eastern
border counties, and the agricultural and rural counties of Northern California including El Dorado, Mono, Inyo, Del Norte, Siskiyou, Modoc, Humboldt, Trinity, Shasta, Lassen, Plumas, Tehama, Mendocino, Lake, Glenn, Butte, Yuba, Nevada, Colusa, Sutter, Yolo, and Placer
• SER – Jobs for Progress National, Inc. (SER)
o Provides SCSEP service to central valley agricultural, rural mountain, and the southern counties including, San Joaquin, Stanislaus, Amador, Calaveras, Mariposa, Madera, Kern, Los Angeles, Orange, Riverside, San Diego, and Imperial
Table 4. CDA and the National SCSEP Grantees Operating in the State Service Areas, Eligible Individuals, and Total Authorized SCSEP Positions in the Service Areas
Provider California Counties Age 55 and Over in Service Area1
Age 55 and Over & At or Below 125 Percent of
Poverty Level2
Total Authorized SCSEP Positions
in Counties3
Asociacion Nacional Pro
Personas Mayores
Los Angeles, San Bernardino, Monterey, San
Luis Obispo, Santa Barbara, and Ventura
3,515,649 500,390 592
National Asian Pacific Center on
Aging (Grant)
San Francisco, San Mateo, Santa Clara, Los Angeles, Sacramento, Alameda,
5,700,990 714,170 441

California SCSEP State Plan Modification PY 2016-19 California Department of Aging
Page 26 of 33
Provider California Counties Age 55 and Over in Service Area1
Age 55 and Over & At or Below 125 Percent of
Poverty Level2
Total Authorized SCSEP Positions
in Counties3
Contra Costa, Solano, Sonoma, Napa, and Orange
National Council on the Aging, Inc.
Marin, San Benito, San Francisco, San Mateo,
Santa Clara, Fresno, Kings, Merced, Tulare, and Santa
Cruz
1,562,020 186,059 370
National Older Worker Career
Center
El Dorado, Inyo, Mono, Del Norte, Siskiyou, Modoc,
Humboldt, Trinity, Shasta, Lassen, Plumas, Tehama, Mendocino, Lake, Glenn,
Butte, Yuba, Nevada, Colusa, Sutter, Yolo, and
Placer
602,592 77,993 205
SER - Jobs for Progress National,
Inc.
Amador, Calaveras, Imperial, Kern, Los Angeles, Madera, Mariposa, Orange, Riverside, San Diego, San Joaquin, and Stanislaus
5,357,647 717,850 819
State of California -California
Department of Aging
Alameda, Fresno, Kings, Los Angeles, Madera, Orange, Riverside, San Bernardino, San Diego, San Joaquin, San Mateo, Santa Clara, Stanislaus, Tulare, and
Ventura
7,400,474 941,125 699
Total Authorized Positions 3126
1Source: 2016 American Community Survey 1-Year Estimates S0101 Age and Sex, Race & Ethnicity 2 Source: 2014 American Community Survey 1-Year Estimates S0101 Age and Sex, Race & Ethnicity and Table S21043A - Age by Ratio of Income to Poverty Level (125%) in the Past 12 Months for the Population for Whom Poverty Status is Determined 3 Source: SPARQ PY 2017 2nd QTR Final QPRs
As the State SCSEP grantee, regulations mandate CDA to negotiate ED changes with the national SCSEP grantees operating in California. The statewide SCSEP network enjoys a strong cooperative partnership. National SCSEP grantees are invited to attend the CDA trainings, to exchange information and share strategies for program improvement. CDA communicates frequently with California’s national SCSEP grantees to provide and receive technical assistance (TA), exchange policy information, and facilitate the transfer of program participants. This
California SCSEP State Plan Modification PY 2016-19 California Department of Aging
Page 27 of 33
collaborative relationship has resulted in successful ED negotiations. Previously, CDA used the following process to achieve ED of authorized SCSEP positions in the State:
1. Received USDOL/ETAETA’s updated ED Report. 2. Reviewed the ED Report to determine changes to SCSEP authorized
positions in geographic service areas. 3. Forwarded the ED Report with State authorized position changes to
national SCSEP grantees for review. 4. Tabulated national SCSEP grantees requests and reviewed the ED
Report to determine which counties appear over-served or underserved. 5. Informed national SCSEP grantees which counties were over-served or
underserved. 6. Negotiated with the national SCSEP grantees to move authorized
positions from over-served areas to underserved areas. 7. Scheduled conference calls with the national SCSEP grantees to
complete ED negotiations and finalize the ED Report. 8. Submitted Final California ED Report to USDOL/ETAETA.
ED negotiations between CDA and California’s national SCSEP grantees strived to achieve position parity in each county. In cases where parity cannot be reached, CDA's ED policy is to ensure each county’s maximum number of over-served participants at plus ten positions and the maximum number of underserved participants at minus ten positions (+10/-10), depending on the population of eligible participants in the county. This parity policy and practice was agreed upon and adopted by the State and National SCSEP grantees operating in California over a decade ago. Recently, USDOL/ETA initiated new ED reporting procedures which require the State to analyze enrollment data located on the USDOL/ETA SCSEP ED website, www.SCSEPED.org, to determine over-served and underserved areas. The new procedure does not require ED negotiations between CDA and the statewide SCSEP network. CDA submitted an ED Report directly to USDOL/ETA. The national SCSEP grantees in the State are responsible for analyzing their own enrollment data on the www.SCSEPED.org website to determine over-served and underserved areas and how they would address imbalances. They submitted a separate ED Report directly to USDOL/ETA and one to CDA. CDA and the national SCSEP grantees enroll participants based on SCSEP modified positions. Modified positions are calculated using the State’s higher

California SCSEP State Plan Modification PY 2016-19 California Department of Aging
Page 28 of 33
minimum wage. For example, in PY 2017, USDOL/ETA awarded CDA SCSEP 699 authorized positions, which equates to 454 modified positions because of California’s high minimum wage. CDA analyzed the statewide SCSEP networks data on the www.SCSEPED.org website, and concluded that most of SCSEP projects are on track to meet USDOL/ETA ED expectations.
• State’s Long-term Strategy for achieving Equitable Distribution
California is divided into 58 counties. ANPPM, CDA, NAPCA, NCOA, and SER Jobs for Progress serve 23 urban counties in California. NOWCC, NCOA, and SER Jobs for Progress serve 34 rural counties in California. NOWCC serves the largest number of rural California counties and has the highest number of rural area participants. CDA’s long-term ED strategy for county parity ensures that the State’s rural and urban areas’ ED needs will be addressed. Additional rural SCSEP and ED challenges are discussed on page 22. SCSEP regulations require grantees to give priority service to individuals with one more of the following characteristics:
o Is a veteran or a spouse of a veteran o Is 65 years of age or older o Has a disability o Has limited English proficiency o Has low literacy skills o Resides in a rural area o Has low employment prospects o Has failed to find employment after utilizing services provided under Title I
of WIOA o Is homeless or at risk for homelessness
The statewide SCSEP network employs the following outreach and recruitment strategies to ensure priority for service is given to eligible individuals with the greatest economic need, greatest social need, and those with minority status:
o Uses outreach materials such as pamphlets, brochures, and flyers that are in languages of the specific target group.
o Locates offices in culturally and ethnically diverse neighborhoods. o Assigns SCSEP participant monitors to AJCs in areas with large
populations of older individuals.

California SCSEP State Plan Modification PY 2016-19 California Department of Aging
Page 29 of 33
o Assigns SCSEP participant monitors to AJCs in areas where minority populations reside.
o Makes presentations at social service agencies, especially those
serving older individuals and minority communities. o Runs advertisements in local journals, magazines, and media
accessed by target populations. o Networks with organizations serving veterans, disabled individuals, older
adults, and minority individuals. o Prepares public service announcements for media providers targeting
priority service markets o Consults with national SCSEP grantees, specifically those grantees
providing services to minority older individuals, on recruitment and outreach techniques
• Ratio of Eligible Individuals in Each County and State Total Eligibility Population
Table 5 shows the ratio of SCSEP eligible individuals in each service area to California’s total SCSEP eligible population.
Table 5 – Ratio of Eligible Individuals in Each Service Area to California’s Total Eligible Population
State and County
Total55 and Older Population
Total 55 and Older and Low
Income Population
(Income < or = to 125 Percent
of Federal Poverty
Guidelines)
Ratio as a Percentage of
Eligible Individuals in Each Service Area to Total
Eligible Population in
the State
County
Total 55 and Older
Population
Total 55 and Older and Low
Income Population
(Income < or = to 125 Percent
of Federal Poverty
Guidelines)
Ratio as a Percentage of
Eligible Individuals in Each Service Area to Total
Eligible Population in
the State
California
9,512,647
1,250,357
Alameda
395,326
44,845 3.57% Alpine
439
70 0.006%
Amador
15,709
1,525 0.12% Butte
67,851
9,705 0.78%
Calaveras
19,624
2,440 0.20% Colusa
5,327
684 0.05%
Contra Costa
300,810
25,590 2.05% Del Norte
8,145
1,845 0.15%
El Dorado
63,895
4,785 0.38% Fresno
206,144
34,330 2.74%
Glenn
0.12% Humboldt
0.46%

California SCSEP State Plan Modification PY 2016-19 California Department of Aging
Page 30 of 33
7,664 1,440 40,324 5,785
Imperial
39,850
9,460 0.76% Inyo
6,963
1,025 0.08%
County
Total 55 and Older
Population
Total 55 and Older and Low
Income Population
(Income < or = to 125 Percent
of Federal Poverty
Guidelines)
Ratio as a Percentage of
Eligible Individuals in Each Service Area to Total
Eligible Population in
the State
County
Total 55 and Older
Population
Total 55 and Older and Low
Income Population
(Income < or = to 125 Percent
of Federal Poverty
Guidelines)
Ratio as a Percentage of
Eligible Individuals in Each Service Area to Total
Eligible Population in
the State
Kern
174,067
28,495 2.28% Kings
27,478
4,245 0.34%
Lake
24,119
4,675 0.37% Lassen
7,903
1,085 0.09%
Los Angeles
2,377,750
382,955 30.63% Madera
36,741
6,020 0.48%
Marin
91,083
6,800 0.54% Mariposa
7,705
1,000 0.08%
Mendocino
30,366
4,835 0.39% Merced
53,411
9,330 0.75%
Modoc
3,557
640 0.05% Mono
3,808
364 0.03%
Monterey 98,859 11,305 0.90% Napa 42,776 4,130 0.33%
Nevada
41,372
4,160 0.33% Orange
782,970
79,080 6.32%
Placer
115,344
9,255 0.74% Plumas
8,310
1,095 0.09%
Riverside
556,604
72,450 5.79% Sacramento
365,317
48,540 3.88%
San Benito
13,556
1,654 0.13% San
Bernardino
444,865
66,370 5.31%
San Diego
786,963
93,795 7.50% San
Francisco
226,254
41,160 3.29%
San Joaquin
162,004
22,555 1.80%
San Luis Obispo
88,430
8,490 0.68%
San Mateo
209,085
16,920 1.35% Santa
Barbara
110,821
11,555 0.92%
Santa Clara
446,293
45,910 3.67% Santa Cruz
74,666
7,980 0.64%

California SCSEP State Plan Modification PY 2016-19 California Department of Aging
Page 31 of 33
Shasta
61,004
7,810 0.62% Sierra
1,432
295 0.02%
Siskiyou
17,595
2,975 0.24% Solano
115,336
10,445 0.84%
County
Total 55 and Older
Population
Total 55 and Older and Low
Income Population
(Income < or = to 125 Percent
of Federal Poverty
Guidelines)
Ratio as a Percentage of
Eligible Individuals in Each Service Area to Total
Eligible Population in
the State
County
Total 55 and Older
Population
Total 55 and Older and Low
Income Population
(Income < or = to 125 Percent
of Federal Poverty
Guidelines)
Ratio as a Percentage of
Eligible Individuals in Each Service Area to Total
Eligible Population in
the State
Sonoma
156,910
14,595 1.17% Stanislaus
122,865
18,075 1.45%
Sutter
24,680
3,600 0.29% Tehama
19,815
3,305 0.26%
Trinity
5,821
870 0.07% Tulare
91,434
17,730 1.42%
Tuolumne
22,020
2,510 0.20% Ventura
220,523
19,715 1.58%
Yolo
45,882
5,390 0.43% Yuba
16,782
2,665 0.21%
Source: 2014 American Community Survey 1-Year Estimates S0101 Age and Sex, Race & Ethnicity Table S21043A - Age by Ratio of Income to Poverty Level (125%) in the Past 12 Months for the Population for Whom Poverty Status is Determined
See additional charts are located in Appendix H and Appendix I.
• Relative Distribution of Eligible Individuals The statewide SCSEP network continuously targets resources to ensure equitable service is provided to specific populations. Recruitment efforts by the statewide SCSEP network seeks to increase participation of program priority service groups. Table 6 compares the State’s 65 and older general population characteristics to the State’s SCSEP participant numbers of eligible individuals to whom the OAA mandates giving priority service.

California SCSEP State Plan Modification PY 2016-19 California Department of Aging
Page 32 of 33
Table 6 – Priorities for Community Service Employment
SPARQ Personal Characteristics1
General Population
65+2
Total California
SCSEP Participants3
Age 65 and older
4,900,000
862
Individuals with disabilities and severe disability4,5
n/a
383
Individuals with limited English Proficiency4
2,283,400
584
Individuals with low literacy skills4
1,538,600
162
Individuals residing in rural areas4,5
n/a
209
Veterans (or their spouses) 4
1,705,200
239
Individuals with low employment prospects4,5
n/a
2,207
Individuals who failed to find employment after using WIA Title I4,5
n/a
601
Individuals who are homeless or at risk of homelessness4,5
n/a
1,263 (1) SPARQ Personal Characteristics PY 2017 2nd QTR Final QPR results (2) Demographic and Labor Market Profile of Californians Age 55 and Older, Employment Development
Department, Labor Market Information Division; low literacy is defined as 9th grade or less (3) The total California SCSEP participant results from SPARQ PY 2017 2nd QTR Final QPR that
includes CDA and the five national SCSEP grantees with operations in the State. (4) Information not available for individuals 65 + or the general population (5) SPARQ Characteristics are individuals 55+

California SCSEP State Plan Modification PY 2016-19 California Department of Aging
Page 33 of 33
Table 7 compares the characteristics of the State’s 55 and older general population to the characteristics of the State’s SCSEP participants.
Table 7 – Other SCSEP Eligible Individuals
SPARQ Personal Characteristics1
General Population of Age 55+
Total California
SCSEP Participants2
Family income at or below the poverty level3
1,068,000
2,203
Individuals with disabilities
2,538,9004
335
Individuals receiving public assistance5
n/a
1,448
(1) SPARQ Personal Characteristics for 2017 2nd QTR Final QPR results (2) The total California SCSEP participant results from the SPARQ PY 2017 2nd QTR Final QPR that includes CDA and the five national SCSEP grantees with operations in the State. (3) Demographic and Labor Market Profile of Californians Age 55 and Older, Employment Development Department, Labor Market Information Division (4) 2014 American Community Survey 1-Year Estimates S0101 Age and Sex, Race & Ethnicity; Table S21043A - Age by Ratio of Income to Poverty Level (125%) in the Past 12 Months for the Population for Whom Poverty Status is Determined (5) Information not available for individuals 55 + or the general population
• Avoidance of Disruption of Service
CDA and the national SCSEP grantees successfully avoided the disruption of services after the USDOL/ETA announced the National SCSEP Competition awards by collaborating with each other to ensure the smooth transfer of the participants from one grantee to another. The statewide SCSEP network clearly communicated with participants, with the host agencies, and with each other to minimize any disruption of services.

Appendix A: California Department of Aging SCSEP Sub-Grantees Directory
1
_________________________________________________________________________ PSA 5 MARIN COUNTY AREA AGENCY ON AGING (CA005) County of Marin, Health and Human Services, Aging and Adult Services
10 North San Pedro Road, Suite 1023 San Rafael, California 94903 (415) 499-7396 Home Page Address: www.co.marin.ca.us/aging/
MICHELE MCCABE, Project Coordinator (415) 473-2702 Email: [email protected] ________________________________________________________________________ PSA 9 ALAMEDA COUNTY AREA AGENCY ON AGING (CA009) Department of Adult and Aging Services
6955 Foothill Boulevard, Suite 300 Oakland, California 94605-1907 (510) 577-1900 Home Page Address: www.alamedasocialservices.org/public/index.cfm
MAAZA MICHAEL Program Financial Specialist (510) 577-3538 Email: [email protected] ________________________________________________________________________________ PSA 10 SOURCEWISE COMMUNITY RESOURCE SOLUTIONS (CA010) Council on Aging, Silicon Valley 2115 The Alameda
San Jose, California 95126-1141 (408) 296-8290 Home Page Address: www.mysourcewise.com
HENRI VILLALOVOZ, Director Senior Employment & Meals on Wheels (408) 350-3224 Email: [email protected] ________________________________________________________________________ PSA 11 SAN JOAQUIN COUNTY (CA011) Department of Aging and Community Services
P.O. Box 201056 Stockton, California 95201-3006 (209) 468-2202 Home Page Address: http://www.sjchsa.org/Services/Aging-Community
CHARAE GILBERT, RSVP/SCSEP Project Coordinator (209) 468-2208 Email: [email protected] ________________________________________________________________________________________________

Appendix A: California Department of Aging SCSEP Sub-Grantees Directory
2
________________________________________________________________________________________________ PSA 14 FRESNO-MADERA AREA AGENCY ON AGING (CA014) 3837 N. Clark Street
Fresno, California 93726 (559) 600-4405 Home Page Address: www.fmaaa.org
LINDA DESCOTEAUX, Administrative Manager (559) 600-6601 Email: [email protected] ________________________________________________________________________________ PSA 15 KINGS-TULARE AREA AGENCY ON AGING (CA015) 5957 South Mooney Blvd.
Visalia, California 93277 (559) 624-8000 Home Page Address: www.ktaaa.org
ISRAEL GUARDADO, Staff Services Analyst (559) 624-7485 Email: [email protected] ________________________________________________________________________________ PSA 18 VENTURA COUNTY AREA AGENCY ON AGING (CA018) 646 County Square Drive, Suite 100
Ventura, California 93003 (805) 477-7300 Home Page Address: http://aaa.countyofventura.org
MARLENE CANNIFF, Grants Manager (805) 477-7311 Email: [email protected] ________________________________________________________________________________ PSA 19 COUNTY OF LOS ANGELES WORKFORCE (CA019) DEVELOPMENT, AGING AND COMMUNITY SERVICES (WDACS)
3333 Wilshire Blvd., Suite 400 Los Angeles, California 90010 (213) 738-4004 Home Page Address: http://wdacs.lacounty.gov
IRENE PELAYO, Program Manager AJCC Operations Division (213) 351-5246 Email: [email protected]
_______________________________________________________________________________________

Appendix A: California Department of Aging SCSEP Sub-Grantees Directory
3
________________________________________________________________________________________________ PSA 20 SAN BERNARDINO COUNTY DEPARTMENT OF AGING & ADULT (CA020) SERVICES 686 East Mill Street
San Bernardino, California 92415 (909) 891-3900 Home Page Address: http://hss.sbcounty.gov/daas
LESLIE DUNN, Assistant to the Director, SCSEP Coordinator (909) 891-9048 Email: [email protected] ________________________________________________________________________________ PSA 21 COUNTY OF RIVERSIDE OFFICE ON AGING (CA021) 6296 Rivercrest Drive, Suite K
Riverside, California 92507 (951) 867-3800 Home Page Address: http://www.rcaging.org
BECKY PRIEST, OAA Program Specialist II (951) 867-3861 Email: [email protected] ________________________________________________________________________ PSA 22 ORANGE COUNTY OFFICE ON AGING (CA022) 1300 South Grand Ave., Bldg. B, 2nd Floor Santa Ana, California 92705
(714) 567-7500 Home Page Address: http://www.officeonaging.ocgov.com/
NAKIA THIERRY, Interim Administrative Manager (714) 480-6460 Email: [email protected] _____________________________________________________________________ PSA 23 COUNTY OF SAN DIEGO AGING & INDEPENDENCE SERVICES (CA023) 5560 Overland Avenue, Suite 310
San Diego, California 92123 (858) 495-5885 Home Page Address: http://www.sdcounty.ca.gov/hhsa/programs/ais/
MICHAEL STRAWN, SCSEP Monitor Manager (858) 505-6955 Email: [email protected] ________________________________________________________________________________

Appendix A: California Department of Aging SCSEP Sub-Grantees Directory
4
________________________________________________________________________________ PSA 25 CITY OF LOS ANGELES DEPARTMENT OF AGING (CA025) 221 N. Figueroa Street, Suite 180
Los Angeles, California 90012 (213) 482-7252 Home Page Address: http://aging.lacity.org/
MARIELLA FREIRE-REYES, SCSEP Program Director (213) 482-7240 Email: [email protected]
________________________________________________________________________________________________ PSA 30 STANISLAUS COUNTY DEPARTMENT OF AGING & VETERANS (CA030) SERVICES 3500 Coffee Road, Suite 19
Modesto, California 95355-1201 (209) 558-8698 Home Page Address: http://www.agingservices.info/
LINDA LOWE, SCSEP Contract Monitor (209) 525-4612 Email: [email protected] ________________________________________________________________________
California SCSEP State Plan Modification PY 2016-19 California Department of Aging
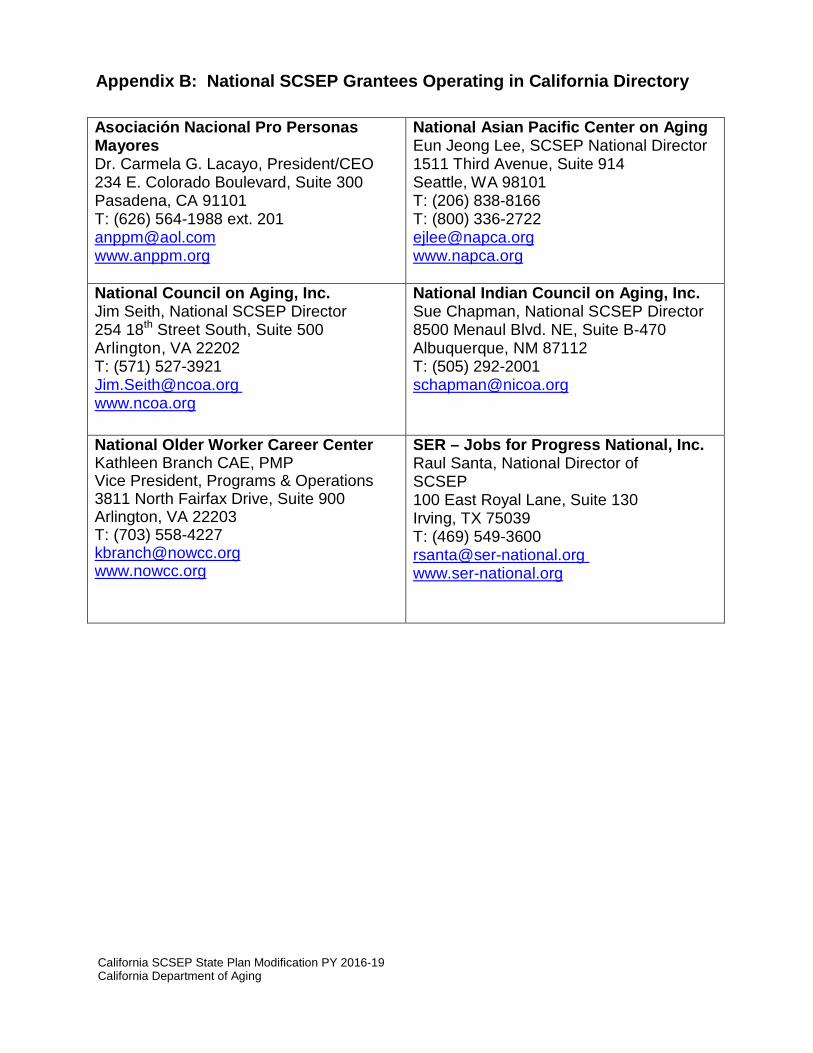
Appendix B: National SCSEP Grantees Operating in California Directory
Asociación Nacional Pro Personas Mayores Dr. Carmela G. Lacayo, President/CEO 234 E. Colorado Boulevard, Suite 300 Pasadena, CA 91101 T: (626) 564-1988 ext. 201 [email protected] www.anppm.org
National Asian Pacific Center on Aging Eun Jeong Lee, SCSEP National Director 1511 Third Avenue, Suite 914 Seattle, WA 98101 T: (206) 838-8166 T: (800) 336-2722 [email protected] www.napca.org
National Council on Aging, Inc. Jim Seith, National SCSEP Director 254 18th Street South, Suite 500 Arlington, VA 22202 T: (571) 527-3921 [email protected] www.ncoa.org
National Indian Council on Aging, Inc. Sue Chapman, National SCSEP Director 8500 Menaul Blvd. NE, Suite B-470 Albuquerque, NM 87112 T: (505) 292-2001 [email protected]
National Older Worker Career Center Kathleen Branch CAE, PMP Vice President, Programs & Operations 3811 North Fairfax Drive, Suite 900 Arlington, VA 22203 T: (703) 558-4227 [email protected] www.nowcc.org
SER – Jobs for Progress National, Inc. Raul Santa, National Director of SCSEP 100 East Royal Lane, Suite 130 Irving, TX 75039 T: (469) 549-3600 [email protected] www.ser-national.org
California SCSEP State Plan Modification PY 2016-19 California Department of Aging


Appendix D
1
Demographic and Labor Market Profile of Californians Age 55 and Older
According to the American Community Survey, California’s population totaled just over 37.6 million people in 2014. Roughly one out of every four Californians was 55 years and older (9.3 million) in 2014. The 55 and older segment of the state’s population can be further broken down as follows: 4.5 million were between the ages of 55 and 64; 2.8 million between 65 and 74; and 2.1 million were 75 years and older. The age distributions of California’s total population and working age population age 16 and older are displayed in Figure 1.
Figure 1
Source: U.S. Census Bureau, American Community Survey, 2014.
Nationally, the U.S. Bureau of Labor Statistics projects that the share of working age persons 55 years and older will increase through 2024 due to slower growth in the population as a whole and the aging of the U.S population.1 They project that the U.S. population of workers 55 years and older will swell from 33 million in 2014 to just over 40 million by 2024 and their share among workers in the labor force will increase from 21.7 to 24.8 percent over the same period. This trend of an aging population and labor force will also occur in California. The Golden State’s working age population totaled just over 30 million persons in 2014, 31.2 percent of whom were age 55 years and older (9.3 million). Persons age 55 years and older made up the largest share of the state’s working age population when compared to other age groups of working age in 2014. The share of persons age 55 years and older in the state’s working age population increased from 25.9 percent in 2004 to 31.2 percent in 2014, for a gain of 5.3 percentage points. This growth trend coupled with the BLS labor force forecast indicates that the number of Californians age persons 55 years and older will continue to increase over time.
1 Bureau of Labor Statistics. Labor Force Projections to 2024: The Labor Force is Growing, But Slowly, December 2015.
Age 0-15 20.0%
Age 16-24 12.7%
Age 25-34 15.0% Age 35-44
13.7%
Age 45-54 13.8%
Age 55 and older
24.9%
California's Total Population in 2014
Age 16-24 15.8%
Age 25-34 18.7%
Age 35-44 17.1%
Age 45-54 17.2%
Age 55 and older
31.2%
California's Working Age Population in 2014

Appendix D
2
Demographic Characteristics of Californians Aged 55 Years and Older The demographic characteristics of California’s 55 and older population are found in Table 1. The data presented also show similarities and differences among persons age 55 to 64, 65 to 74, and 75 years and older. Individuals between the ages of 55 and 64 are those that are approaching, but have not reached the traditional retirement age of 65. Persons between the ages of 65 and 74 are generally persons that have reached the retirement age. Individuals aged 75 years and older have largely retired and withdrawn from the state’s civilian labor force. Generally speaking, the state’s older population is made up largely of women, married individuals, and large concentrations of persons that have some college experience or an advanced degree. In terms of gender, women made up the largest share of individuals within California’s older population in 2014. Women held at least a 51 percent share across all of the three older age groups profiled in Table 1 and were most heavily concentrated among persons 75 years and older (58.7 percent). Just over 4 million older Californians in 2014 were men, the largest share of whom were in the 55 to 64 age group (48.1 percent). As age increases, the share of men decreased in the state, a trend that supports some of the current research findings that have shown that women tend to live longer than men.2 Roughly three out of every five Californians age 55 years and older were married in 2014. Married people represented over 60 percent of persons within the 55 to 64 (63.4 percent) and 65 to 74 (61.4 percent) age groups. An additional one out of every three older Californians (32.6 percent) had once been married but was now separated, divorced, or widowed. Just over eight percent of the state’s 55 and older population had never married. In terms of race and ethnicity, white people made up the largest share of California’s 55 years and older population, accounting for over two-thirds of the state’s older population. As seen in Table 1, the overall percent share of white persons increases with age. The largest percentage share of whites was among persons age 75 and over (73.5 percent), or the oldest segment of the population. Over 1.3 million of the state’s older population was Asian, accounting for 14.8 percent of Californians age 55 and over in 2014. This percentage share was consistent across the 55 to 64, 65 to 74, and 75 and older age groups. Over 5.0 percent, or just over 500,000 members, of the state’s older population were African-American. The share of African-Americans and persons in the other race category (e.g., Native Alaska, Pacific Islander, etc.) decreased with advancing age (See Table 1). One out of five (21.8 percent) older Californians was Hispanic and this share generally held across the 55 to 64, 65 to 74, and 75 and older age groups. More than half of Californians 55 years and older attended at least some college or obtained an Associate degree or higher in 2014. One out of five (20.9 percent) older Californians had attained either a high school diploma or general equivalency diploma (GED) and a similar share (21.3 percent) had attended some college but did not complete a degree, and 8.0 percent had an Associate degree. Three out of every ten (30.2 percent) older Californians had attained a Bachelor’s degree (17.9 percent) or higher (12.6 percent). At the opposite end of the educational spectrum, 19.3 percent of older Californians had never completed high school. 2 University of Southern California, Davis School of Gerontology. Why Don’t Men Live as Long as Women?, 2015.

Appendix D
3
Table 1 Demographic Characteristics of Californians Age 55 and Over in 2014
The U.S. Census Bureau’s Current Population Survey of Households (CPS) defines and tracks the following types of disabilities: difficulty walking or climbing stairs, difficulty dressing or bathing, difficulty doing errands, difficulty remembering or making decisions, blind or difficulty seeing even with glasses, and deaf or serious difficulty hearing.3 In 2014, one out of four 3 The Current Population Survey of Households (CPS) captures data on individual disabilities and not a combination of them. The data are limited and do not capture individuals with more than one disability.
Total Age 55-64
Age 65-74
Age 75 and older
Population (Number) 9.3 million 4.4 million 2.8 million 2.1 millionGender
Men 46.1% 48.1% 46.4% 41.3%Women 53.9% 51.9% 53.6% 58.7%
Marital StatusMarried 58.7% 63.4% 61.4% 45.0%
Once Married 32.6% 25.0% 31.7% 50.4%Never Married 8.6% 11.6% 7.0% 4.5%
Race/EthnicityWhite 69.5% 66.9% 70.7% 73.5%
African-American 5.6% 6.1% 5.4% 4.8%Asian 14.8% 15.0% 14.8% 14.6%Other 10.0% 12.0% 9.1% 7.1%
Hispanic* 21.8% 24.4% 20.2% 18.2%Citizenship Status
Native-born 64.9% 63.5% 66.0% 66.2%Naturalized 23.6% 23.2% 23.3% 24.9%
Foreign-born, Non-Citizen 11.5% 13.3% 10.7% 8.9%Educational Attainment
Did Not Complete High School 19.3% 17.5% 18.1% 24.7%High School Diploma/GED 20.9% 19.7% 19.0% 25.8%
Some College, But No Degree 21.3% 22.5% 21.5% 18.6%Associate Degree 8.0% 8.9% 8.3% 5.8%Bachelor's Degree 17.9% 19.2% 18.4% 14.4%
Higher than a Bachelor's Degree 12.6% 12.0% 14.8% 10.7%
9th Grade or Less 14.1% 12.6% 13.4% 18.0%Disabled 27.3% 16.9% 24.5% 52.9%Veteran 12.1% 6.7% 15.3% 19.5%
Californians Age 55 and Older
Source: U.S. Census Bureau, American Community Survey, 2014. *Current Population Survey of Households,12-month moving average, December 2014.

Appendix D
4
(27.3 percent) Californians age 55 years and older had a disability. The incidence of disability increases with advancing age, with over half (52.9 percent) of Californians age 75 and older reporting that they had some disability in 2014. The most common disability cited by 1.4 million (1.46 percent) older Californians age 55 and older was difficulty dressing or bathing, followed by difficulty walking or climbing stairs with 870,000 (9.3 percent). Persons who had difficulty making decisions (5.0 percent) or serious difficulty hearing (3.5 percent) were comparatively less common. California is home to 1.8 million veterans and two-thirds (1.2 million) of them were age 55 and over. Eight-five percent of veterans within this age group served in time periods during or before the Vietnam Era (August 1964 to April 1975). Just over 500,000 veterans aged 55 years and older served in the Vietnam Era. The next largest tour of duty extended from February 1955 to July 1964, during which time 200,000 older veterans served the country. In sharp contrast, just over 6,400 older men and women served during the September 2001 to present day period. According to the American Community Survey (ACS), nearly two-thirds (64.9 percent) of Californians aged 55 years and older were native-born citizens of the United States in 2014. The percent share of native-born citizens ranged from 63.5 percent in the 55 to 64 age group to 66.2 percent among Californians age 75 years and older. According to the 2014 ACS, one out of every five Californians age 55 years and older was a naturalized citizen and just over ten percent (11.5 percent) was foreign-born. Demographic Characteristics of Californians Aged 55 Years and Older Who Earn 125 Percent or Less of the Federal Poverty Level The demographic characteristics of older Californians who earned 125 percent or less of the federally defined poverty level are presented in Table 2. In some respects, Californians aged 55 years and older who lived in or near poverty, defined as 125 percent or less of the federal poverty level, shared similar characteristics with the overall population of older individuals in California. For instance, a majority of older individuals who earned 125 percent or less of the poverty level were women and white. However there were subtle differences. The share of older Californians living in or near poverty who were women (58.1 percent) was larger than the 53.9 percent share women held in the overall population of Californians age 55 and over. Although 60.4 percent of low income older Californians were white in 2014, this was less than the 69.5 percent share whites held in the overall older population. However, in terms of marital status, citizenship status, educational attainment, and disability there were noticeable differences among poorer and more affluent older Californians. For all Californians age 55 years and older, 58.7 percent were married. In contrast, just 34.1 percent of older Californians living in or near poverty was married, for a difference of 24.6 percentage points. Moreover, the overall percentage share of persons that were never married was nearly twice as high among persons age 55 years and older who lived in or near poverty (16.6 percent) than among all persons age 55 years and older (8.6 percent).

Appendix D
5
Table 2
In terms of citizenship status, 54.9 percent of Californians age 55 and older who lived in or near poverty were native-born. This share was 10.0 percentage points lower than the comparable share in the overall 55 years old and over population. This implies that older Californians who were foreign-born, naturalized or otherwise, were disproportionately more likely to live in or near poverty than were native-born older Californians.
Total Age 55-64
Age 65-74
Age 75 and older
Population (Number) 1,482,300 706,900 398,600 376,800Gender
Men 41.9% 47.0% 40.4% 34.2%Women 58.1% 53.0% 59.6% 65.8%
Marital StatusMarried 34.1% 34.8% 35.8% 31.1%
Once Married 49.2% 42.0% 51.2% 60.8%Never Married 16.6% 23.2% 13.1% 8.1%
Race/EthnicityWhite 60.4% 59.4% 58.8% 63.9%
African-American 8.7% 10.3% 8.4% 5.8%Asian 15.9% 13.2% 17.5% 19.5%Other 15.0% 17.1% 15.3% 10.8%
Hispanic* 31.1% 33.1% 32.7% 25.5%Citizenship Status
Native-born 54.9% 58.5% 50.7% 52.7%Naturalized 27.4% 21.4% 30.3% 35.7%
Foreign-born, Non-Citizen 17.7% 20.1% 19.1% 11.7%Educational Attainment
Did Not Complete High School 36.3% 33.3% 37.2% 40.7%High School Diploma/GED 24.7% 24.9% 23.5% 25.6%
Some College, But No Degree 18.3% 20.9% 17.6% 14.3%Associate Degree 6.2% 7.1% 6.3% 4.3%Bachelor's Degree 9.7% 9.7% 10.0% 9.3%
Higher than a Bachelor's Degree 4.8% 4.0% 5.4% 5.8%
9th Grade or Less 27.6% 23.9% 29.9% 32.1%Disabled 41.3% 33.2% 38.5% 59.3%Veteran 7.8% 6.1% 8.3% 10.4%Source: U.S. Census Bureau, American Community Survey, 2014. *Current Population Survey of Households,12-month moving average, December 2014.
Californians Age 55 and Older Who Earn 125 Percent or Less of the Federal Poverty Guidelines

Appendix D
6
There were also stark differences in educational attainment among older Californians generally and those living in or near the poverty. For example, 36.3 percent of older Californians living in or nearly poverty had not completed high school. In contrast, just 19.3 percent of all older Californians had not finished high school. Moreover, less than 5.0 percent (4.8 percent) of older Californians living in or near poverty had obtained a degree higher than a bachelor’s degree, 7.8 percentage points lower than the share for older individuals on the whole (12.6 percent). The American Community Survey estimated that two out of every five persons (41.3 percent) older Californians who lived in or near poverty were disabled in 2014. This percentage share was 14.0 percentage points higher than the 27.3 percent share among all Californians age 55 years and older. The share of the disabled among older persons living in or near poverty was higher than that of the overall older population across the 55-64, 65 to 74, and 75 and older age groups (See Tables 1 and 2). Place of Birth According to the 2014 ACS, just over 3.0 million (34.9 percent) of the Golden State’s 55 years and older population were foreign born. One out of every three (32.8 percent) older Californians was born in a state other than California and over 2.9 million (32.0 percent) older Californians were born in the Golden State.
Figure 2
Source: U.S. Census Bureau, American Community Survey, 2014. English Speaking Ability of Californians Age 55 and Older According to the 2014 ACS, 63.7 percent of older Californians spoke English only at home. This share held across the 55 to 64 (62.6 percent), 65 to 74 (64.7 percent), and 75 years and older (64.5 percent) age groups. The remaining 36.3 percent of Californians age 55 years and older spoke a language other than English at home. In contrast, 23.3 percent of those age 55 years and older had at least some difficulty speaking English and this general trend held across the three oldest age groups. Nearly two-thirds (64.3 percent) of older Californians who had limited
California born
32.0%
Born in another U.S.
state32.8%
Born in U.S. Territory
0.2%
Foreign Born34.9%
Place of Birth of Californians Age 55 and Older (2014 Annual Average; Percent of Total)

Appendix D
7
English proficiency reported they did not speak English very well. Table 3 outlines the English speaking abilities of Californians age 55 and older in 2014.
Table 3 English Speaking Abilities of Californians Age 55 and Older in 2014
(Percent of Total)
Californians Age 55 and Older
Total Age 55-64 Age 65-74 Age 75 and older
Language Spoken at Home English Only 63.7% 62.6% 64.7% 64.5%
Language Other than English 36.3% 37.4% 35.3% 35.5% English Ability
Percentage of persons that has at least some difficulty speaking English 23.3% 23.4% 22.7% 23.9%
Percentage of persons who speak a language other than English at home who do
not speak English very well 64.3% 62.8% 64.4% 67.4%
Source: U.S. Census Bureau, American Community Survey, 2014. Income-to-Poverty Ratios of Californians Age 55 and Older The U.S. Census Bureau determines poverty status by comparing annual income to a set of dollar values called poverty thresholds that vary by family size, number of children, and the age of the householder. If a family’s before-tax money income is less than the dollar value of their poverty threshold, then that family and every individual in it are considered to be living in pov-erty. The income-to-poverty ratios are calculated by dividing income by the established threshold. A summary of the income-to-poverty ratios of Californians aged 55 years and older are found in Table 4. In 2014, 1.1 million, or one out of every nine (11.3 percent), Californians age 55 years and older lived in poverty. This percent share hovered slightly above and below ten percent for each of the older population age groups; 55 to 64 (540,000; 12.0 percent); 65 to 74 (278,000; 9.7 percent); 75 years and older (250,000; 11.6 percent). In addition, less than five percent (4.3 percent) of older workers lived in or near poverty since their income-to-poverty ratio was between 101 and 125 percent. Seven out of ten (71.8 percent) older Californians had income-to-poverty ratios of 200 percent or more. These individuals had substantially higher incomes than the established poverty thresholds. One out of every three older workers in the Golden State had income-to-poverty ratios in excess of 500 percent in 2014.

Appendix D
8
Table 4 Income-to-Poverty Ratios of Californians Age 55 and Older in 2014
(Percent of Total)
Californians Age 55 and Older
Income-to-Poverty Ratio Total Age 55-64 Age 65-74 Age 75 and older
100 percent or less 11.3% 12.0% 9.7% 11.6%
Near Poverty 101 through 125 percent 4.3% 3.6% 4.2% 5.9%
Total in or near poverty 15.6% 15.7% 14.0% 17.6%
200 percent or more 71.8% 73.4% 73.6% 66.3% 300 percent or more 57.4% 60.6% 58.5% 49.1% 400 percent or more 45.7% 49.4% 46.6% 36.6% 501 percent or more 36.1% 39.6% 36.8% 27.5%
Note: The federal poverty level for an individual in 2014 was $11,770 per year. The near poverty threshold was $14,713 per year. Source: U.S. Census Bureau, American Community Survey, 2014. Labor Force Participation Rate Trends in 2014 The labor force participation rate (LFPR) is an economic indicator used to gauge the strengths and weaknesses of an economy at the national, state, and/or local level. The U.S. Bureau of Labor Statistics defines the labor force participation rate as the percentage of the population that is either employed or actively seeking employment (unemployed). The labor force participation rate has traditionally tended to be higher during periods of economic prosperity when jobs are plentiful, but has been in sustained decline over the last decade or so as the pace of baby boomers who retire has gained steam. Figure 3 shows the labor force participation rates by age group in California in 2014. The blue bars within the figure reflect the labor force participation rates among workers age 55 years and older. In 2014, the LFPR for all working age Californians (age 16 and older) was 63.1 percent, with individuals between the ages of 25 and 44 participating at the highest rate (80.8 percent). Workers between the ages of 45 and 54 also had a labor force participation rate near 80 percent (79.1 percent) in 2014. Younger workers between the ages of 16 and 24 had a labor force participation rate that was 10.1 percentage points lower than the statewide average. Older Californians age 55 years and older had a labor force participation rate that was 23.8 percentage points lower than the statewide average in 2014. However, LFPR among individuals age 55 to 64 (63.4 percent) was more or less comparable to overall participate rate for all ages. Generally speaking, as individuals advance in age beyond 55, their respective labor force participation rates begin to decline as they become less inclined to participate in the labor force for several reasons (e.g., retirement benefit eligibility, disability, etc.). Participation rates begin to plunge once individuals become eligible for Social Security. In 2014, the LFPR among Californians age 65 to 74 and 75 and older was just 26.1 and 6.1 percent, respectively.

Appendix D
9
Figure 3
Source: U.S. Census Bureau, American Community Survey, 2014. Unemployment Rates by Age The unemployment rate highlights the number of unemployed people as a percentage of the state labor force. To be considered unemployed, an individual must have actively sought work at some point in the most recent four-week period of the survey reference week. Those who were not employed and did not actively seek work are considered to be not in the labor force and are not reflected in the unemployment rate. In 2014, California’s unemployment rate was 8.4 percent and the age group with the highest unemployment rate was among workers between the ages of 16 and 24 (17.4 percent).The unemployment rate for persons age 25 to 34 was comparable to the statewide average (8.5 percent). Persons between the ages of 35 and 54 had unemployment rates that hovered just over 6.0 percent in 2014. Figure 4 shows the unemployment rates by age for 2014. The unemployment rate among Californians age 55 years and older was 6.5 percent in 2014, a rate that was 1.9 percentage points lower than the statewide average (8.4 percent). Moreover, each of the older worker age groups had an unemployment rate that was lower than the statewide average. The rate among 55 to 64 year olds was 6.8 percent, the rate among 65 to 74 year olds was 5.5 percent, and the rate among those 75 years and older was 4.1 percent. Factors contributing to the lower unemployment rates for persons 55 years and older include, but are not limited to increased retirements and a lack of job opportunities. California was in the midst of an economic expansion from 2010 through 2014, during which time the state gradually recovered the 1.3 million nonfarm jobs it lost during the most recent recession (July 2007 through February 2010). These positive trends fueled the decline in the statewide unemployment rate from 11.2 percent in 2012 to 8.4 percent in 2014, a drop of 2.8 percentage points. Over that two-year period, the unemployment rates of members of the state labor force between the ages of 25 and 54 and among individuals age 55 and over fell by 2.5 and 2.3 percentage points, respectively. Figure 5 shows the unemployment rates by age in California between 2012 and 2014.
6.126.1
63.4
39.3
79.180.880.8
53.0
63.1
0.0 25.0 50.0 75.0 100.0
75+
65-74
55-64
55+
45-54
35-44
25-34
16-24
ALL AGES
Labor Force Participation Rate (%)
Labor Force Participation Rates by Age Group in California in 2014

Appendix D
10
Figure 4
Source: U.S. Census Bureau, American Community Survey, 2014.
Figure 5
Source: U.S. Census Bureau, American Community Survey, 2014.
4.15.5
6.8
6.5
6.16.7
8.517.4
8.4
0.0 5.0 10.0 15.0 20.0
75+
65-74
55-64
55+
45-54
35-44
25-34
16-24
ALL AGES
Unemployment Rate (%)
Unemployment Rates by Age Group in California in 2014
11.29.9
8.4
21.719.9
17.4
9.78.5
7.18.8
7.66.5
0.0
5.0
10.0
15.0
20.0
25.0
2012 2013 2014
Une
mpl
oym
ent R
ate
(%)
Unemployment Rates by Age in California in 2012, 2013, and 2014
ALL AGES 16-24 25-54 55 and Over

Appendix D
11
Full-Time and Part-Time Workforce by Age In 2014, 79.7 percent of employed Californians usually worked full-time, which the U.S. Census Bureau and Bureau of Labor Statistics defined as 35 or more hours per week. Over 80 percent of workers within the following age categories worked full-time in 2014: 25 to 34 (85.4 percent); 35 to 44 (87.5 percent); and 45-54 (86.2 percent). Nearly 80 percent (78.4 percent) of workers age 55 years and over worked full-time for an employer in 2014. Figure 8 shows the percentage of Californians that worked full-time and part-time by age group.
Figure 8
Source: U.S. Census Bureau, Current Population Survey of Households, 2014.
As workers 55 years and older advanced in age, their tendency to work full-time decreased and their tendency to work part-time increased. Whereas 82.7 percent of workers age 55 to 64 worked full-time, just 59.5 percent of workers age 75 and older did, a difference of 23.2 percentage points. The share of workers age 75 and older who worked part-time (40.5 percent) was more than double that of workers age 55 to 64 (17.3 percent). Generally speaking, retired individuals have fewer incentives to work full-time and often choose to work part-time to supplement their fixed retirement incomes. An examination of the state’s labor force that worked 20 hours or less found that the largest shares of workers that were employed in this manner were California’s youngest (16-24) and oldest workers (75 years and older). One out of three workers aged 16-24 (33.4 percent) or 75 years and older (36.0) worked 20 hours or less on the job in 2014. For older workers age 55 and older on the whole, nearly 15 percent (14.8 percent) worked 20 hours or less. Figure 9 shows the share of workers who worked 20 hours or less per week by age in 2014. Industry Sector Employment of Older Californians Figure 10 shows the employment of older working Californians in 2014 in the 13 industry sectors that are used by the U.S. Census Bureau’s Current Population Survey of Households (CPS). The largest concentration of older working Californians was in the educational and
55.3%
85.4% 87.5% 86.2% 78.4% 82.7%67.7% 59.5%
44.7% 14.6% 12.5% 13.8% 21.6% 17.3% 32.3% 40.5%
0.0%
25.0%
50.0%
75.0%
100.0%
16-24 25-34 35-44 45-54 55+ 55-64 65-74 75+
Full-
and
Par
t-Tim
e (%
)
Years of Age
Percentage of Working Californians Who Worked Full- and Part-Time by Age in 2014
Full time labor force Part Time Labor Force

Appendix D
12
health services sector, which employed two-fifths (22.9 percent) working Californians age 55 and older. Professional and business services, which employed 15.0 percent of older workers, wholesale and retail trade (11.3 percent), and manufacturing (10.8 percent) were the other California industry sectors that employed 10 percent or more of older workers. These four sectors combined employed three-fifths (59.9 percent) of older working Californians in 2014.
Figure 9
Source: U.S. Census Bureau, Current Population Survey of Households, 2014.
Figure 10
Source: U.S. Census Bureau, Current Population Survey of Households, 2014.
36.0%
22.3%
12.0%
14.8%
10.6%
8.2%
10.4%
33.4%
0.0% 5.0% 10.0% 15.0% 20.0% 25.0% 30.0% 35.0% 40.0%
75+
65-74
55-64
55+
45-54
35-44
25-34
16-24
Percent (%) of Workers
Age
Coh
ort
Percent of California Workers Who Worked 20 Hours or Less in 2014 by Age
Educational and Health Services, 904,800, 22.9%
Professional and Business Services,
591,800, 15.0%
Wholesale and Retail Trade, 447,600,
11.3% Manufacturing, 425,900, 10.8%
Financial Activities, 306,200, 7.7%
Other services, 235,500, 6.0%
Construction, 232,600, 5.9%
Leisure and Hospitality, 212,200,
5.4%
Transportation and Utilities, 211,500,
5.3%
Public Administration, 200,600, 5.1%
Information, 91,500, 2.3%
Agriculture, 87,500, 2.2%
Mining, 6,500, 0.2%
Industry Sector Employment of Older Working Californians Age 55 and Over in 2014
(Annual Average; Number of Workers; Percent of all Older Workers)

Appendix D
13
Occupational Employment Patterns among Older California Workers Industry sectors are comprised of occupational groups, and many occupational groups are concentrated in specific industry sectors. Occupational groups are typically concentrated in specific industries but may be spread across all industries, such as the management occupational group. This section explores occupational employment patterns among older Californians using 2014 American Community Survey (ACS) data from the U.S. Census Bureau. The use of ACS data enables a comparison of the occupational employment pattern of older working Californians generally with that of low income older workers. These workers are defined as those Californians who are employed, but living at or below the 125 percent poverty level. Of the 22 occupational groups distinguished by the ACS, Figure 11 displays the 10 occupational groups that employed the largest numbers and shares of working Californians age 55 and older in 2014. Together, these 10 occupations employed nearly three-quarters (74.7 percent) of California’s working older workers in 2014.
Figure 11
Source: U.S. Census Bureau, American Community Survey, 2014. Nearly two-fifths (38.3 percent) of older workers in California were employed in professional, management, educational, business, or financial occupations. Management occupations employed the largest number and share (12.6 percent) of older Californian workers, followed closely by office and administrative support occupations (12.2 percent). The only other occupational group with an employment share of at least 10 percent and which employed more than 350,000 older workers was sales and related occupations (10.3 percent). These three
179,900; 4.9%
197,600; 5.4%
198,400; 5.4%
205,500; 5.6%
214,100; 5.8%
218,600; 5.9%
241,700; 6.6%
379,800; 10.3%
450,000; 12.2%
463,100; 12.6%
0 200,000 400,000 600,000
Building, Grounds Cleaning and Maintenance Occs.
Personal care andService Occs.
Transportation and Material Moving Occs.
Production Occs.
Business and FinancialOperations Occs.
Healthcare Practitionerand Technical Occs.
Education, Training,and Library Occs.
Sales and Related Occs.
Office and AdministrativeSupport Occs.
Management Occs.
Older Workers By Occupational Group
Occ
upat
iona
l Gro
up (O
ccs.
)
The Ten Occupational Groups that Employed the Largest Number of Older California Workers Age 55 and Over in 2014
(Annual Average Data; Number of Older Workers; Percent of All Older Workers)

Appendix D
14
occupational groups combined employed nearly 1.3 million older workers in 2014, or more than one-third (35.1 percent) of all older workers. Seven additional occupational groups employed between 4.9 percent and 6.6 percent of older Californians in the workforce: education, training, and library occupations (6.6 percent); healthcare practitioner and technical occupations (5.9 percent); business and financial operations occupations (5.8 percent); production occupations (5.6 percent); transportation and material moving occupations (5.4 percent); personal care and service occupations (5.4 percent); and building and grounds clearing and maintenance occupations (4.9 percent). As a group, these seven occupational groups employed two-fifths (39.5 percent) of older California workers, or a total of nearly 1.5 million workers age 55 and older. The 12 remaining occupational groups employed the remaining one-quarter of older workers, or 932,300 workers in total. According to the 2014 ACS, of the nearly 3.7 million Californians age 55 and older who worked, 272,000 (7.4 percent) lived at or below the 125 percent poverty level. The occupational distribution of these workers was very different than that of older workers generally. Figure 12 shows the 10 occupational groups that employed the largest numbers and share of low income older workers in California in 2014.4 These 10 occupational groups combined employed four out of every five (80.3 percent) of the low income working older Californians in 2014.
Figure 12
Source: U.S. Census Bureau, American Community Survey, 2014.
4 Given the small size of low income older workers, comparatively large statistical errors may be associated with the occupational numbers and shares in Figure 12. As such, they should be considered to be indicative only.
12,000; 4.4%
12,700; 4.7%
15,200; 5.6%
17,400; 6.4%
20,500; 7.5%
21,400; 7.9%
23,600; 8.7%
27,400: 10.1%
32,800; 12.0%
35,700: 13.1%
0 10,000 20,000 30,000 40,000 50,000
Farming, Fishing, andForestry Occs.
Management Occs.
Construction andExtraction Occs.
Food Preparation andServing-Related Occs.
Production Occs.
Transportation andMaterial Moving Occs.
Office and AdministrativeSupport Occs.
Sales and Related Occs.
Building, Grounds Cleaning and Maintenance Occs.
Personal Care andService Occs.
Number and Share of Low Income Older Workers
Occ
upat
iona
l Gro
ups
(Occ
s.)
Ten Largest Occupational Groups for Californians Age 55 Years and Over Living At or Below the 125 Percent Poverty Level in 2014
(Annual Average Data; Number of Workers, Percent of Total)

Appendix D
15
The largest number and share of low income older Californians worked in personal care and service occupations (13.1 percent), followed by building, grounds cleaning, and maintenance occupations (12.0 percent) and sales and related occupations (10.1 percent). Together, these three occupational groups employed more than one-third of California’s low income older workers in 2014. Five additional occupational groups employed more than five percent of California’s low income older workers: office and administrative support occupations (8.7 percent), transportation and material moving occupations (7.9 percent), production occupations (7.5 percent), food preparation and serving-related occupations (6.4 percent), and construction and extraction occupations (5.6 percent). As a group, these five occupational groups employed 98,100 low income older workers, or more than one-third (36.0 percent) of all the older California workers who lived at or below the 125 percent poverty level in 2014. Much more detailed occupational data are available from the American Community Survey (ACS). Table 5 lists the 20 occupations that employed the greatest numbers of working Californians age 55 and older in 2014. These 20 occupations employed over one-third (35.4 percent) of older working Californians in 2014.
Table 5 Twenty Occupations That Employed the Most Older Working Californians in 2014
Occupation Number
Miscellaneous Managers 139,500 Personal Care Aides 97,600 Secretaries and Administrative Assistants 88,600 Elementary and Middle School Teachers 88,300 Retail Salespersons 84,200 Driver/Sales Workers and Truck Drivers 81,700 Registered Nurses 79,600 Janitors and Building Cleaners 71,100 First-Line Supervisors of Retail Sales Workers 64,800 Chief Executives and Legislators 61,300 Accountants and Auditors 60,500 Maids and Housekeeping Cleaners 55,000 Lawyers, and Judges, Magistrates, and Other Judicial Workers 51,100 Real Estate Brokers and Sales Agents 49,100 Bookkeeping, Accounting, and Auditing Clerks 49,000 Postsecondary Teachers 48,500 Office Clerks, General 39,200 Miscellaneous Agricultural Workers, Including Animal Breeders 38,400 Grounds Maintenance Workers 38,100 Customer Service Representatives 37,700
Source: U.S. Census Bureau, American Community Survey, 2014.

Appendix D
16
Table 6 lists the 20 occupations that employed the greatest numbers of older working Californians who lived at or below the 125 percent poverty level in 2014.5 These 20 occupations employed nearly half (47.6 percent) of the low income working Californians age 55 and over in 2014.
Table 6 Twenty Occupations That Employed the Most Older Working Californians Who Lived At
or Below the 125 Percent Poverty Level in 2014
Occupation Number Personal Care Aides 20,700 Maids and Housekeeping Cleaners 14,200 Miscellaneous Agricultural Workers 10,200 Janitors and Building Cleaners 9,600 Retail Salespersons 9,300 Childcare Workers 8,500 Driver/Sales Workers and Truck Drivers 7,600 Grounds Maintenance Workers 7,600 Construction Laborers 5,900 Cashiers 5,800 Cooks 5,700 Miscellaneous Managers 4,800 Laborers and Freight, Stock, and Material Movers, Hand 4,400 Security Guards and Gaming Surveillance Officers 3,800 Nursing, Psychiatric, and Home Health Aides 3,700 Stock Clerks and Order Fillers 3,500 Secretaries and Administrative Assistants 3,400 Sewing Machine Operators 3,200 Real Estate Brokers and Sales Agents 2,900 Office Clerks, General 2,800
Source: U.S. Census Bureau, American Community Survey, 2014. Table 7 shows the median wages of occupations that employ comparatively large numbers of older California, are projected grow at a relatively fast rate through 2022, and which require only lower moderate education and training levels. The identified occupations were selected because they were among the largest employers of older workers as revealed by the 2014 ACS and among the fastest growing occupations in the California Employment Development Department’s 2012-2022 occupational employment projections. The occupations are grouped education and training levels and ranked by median hourly wage. Unfortunately, the occupational titles of the ACS differ from those of the U.S. Bureau of Labor Statistics’ (BLS) Standard Occupational Classification (SOC) system, so in some respects the selected occupations represent the best fit.6
5 These estimates are subject to statistical error associated with small sample size and should be viewed as indicative only. 6 The differences reflect a slightly different pattern in how SOC-coded occupations are aggregated and disaggregated in the ACS data.

Appendix D
17
Table 7 Largest Occupations for Working Californians Age 55 and Over by Wage and That
Require Short-Tern and Moderate Education and Training Level
Source: California Employment Development Department, Occupational Employment Statistics (OES), 2014. The lower-paying occupations in Table 7 all require only short-term on-the-job training. Many employers of these occupations prefer an applicant to have a high school diploma or a GED, but it is not a formal requirement. Short-term on-the-job training is defined by BLS as the skills needed for a worker to attain competency in an occupation that can be acquired during one month or less of on-the-job experience and informal training. Training is occupation-specific rather than job specific. As a result, therefore, skills learned can be transferred to another job in the same occupation. This on-the-job training category also includes employer sponsored training programs. The moderate skill and training level occupations in Table 7 typically require postsecondary vocational education, some work experience in a related occupation, or moderate on-the-job training. A postsecondary vocational education usually refers to a two-year vocational degree or certification from an accredited vocational program. The term “work experience in a related occupation” indicates that work experience in a related occupation is often considered by employers to be a necessary requirement for entry into the occupation, or is a commonly accepted substitute for formal types of training. The BLS defines moderate-term on-the-job training as the more than 1 month and up to 12 months of combined on-the-job experience and
Occupation Median Hourly*
Median Annual*
Education and Training Level**
Construction Managers $49.61 $103,193 Moderate-Term On-the-Job TrainingWriters and Authors $38.50 $80,067 Moderate-Term On-the-Job TrainingSales Representatives, Wholesale and Manufacturing, Technical and Scientific Products $38.28 $79,610 Moderate-Term On-the-Job TrainingInsurance Sales Agents $27.38 $56,964 Moderate-Term On-the-Job TrainingClergy $26.21 $54,521 Moderate-Term On-the-Job TrainingSales Representatives, Wholesale and Manufacturing, Except Technical and Scientific Products $26.03 $54,152 Moderate-Term On-the-Job TrainingPainters, Construction and Maintenance $20.12 $41,844 Moderate-Term On-the-Job TrainingBookkeeping, Accounting, and Auditing Clerks $19.68 $40,938 Moderate-Term On-the-Job TrainingBus Drivers, Transit and Intercity $19.31 $40,172 Moderate-Term On-the-Job TrainingPainters, Transportation Equipment $18.59 $38,656 Moderate-Term On-the-Job TrainingInspectors, Testers, Sorters, Samplers, and Weighers $17.80 $37,019 Moderate-Term On-the-Job TrainingCooks, Restaurant $11.22 $23,317 Moderate-Term On-the-Job Training
Personal Care Aides $10.33 $21,473 Short-Term On-the-Job TrainingRetail Salespersons $10.77 $22,405 Short-Term On-the-Job TrainingHeavy and Tractor-Trailer Truck Drivers $19.77 $41,117 Short-Term On-the-Job TrainingJanitors and Cleaners, Except Maids and Housekeeping Cleaners $11.71 $24,345 Short-Term On-the-Job TrainingMaids and Housekeeping Cleaners $10.71 $22,279 Short-Term On-the-Job TrainingOffice Clerks, General $15.24 $31,704 Short-Term On-the-Job TrainingCashiers $9.98 $20,762 Short-Term On-the-Job TrainingConstruction Laborers $19.06 $39,658 Short-Term On-the-Job TrainingChildcare Workers $11.14 $23,176 Short-Term On-the-Job TrainingCustomer Service Representatives $17.77 $36,949 Short-Term On-the-Job Training
Lower-Paying Occupations that Require Limited Level of Education, Training, or Experience
Occupations that Require a Moderate Level of Education, Training, or Experience
* Wages are from the first quarter of 2014 and do not include self-employed or unpaid family workers** BLS-defined occupational training and education classifications

Appendix D
18
informal training necessary for workers to become competent in a particular set of skills. Since the training is occupation-specific rather than job-specific, learned skills can be easily transferred to another job in the same occupation. The Moderate-term on-the-job training category also includes employer-sponsored training programs. Middle tier occupations likely provide a sufficient wage for full-time employment for some older Californians, giving them a choice to retire or continue working out of economic necessity. It is also likely that some older workers re-enter the workforce into these occupations if they have the required education, training, and experience.

California SCSEP State Plan Modification PY 2016-19 1 California Department of Aging
Appendix E: California Area Agencies on Aging (AAA)
The California Department of Aging contracts with a statewide network of 33 Area Agencies on Aging (AAA) that coordinates a wide array of services for older adults, adults with disabilities, and their families. You can contact your local AAA by calling the toll-free Senior Information Line at 1-800-510-2020 or by searching for the AAA that serves your county at California Area Agencies on Aging Alpha Listing. California’s 33 AAAs are listed below.
PSA 1 Area 1 Agency on Aging 434 7th Street Eureka, California 95501 (707) 442-3763 http://www.a1aa.org Del Norte & Humboldt Counties
PSA 2 Planning and Service Area II, Area Agency on Aging 208 West Center Street Yreka, California 96097 (530) 842-1687 http://www.psa2.org Lassen, Modoc, Shasta, Siskiyou, & Trinity Counties
PSA 3 PASSAGES Area 3 Agency on Aging 25 Main Street, Suite 202 Chico, California 95929 (530) 898-5923 http://www.passagescenter.org Butte, Colusa, Glenn, Plumas, & Tehama Counties
PSA 4 Area 4 Agency on Aging 1401 El Camino Avenue, 4th Floor Sacramento, CA 95815 (916) 486-1876 http://www.a4aa.com Nevada, Placer, Sierra, Sacramento, Sutter, Yolo & Yuba Counties
PSA 5 County of Marin Health and Human Services Aging and Adult Services 10 North San Pedro Road Suite 1023 San Rafael, California 94903 (415) 473-3696 https://www.marinhhs.org/aging-adult-services Marin County
PSA 6 Department of Aging and Adult Services, Area Agency on Aging 1650 Mission Street, 5th Floor San Francisco, California 94103 (415) 355-3555 http://www.agingcare.com City & County of San Francisco
PSA 7 Contra Costa County Area Agency on Aging 400 Ellinwood Way Pleasant Hill, CA 94523 (925) 229-8434 http://ehsd.org/elderly-disabled/area-agency-on-aging/ Contra Costa County
PSA 8 San Mateo County, Area Agency on Aging 225 37th Avenue, Room 140 San Mateo, California 94403 (800) 675-8437 http://smchealth.org San Mateo County
PSA 9 Alameda County Area Agency on Aging, Department of Adult and Aging Services 6955 Foothill Boulevard, Suite 300 Oakland, California 94605-1907 (510) 577-1900 https://alamedasocialservices.org/public/departments/adult_aging_and_medi-cal_services/index.cfm Alameda County

California SCSEP State Plan Modification PY 2016-19 2 California Department of Aging
PSA 10 Sourcewise Community Resource Solutions 2115 The Alameda San Jose, California 95126 (408) 350-3200 http://www.mysourcewise.com Santa Clara County
PSA 11 San Joaquin, Department of Aging and Community Services 102 South San Joaquin Street PO Box 201056 Stockton, California 95201-3006 (209) 468-2202 http://www.sjchsa.org/Services/Aging-Community San Joaquin County
PSA 12 Area 12 Agency on Aging 19074 Standard Road, Suite A Sonora, California 95370-7542 (209) 532-6272 http://www.area12.org Alpine, Amador, Calaveras, Mariposa, & Tuolumne Counties
PSA 13 Seniors Council of Santa Cruz 234 Santa Cruz Avenue Aptos, California 95003 (831) 688-0400 http://www.seniorscouncil.org/ San Benito & Santa Cruz Counties
PSA 14 Fresno- Madera Area Agency on Aging 3837 N. Clark Street Fresno, California 93726 (559) 600-4405 http://www.fmaaa.org/ Fresno & Madera Counties
PSA 15 King-Tulare Area Agency on Aging 5957 South Mooney Boulevard Visalia, California 93277 (559) 624-8000 http://www.ktaaa.org Kings & Tulare Counties
PSA 16 Eastern Sierra Area Agency on Aging 163 May Street Bishop, California 93514 (760) 873-3305 http://www.inyocounty.us/aging/ Inyo & Mono Counties
PSA 17 Area Agency on Aging, Central Coast Commission for Senior Citizens 528 South Broadway Santa Maria, California 93454 (805) 925-9554 http://www.centralcoastseniors.org Santa Barbara & San Luis Obispo Counties
PSA 18 Ventura County Area Agency on Aging 646 County Square Dr., Suite 100 Ventura, California 93003 (805) 477-7300 https://vcaaa.org/ Ventura County
PSA 19 County of Los Angeles Workforce Development, Aging and Community Services 3175 West Sixth Street, Room 302 Los Angeles, California 90020 (888) 202-4248 http://wdacs.lacounty.gov/ Los Angeles County
PSA 20 San Bernardino County Department of Aging and Adult Services 784 E. Hospitality Lane San Bernardino, California 92415 (909) 891-3900 http://hss.sbcounty.gov/daas San Bernardino County
PSA 21 County of Riverside Office on Aging 6296 Rivercrest Drive, Suite K Riverside, California 92507 (951) 867-3800 https://www.rcaging.org/ Riverside County

California SCSEP State Plan Modification PY 2016-19 3 California Department of Aging
PSA 22 Orange County Office on Aging 1300 S. Grand Ave., Bldg. B 2nd Floor Santa Ana, California 92705 (714) 480-6450 http://www.officeonaging.ocgov.com/ Orange County
PSA 23 County of San Diego, Aging & Independent Services 5560 Overland Avenue, Suite 310 San Diego, California 92123 (858) 495-5885 http://www.sdcounty.ca.gov/hhsa/programs/ais/ San Diego County
PSA 24 Imperial County Area Agency on Aging 778 West State Street El Centro, California 92243 (442) 265-7030 http://www.aaa24.org/area-agency-on-aging.html Imperial County
PSA 25 City of Los Angeles, Department of Aging 221 North Figueroa Street Suite 500 Los Angeles, California 90012 (213) 482-7252 http://aging.lacity.org/ Los Angeles City
PSA 26 Lake and Mendocino Counties Area Agency on Aging 16170 Main St., Unit D Lower Lake, California 95457 (707) 995-4260 https://www.agingcare.com/local/lake-and-mendocino-counties-area-agency-on-aging-lower-lake-area-agency-on-aging-ca Lake and Mendocino Counties
PSA 27 Sonoma County, Area Agency on Aging 3725 Westwind Boulevard Santa Rosa, California 95403 (707) 565-5931 https://sonomacounty.ca.gov/Human-Services/Adult-and-Aging/Services/ Sonoma County
PSA 28 Area Agency on Aging, Serving Napa & Solano 400 Contra Costa Street Vallejo, California 94590-5990 (707) 644-6612 http://www.aaans.org Napa & Solano Counties
PSA 29 El Dorado County, Area Agency on Aging 3057 Briw Road, Suite A Placerville, California 95667 (530) 621-6150 http://www.edcgov.us/Government/HumanServices El Dorado County
PSA 30 Stanislaus County, Department of Aging & Veteran Services 3500 Coffee Road, Suite 19 Modesto, California 95355-1201 (209) 558-8698 http://www.agingservices.info/ Stanislaus County
PSA 31 Area Agency on Aging, Merced County 851 West 23rd Street Merced, California 95340 (209) 385-7550 http://www.co.merced.ca.us/index.aspx?nid=1475 Merced County
PSA 32 Monterey County Area Agency on Aging 1000 S. Main Street, Suite 301 Salinas, California 93901 (831) 755-4466 http://mcdss.co.monterey.ca.us/aging/ Monterey County
PSA 33 Kern County Aging & Adult Services 5357 Truxtun Avenue Bakersfield, California 93309 (661) 868-1000 http://www.co.kern.ca.us/aas/ Kern County

Appendix F: California Frontier, Rural and Urban Defined Areas
Source: http://www.oshpd.ca.gov/hwdd/Research_Policy_Planning_GIS.html

Appendix G: Exhibit G-1 California State PY 2016 and PY 2017 SCSEP Equitable Distribution Chart
PY 2017 Equitable Distributioni PY 2016 Equitable Distribution
California Counties
Total CDA Authorized Positionsii
Total National SCSEP
Grantees Authorized Positions
Total California
Authorized Positions
Total CDA Authorized Positionsiii
Total National SCSEP
Grantees Authorized Positions
Total California
Authorized Positions
Alameda 15 100 115 16 109 125
Alpine 0 0 0 0 0 0
Amador 0 5 5 0 5 5
Butte 0 24 24 0 27 27
Calaveras 0 5 5 0 6 6
Colusa 0 2 2 0 2 2
Contra Costa 0 63 63 0 69 69
Del Norte 0 5 5 0 5 5
El Dorado 0 14 14 0 15 15
Fresno 23 68 91 25 74 99
Glenn 0 4 4 0 4 4
Humboldt 0 15 15 0 16 16
Imperial 0 22 22 0 24 24
Inyo 0 3 3 0 3 3
Kern 0 71 71 0 78 78
Kings 2 9 11 2 10 12
Lake 0 11 11 0 12 12
Lassen 0 3 3 0 3 3
Los Angeles 327 632 959 360 692 1052
Madera 0 15 15 0 16 16
Marin 14 8 22 15 9 24
Mariposa 0 3 3 0 3 3
Mendocino 0 12 12 0 13 13
Merced 0 23 23 0 25 25
Modoc 0 2 2 0 2 2
Mono 0 2 2 0 2 2
Monterey 0 27 27 0 30 30
Napa 0 10 10 0 11 11
Nevada 0 10 10 0 11 11
Orange 75 122 197 82 133 215
Placer 0 24 24 0 26 26
Plumas 0 3 3 0 3 3
Riverside 76 101 177 83 110 193
Sacramento 0 121 121 0 133 133
San Benito 0 4 4 0 4 4
San Bernardino 36 128 164 39 140 179

Appendix G: Exhibit G-1 California State PY 2016 and PY 2017 SCSEP Equitable Distribution Chart
PY 2017 Equitable Distribution PY 2016 Equitable Distribution
California Counties
Total CDA Authorized Positions
Total National SCSEP
Grantees Authorized Positions
Total California
Authorized Positions
Total CDA Authorized Positions
Total National SCSEP
Grantees Authorized Positions
Total California
Authorized Positions
San Diego 45 190 235 49 209 258
San Francisco 0 98 98 0 107 107
San Joaquin 13 44 57 14 48 62 San Luis Obispo 0 22 22 0 23 23
San Mateo 0 27 27 0 30 30
Santa Barbara 0 28 28 0 31 31
Santa Clara 36 77 113 39 84 123
Santa Cruz 0 20 20 0 22 22
Shasta 0 19 19 0 21 21
Sierra 0 0 0 0 1 1
Siskiyou 0 7 7 0 8 8
Solano 0 27 27 0 29 29
Sonoma 0 38 38 0 41 41
Stanislaus 14 37 51 15 40 55
Sutter 0 9 9 0 10 10
Tehama 0 7 7 0 8 8
Trinity 0 2 2 0 2 2
Tulare 11 36 47 12 39 51
Tuolumne 0 6 6 0 7 7
Ventura 12 41 53 13 45 58
Yolo 0 15 15 0 16 16
Yuba 0 6 6 0 7 7
Total 699 2427 3126 764 2653 3417
i PY 2017 Title V/SCSEP Federal appropriations were reduced by approximately 8.5 percent from the previous year. ii CDA is in the process of aligning with the U.S. Department of Labor Equitable Distribution results by PY 2018. CDA submitted an Equitable Distribution Implementation Plan on October 2, 2017, which was approved by the National SCSEP Office and the DOL Grant Officer. iii Ibid.

Appendix G: Exhibit G-2
California SCSEP State Plan Modification 2016-19 California Department of Aging
California Department of Aging (CDA) - PY 2017 SCSEP Participant Slot Geographic Locations1
Subrecipient Code County or City
County Unemployment
Rate – February 20182 Area Agency on Aging (AAA)
Contracted Service (Sub-Subrecipient)
Experienced SCSEP
Provider
Participant Slots
PY 20173
CA005 Marin County 2.5% Division of Aging/Marin County Marin County Employment and Training Yes 14
CA009 Alameda County 3.2% Alameda Co. AAA, Department of
Adult and Aging Services SER Jobs for Progress,
Inc. Yes 15 CA010 Santa Clara County 2.9% Council on Aging, Silicon Valley Yes 36
CA011 San Joaquin County4 7.1% San Joaquin County Department of Aging and Community Services Yes 13
CA014 Fresno & Madera
Counties4 9.1% & 8.3% Fresno-Madera AAA5 SER-Jobs for Progress, Inc. Yes 23
CA015 Kings & Tulare Counties4 9.7% & 11.3% Kings-Tulare AAA Community Services and
Employment Training Yes 13
CA018 Ventura County 4.0% Ventura County AAA SER-Jobs for Progress, Inc. Yes 12
CA019 Los Angeles County4 4.5% AAA, County of Los Angeles Yes 175
CA020 San Bernardino County4 4.3%
San Bernardino County Department of Aging and Adult
Services Yes 36
CA021 Riverside County4 4.6% County of Riverside Office on
Aging Yes 76
CA022 Orange County 3.1% Orange County Office on Aging
Orange County Workforce Investment Board,
SCSEP Orange County Yes 75
CA023 San Diego County 3.5% San Diego Aging and
Independence Services Jewish Family Service of
San Diego Yes 45
CA025 City of Los Angeles4 4.5% City of Los Angeles Department
of Aging Yes 152
CA030 Stanislaus County4 7.5% Stanislaus County Department of
Aging and Veterans Services5 SER-Jobs for Progress,
Inc. Yes 14 Total 699
1 CDA is in the process of aligning with the U.S. Department of Labor (DOL) Equitable Distribution results by PY 2018. CDA submitted an Equitable Distribution Implementation Plan on October 2, 2017, the Plan was approved by the National SCSEP Office and the DOL Grant Officer.
2 California Labor Market Review – Labor Force Data for All Counties February 2018, http://www.labormarketinfo.edd.ca.gov/file/lfmonth/countyur-400c.pdf 3 PY 2017 Title V/SCSEP Federal appropriations were reduced by approximately 8.5 percent from the previous year. 4 CDA sub-grantees with unemployment rates greater than the February 2018 national average unemployment rate of 4.1 percent. Bureau of Labor Statistics – February 2018: https://data.bls.gov/timeseries/LNS14000000
5 Fresno-Madera AAA (CA014) and Stanislaus County Department of Aging and Veterans Services have terminated their CDA Title V/SCSEP contracts effective July 1, 2018. CDA currently has an Request for Proposal issued for SCSEP services in these two areas and San Mateo County to align with DOL Equitable Distribution results by PY 2018.

Appendix H: California Population Aged 55 and Older Low Income, Non-Minority, Minority and Rural Demographics
State/County 55+ Population Low Income
125 Percent of Federal Poverty
Guidelines Non-Minority Minority Rural
California 9,512,647
1,250,357
5,104,583
4,473,382
673,753
Alameda 395,326
44,845
172,719 213,720
2,052
Alpine 439
70
325 86
439
Amador 15,709
1,525
13,699 1,773
11,484
Butte 67,851
9,705
57,245 9,409
12,412
Calaveras 19,624
2,440
16,855 2,266
16,916
Colusa 5,327
684
3,310 2,039
2,803
Contra Costa 300,810
25,590
179,382 112,393
5,949
Del Norte 8,145
1,845
6,644 1,449
3,064
El Dorado 63,895
4,785
52,647 7,673
23,692
Fresno 206,144
34,330
104,847 115,254
27,501
Glenn 7,664
1,440
5,709 1,959
3,300
Humboldt 40,324
5,785
34,554 4,859
13,153
Imperial 39,850
9,460
8,984 36,088
8,928
Inyo 6,963
1,025
5,568 1,249
3,296
Kern 174,067
28,495
99,048 77,401
25,293
Kings 27,478
4,245
13,918 15,172
4,043
Lake 24,119
4,675
19,889 4,229
10,327
Lassen 7,903
1,085
6,637 1,284
5,273
Los Angeles 2,377,750
382,955
915,648 1,585,017
19,314
Madera 36,741
6,020
22,544 14,890
16,225
Marin 91,083
6,800
75,709 13,190
6,200
Mariposa 7,705
1,000
6,596 1,022
7,705
Mendocino 30,366
4,835
25,255 4,837
15,419
Merced 53,411
9,330
26,726 30,486
9,806
Modoc 3,557
640
3,195 397
2,550
Mono 3,808
364
3,125 631
1,817
Monterey 98,859
11,305
54,711 45,151
13,093
Napa 42,776
4,130
31,665 10,997
7,568
Nevada 41,372
4,160
36,656 3,102
17,777

Appendix H: California Population Aged 55 and Older Low Income, Non-Minority, Minority and Rural Demographics
County 55+ Population Low Income
125 Percent of Federal Poverty
Guidelines Non-Minority Minority Rural
Orange 782,970
79,080
449,883 318,530
2,552
Placer 115,344
9,255
91,545 17,142
28,443
Plumas 8,310
1,095
7,579 704
7,571
Riverside 556,604
72,450
323,727 236,124
51,173
Sacramento 365,317
48,540
217,492 137,269
8,651
San Benito 13,556
1,654
7,099 6,112
3,396
San Bernardino 444,865
66,370
212,510 243,924
38,535
San Diego 786,963
93,795
480,018 288,677
32,709
San Francisco 226,254
41,160
87,881 137,523 0
San Joaquin 162,004
22,555
83,151 80,801
16,692
San Luis Obispo 88,430
8,490
71,625 13,846
16,253
San Mateo 209,085
16,920
111,348 96,353
3,147
Santa Barbara 110,821
11,555
74,907 37,407
6,099
Santa Clara 446,293
45,910
211,835 226,745
5,537
Santa Cruz 74,666
7,980
55,280 18,261
11,897
Shasta 61,004
7,810
52,956 6,221
19,434
Sierra 1,432
295
1,297 114
1,432
Siskiyou 17,595
2,975
15,173 2,276
11,899
Solano 115,336
10,445
58,032 53,900
5,082
Sonoma 156,910
14,595
124,079 28,537
26,347
Stanislaus 122,865
18,075
76,992 46,112
11,259
Sutter 24,680
3,600
15,424 8,948
3,757
Tehama 19,815
3,305
16,558 2,992
9,859
Trinity 5,821
870
5,081 645
5,821
Tulare 91,434
17,730
48,874 45,244
19,459
Tuolumne 22,020
2,510
19,379 2,393
11,945
Ventura 220,523
19,715
139,442 77,939
7,613
Yolo 45,882
5,390
29,560 15,912
4,106
Yuba 16,782
2,665
12,046 4,708
5,686
Source: 2014 American Community Survey 1-Year Estimates S0101 Age and Sex, Race & Ethnicity Table S21043A - Age by Ratio of Income to Poverty Level (125%) in the Past 12 Months for the Population for Whom Poverty Status is Determined
2014 American Community Survey 1-Year Estimates SF1_H002 Rural-Urban (Note: Rural data percentage based on total population age 55 and over for each county.)
http://factfinder.census.gov/faces/nav/jsf/pages/searchresults.xhtml?refresh=t
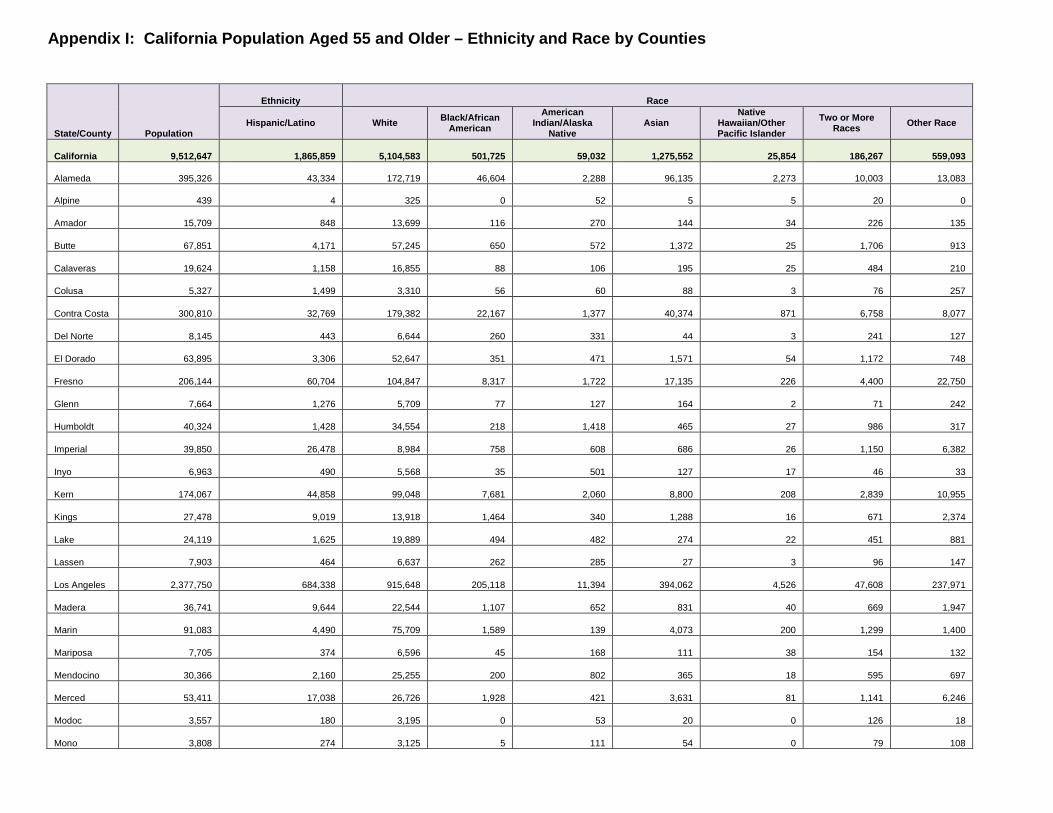
Appendix I: California Population Aged 55 and Older – Ethnicity and Race by Counties
State/County Population
Ethnicity Race
Hispanic/Latino White Black/African American
American Indian/Alaska
Native Asian
Native Hawaiian/Other Pacific Islander
Two or More Races Other Race
California 9,512,647 1,865,859 5,104,583
501,725 59,032
1,275,552 25,854 186,267 559,093
Alameda
395,326
43,334
172,719 46,604
2,288 96,135
2,273
10,003
13,083
Alpine
439
4
325 0
52 5
5
20 0
Amador
15,709
848
13,699 116
270 144
34
226
135
Butte
67,851
4,171
57,245 650
572 1,372
25
1,706
913
Calaveras
19,624
1,158
16,855 88
106 195
25
484
210
Colusa
5,327
1,499
3,310 56
60 88
3
76
257
Contra Costa
300,810
32,769
179,382 22,167
1,377 40,374
871
6,758
8,077
Del Norte
8,145
443
6,644 260
331 44
3
241
127
El Dorado
63,895
3,306
52,647 351
471 1,571
54
1,172
748
Fresno
206,144
60,704
104,847 8,317
1,722 17,135
226
4,400
22,750
Glenn
7,664
1,276
5,709 77
127 164
2
71
242
Humboldt
40,324
1,428
34,554 218
1,418 465
27
986
317
Imperial
39,850
26,478
8,984 758
608 686
26
1,150
6,382
Inyo
6,963
490
5,568 35
501 127
17
46
33
Kern
174,067
44,858
99,048 7,681
2,060 8,800
208
2,839
10,955
Kings
27,478
9,019
13,918 1,464
340 1,288
16
671
2,374
Lake
24,119
1,625
19,889 494
482 274
22
451
881
Lassen
7,903
464
6,637 262
285 27
3
96
147
Los Angeles
2,377,750
684,338
915,648 205,118
11,394 394,062
4,526
47,608
237,971
Madera
36,741
9,644
22,544 1,107
652 831
40
669
1,947
Marin
91,083
4,490
75,709 1,589
139 4,073
200
1,299
1,400
Mariposa
7,705
374
6,596 45
168 111
38
154
132
Mendocino
30,366
2,160
25,255 200
802 365
18
595
697
Merced
53,411
17,038
26,726 1,928
421 3,631
81
1,141
6,246
Modoc
3,557
180
3,195 0
53 20 0
126
18
Mono
3,808
274
3,125 5
111 54 0
79
108

Appendix I: California Population Aged 55 and Older – Ethnicity and Race by Counties
State/County Population
Ethnicity Race
Hispanic/Latino White Black/African American
American Indian/Alaska
Native Asian
Native Hawaiian/Other Pacific Islander
Two or More Races Other Race
Monterey
98,859
26,031
54,711 2,885
772 7,952
429
2,225
4,857
Napa
42,776
5,162
31,665 651
210 2,600
249
634
1,491
Nevada
41,372
1,431
36,656 92
332 465
62
512
208
Placer
115,344
6,935
91,545 1,209
630 5,453
116
1,379
1,420
Plumas
8,310
308
7,579 34
126 15 0
207
14
Riverside
556,604
122,859
323,727 28,344
3,288 32,173
1,136
9,798
38,526
Sacramento
365,317
37,045
217,492 28,160
2,474 47,704
2,425
8,497
10,964
San Benito
13,556
4,691
7,099 70
119 296
31
297
608 San Bernardino
444,865
126,582
212,510 33,207
3,643 32,899
944
9,358
37,291
San Diego
786,963
132,122
480,018 28,608
4,112 82,361
2,711
13,177
25,586 San Francisco
226,254
21,216
87,881 14,444
617 89,704
547
4,230
6,765
San Joaquin
162,004
32,514
83,151 10,038
952 21,788
694
5,500
9,315 San Luis Obispo
88,430
7,458
71,625 946
552 2,184 0
1,017
1,689
San Mateo
209,085
26,588
111,348 6,103
676 49,485
1,950
4,038
7,513 Santa Barbara
110,821
22,173
74,907 1,709
819 4,448
141
1,855
6,262
Santa Clara
446,293
61,862
211,835 9,643
2,020 125,411
1,248
8,273
18,288
Santa Cruz
74,666
10,408
55,280 576
224 2,724
117
1,492
2,720
Shasta
61,004
2,285
52,956 285
1,075 867
102
1,252
355
Sierra
1,432
82
1,297 3
11 0 0
9
9
Siskiyou
17,595
848
15,173 198
339 186
2
535
168
Solano
115,336
12,773
58,032 14,291
620 18,959
860
2,657
3,740
Sonoma
156,910
13,123
124,079 1,513
1,055 4,857
350
2,915
4,724
Stanislaus
122,865
26,269
76,992 2,540
1,013 5,809
560
3,333
6,588
Sutter
24,680
3,241
15,424 486
207 3,538
55
684
737
Tehama
19,815
1,630
16,558 43
413 215
4
339
348
Trinity
5,821
188
5,081 24
172 24 0
196
41
Tulare
91,434
31,577
48,874 1,204
929 3,678
176
1,964
5,716

Appendix I: California Population Aged 55 and Older – Ethnicity and Race by Counties
State/County Population
Ethnicity Race
Hispanic/Latino White Black/African American
American Indian/Alaska
Native Asian
Native Hawaiian/Other Pacific Islander
Two or More Races Other Race
Tuolumne
22,020
1,134
19,379 134
336 184
70
234
301
Ventura
220,523
44,509
139,442 3,287
1,244 15,646
301
3,699
9,253
Yolo
45,882
7,936
29,560 863
418 3,405
101
1,028
2,161
Yuba
16,782
1,974
12,046 394
220 823
12
521
764
Source: 2014 American Community Survey 1-Year Estimates S0101 Age and Sex, Race & Ethnicity
http://factfinder.census.gov/faces/nav/jsf/pages/searchresults.xhtml?refresh=t
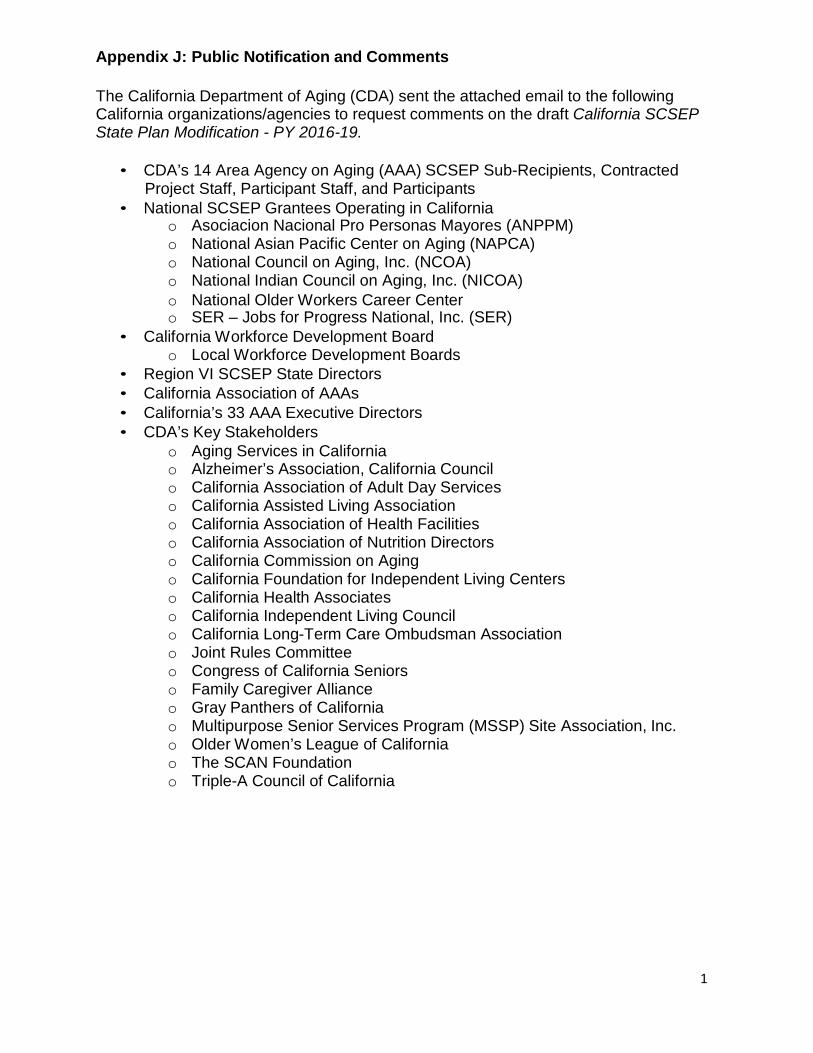
Appendix J: Public Notification and Comments
1
The California Department of Aging (CDA) sent the attached email to the following California organizations/agencies to request comments on the draft California SCSEP State Plan Modification - PY 2016-19.
• CDA’s 14 Area Agency on Aging (AAA) SCSEP Sub-Recipients, Contracted
Project Staff, Participant Staff, and Participants • National SCSEP Grantees Operating in California
o Asociacion Nacional Pro Personas Mayores (ANPPM) o National Asian Pacific Center on Aging (NAPCA) o National Council on Aging, Inc. (NCOA) o National Indian Council on Aging, Inc. (NICOA) o National Older Workers Career Center o SER – Jobs for Progress National, Inc. (SER)
• California Workforce Development Board o Local Workforce Development Boards
• Region VI SCSEP State Directors • California Association of AAAs • California’s 33 AAA Executive Directors • CDA’s Key Stakeholders
o Aging Services in California o Alzheimer’s Association, California Council o California Association of Adult Day Services o California Assisted Living Association o California Association of Health Facilities o California Association of Nutrition Directors o California Commission on Aging o California Foundation for Independent Living Centers o California Health Associates o California Independent Living Council o California Long-Term Care Ombudsman Association o Joint Rules Committee o Congress of California Seniors o Family Caregiver Alliance o Gray Panthers of California o Multipurpose Senior Services Program (MSSP) Site Association, Inc. o Older Women’s League of California o The SCAN Foundation o Triple-A Council of California

Appendix J: Public Notification and Comments
2
Email requesting public comment:
The California Department of Aging (CDA) completed the draft of the California Senior Community Service Employment Program (SCSEP) State Plan Modification – PY 2016-2019. SCSEP is the only federally funded training program for low-income older workers who are 55 years of age or older.
CDA invites you to comment and provide suggestions for the California SCSEP State Plan Modification - PY 2016-19. The closing date for public comment is April 13, 2018. However, comments received after the closing date will be considered when the plan is revised.
CDA encourages you to share this plan with your stakeholders, board members, and workforce partners. CDA welcomes suggestions from our local workforce partners.
The plan is located on the CDA website. To review the plan, please use the following link: http://www.aging.ca.gov/ProgramsProviders/SCSEP/ Click on SCSEP State Plan Modification Draft
Instructions for submitting comments:
Please send your comments to:
State SCSEP Director
California Department of Aging 1300 National Drive, Suite 200 Sacramento, CA 95834-1992
or email:
Comments received by 5:00 P.M., April 13, 2018 may be incorporated into the Final California SCSEP State Plan Modification - PY 2016-19.
Comments received after April 13, 2018, may be included in future
California SCSEP State Plans Thank you for your consideration,
Peggy Stadler SCSEP Specialist California Department of Aging 916-928-2292 [email protected]


