29
CALIFORNIA STATE LOTTERY FUND Financial Statements June 30, 2011 (With Independent Auditors’ Report Thereon)
CALIFORNIA STATE LOTTERY FUND
Financial Statements
June 30, 2011
(With Independent Auditors’ Report Thereon)

KPMG LLP Suite 800 400 Capitol Mall Sacramento, CA 95814
KPMG LLP is a Delaware limited liability partnership, the U.S. member firm of KPMG International Cooperative (“KPMG International”), a Swiss entity.
Independent Auditors’ Report
The California State Lottery Commission Sacramento, California:
We have audited the accompanying statement of net assets of the California State Lottery Fund as of June 30, 2011, and the related statements of revenues, expenses, and changes in net assets and cash flows for the year then ended. These financial statements are the responsibility of the Lottery’s management. Our responsibility is to express an opinion on these financial statements based on our audit.
We conducted our audit in accordance with auditing standards generally accepted in the United States of America. Those standards require that we plan and perform the audit to obtain reasonable assurance about whether the financial statements are free of material misstatement. An audit includes consideration of internal control over financial reporting as a basis for designing audit procedures that are appropriate in the circumstances, but not for the purpose of expressing an opinion on the effectiveness of the Lottery’s internal control over financial reporting. Accordingly, we express no such opinion. An audit also includes examining, on a test basis, evidence supporting the amounts and disclosures in the financial statements, assessing the accounting principles used and significant estimates made by management, as well as evaluating the overall financial statement presentation. We believe that our audit provides a reasonable basis for our opinion.
As discussed in note 1, the financial statements present only the California State Lottery Fund and do not purport to, and do not, present fairly the financial position of the State of California, as of June 30, 2011, the changes in its financial position or its cash flows for the year then ended in conformity with accounting principles generally accepted in the United States of America.
In our opinion, the financial statements referred to above present fairly, in all material respects, the financial position of the California State Lottery Fund as of June 30, 2011, and the changes in its financial position and its cash flows for the year then ended in conformity with accounting principles generally accepted in the United States of America.
The management’s discussion and analysis on pages 2 through 8 is not a required part of the basic financial statements but is supplementary information required by accounting principles generally accepted in the United States of America. We have applied certain limited procedures, which consisted principally of inquiries of management regarding the methods of measurement and presentation of the supplementary information. However, we did not audit the information and express no opinion on it.
October 26, 2011

- 2 -
The following discussion and analysis of the California State Lottery’s fi nancial performance provides an overview of fi nancial activities for the fi scal year ended June 30, 2011. Please read it in conjunction with the California State Lottery Financial Statements that follow this section.
FINANCIAL HIGHLIGHTS
The assets of the Lottery exceeded its liabilities at the close of the most recent fi scal year by $103 million, which is attributable primarily to realized and unrealized gains on Lottery investments used to fund future payments due on annuitized Lottery prizes.
The California Lottery’s contribution to education increased $38.8 million over the last fi scal year. This is the eleventh consecutive year the Lottery will transfer over $1 billion to California’s public schools and colleges. In addition, the California Lottery paid out more than $1.9 billion in prizes to players and approximately $233.6 million in commissions, cashing bonuses, and other applicable fees to retailers.
California Lottery sales revenue increased 13.1 percent, or approximately $397.6 million dollars over last fi scal
year. This is primarily due to an increase in Scratchers sales of approximately $340.8 million, or 20.5 percent. Fiscal year 2010/2011 marked the fi rst full year in which the Lottery implemented two initiatives designed to increase Scratchers ticket sales:
○ Assembly Bill (AB) 142, signed into law in April 2010, gives the California Lottery greater fl exibility to offer higher prize payout percentages. This change allowed the Lottery to keep multiple $5 Scratchers games on the market throughout the fi scal year. Sales of $5 Scratchers games increased 161 percent over the previous fi scal year, increasing from a weekly average of $3.2 million before the implementation of AB 142 to a weekly average of $11 million one year later.
○ The ex$ell initiative - born out of the California Lottery’s RENEW business planning and implementation effort begun last fi scal year - optimizes the District Sales Representatives’ (DSR’s) interactions with Lottery retailers. Ex$ell emphasizes quick activations of new games, prominent display of $5 Scratchers tickets, and optimal product mix to increase sales.
During fi scal year 2010/2011 the California Lottery continued construction of its new headquarters building,
begun the previous fi scal year, accounting for a $41.7 million increase in the building asset account. The new building is LEED certifi ed and contains several environmentally responsible, or green, features. Floor-to-ceiling windows with automated shades provide most work-time lighting. The second fl oor features a green roof and photovoltaic cells to effi ciently manage energy use. The building was completed and staff moved in July 2011.
MANAGEMENT’S DISCUSSION AND ANALYSIS

- 3 -
OVERVIEW OF THE FINANCIAL STATEMENTS
These required statements offer short-term and long-term fi nancial information about the California State Lottery. The Statement of Net Assets provides information about the nature and amounts of investments in resources (assets) and obligations (liabilities) at the close of the fi scal year. All of the current year’s revenues and expenses are accounted for in the Statement of Revenues, Expenses, and Changes in Net Assets. This statement measures the success of the Lottery’s operations over the past year. The fi nal required fi nancial statement is the Statement of Cash Flows. The primary purpose of this statement is to provide information about the Lottery’s cash receipts and cash payments during the reporting period. The statement reports cash receipts, cash payments, and net changes in cash resulting from operations, investing, and fi nancing activities, and provides answers to such questions as where did cash come from and what was cash used for. The fi nancial statements are prepared on the accrual basis in accordance with accounting principles generally accepted in the United States of America. The California State Lottery is structured as a single enterprise fund with revenues recognized when earned, not when received.
NOTES TO THE FINANCIAL STATEMENTS
Financial statement notes provide additional information that is essential to a full understanding of the information provided in the statements. Please refer to the following notes:
Note 1 - provides a general description of signifi cant accounting policies of the California State Lottery including the implementation of new accounting pronouncements, investment accounting policies, and other signifi cant accounting policiesNote 2 - provides information about investments and deposits including the Lottery’s investment policy, risk mitigation, and investment and deposit valuationNote 3 - provides information on accounts receivableNote 4 - provides information on money due to the Lottery from other state fundsNote 5 - provides information on capital assets of the LotteryNote 6 - provides information on the Lottery’s liability to prize winnersNote 7 - provides information on money owed by the Lottery to other state funds, primarily to the Education FundNote 8 - provides information on the operating leases of the LotteryNote 9 - provides information on the Lottery’s investment earningsNote 10 - provides information on the retirement plan for Lottery employees and on Other Postemployment Benefi ts (OPEB)Note 11 - provides information on statutory compliance with the Lottery ActNote 12 - provides information on commitments and contingencies of the LotteryNote 13 - provides information on risk management

- 4 -
June 30, 2010 June 30, 2011 Dollar ChangePercent Change
Current and other assets $ 1,883,682,961 $ 1,731,347,034 $ (152,335,927) (8.1%)Capital assets 42,511,326 86,505,601 43,994,275 103.5% Total assets $ 1,926,194,287 $ 1,817,852,635 $ (108,341,652) (5.6%)
Current liabilities $ 789,943,542 $ 808,419,323 $ 18,475,781 2.3%Long-term liability 1,010,400,578 906,416,841 (103,983,737) (10.3%) Total liabilities $ 1,800,344,120 $ 1,714,836,164 $ (85,507,956) (4.7%)
Invested in capital assets $ 42,511,326 $ 86,505,601 $ 43,994,275 103.5%Restricted by legislation 125,850,167 103,016,471 (22,833,696) (18.1%)Unrestricted (defi cit) (42,511,326) (86,505,601) (43,994,275) 103.5% Total net assets $ 125,850,167 $ 103,016,471 $ (22,833,696) (18.1%)
A summary of the California State Lottery’s change in net assets is presented below:
June 30, 2010 June 30, 2011 Dollar ChangePercent Change
Operating revenues – Lottery sales $ 3,040,959,866 $ 3,438,577,998 $ 397,618,132 13.1%Prizes 1,611,371,074 1,904,787,955 293,416,881 18.2% Sales after prizes $ 1,429,588,792 $ 1,533,790,043 $ 104,201,251 7.3%
Game costs 268,683,202 289,704,738 21,021,536 7.8% Income before operating expenses $ 1,160,905,590 $ 1,244,085,305 $ 83,179,715 7.2%
Operating expenses 136,740,073 143,268,012 6,527,939 4.8% Operating income $ 1,024,165,517 $ 1,100,817,293 $ 76,651,776 7.5%
Non-operating (expenses) revenues (1,045,353,403) (1,123,650,989) (78,297,586) 7.5% Change in net assets $ (21,187,886) $ (22,833,696) $ (1,645,810) 7.8%
Total net assets – beginning of year 147,038,053 125,850,167 (21,187,886) (14.4%)Total net assets – end of year $ 125,850,167 $ 103,016,471 $ (22,833,696) (18.1%)
FINANCIAL ANALYSIS
NET ASSETS
A summary of the California State Lottery’s net assets is presented below:
- 5 -
June 30, 2010 June 30, 2011 Dollar ChangePercent Change
Operating revenues:Lotto games $ 947,769,847 $ 973,179,589 $ 25,409,742 2.7%Scratchers® games 1,661,288,086 2,002,090,072 340,801,986 20.5%Hot Spot® game 117,904,491 130,472,138 12,567,647 10.7%Daily games 313,997,442 332,836,199 18,838,757 6.0%
Total operating revenues $ 3,040,959,866 $ 3,438,577,998 $ 397,618,132 13.1%
Non-operating revenues:Unrealized gains (losses) on investments $ 42,593,853 $ (3,314,895) $ (45,908,748) (107.8%)Interest accreted/earned on investments $ 58,625,052 $ 47,384,134 $ (11,240,918)
(19.2%)
Interest on funds held by State Treasurer 2,732,562 1,976,999 (755,563) (27.7%)Other income 347,694 66,476 (281,218) (80.9%) Total non-operating revenues $ 104,299,161 $ 46,112,714 $ (58,186,447) (55.8%)
Total revenues $ 3,145,259,027 $ 3,484,690,712 $ 339,431,685 10.8%
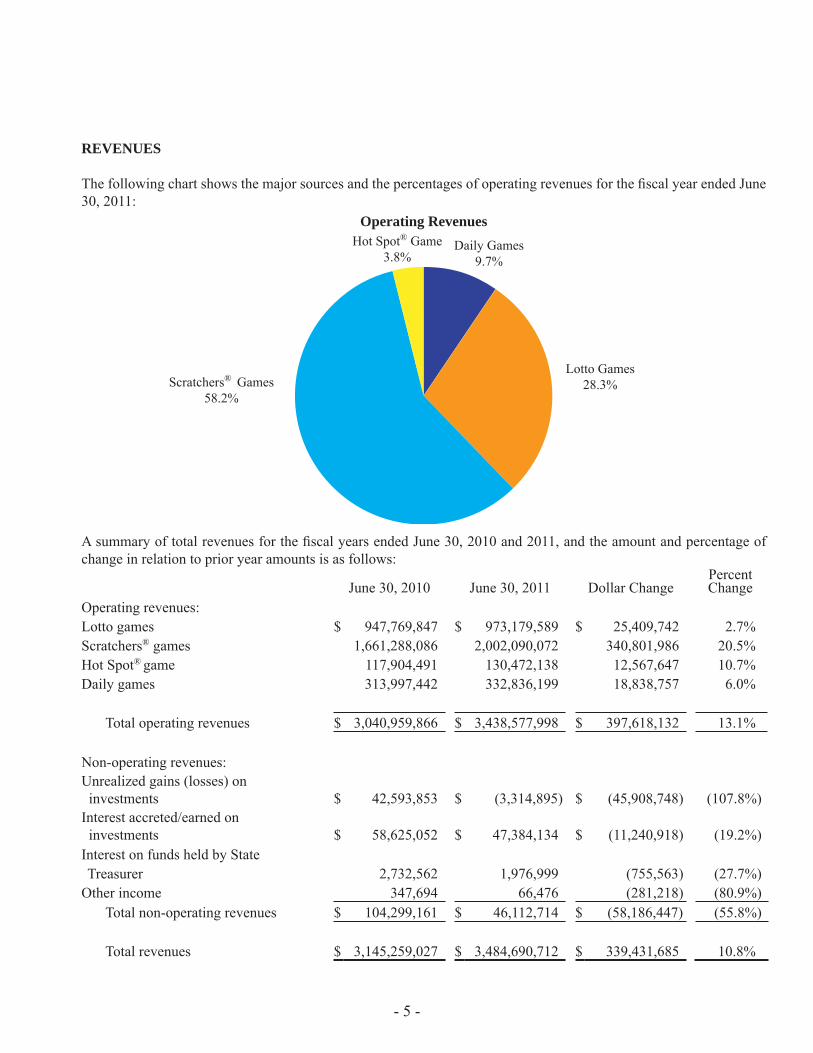
Operating Revenues
Scratchers® Games58.2%
Lotto Games28.3%
Hot Spot® Game 3.8%
Daily Games9.7%
REVENUES
The following chart shows the major sources and the percentages of operating revenues for the fi scal year ended June 30, 2011:
A summary of total revenues for the fi scal years ended June 30, 2010 and 2011, and the amount and percentage of change in relation to prior year amounts is as follows:
- 6 -
The increase in Lottery revenue is primarily attributable to a 20.5 percent increase in sales of Scratchers products due to the ex$ell initiative and AB 142. Offering Scratchers games with higher prize payout percentages and offering an optimized product mix helped to increase Scratchers ticket sales by more than $340.8 million. Sales for all other product categories also increased approximately $56.8 million for the year, leading to a combined total sales increase of 13.1 percent over the previous year. Non-operating revenues were lower, primarily due to a decrease in the fair value of investments and on the interest earned on funds in the Surplus Money Investment Fund (SMIF) due to lower market interest rates.
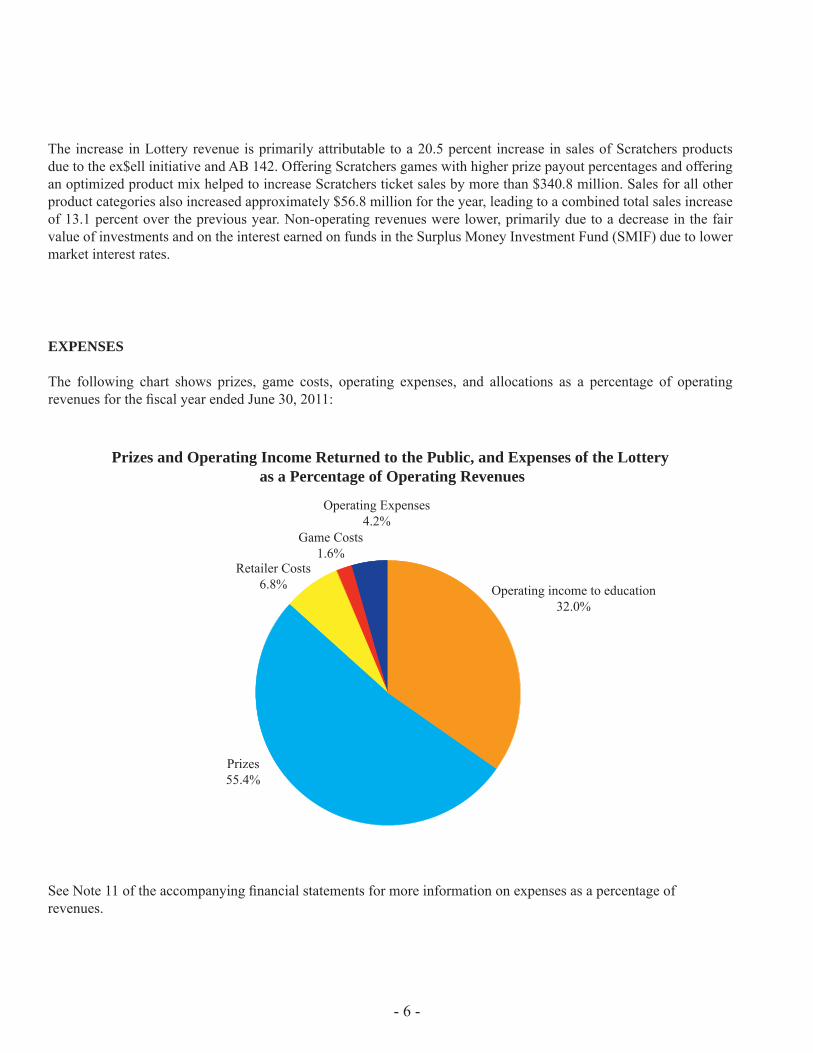
Prizes and Operating Income Returned to the Public, and Expenses of the Lottery as a Percentage of Operating Revenues
Prizes55.4%
Retailer Costs6.8%
Game Costs1.6%
Operating Expenses4.2%
See Note 11 of the accompanying fi nancial statements for more information on expenses as a percentage of revenues.
EXPENSES
The following chart shows prizes, game costs, operating expenses, and allocations as a percentage of operating revenues for the fi scal year ended June 30, 2011:
Operating income to education32.0%

- 7 -
A summary of expenses for the fi scal years ended June 30, 2010 and 2011, and the amount and percentage change in relation to prior year amounts is as follows:
June 30, 2010 June 30, 2011 Dollar ChangePercent Change
Prizes:Draw game prizes $ 674,624,512 $ 708,841,127 $ 34,216,615 5.1%Scratchers game prizes 923,604,176 1,196,097,328 272,493,152 29.5%TV Show 13,142,386 (150,500) (13,292,886) (101.1%) Total prizes $ 1,611,371,074 $ 1,904,787,955 $ 293,416,881 18.2%
Game costs:Retailer costs $ 214,484,059 $ 233,571,290 $ 19,087,231 8.9%Draw/Scratchers game costs 54,199,143 56,133,448 1,934,305 3.6% Total game costs $ 268,683,202 $ 289,704,738 $ 21,021,536 7.8%
Operating expenses:Salaries, wages, and benefi ts $ 46,011,332 $ 52,084,571 $ 6,073,239 13.2%Advertising 33,666,684 52,982,897 19,316,213 57.4%Promotion, public relations, and point of sale 8,025,477 6,635,267 (1,390,210) (17.3%)Other professional services 10,341,565 10,677,764 336,199 3.3%Depreciation and amortization 20,417,236 5,874,683 (14,542,553) (71.2%)Other general and administrative expenses 18,277,779 15,012,830 (3,264,949) (17.9%) Total operating expenses $ 136,740,073 $ 143,268,012 $ 6,527,939 4.8%
Non-operating expenses:Allocations to Education Fund 1,072,496,752 1,102,860,768 30,364,016 2.8%Interest imputed on annuitized prize liability 77,155,812 66,902,935 (10,252,877) (13.3%) Total non-operating expenses $ 1,149,652,564 $ 1,169,763,703 $ 20,111,139 1.7%
Total expenses $ 3,166,446,913 $ 3,507,524,408 $ 341,077,495 10.8%
The increase in Scratchers game prizes is directly related to the increase in Scratchers ticket sales, and to the higher prize payout percentages allowed with the passage of Assembly Bill (AB) 142. Draw game prizes increased in relation to the increase in draw game sales. The negative amount for the TV Show prize expense refl ects the reversal of a prior-year accrual associated with the Make Me a Millionaire television show, which was ended last fi scal year. Associated game costs increased as sales increased. Advertising costs increased 57.4 percent due to the kick-off campaign announcing the higher prize-payout Scratchers games, as well as the continuation of jackpot advertising campaigns started last year. The decrease in depreciation and amortization expense is due to increased expenses last year related to the impairment of the old headquarters building and the television show sets. In addition, a large number of vending machines and gaming equipment fully depreciated and thus depreciation expense was lower in these two categories.
- 8 -
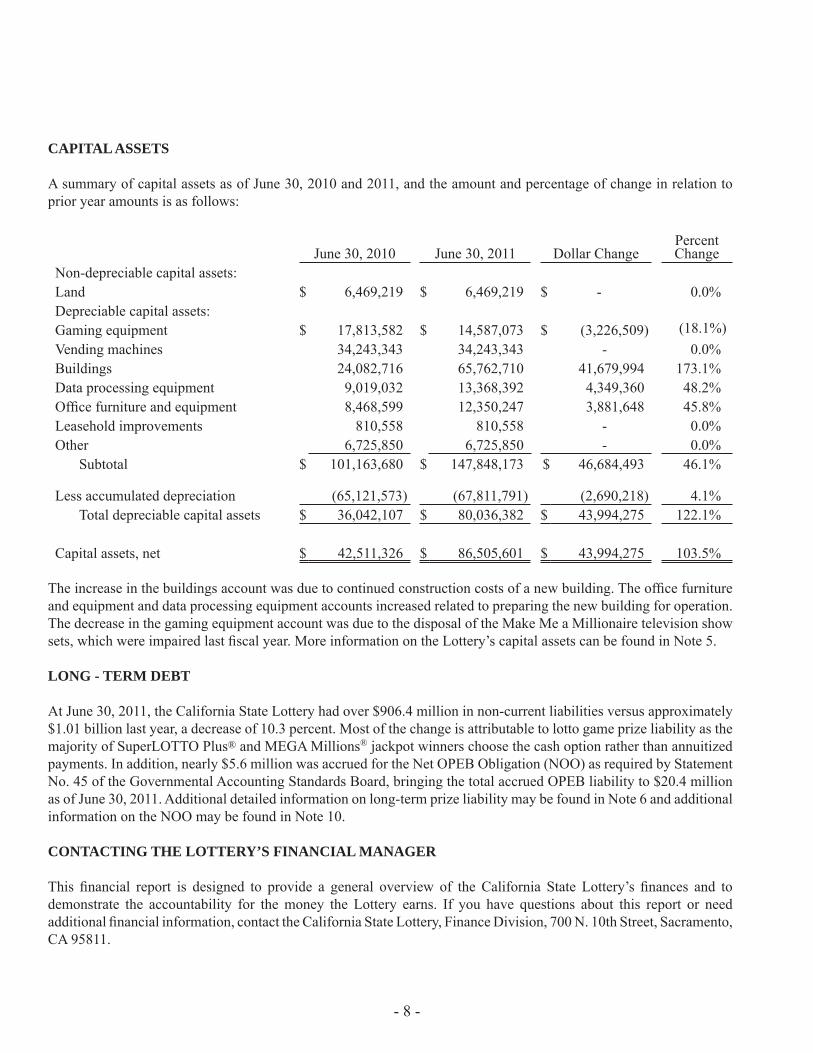
June 30, 2010 June 30, 2011 Dollar ChangePercent Change
Non-depreciable capital assets:Land $ 6,469,219 $ 6,469,219 $ - 0.0%Depreciable capital assets:Gaming equipment $ 17,813,582 $ 14,587,073 $ (3,226,509) (18.1%)Vending machines 34,243,343 34,243,343 - 0.0%Buildings 24,082,716 65,762,710 41,679,994 173.1%Data processing equipment 9,019,032 13,368,392 4,349,360 48.2%Offi ce furniture and equipment 8,468,599 12,350,247 3,881,648 45.8%Leasehold improvements 810,558 810,558 - 0.0%Other 6,725,850 6,725,850 - 0.0% Subtotal $ 101,163,680 $ 147,848,173 $ 46,684,493 46.1%
Less accumulated depreciation (65,121,573) (67,811,791) (2,690,218) 4.1% Total depreciable capital assets $ 36,042,107 $ 80,036,382 $ 43,994,275 122.1%
Capital assets, net $ 42,511,326 $ 86,505,601 $ 43,994,275 103.5%
The increase in the buildings account was due to continued construction costs of a new building. The offi ce furniture and equipment and data processing equipment accounts increased related to preparing the new building for operation. The decrease in the gaming equipment account was due to the disposal of the Make Me a Millionaire television show sets, which were impaired last fi scal year. More information on the Lottery’s capital assets can be found in Note 5.
LONG - TERM DEBT
At June 30, 2011, the California State Lottery had over $906.4 million in non-current liabilities versus approximately $1.01 billion last year, a decrease of 10.3 percent. Most of the change is attributable to lotto game prize liability as the majority of SuperLOTTO Plus® and MEGA Millions® jackpot winners choose the cash option rather than annuitized payments. In addition, nearly $5.6 million was accrued for the Net OPEB Obligation (NOO) as required by Statement No. 45 of the Governmental Accounting Standards Board, bringing the total accrued OPEB liability to $20.4 million as of June 30, 2011. Additional detailed information on long-term prize liability may be found in Note 6 and additional information on the NOO may be found in Note 10.
CONTACTING THE LOTTERY’S FINANCIAL MANAGER
This fi nancial report is designed to provide a general overview of the California State Lottery’s fi nances and to demonstrate the accountability for the money the Lottery earns. If you have questions about this report or need additional fi nancial information, contact the California State Lottery, Finance Division, 700 N. 10th Street, Sacramento, CA 95811.
CAPITAL ASSETS
A summary of capital assets as of June 30, 2010 and 2011, and the amount and percentage of change in relation to prior year amounts is as follows:
- 9 -
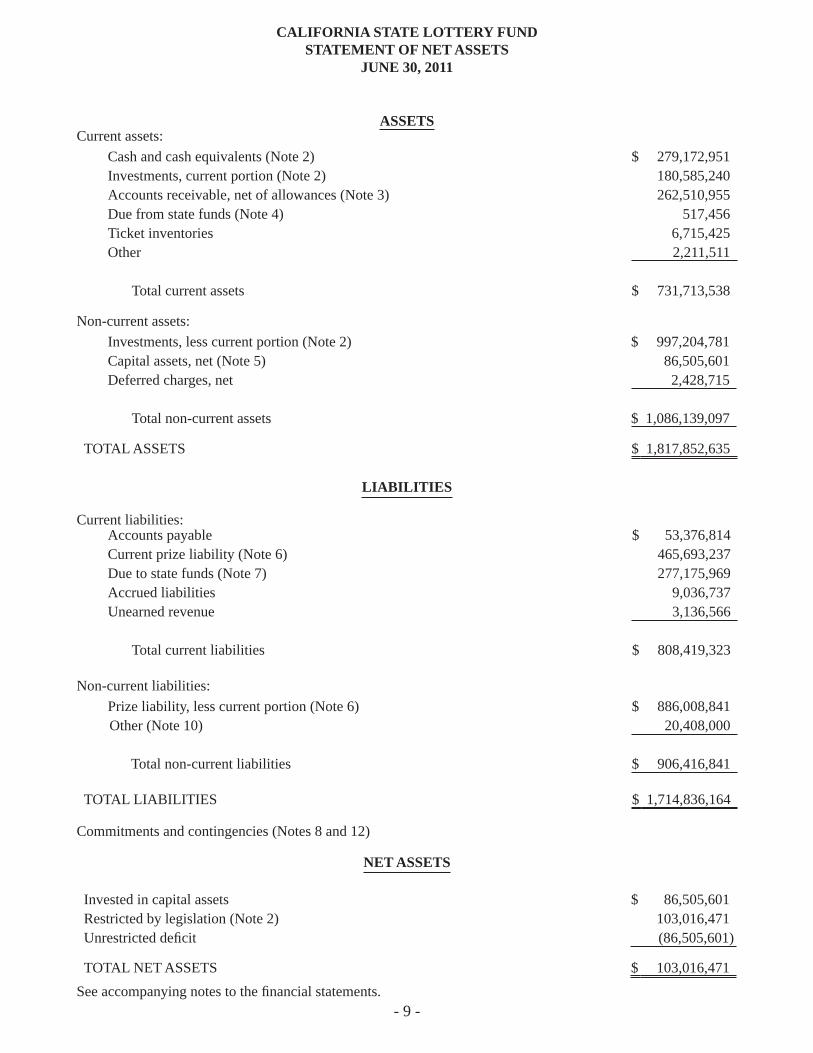
ASSETSCurrent assets:
Cash and cash equivalents (Note 2) $ 279,172,951 Investments, current portion (Note 2) 180,585,240 Accounts receivable, net of allowances (Note 3) 262,510,955 Due from state funds (Note 4) 517,456 Ticket inventories 6,715,425 Other 2,211,511
Total current assets $ 731,713,538
Non-current assets:
Investments, less current portion (Note 2) $ 997,204,781 Capital assets, net (Note 5) 86,505,601 Deferred charges, net 2,428,715
Total non-current assets $ 1,086,139,097
TOTAL ASSETS $ 1,817,852,635
LIABILITIES
Current liabilities: Accounts payable $ 53,376,814 Current prize liability (Note 6) 465,693,237 Due to state funds (Note 7) 277,175,969 Accrued liabilities 9,036,737 Unearned revenue 3,136,566
Total current liabilities $ 808,419,323
Non-current liabilities:
Prize liability, less current portion (Note 6) $ 886,008,841 Other (Note 10) 20,408,000
Total non-current liabilities $ 906,416,841
TOTAL LIABILITIES $ 1,714,836,164
Commitments and contingencies (Notes 8 and 12)
NET ASSETS
Invested in capital assets $ 86,505,601Restricted by legislation (Note 2) 103,016,471Unrestricted defi cit (86,505,601)
TOTAL NET ASSETS $ 103,016,471
CALIFORNIA STATE LOTTERY FUNDSTATEMENT OF NET ASSETS
JUNE 30, 2011
See accompanying notes to the fi nancial statements.
- 10 -
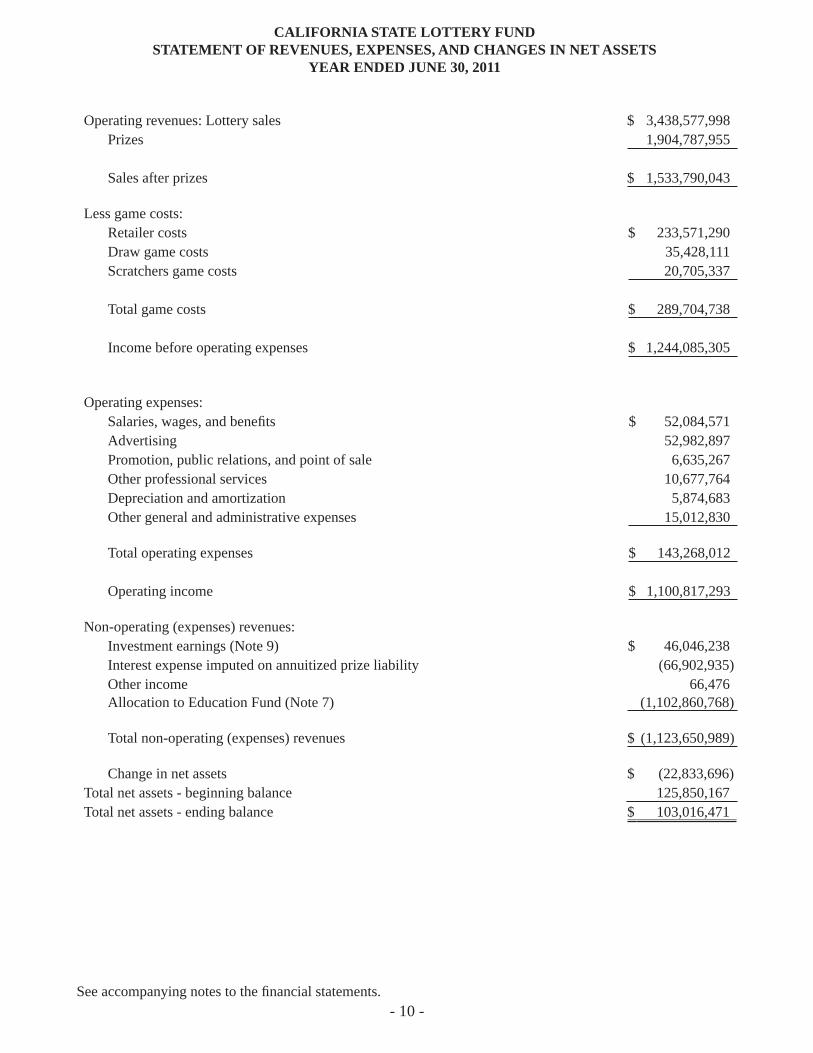
Operating revenues: Lottery sales $ 3,438,577,998 Prizes 1,904,787,955
Sales after prizes $ 1,533,790,043
Less game costs: Retailer costs $ 233,571,290 Draw game costs 35,428,111 Scratchers game costs 20,705,337
Total game costs $ 289,704,738
Income before operating expenses $ 1,244,085,305
Operating expenses: Salaries, wages, and benefi ts $ 52,084,571 Advertising 52,982,897 Promotion, public relations, and point of sale 6,635,267 Other professional services 10,677,764 Depreciation and amortization 5,874,683 Other general and administrative expenses 15,012,830
Total operating expenses $ 143,268,012
Operating income $ 1,100,817,293
Non-operating (expenses) revenues: Investment earnings (Note 9) $ 46,046,238 Interest expense imputed on annuitized prize liability (66,902,935) Other income 66,476 Allocation to Education Fund (Note 7) (1,102,860,768)
Total non-operating (expenses) revenues $ (1,123,650,989)
Change in net assets $ (22,833,696)Total net assets - beginning balance 125,850,167Total net assets - ending balance $ 103,016,471
CALIFORNIA STATE LOTTERY FUNDSTATEMENT OF REVENUES, EXPENSES, AND CHANGES IN NET ASSETS
YEAR ENDED JUNE 30, 2011
See accompanying notes to the fi nancial statements.
- 11 -
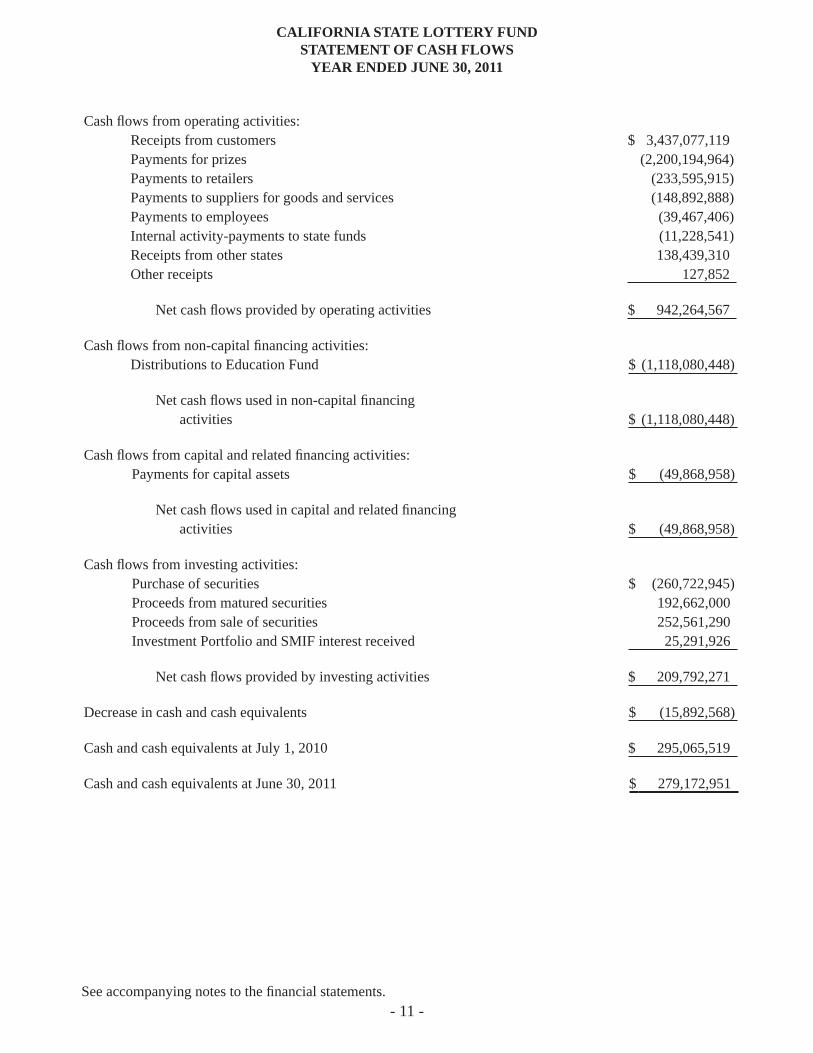
Cash fl ows from operating activities:Receipts from customers $ 3,437,077,119Payments for prizes (2,200,194,964)Payments to retailers (233,595,915)Payments to suppliers for goods and services (148,892,888)Payments to employees (39,467,406)Internal activity-payments to state funds (11,228,541)Receipts from other states 138,439,310Other receipts 127,852
Net cash fl ows provided by operating activities $ 942,264,567
Cash fl ows from non-capital fi nancing activities:Distributions to Education Fund $ (1,118,080,448)
Net cash fl ows used in non-capital fi nancing activities $ (1,118,080,448)
Cash fl ows from capital and related fi nancing activities: Payments for capital assets $ (49,868,958)
Net cash fl ows used in capital and related fi nancing activities $ (49,868,958)
Cash fl ows from investing activities: Purchase of securities $ (260,722,945) Proceeds from matured securities 192,662,000 Proceeds from sale of securities 252,561,290 Investment Portfolio and SMIF interest received 25,291,926
Net cash fl ows provided by investing activities $ 209,792,271
Decrease in cash and cash equivalents $ (15,892,568)
Cash and cash equivalents at July 1, 2010 $ 295,065,519
Cash and cash equivalents at June 30, 2011 $ 279,172,951
CALIFORNIA STATE LOTTERY FUNDSTATEMENT OF CASH FLOWS
YEAR ENDED JUNE 30, 2011
See accompanying notes to the fi nancial statements.

- 12 -
Cash fl ows from operating activities: Operating income $ 1,100,817,293 Adjustments to reconcile operating income to net cash provided by operating activities: Depreciation and amortization $ 5,874,683 Provision for doubtful accounts (359,769) Provision for returned tickets 16,769,296 Provision for free ticket redemptions (2,736,059) Non-cash post retirement benefi t plan change 5,588,000 Other income 66,476 Changes in assets and liabilities: Increase in accounts receivable (35,914,875) Decrease in due from other funds net of SMIF 286,320 Increase in ticket inventories (1,899,946) Increase in other assets (595,590) Increase in deferred charges (243,436) Increase in accounts payable 9,526,850 Decrease in prize liability (156,967,699) Increase in due to state funds 37,061 Increase in accrued liabilities 1,602,573 Increase in deferred revenues 413,389
Net cash fl ows provided by operating activities $ 942,264,567
Supplemental disclosure of non-cash activities:
Interest accreted on annuitized prizes $ 66,902,935
Unclaimed prizes directly allocated to the Education Fund $ 25,690,477
Unrealized loss on investments $ (3,314,895)
Interest accreted on zero coupon bonds $ 23,651,651
CALIFORNIA STATE LOTTERY FUNDSTATEMENT OF CASH FLOWS
YEAR ENDED JUNE 30, 2011
See accompanying notes to the fi nancial statements.
- 13 -
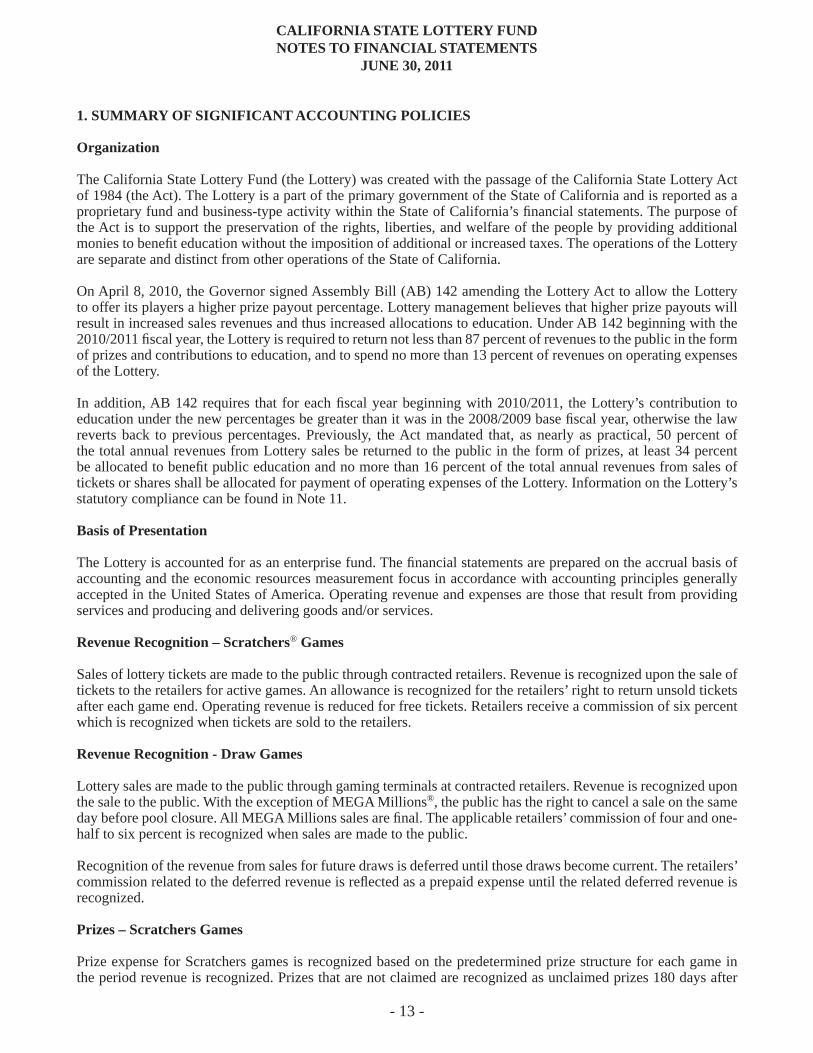
1. SUMMARY OF SIGNIFICANT ACCOUNTING POLICIES
Organization
The California State Lottery Fund (the Lottery) was created with the passage of the California State Lottery Act of 1984 (the Act). The Lottery is a part of the primary government of the State of California and is reported as a proprietary fund and business-type activity within the State of California’s fi nancial statements. The purpose of the Act is to support the preservation of the rights, liberties, and welfare of the people by providing additional monies to benefi t education without the imposition of additional or increased taxes. The operations of the Lottery are separate and distinct from other operations of the State of California.
On April 8, 2010, the Governor signed Assembly Bill (AB) 142 amending the Lottery Act to allow the Lottery to offer its players a higher prize payout percentage. Lottery management believes that higher prize payouts will result in increased sales revenues and thus increased allocations to education. Under AB 142 beginning with the 2010/2011 fi scal year, the Lottery is required to return not less than 87 percent of revenues to the public in the form of prizes and contributions to education, and to spend no more than 13 percent of revenues on operating expenses of the Lottery.
In addition, AB 142 requires that for each fi scal year beginning with 2010/2011, the Lottery’s contribution to education under the new percentages be greater than it was in the 2008/2009 base fi scal year, otherwise the law reverts back to previous percentages. Previously, the Act mandated that, as nearly as practical, 50 percent of the total annual revenues from Lottery sales be returned to the public in the form of prizes, at least 34 percent be allocated to benefi t public education and no more than 16 percent of the total annual revenues from sales of tickets or shares shall be allocated for payment of operating expenses of the Lottery. Information on the Lottery’s statutory compliance can be found in Note 11.
Basis of Presentation
The Lottery is accounted for as an enterprise fund. The fi nancial statements are prepared on the accrual basis of accounting and the economic resources measurement focus in accordance with accounting principles generally accepted in the United States of America. Operating revenue and expenses are those that result from providing services and producing and delivering goods and/or services.
Revenue Recognition – Scratchers® Games
Sales of lottery tickets are made to the public through contracted retailers. Revenue is recognized upon the sale of tickets to the retailers for active games. An allowance is recognized for the retailers’ right to return unsold tickets after each game end. Operating revenue is reduced for free tickets. Retailers receive a commission of six percent which is recognized when tickets are sold to the retailers.
Revenue Recognition - Draw Games
Lottery sales are made to the public through gaming terminals at contracted retailers. Revenue is recognized upon the sale to the public. With the exception of MEGA Millions®, the public has the right to cancel a sale on the same day before pool closure. All MEGA Millions sales are fi nal. The applicable retailers’ commission of four and one-half to six percent is recognized when sales are made to the public.
Recognition of the revenue from sales for future draws is deferred until those draws become current. The retailers’ commission related to the deferred revenue is refl ected as a prepaid expense until the related deferred revenue is recognized.
Prizes – Scratchers Games
Prize expense for Scratchers games is recognized based on the predetermined prize structure for each game in the period revenue is recognized. Prizes that are not claimed are recognized as unclaimed prizes 180 days after
CALIFORNIA STATE LOTTERY FUNDNOTES TO FINANCIAL STATEMENTS
JUNE 30, 2011
- 14 -
1. SUMMARY OF SIGNIFICANT ACCOUNTING POLICIES (continued)
Prizes – Scratchers Games (continued)
the end of each game. Unclaimed prizes not directly payable by the Lottery are recognized as a reduction of prize expense and included in the Lottery’s operating income that is allocated to the Education Fund. Unclaimed prizes directly payable by the Lottery are allocated directly to the Education Fund. Prize expense relative to the Lottery’s television show was recorded based on the estimated prize structure and then adjusted to refl ect amounts actually won.
Prizes of $1 million or more are generally paid in equal annual installments over twenty or twenty-fi ve years. The Weekly Grand, the Extravaganza 2000, the Twice as Grand, and the Weekly $2,000 Payday top prizes are paid in weekly installments for twenty years. The Decade of Dollars top prizes are paid in annual installments for ten years. The top prizes for the Cash for 20 Years game and the $750,000 Payday game are paid in annual, graduated payments over twenty-year and twenty-fi ve-year periods, respectively. Prize expense for these prizes is based on the present value of the annuity using an interest rate equal to the interest yield on the zero coupon U.S. Treasury bonds which the Lottery acquires to fund the annuity payments. Interest earned is imputed on the annuity using the same interest rate.
The Next Millionaire, California Millionaire and Millions in Cash games all feature top prizes of $1 million, each paid in a single payment.
Prizes - Draw Games
SuperLOTTO Plus® and MEGA Millions - Prize expenses for the twice-weekly draw games are recognized on the basis of the predetermined prize structure when the revenue is recognized. Nine distinct prize categories are established which are dependent upon the amount of money wagered and the quantity of numbers to be matched. In the event that no winning share for a specifi c prize category in SuperLOTTO Plus is selected, all monies allocated for that prize are carried forward to the following drawing and added to the Five of Five plus MEGA number category (grand prize). In the event that no winning share for a specifi c prize category in MEGA Millions is selected, all monies allocated for that prize are carried forward to the following drawing and remain in the pool for that same prize category.
The total Grand/Jackpot prize liability for each multi-state MEGA Millions drawing shall be shared by each participating state lottery (Party Lottery) as follows: each Party Lottery shall be responsible for an amount equal to a percentage of that Party Lottery’s MEGA Millions sales, said percentage being the proportion of the total Grand/Jackpot prize liability to total MEGA Millions sales. The California State Lottery is prohibited by state law from paying fi xed prizes and participating in the liability calculation for prize levels two (2) through nine (9). The California State Lottery shall be solely responsible for its own prize liability for prize levels two (2) through nine (9).
All SuperLOTTO Plus prizes won but not claimed within the specifi ed period are allocated directly to the Education Fund. In the event that a MEGA Millions grand/jackpot prize won in California is unclaimed, the prize monies will be returned to the Party Lotteries in the same ratio that each Party Lottery contributed to such prize plus interest and the amount contributed for the grand/jackpot prize by the California State Lottery will be allocated directly to the Education Fund. The unclaimed prize monies for all other MEGA Millions prize categories won in California but not claimed within the specifi ed period are allocated directly to the Education Fund.
Super LOTTO grand/jackpot prizes won prior to April 1, 1998, of $1 million or more are paid in twenty equal annual installments. Effective April 1, 1998, grand/jackpot prizes of $1 million or more are paid either in twenty-six graduated annual payments or in a single payment equal to the cash value of the twenty-six-payment annuity, in accordance with the rules and regulations of the Lottery. Beginning September 21, 2005, claimants have up to 60 days after the date they became entitled to the prize to irrevocably elect to receive the cash value or the annuitized payments. Payments for all other prize categories are made in a single payment.
CALIFORNIA STATE LOTTERY FUNDNOTES TO FINANCIAL STATEMENTS
JUNE 30, 2011

- 15 -
1. SUMMARY OF SIGNIFICANT ACCOUNTING POLICIES (continued)
Prizes – Draw Games (continued)
MEGA Millions grand/jackpot prizes won in California are paid in 26 equal annual installments, however, claimants have up to 60 days after the date they became entitled to the prize to irrevocably elect to receive the cash value of the prize instead of 26 annual payments. Payments for all other prize categories are made in a single payment.
Fantasy 5 - Prize expense for the seven-draws-per-week game is recognized on the basis of the predetermined prize structure when the revenue is recognized. Distinct prize categories are established dependent upon the amount of money wagered and the quantity of numbers to be matched. In the event that no winning share for a specifi c prize category is selected, all monies allocated for that prize category are carried forward to the following drawing and added to the 5 of 5 prize category. All Fantasy 5 prizes won but not claimed within the specifi ed period are allocated directly to the Education Fund.
Daily 3 - Prize expense for the two-draws-per-day game is recognized on the basis of the predetermined prize structure when the revenue is recognized. Distinct prize categories are established which are dependent upon the amount of money wagered, the quantity of numbers to be matched, and the order of numbers chosen. All Daily 3 prizes won but not claimed within the specifi ed period are allocated directly to the Education Fund.
Daily 4 - Prize expense for the seven-draws-per-week game is recognized on the basis of the predetermined prize structure when the revenue is recognized. Distinct prize categories are established which are dependent upon the amount of money wagered, the quantity of numbers to be matched, and the order of numbers chosen. All Daily 4 prizes won but not claimed within the specifi ed period are allocated directly to the Education Fund.
Daily Derby® - Prize expense for the seven-draws-per-week game is recognized on the basis of the predetermined prize structure when the revenue is recognized. Distinct prize categories are established which are dependent upon the amount of money wagered, the quantity of numbers to be matched, and the order of numbers chosen. In the event that no winning share for a specifi c prize category is selected, all monies allocated for that prize category are carried forward to the following drawing and added to the Grand Prize category. All Daily Derby prizes won but not claimed within the specifi ed period are allocated directly to the Education Fund.
Hot Spot® - Prize expense for the multiple-draws-per-day game is recognized on the basis of the predetermined prize structure when the revenue is recognized. On November 27, 2006, the Lottery established a Typical Prize Allocation (allocation) for the 8 Spot Match 8 of 8 category and Typical Prize Amounts (amounts) for all spots other than the 8 Spot Match 8 of 8 prize. On that date, the Lottery also made an irrevocable transfer to a Hot Spot Wagered Prize Fund (fund) to pay these allocations and amounts. In addition to the initial transfer, the fund balance is adjusted daily based upon daily sales contributions and prizes won. In the event the balance in the fund is not suffi cient to pay the allocations and amounts of a particular draw, prizes will be systematically reduced until the fund is suffi cient to pay the reduced amounts. The Director will authorize promotional prize augmentations to ensure that the fund balance at the end of any given fi scal year is liquidated. All Hot Spot prizes won but not claimed within the specifi ed period are allocated directly to the Education Fund.
Prior to the change made on November 27, 2006, distinct prize categories were established which were dependent upon the amount of money wagered and the quantity of numbers to be matched. In the event that no winning share for a specifi c Hot Spot prize category was selected, all monies allocated for that prize category were carried forward to the following drawing and added to its respective prize category.
Raffl e - The Lottery may periodically conduct raffl e games. Players may win prizes by matching their raffl e numbers to the numbers drawn by the Lottery. Prize expense for the game is recognized on the basis of a pre-determined prize structure when the revenue is recognized. All Raffl e prizes won but not claimed within the specifi ed period are allocated directly to the Education Fund. The $1 million top prizes for the two raffl e games held to date were each paid in single payments.
CALIFORNIA STATE LOTTERY FUNDNOTES TO FINANCIAL STATEMENTS
JUNE 30, 2011

- 16 -
1. SUMMARY OF SIGNIFICANT ACCOUNTING POLICIES (continued) Cash Equivalents
Cash equivalents represent cash deposited in the Surplus Money Investment Fund (SMIF).
Investments
The Lottery applies Statement No. 31 of the Governmental Accounting Standards Board (GASB 31), Accountingand Financial Reporting for Certain Investments and for External Investment Pools. This statement establishes accounting and fi nancial reporting standards for all investments held by governmental external investment pools and establishes fair value standards for other governmental entities. In accordance with GASB 31 the Lottery has stated investments at fair value. The difference between the carrying value and the fair value of investments is reported as a component of total net assets on the Statement of Net Assets.
The Lottery applies GASB 40, Deposit and Investment Risk Disclosures – An Amendment of GASB Statement No. 3. This Statement addresses common deposit and investment risks related to credit risk, concentration of credit risk, interest rate risk, and foreign currency risk. As an element of interest rate risk, this Statement requires certain disclosures of investments that have fair values that are highly sensitive to changes in interest rates. Deposit and investment policies related to the risks identifi ed in this Statement also are required to be disclosed.
Allowances for Doubtful Accounts, Ticket Returns, and Free Ticket Redemptions
The allowance for doubtful accounts is based on an analysis of collectibility of accounts receivable which considers the age of the accounts and historical collection results. An allowance for ticket returns for Scratchers games is estimated using sales revenue and historical return data for the games in progress at the end of the reporting period. An allowance for free ticket redemptions for Scratchers games is estimated using sales revenue and free ticket redemption data for games in progress at the end of the reporting period.
Ticket Inventories
Inventories are carried at cost and consist of tickets for games in progress not yet sold to retailers and tickets for future games. The cost of tickets is charged to operations when the tickets are sold to retailers. The cost of unissued and returned tickets are written off at the end of each game.
Capital Assets
The Lottery has adopted a policy of capitalizing assets with an acquisition cost or established value of $5,000 or greater. Capital assets are carried at cost. Depreciation on property and equipment is computed using the straight-line method over estimated lives ranging from one to seven years. Depreciation on buildings, improvements, and land improvements is computed using the straight-line method over estimated lives of fi ve to forty years. When assets are retired or otherwise disposed of, the costs and related accumulated depreciation are removed from the accounts and any resulting gain or loss is refl ected in operations in the period of disposal. Amortization of leasehold improvements is computed using the straight-line method over the remaining lease terms.
The Lottery adopted GASB 51, Accounting and Financial Reporting for Intangible Assets, during the 2009/2010 fi scal year. The statement requires that all intangible assets not specifi cally excluded, including internally generated intangible assets, be classifi ed as capital assets. There was no impact upon the adoption of GASB 51.
Deferred Charges
The Lottery incurs costs in connection with certain contracts which extend beyond a one-year period. These costs are deferred and amortized over the life of the contracts.
CALIFORNIA STATE LOTTERY FUNDNOTES TO FINANCIAL STATEMENTS
JUNE 30, 2011

- 17 -
1. SUMMARY OF SIGNIFICANT ACCOUNTING POLICIES (continued)
Advertising
Advertising costs are expensed when the related liability is incurred. Advertising expense totaled $52,982,897 for the year ended June 30, 2011.
Investment Earnings
Investment earnings are composed of unrealized gains or losses associated with the change in fair value of investments and interest income including interest accreted on investments. Unrealized gains and losses are generally not realized as the investments are held to satisfy annuitized prizes. As investments must be stated at fair value, investment earnings or losses are created as a result of the adjustment from carrying value to fair value. Generally, all cash is held on deposit with the California State Treasurer and is invested by that offi ce in the Surplus Money Investment Fund. Interest on funds held by the State Treasurer is distributed quarterly.
Compensated Absences Payable
Vested vacation balances are accrued as a liability and adjusted quarterly.
Use of Estimates
The preparation of fi nancial statements in conformity with accounting principles generally accepted in the United States of America requires management to make estimates and assumptions that affect the reported amounts of assets and liabilities and disclosure of contingent assets and liabilities at the date of the fi nancial statements and the reported amounts of revenues and expenses during the reporting period. Actual results could differ from those estimates.
Government Accounting Standards Board Statement No. 20 (GASB 20)
As required under GASB 20, Accounting and Financial Reporting for Proprietary Funds and Other Governmental Entities That Use Proprietary Fund Accounting, the Lottery will continue to apply all applicable GASB pronouncements as well as Financial Accounting Standards Board (FASB) Statements and Interpretations, Accounting Principles Board (APB) Opinions, and Accounting Research Bulletins (ARBS) of the Committee on Accounting Procedure issued on or before November 30, 1989, unless those pronouncements confl ict or contradict GASB pronouncements. The Lottery has elected under GASB 20 to not apply all FASB Statements and Interpretations issued after November 30, 1989, due to the governmental nature of the Lottery operations.
2. DEPOSITS AND INVESTMENTS
The Lottery presents its deposits and investments in accordance with GASB 40, Deposit and Investment Risk Disclosures – An Amendment of GASB Statement No. 3. This statement requires the disclosure of the following risks to the extent that they exist at the date of the statement of net assets:
Interest Rate RiskInterest rate risk is the risk that the value of fi xed income securities will decline due to changing interest rates.The prices of fi xed income securities with longer time to maturity tend to be more sensitive to changes in interest rates than those with shorter durations.
Credit RiskCredit risk is the risk that a debt issuer will fail to pay interest or principal in a timely manner, or that negative perceptions of the issuer’s ability to make these payments will cause security prices to decline.
CALIFORNIA STATE LOTTERY FUNDNOTES TO FINANCIAL STATEMENTS
JUNE 30, 2011

- 18 -
2. DEPOSITS AND INVESTMENTS (continued)
Custodial Credit RiskCustodial credit risk is the risk that, in the event a fi nancial institution or counterparty fails, the investor will not be able to recover the value of its deposits, investments, or collateral.
Concentration of Credit RiskConcentration of credit risk is the risk of loss attributed to the magnitude of an investor’s holdings in a singleissuer.
Investments
The deposit and investment policies of the Lottery are determined by the Lottery Commission and state statute. Prize investments consist of zero coupon U.S. Treasury bonds, U.S. Treasury notes, zero coupon agency bonds and municipal bonds. Zero coupon U.S. Treasury bonds and zero coupon agency bonds are carried at fair value and are adjusted for the accretion of interest based on the purchased yield and maturity date. Municipal bonds and U.S. Treasury notes are carried at fair value, and interest is accrued based on the coupon rate.
As of June 30, 2011, the Lottery’s investments, with yields ranging from 0.06 percent to 7.41 percent, consist of the following:
Face Amount Cost Fair ValueCurrent portion:
U.S. Treasury Notes $ 55,000,000 $ 55,249,179 $ 55,436,719U.S. Treasury Strips 61,031,000 36,219,687 61,002,783U.S. Agency Holdings 37,204,000 36,248,632 37,224,144U.S. Municipal Bond Holdings 26,625,000 26,823,365 26,921,594Total current portion $ 179,860,000 $ 154,540,863 $ 180,585,240
Long-term portion:U.S. Treasury Notes $ - $ - $ -U.S. Treasury Strips 218,594,000 120,385,549 165,715,821U.S. Agency Holdings 431,707,000 314,141,931 355,053,617U.S. Municipal Bond Holdings 449,070,000 452,045,472 476,435,343Total long-term portion $ 1,099,371,000 $ 886,572,952 $ 997,204,781
Total investments $ 1,279,231,000 $ 1,041,113,815 $ 1,177,790,021
CALIFORNIA STATE LOTTERY FUNDNOTES TO FINANCIAL STATEMENTS
JUNE 30, 2011
- 19 -
2. DEPOSITS AND INVESTMENTS (continued)
Investments (continued)
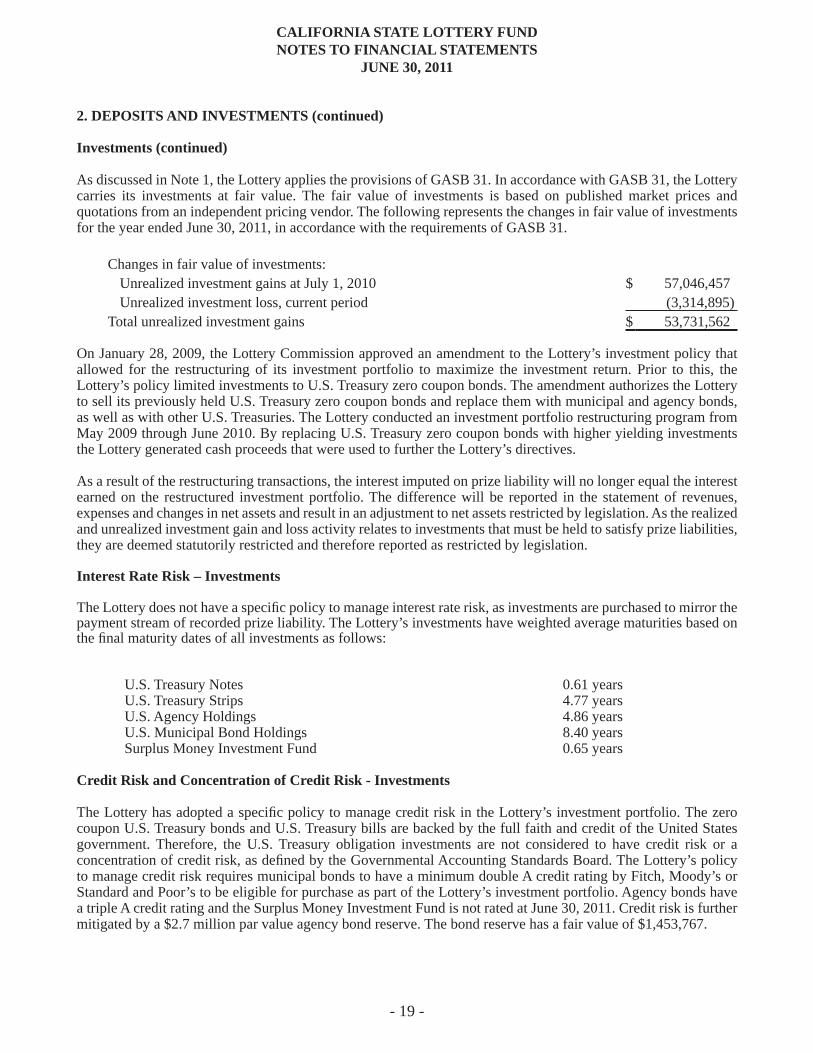
As discussed in Note 1, the Lottery applies the provisions of GASB 31. In accordance with GASB 31, the Lottery carries its investments at fair value. The fair value of investments is based on published market prices and quotations from an independent pricing vendor. The following represents the changes in fair value of investments for the year ended June 30, 2011, in accordance with the requirements of GASB 31.
Changes in fair value of investments: Unrealized investment gains at July 1, 2010 $ 57,046,457 Unrealized investment loss, current period (3,314,895) Total unrealized investment gains $ 53,731,562
On January 28, 2009, the Lottery Commission approved an amendment to the Lottery’s investment policy that allowed for the restructuring of its investment portfolio to maximize the investment return. Prior to this, the Lottery’s policy limited investments to U.S. Treasury zero coupon bonds. The amendment authorizes the Lottery to sell its previously held U.S. Treasury zero coupon bonds and replace them with municipal and agency bonds, as well as with other U.S. Treasuries. The Lottery conducted an investment portfolio restructuring program from May 2009 through June 2010. By replacing U.S. Treasury zero coupon bonds with higher yielding investments the Lottery generated cash proceeds that were used to further the Lottery’s directives.
As a result of the restructuring transactions, the interest imputed on prize liability will no longer equal the interest earned on the restructured investment portfolio. The difference will be reported in the statement of revenues, expenses and changes in net assets and result in an adjustment to net assets restricted by legislation. As the realized and unrealized investment gain and loss activity relates to investments that must be held to satisfy prize liabilities, they are deemed statutorily restricted and therefore reported as restricted by legislation.
Interest Rate Risk – Investments
The Lottery does not have a specifi c policy to manage interest rate risk, as investments are purchased to mirror the payment stream of recorded prize liability. The Lottery’s investments have weighted average maturities based on the fi nal maturity dates of all investments as follows: U.S. Treasury Notes 0.61 years U.S. Treasury Strips 4.77 years U.S. Agency Holdings 4.86 years U.S. Municipal Bond Holdings 8.40 years Surplus Money Investment Fund 0.65 years
Credit Risk and Concentration of Credit Risk - Investments
The Lottery has adopted a specifi c policy to manage credit risk in the Lottery’s investment portfolio. The zero coupon U.S. Treasury bonds and U.S. Treasury bills are backed by the full faith and credit of the United States government. Therefore, the U.S. Treasury obligation investments are not considered to have credit risk or a concentration of credit risk, as defi ned by the Governmental Accounting Standards Board. The Lottery’s policy to manage credit risk requires municipal bonds to have a minimum double A credit rating by Fitch, Moody’s or Standard and Poor’s to be eligible for purchase as part of the Lottery’s investment portfolio. Agency bonds have a triple A credit rating and the Surplus Money Investment Fund is not rated at June 30, 2011. Credit risk is further mitigated by a $2.7 million par value agency bond reserve. The bond reserve has a fair value of $1,453,767.
CALIFORNIA STATE LOTTERY FUNDNOTES TO FINANCIAL STATEMENTS
JUNE 30, 2011

- 20 -
2. DEPOSITS AND INVESTMENTS (continued)
Investments (continued)
As of June 30, 2011, the fair value of the Lottery’s investment portfolio expressed as a percentage of Moody’s credit rating categories was as follows:
Moody’s Credit Rating Fair Value Percent of Total Portfolio
Aaa $ 692,396,359 58.79 %
Aa1 135,898,417 11.54 %
Aa2 97,790,218 8.30 %
Aa3 5,397,525 0.46 %
A1 246,307,502 20.91%
Totals $ 1,177,790,021 100.00 %
The following table provides information about the Lottery’s concentration of credit risk. It shows investments by any one issuer representing 5 percent or more of the Lottery’s total portfolio, and not explicitly guaranteed by the U.S. government.
Issuer Cost Fair Value Percent of Total Portfolio
Moody’s Credit Rating
State of California $ 214,828,217 $ 226,926,096 19.27 % A1Commonwealth of Massachusetts $ 62,546,830 $ 62,771,770 5.33 % Aa1
Custodial Credit Risk – Investments
The Lottery does not have a formal investment policy for custodial credit risk for investments. As of June 30, 2011, all the prize investments are uninsured, registered investments held in book-entry form by the State Treasurer’s Offi ce in a master custody account with Citibank, N.A.
Deposits
The following deposits, included in cash and cash equivalents, are in pools managed by other State of California government units and are not evidenced by securities. Interest income earned on outstanding cash balances is allocated among pool participants based on average daily cash balances. As of June 30, 2011, the carrying value of deposits in the Surplus Money Investment Fund approximated fair value.
State Treasury $ 11,681,986Surplus Money Investment Fund 267,479,000
$ 279,160,986
The SMIF consists of available cash of all special funds of the State of California which do not have investment authority of their own. Cash balances in excess of needs in any of these participating funds are invested by the State Treasurer. The Pooled Money Investment Board (PMIB) provides regulatory oversight over the State Treasurer’spooled investment program and is responsible for determining whether any cash balances of the participating funds are in excess of current needs and available for investment, or whether it is necessary to liquidate previous investments to meet current requirements. The PMIB is composed of the State Treasurer, as chairman; the State Controller; and the Director of Finance for the State of California.
CALIFORNIA STATE LOTTERY FUNDNOTES TO FINANCIAL STATEMENTS
JUNE 30, 2011
- 21 -
2. DEPOSITS AND INVESTMENTS (continued)
Deposits (continued)
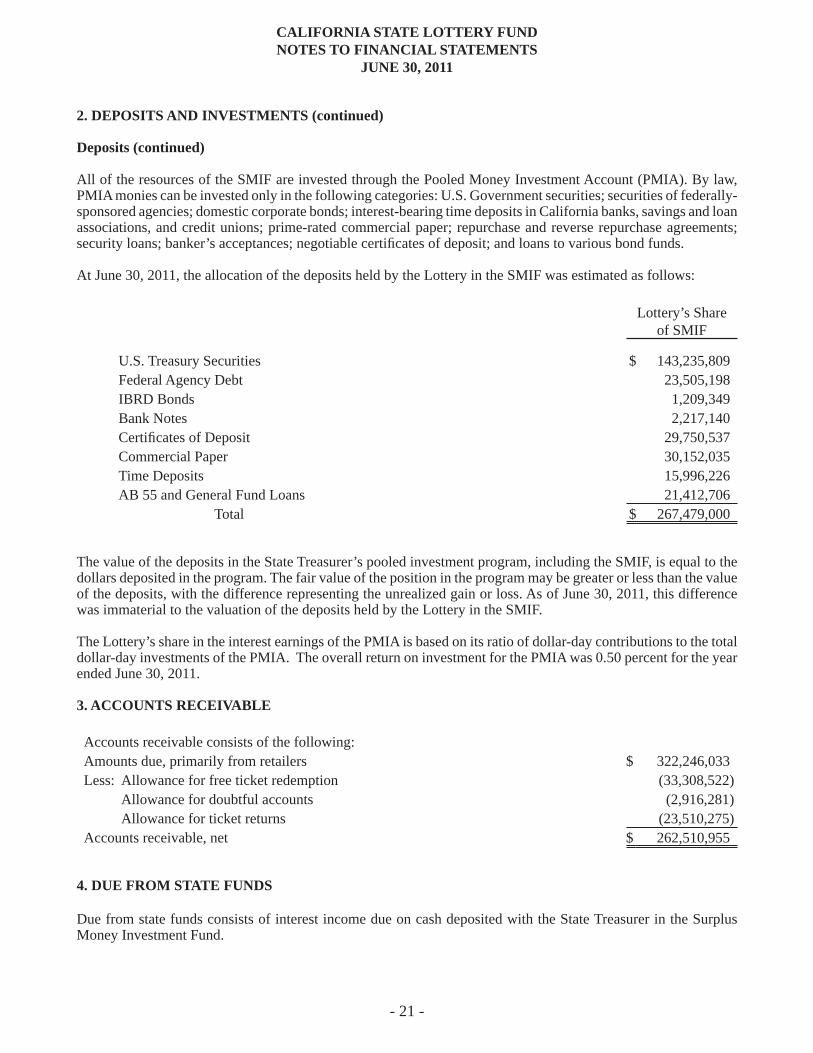
All of the resources of the SMIF are invested through the Pooled Money Investment Account (PMIA). By law, PMIA monies can be invested only in the following categories: U.S. Government securities; securities of federally-sponsored agencies; domestic corporate bonds; interest-bearing time deposits in California banks, savings and loan associations, and credit unions; prime-rated commercial paper; repurchase and reverse repurchase agreements; security loans; banker’s acceptances; negotiable certifi cates of deposit; and loans to various bond funds.
At June 30, 2011, the allocation of the deposits held by the Lottery in the SMIF was estimated as follows:
Lottery’s Shareof SMIF
U.S. Treasury Securities $ 143,235,809
Federal Agency Debt 23,505,198IBRD Bonds 1,209,349Bank Notes 2,217,140Certifi cates of Deposit 29,750,537Commercial Paper 30,152,035Time Deposits 15,996,226AB 55 and General Fund Loans 21,412,706 Total $ 267,479,000
The value of the deposits in the State Treasurer’s pooled investment program, including the SMIF, is equal to the dollars deposited in the program. The fair value of the position in the program may be greater or less than the value of the deposits, with the difference representing the unrealized gain or loss. As of June 30, 2011, this difference was immaterial to the valuation of the deposits held by the Lottery in the SMIF.
The Lottery’s share in the interest earnings of the PMIA is based on its ratio of dollar-day contributions to the total dollar-day investments of the PMIA. The overall return on investment for the PMIA was 0.50 percent for the year ended June 30, 2011.
3. ACCOUNTS RECEIVABLE
Accounts receivable consists of the following: Amounts due, primarily from retailers $ 322,246,033Less: Allowance for free ticket redemption (33,308,522)
Allowance for doubtful accounts (2,916,281)Allowance for ticket returns (23,510,275)
Accounts receivable, net $ 262,510,955
4. DUE FROM STATE FUNDS
Due from state funds consists of interest income due on cash deposited with the State Treasurer in the Surplus Money Investment Fund.
CALIFORNIA STATE LOTTERY FUNDNOTES TO FINANCIAL STATEMENTS
JUNE 30, 2011

- 22 -
5. CAPITAL ASSETS
Capital assets consist of the following:
BeginningBalance
Increase Decrease
EndingBalance
Non-depreciable capital assets: Land $ 6,469,219 $ - $ - $ 6,469,219 Depreciable capital assets:Gaming equipment 17,813,582 52,022 (3,278,531) 14,587,073Vending machines 34,243,343 - - 34,243,343Buildings 24,082,716 41,679,994 - 65,762,710Data processing equipment 9,019,032 4,485,569 (136,209) 13,368,392Offi ce furniture and equipment 8,468,599 3,917,806 (36,158) 12,350,247Leasehold improvements 810,558 - - 810,558Other 6,725,850 - - 6,725,850
$ 107,632,899 $ 50,135,391 $ (3,450,898) $ 154,317,392
Less accumulated depreciation and amortization:Gaming equipment $ (11,448,225) $ (2,500,734) $ 3,278,531 $ (10,670,428)Vending machines (33,386,304) (857,039) - (34,243,343)Buildings (830,067) (627,721) - (1,457,788)Data processing equipment (8,670,681) (346,662) 136,209 (8,881,134)Offi ce furniture and equipment (6,960,346) (771,025) 6,300 (7,725,071)Leasehold improvements (487,209) (79,619) - (566,828)Other (3,338,741) (928,458) - (4,267,199)
$ (65,121,573) $ (6,111,258) $ 3,421,040 $ (67,811,791)
Capital assets, net $ 42,511,326 $ 44,024,133 $ (29,858) $ 86,505,601
The increase in accumulated depreciation and amortization of capital assets charged to income was $6,111,258 for the year ended June 30, 2011. The Lottery recognized a reduction to depreciation expense due to the reversal of an over-accrual related to the write-off of equipment. The increase in accumulated depreciation and amortization plus the reversal of the accrual account for the depreciation and amortization expense of $5,874,683 reported on the Statement of Revenues, Expenses and Changes in Net Assets.
CALIFORNIA STATE LOTTERY FUNDNOTES TO FINANCIAL STATEMENTS
JUNE 30, 2011
- 23 -
6. PRIZE LIABILITY
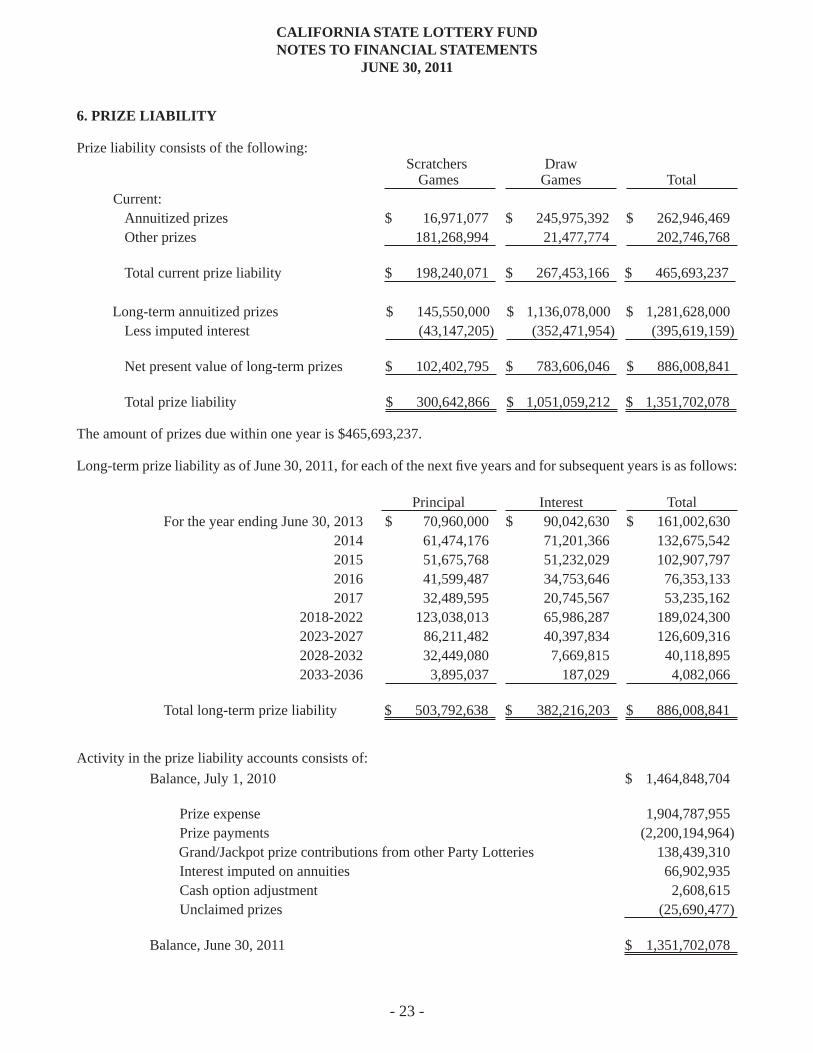
Prize liability consists of the following:
Scratchers
GamesDraw
Games Total Current: Annuitized prizes $ 16,971,077 $ 245,975,392 $ 262,946,469 Other prizes 181,268,994 21,477,774 202,746,768
Total current prize liability $ 198,240,071 $ 267,453,166 $ 465,693,237
Long-term annuitized prizes $ 145,550,000 $ 1,136,078,000 $ 1,281,628,000 Less imputed interest (43,147,205) (352,471,954) (395,619,159)
Net present value of long-term prizes $ 102,402,795 $ 783,606,046 $ 886,008,841
Total prize liability $ 300,642,866 $ 1,051,059,212 $ 1,351,702,078
The amount of prizes due within one year is $465,693,237.
Long-term prize liability as of June 30, 2011, for each of the next fi ve years and for subsequent years is as follows:
Principal Interest TotalFor the year ending June 30, 2013 $ 70,960,000 $ 90,042,630 $ 161,002,630
2014 61,474,176 71,201,366 132,675,5422015 51,675,768 51,232,029 102,907,7972016 41,599,487 34,753,646 76,353,1332017 32,489,595 20,745,567 53,235,162
2018-2022 123,038,013 65,986,287 189,024,3002023-2027 86,211,482 40,397,834 126,609,3162028-2032 32,449,080 7,669,815 40,118,8952033-2036 3,895,037 187,029 4,082,066
Total long-term prize liability $ 503,792,638 $ 382,216,203 $ 886,008,841
Activity in the prize liability accounts consists of:
Balance, July 1, 2010 $ 1,464,848,704
Prize expense 1,904,787,955 Prize payments (2,200,194,964) Grand/Jackpot prize contributions from other Party Lotteries 138,439,310 Interest imputed on annuities 66,902,935 Cash option adjustment 2,608,615 Unclaimed prizes (25,690,477)
Balance, June 30, 2011 $ 1,351,702,078
CALIFORNIA STATE LOTTERY FUNDNOTES TO FINANCIAL STATEMENTS
JUNE 30, 2011

- 24 -
7. DUE TO STATE FUNDS
Due to state funds consists of the following:
Due to Education Fund $ 276,999,206 Due to other state funds 176,763
Total due to state funds $ 277,175,969
Activity in the Due to Education Fund account consists of:
Balance, July 1, 2010 $ 266,528,409 Allocation to Education Fund, earned by the California State Lottery Fund $ 1,102,860,768 Unclaimed prizes directly allocated to the Education Fund 25,690,477
1,128,551,245
Distribution to the Education Fund (1,118,080,448)
Balance, June 30, 2011 $ 276,999,206
8. LEASES
The Lottery leases offi ce, warehouse, and parking lot facilities under operating leases. These leases expire in various years through September 30, 2017. Most operating leases have a provision for early termination. These leases could be terminated between September 2011 and September 2017.
The future minimum lease payments under operating leases as of June 30, 2011, are as follows:
OperatingLeases
For the year June 30, 2012 $ 1,317,0832013 1,165,1492014 951,5582015 842,8082016 603,464
Thereafter 653,019
Total minimum payments $ 5,533,081
Rental expense for all operating leases totaled $1,638,342 for the year ended June 30, 2011.
CALIFORNIA STATE LOTTERY FUNDNOTES TO FINANCIAL STATEMENTS
JUNE 30, 2011

- 25 -
9. INVESTMENT EARNINGS
Investment earnings consist of:
Interest on funds held by State Treasurer $ 1,976,999 Change in Fair Market Value of Investments (3,314,895) Interest accreted/earned on investments 47,384,134 Total investment earnings $ 46,046,238
10. RETIREMENT PLAN AND OTHER POSTEMPLOYMENT BENEFITS
Retirement Plan
The Lottery contributes to the Public Employees’ Retirement Fund administered by the California Public Employees’ Retirement System (CalPERS), an agent multiple-employer public employee defi ned benefi t pension plan. The State of California (State) is considered the employer and the Lottery is a department of the State. CalPERS provides retirement benefi ts to plan members and benefi ciaries. CalPERS acts as a common investment and administrative agent for participating public entities within the State and uses the accrual basis of accounting. Benefi t provisions and all other requirements are established by state statute. Since all state agencies are considered collectively to be a single employer, the actuarial present value of vested and non-vested accumulated plan benefi ts attributable to the Lottery’s employees cannot be determined. Similarly, the net assets available for benefi ts of Lottery employees cannot be determined. CalPERS issues a separate comprehensive annual fi nancial report that includes fi nancial statements and required supplementary information. CalPERS’ annual fi nancial report may be obtained by writing to the California Public Employees’ Retirement System, Fiscal Services Division, P.O. Box 942703, Sacramento, California 94229 or by visiting the CalPERS web site at www.CalPERS.ca.gov.
Generally, full-time employees are eligible to participate as members of CalPERS and are eligible to retire at age 50 with at least fi ve years of service or age 55 with at least ten years of service depending on the plan selected by the employee. Annual retirement benefi ts are determined based on age at retirement, the length of membership service, and the amount of earnings based on the highest or last 12 or 36 consecutive months’ average. Health care and dental benefi ts may be provided to members depending on the date hired and the years of credited service of a member. If members are not fully vested, the health care and dental contributions will be prorated based on the years of service.
Active plan members are required to contribute a percentage of their salary depending on their plan selection and employment classifi cation. Employees’ required contributions vary from 0.0% to 8.0%. The Lottery is required to contribute at an actuarially determined rate. The Lottery’s contributions are based on a percentage of annual covered payroll depending on the plan selected and member status. For the year ended June 30, 2011, the Lottery’s payroll for employees covered by CalPERS was approximately $29.7 million and the total payroll for the period was approximately $30.7 million. The contribution requirements of plan members and the Lottery are established and may be amended by CalPERS. Required employer contribution rates (expressed as a percentage of compensation) as of January 2011 for the remainder of the 2010/2011 fi scal year are as follows: State Miscellaneous Member First Tier 17.528% State Miscellaneous Member Second Tier 16.442% State Safety Member 15.702% Peace Offi cer 28.556%
CALIFORNIA STATE LOTTERY FUNDNOTES TO FINANCIAL STATEMENTS
JUNE 30, 2011

- 26 -
CALIFORNIA STATE LOTTERY FUNDNOTES TO FINANCIAL STATEMENTS
JUNE 30, 2011
10. RETIREMENT PLAN AND OTHER POSTEMPLOYMENT BENEFITS (continued)
Retirement Plan (continued)
The Lottery’s pension cost for the year ended June 30, 2011, was equal to the Lottery’s required contributions which were determined as part of the most recent actuarial valuation performed by CalPERS dated June 30, 2009.
Three year trend information for the Lottery:
Fiscal YearEnding
Annual Pension Cost (APC)
Percentage Of APCContributed
Net PensionObligation
6/30/09 $4,776,155 100% $06/30/10 $4,479,257 100% $0
6/30/11 $5,426,592 100% $0
Other Postemployment Benefi ts
Post-retirement health care benefi ts are also provided to Lottery employees through the programs sponsored by the State as administered by CalPERS and the Department of Personnel Administration (DPA). As the post-retirement health care plan is sponsored by the State it is considered a single-employer plan. The Lottery is considered a department of the State. The total other postemployment benefi ts (OPEB) actuarial accrued liability is reported at the State level.
Health care and dental benefi ts may be provided to members depending on the date hired and the member’s years of credited service. Post-retirement health benefi ts include medical, prescription drug and dental benefi ts and are currently funded on a pay-as-you-go basis. Employer contributions for health premiums during the 2010/2011 fi scal year maintained the 100/90 percent contribution formula established by Government Code. Under this formula, the State uses 100 percent of the weighted average premiums of the four largest health benefi t plans in order to calculate the maximum amount the State will contribute toward the retiree’s health benefi ts. The State also contributes 90 percent of this average for the health benefi ts of each of the retiree’s dependents. The retiree is responsible for paying all health benefi t plan costs that exceed the average of the four largest benefi t plans. The monthly contribution maximums are $542 for a single enrollee, $1,030 for an enrollee and one dependent, and $1,326 for an enrollee and two or more dependents. Dental care premiums vary by plan and number of dependents. The contribution formulas are subject to approval and amendment by the legislature of the State. If members are not fully vested, the health care and dental contributions will be prorated based on the years of service.
The Lottery paid approximately $2.8 million for post-retirement health and dental benefi ts for retired members for the year ended June 30, 2011. The Lottery adopted GASB 45 during the 2007/2008 fi scal year. GASB 45 was implemented prospectively and the Lottery had a zero net OPEB obligation (NOO) upon adoption. The Lottery’s annual OPEB cost (AOC) is calculated based on the annual required contribution (ARC). The AOC recorded by the Lottery is calculated by the primary government and represents an allocation of the total ARC of the State, adjusted for interest and other adjustments. The allocation is based on the Lottery’s retiree health benefi t costs in relation to the total State retiree health benefi t costs. The ARC represents the normal cost plus an amortization of the difference between the actuarial accrued liability and any assets available to pay benefi ts. The AOC for the year ended June 30, 2011, was $8,827,000. The total NOO liability recorded as of June 30, 2011, is $20,408,000. The following table shows the components of the Lottery’s AOC, the amount actually contributed to the plan and the NOO as of and for the year ended June 30, 2011 and the previous fi scal year (in thousands).
- 27 -
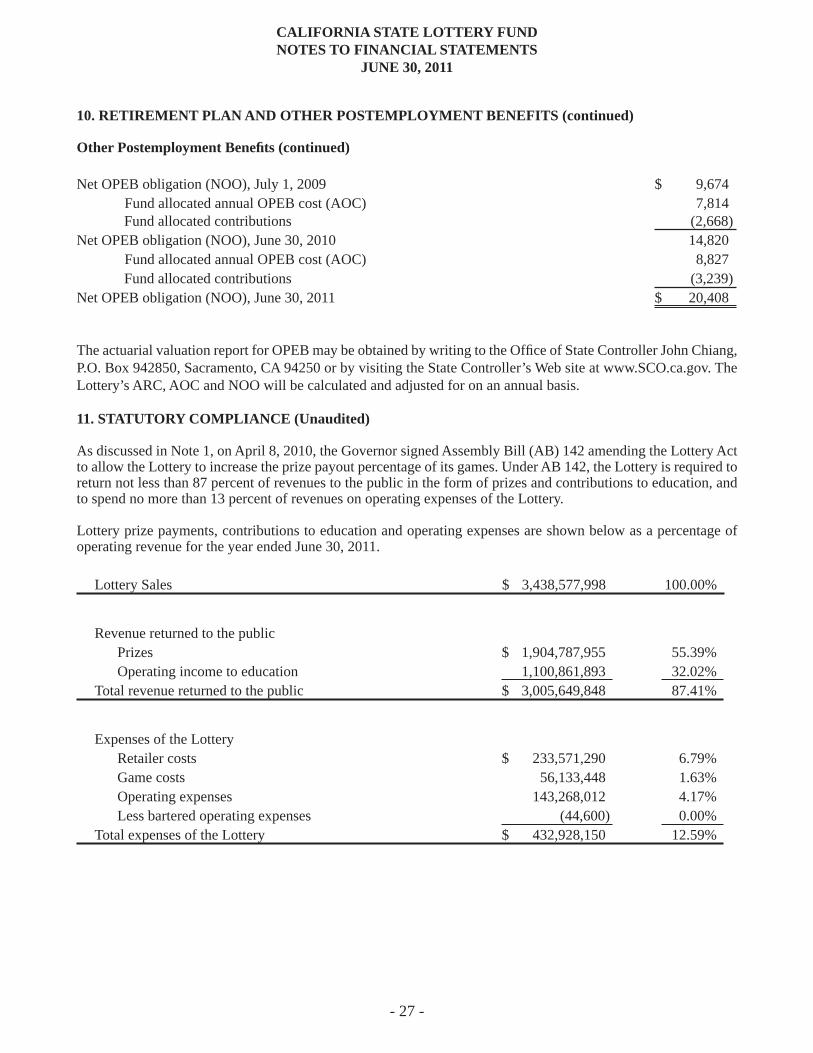
10. RETIREMENT PLAN AND OTHER POSTEMPLOYMENT BENEFITS (continued)
Other Postemployment Benefi ts (continued)
Net OPEB obligation (NOO), July 1, 2009 $ 9,674 Fund allocated annual OPEB cost (AOC) 7,814 Fund allocated contributions (2,668)Net OPEB obligation (NOO), June 30, 2010 14,820 Fund allocated annual OPEB cost (AOC) 8,827 Fund allocated contributions (3,239)Net OPEB obligation (NOO), June 30, 2011 $ 20,408
The actuarial valuation report for OPEB may be obtained by writing to the Offi ce of State Controller John Chiang, P.O. Box 942850, Sacramento, CA 94250 or by visiting the State Controller’s Web site at www.SCO.ca.gov. The Lottery’s ARC, AOC and NOO will be calculated and adjusted for on an annual basis.
11. STATUTORY COMPLIANCE (Unaudited)
As discussed in Note 1, on April 8, 2010, the Governor signed Assembly Bill (AB) 142 amending the Lottery Act to allow the Lottery to increase the prize payout percentage of its games. Under AB 142, the Lottery is required to return not less than 87 percent of revenues to the public in the form of prizes and contributions to education, and to spend no more than 13 percent of revenues on operating expenses of the Lottery.
Lottery prize payments, contributions to education and operating expenses are shown below as a percentage of operating revenue for the year ended June 30, 2011.
Lottery Sales $ 3,438,577,998 100.00%
Revenue returned to the public
Prizes $ 1,904,787,955 55.39% Operating income to education 1,100,861,893 32.02%
Total revenue returned to the public $ 3,005,649,848 87.41%
Expenses of the Lottery
Retailer costs $ 233,571,290 6.79% Game costs 56,133,448 1.63% Operating expenses 143,268,012 4.17% Less bartered operating expenses (44,600) 0.00%
Total expenses of the Lottery $ 432,928,150 12.59%
CALIFORNIA STATE LOTTERY FUNDNOTES TO FINANCIAL STATEMENTS
JUNE 30, 2011

- 28 -
11. STATUTORY COMPLIANCE (Unaudited, continued)
A summary of the total funds transferred by the Lottery to the education community for the fi scal year ended June 30, 2011, is shown below.
Revenues to Education Allocation of sales - operating income $ 1,100,861,893 Unclaimed prizes directly allocated to the Education Fund 25,690,477 Interest income 1,976,999 Other income 66,476 Less bartered income (44,600)
Total declared for allocation to the Education Fund $ 1,128,551,245
12. COMMITMENTS AND CONTINGENCIES
A contract has been awarded to GTECH that includes both gaming and telecommunication systems and services. The Lottery pays a fee of 1.36 percent of sales. The original contract ran through October 13, 2009, and had a total estimated cost of $300 million. A series of contract extensions were awarded. The latest, signed by the Director in June 2010, extends the contract to October 13, 2019, and includes a complete upgrade of the gaming system. The total contract expenditure is not to exceed $1.075 billion. Approximately $402 million in fees have been incurred under the contract as of June 30, 2011.
On June 26, 2009, the Lottery Commission awarded a contract to Otto Construction for pre-construction services and construction of a new Lottery Headquarters building. The estimated construction costs, including demolition, pre-construction services, green building elements and modular furniture, are $53.8 million. Additionally, estimated contingency and escalation allowances are $6.8 million and $3.2 million, respectively. Costs incurred on the contract as of June 30, 2011, were approximately $56.3 million. Lottery staff moved into the new building in July 2011.
The Lottery has been named as a defendant in various lawsuits and claims. Legal counsel has determined that it is probable that one of these lawsuits may be settled in favor of the plaintiffs. As a result, a legal contingency of $8.6 million has been recorded as of June 30, 2011.
13. RISK MANAGEMENT
Since its inception, the Lottery has been primarily self-insured for risks such as fl ood, business interruption, theft, employee errors and omissions, and other potential liabilities. Losses are recognized when conditions for accrual are met. Liabilities for workers’ compensation costs are accrued based on estimates derived from the State Compensation Insurance Fund. This estimate is based on actuarial reviews of the employee workers’ compensation program and includes indemnity payments, compensation benefi ts, and leave benefi ts. The liability for workers’ compensation claims is not material to the fi nancial statements taken as a whole.
CALIFORNIA STATE LOTTERY FUNDNOTES TO FINANCIAL STATEMENTS
JUNE 30, 2011


