California State University, San Bernardino California State University, San Bernardino CSUSB ScholarWorks CSUSB ScholarWorks Electronic Theses, Projects, and Dissertations Office of Graduate Studies 9-2018 Differences in Self-Perceptions at Work Between Citizens and Differences in Self-Perceptions at Work Between Citizens and Undocumented Immigrants Undocumented Immigrants Marcos Guevara California State University – San Bernardino Follow this and additional works at: https://scholarworks.lib.csusb.edu/etd Part of the Industrial and Organizational Psychology Commons, and the Social Psychology Commons Recommended Citation Recommended Citation Guevara, Marcos, "Differences in Self-Perceptions at Work Between Citizens and Undocumented Immigrants" (2018). Electronic Theses, Projects, and Dissertations. 749. https://scholarworks.lib.csusb.edu/etd/749 This Thesis is brought to you for free and open access by the Office of Graduate Studies at CSUSB ScholarWorks. It has been accepted for inclusion in Electronic Theses, Projects, and Dissertations by an authorized administrator of CSUSB ScholarWorks. For more information, please contact [email protected].
Transcript
California State University, San Bernardino California State University, San Bernardino
CSUSB ScholarWorks CSUSB ScholarWorks
Electronic Theses, Projects, and Dissertations Office of Graduate Studies
9-2018
Differences in Self-Perceptions at Work Between Citizens and Differences in Self-Perceptions at Work Between Citizens and
Undocumented Immigrants Undocumented Immigrants
Marcos Guevara California State University – San Bernardino
Follow this and additional works at: https://scholarworks.lib.csusb.edu/etd
Part of the Industrial and Organizational Psychology Commons, and the Social Psychology Commons
Recommended Citation Recommended Citation Guevara, Marcos, "Differences in Self-Perceptions at Work Between Citizens and Undocumented Immigrants" (2018). Electronic Theses, Projects, and Dissertations. 749. https://scholarworks.lib.csusb.edu/etd/749
This Thesis is brought to you for free and open access by the Office of Graduate Studies at CSUSB ScholarWorks. It has been accepted for inclusion in Electronic Theses, Projects, and Dissertations by an authorized administrator of CSUSB ScholarWorks. For more information, please contact [email protected].
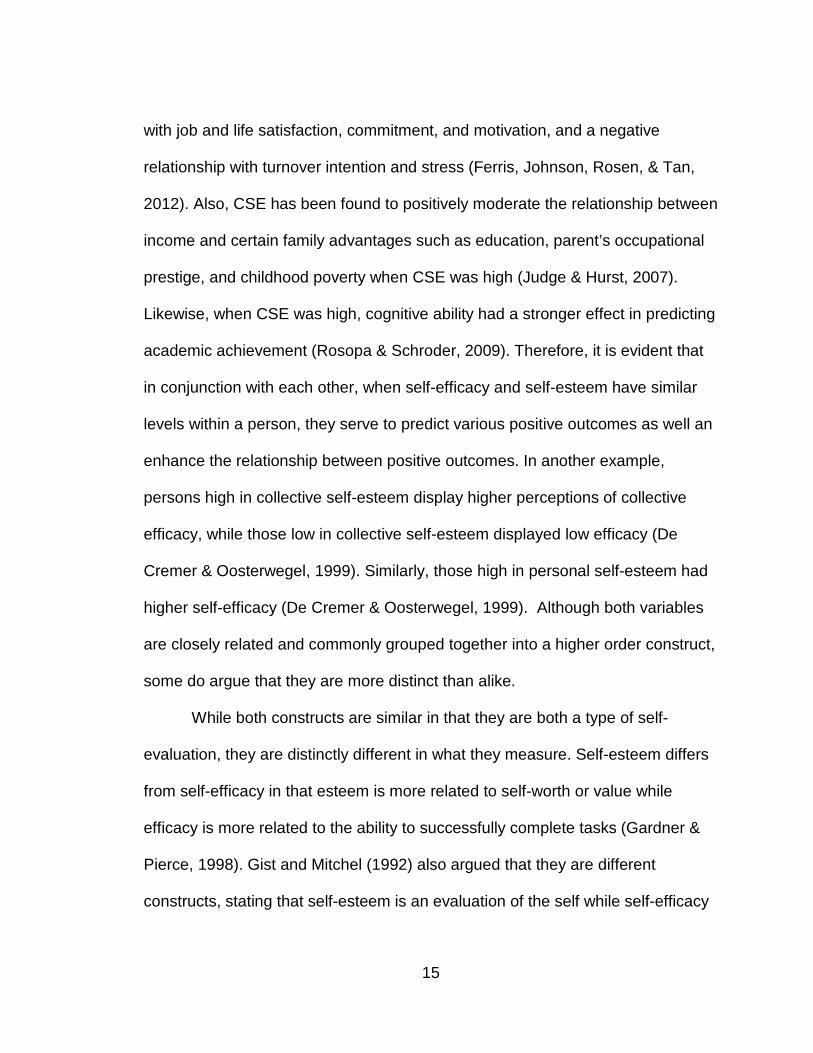
Within LMX, it has been shown that differences between leaders and
followers can create barriers and lead to detachment, distance, and interpersonal
conflict. In contrast, perceived similarity leads to a higher quality relationships
and attraction (Dulebohn, Bommer, Liden, Brouer, & Ferris, 2010). This is due to
the fact that similar individuals foster greater liking for each other due to feeling
more comfortable around each other and thus communicating more easily with
each other. Similarly, Liden, Wayne, and Stilwell (1993) found that perceived
similarity and liking from the perspective of both the leader and follower predicted
LMX at different time periods whereas demographic similarities had no effect.
Therefore, it has been established that PSS, which focuses more on deep level
similarities, has a stronger effect than actual similarities, which are demographic,
on establishing relationships with supervisors.
Adding on to the research that has found a relationship between PSS and
LMX, it is important to examine the effect PSS has on other organizational
outcomes as well. When perceived similarity was measured from the employee’s
point of view, PSS was positively related to job satisfaction and role clarity
(Turban, & Jones, 1988). When perceived similarity was measured from the
supervisor’s point of view, it was related to perceptions of performance and pay
decisions (Turban, & Jones, 1988). Likewise, persons perceived to be more
similar to an evaluator are seen as more attractive and decisions and evaluations
towards that person tend to be positively biased (Turban & Jones, 1988). This is
important since supervisors are typically the one evaluating their employees. In
25
addition, PSS increases the odds of being treated more favorably, having more
job satisfaction, receiving higher performance ratings and pay ratings, and leads
to more frequent communication with, and trust in, supervisors (Turban & Jones,
1988). Lastly, supervisor similarity predicted promotion decisions in candidates
that belonged to groups with high levels of collectivistic orientation (Schaubroeck,
& Lam, 2002). Therefore, it seems as if simply being similar to your supervisor
would lead to a host of positive work-related outcomes. If promotion,
continuation, and turnover decisions are affected by PSS, then PE will be
affected. To paint a clearer picture, PSS will moderate the relationship between
both OSE and OBSE with PE. The model and expected interaction effects can
be seen below in Figures 1, 2, and 3.
Hypothesis 6: The citizen group will report significantly higher perceived
supervisor similarity than the deferred action group.
Hypothesis 7: Perceived supervisor similarity will positively predict perceived
employability similarly in both groups in a model also contains occupation self-
efficacy and organization based self-esteem.
Hypothesis 8: Perceived supervisor similarity and occupational self-efficacy will
interact to predict perceived employability such that the relationship between self-
efficacy and employability will be significantly stronger when similarity is high and
weaker when it is low (see Figure 2).
Hypothesis 9: Perceived supervisor similarity and organization based self-esteem
will interact to predict perceived employability such that the relationship between
26
self-esteem and employability will be significantly stronger when similarity is high
and weaker when it is low (see Figure 3).
Figure 1. Conceptual Model. Caption: The overall conceptual model depicting the relationship between all variables.
Figure 2. Expected Interaction between Occupational Self-Efficacy and Perceived Supervisor Similarity on Perceived Employability.
0
0.5
1
1.5
2
2.5
3
3.5
4
4.5
5
Low OSE High OSE
Perc
eive
d Em
ploy
abili
ty
Occupational Self Efficacy
Low PSS High PSS
Occupational Self-Efficacy
Org Based Self-Esteem
Perceived Supervisor Similarity
Perceived Employability
27
Caption: The expected interaction effect for Hypothesis 8 of perceived supervisor similarity and occupational self-efficacy on perceived employability.
Figure 3. Expected Interaction between Organization Based Self-Esteem and Perceived Supervisor Similarity on Perceived Employability. Caption: The expected interaction effect for Hypothesis 9 of perceived supervisor similarity and organization based self-esteem on perceived employability.
0
0.5
1
1.5
2
2.5
3
3.5
4
4.5
5
Low OBSE High OBSE
Perc
eive
d Em
ploy
abili
ty
Organization Based Self Esteem
Low PSS High PSS
28
CHAPTER TWO
METHODS
Participants
The individuals who participated in this study were at least 18 years old
and had at least 6 months of previous work experience. This minimum work
requirement was to ensure that participants had adequate time to develop a
relationship with their supervisor. The sample consisted of primarily student
workers as well as practitioners from various fields. A power analysis was
performed using G*Power 3.1.9.2 (Faul, Erdfelder, Lang, & Buchner, 2007) to
estimate the sample size necessary for a moderated multiple regression. The
resulting sample size needed was 77 when power was set at .80 and α = .05 with
3 predictors and a medium effect size. When power was set to .95 with all else
the same, the resulting sample size needed was 119.
A total of 697 participants were included in the sample after initially
removing 22 participants that incorrectly answered at least 2 of the 3 careless
response checks. Of the participants, 546, or 78.3%, were Natural Born U.S.
Citizens, while 76, or 10.9%, were Undocumented with Deferred Action.
Additionally, 35 were Naturalized U.S. Citizens, 28 were Permanent Residents, 7
were Undocumented, and 5 had Student, Work, or Visitors Visas. Due to the low
number of Naturalized Citizens, Permanent Resident, Undocumented
29
Immigrants, and participants with Visas, they were not included in any of the
main analyses.
Within the citizen group, the sample consisted of 103 men and 441
women which accounted for 18.9% and 80.8% of the sample, with an additional 2
“other” participants. The majority of the citizen participants were Hispanic,
accounting for 59.5% of the sample, while 26.2% were Caucasian, 5.7% were
African American, 4.2% were Other, 2.9% were Asian, and 1.5% were Middle
Eastern. The average age of participants was 25.76 years old with ages ranging
from 18 to 74 years old. The average number of years worked was 7.63 with the
amount ranging from 1 to 52 years. Lastly, the average annual income of the
citizen participants was $22,552.
Within the DACA group, the sample consisted of 27 men and 49 women
which accounted for 35.5% and 64.5% of the sample. The majority of the DACA
participants were Hispanic, accounting for 93.4% of the sample, while 5.3% were
Asian, and 1.3% were Caucasian. The average age of participants was 24.72
years old with ages ranging from 18 to 35 years old. The average number of
years worked was 7.53 with the amount ranging from 1 to 24 years. Lastly, the
average annual income of the DACA participants was $30,495.
The demographics of the two samples can be seen in Tables 1 and 2
below. No other identifying information was asked of the participants in an effort
to increase the number of undocumented participants.
30
Table 1. Continuous Demographic Variables.
Sample Variable Mean s Min Max Citizen Sample Age (Years) 25.76 8.24 18 74 Years Worked 7.63 7.94 1 52 Annual Income
(USD) $22,552 $25,892 $0 $200,000
DACA Sample Age (Years) 24.72 4.27 18 35 Years Worked 7.53 5.21 1 24 Annual Income
(USD) $30,495 $25,729 $0 $120,000
Note: s = standard deviation.
Table 2. Categorical Demographic Variables.
Variables N % Legal Status
Natural Born U.S. Citizen 546 78.3 Naturalized U.S. Citizen 35 5
U.S. Permanent Resident 28 4 Undocumented with DACA 76 10.9
Note: N = sample size, Missing = number of missing values, SD = standard deviation, Z Skew = standardized skewness, Z Kurtosis = standardized kurtosis.
Table 4. DACA Group Variable Descriptive Statistics.
Variable N Missing Mean SD Z Skew Z Kurtosis OSE 76 0 4.16 0.56 -0.88 -0.31 OBSE 72 4 4.18 0.63 -1.30 -0.73 PSS 76 0 3.45 0.89 -1.07 -0.38 PE 71 5 4.04 0.59 -0.76 -1.20
Note: N = sample size, Missing = number of missing values, SD = standard deviation, Z Skew = standardized skewness, Z Kurtosis = standardized kurtosis.
Note: * p < .05, d = Cohen’s d, df = degrees of freedom.
A sequential multiple regression was conducted for each group in which
the control variables of Age, Years Worked, and Annual Income were entered in
the first step, the main effects of OSE, OBSE, and PSS were entered in the
40
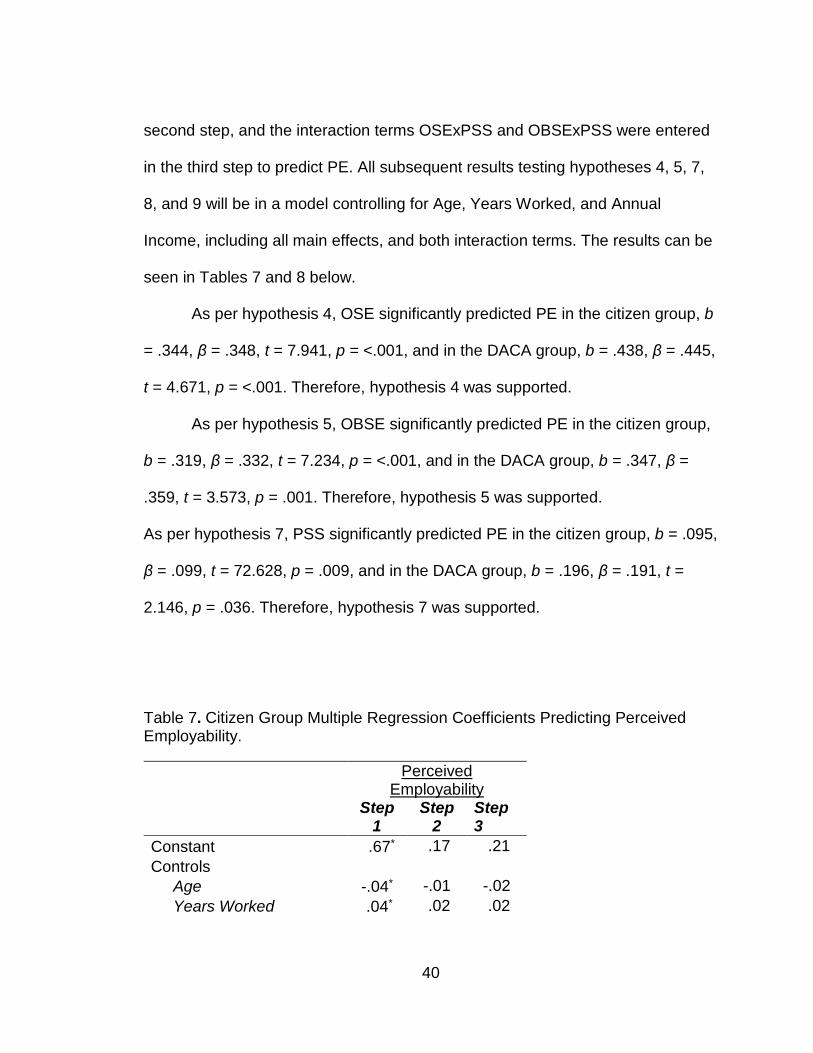
second step, and the interaction terms OSExPSS and OBSExPSS were entered
in the third step to predict PE. All subsequent results testing hypotheses 4, 5, 7,
8, and 9 will be in a model controlling for Age, Years Worked, and Annual
Income, including all main effects, and both interaction terms. The results can be
seen in Tables 7 and 8 below.
As per hypothesis 4, OSE significantly predicted PE in the citizen group, b
= .344, β = .348, t = 7.941, p = <.001, and in the DACA group, b = .438, β = .445,
t = 4.671, p = <.001. Therefore, hypothesis 4 was supported.
As per hypothesis 5, OBSE significantly predicted PE in the citizen group,
b = .319, β = .332, t = 7.234, p = <.001, and in the DACA group, b = .347, β =
.359, t = 3.573, p = .001. Therefore, hypothesis 5 was supported.
As per hypothesis 7, PSS significantly predicted PE in the citizen group, b = .095,
β = .099, t = 72.628, p = .009, and in the DACA group, b = .196, β = .191, t =
2.146, p = .036. Therefore, hypothesis 7 was supported.
Table 7. Citizen Group Multiple Regression Coefficients Predicting Perceived Employability.
Perceived
Employability
Step
1 Step
2 Step 3
Constant .67* .17 .21 Controls Age -.04* -.01 -.02 Years Worked .04* .02 .02
41
Annual Income 0 0 0
Occupational Self-Efficacy .30*** .34***
Organization Based Self-Esteem .36***
.32***
Perceived Supervisor Similarity .12** .10**
OSE X PSS .11**
OBSE X PSS -.11**
Adj. R2 .01 .43 .44 Δ Adj. R2 .42 .01
Note: Significant findings are marked with * at p < .05, ** at p < .01, and *** at p < .001. Estimates are unstandardized regression coefficients (b). Table 8. DACA Group Multiple Regression Coefficients Predicting Perceived Employability.
Perceived
Employability
Step 1
Step 2
Step 3
Constant -1.68 .46 .44 Controls Age .07 -.02 -.02 Years Worked -.04 .02 .02 Annual Income 0* 0 0
Occupational Self-Efficacy .451*** .44***
Organization Based Self-Esteem .346** .35**
Perceived Supervisor Similarity .165 .20*
OSE X PSS -.07
OBSE X PSS .07
Adj. R2 .10 .66 .66 Δ Adj. R2 .56 -.05
42
Note: Significant findings are marked with * at p < .05, ** at p < .01, and *** at p < .001. Estimates are unstandardized regression coefficients (b).
The following results for the overall model fit for both groups can be seen
in Table 9 below. For the citizen group (N = 487), in step 1, which included the
control variables, the model did not significantly predict PE, R = .116, p = .088,
and explained 1.3% of the variance in PE. In step 2, after adding the main
effects, the model significantly predicted PE, R = .662, p = <.001, R2 change =
.424, p R2 change = <.001, and explained 43.8% of the variance in PE. In step 3,
after adding the interaction effects, the model significantly predicted PE, R =
.670, p = <.001, R2 change = .011, p R2 change = .009, and explained 44.9% of
the variance in PE.
For the DACA group (N = 66), in step 1, which included the control
variables, the model did significantly predict PE, R = .376, p = .023, and
explained 14.1% of the variance in PE. In step 2, after adding the main effects,
the model significantly predicted PE, R = .832, p = <.001, R2 change = .551, p R2
change = <.001, and explained 69.3% of the variance in PE. In step 3, after
adding the interaction effects, the model significantly predicted PE, R = .836, p =
<.001, but the additional change was no significant, R2 change = .006, p R2
change = .597, and explained 69.8% of the variance in PE.
43
Table 9. Sequential Multiple Regression by Group and Model.
In the citizen group there was a small yet significant interaction effect of
OSExPSS, b = .107, β = .126, t = 2.687, p = .007, indicating that PSS moderates
the relationship between OSE and PE. Specifically, at low levels of OSE, PSS
does not cause any differences in levels of PE, but at high levels of OSE, citizens
with high PSS will have higher levels of PE than those with low PSS. In the
DACA group there was not a significant interaction effect of OSExPSS, b = -.069,
β = -.073, t = -.864, p = .391, indicating that PSS does not moderate the
relationship between OSE and PE. Therefore, hypothesis 8 is partially supported
Group Model R R2 Adj. R2 p R2 Change Sig. F
Change
Citizen 1 .116 .013 .007 .088 .013 .088
2 .662 .438 .431 <.001*** .424 <.001***
3 .670 .449 .439 <.001*** .011 .009**
DACA 1 .376 .141 .100 .023* .141 .023*
2 .832 .693 .661 <.001*** .551 <.001** 3 .836 .698 .656 <.001*** .006 0.597 Note: * p < .05, ** p < .01, *** p < .001, R = multiple regression coefficient, R2 = variance explained.
44
having found the expected interaction effect in only one of the two groups.
Figures 4 and 5 display the interactions below.
Figure 4. Citizen Group Interaction Between Occupational Self-Efficacy and Perceived Supervisor Similarity. Caption: Citizen group interaction between occupational self-efficacy and perceived supervisor similarity.
-2
-1.5
-1
-0.5
0
0.5
1
1.5
2
Low OSE High OSE
Perc
eive
d E
mpl
oyab
ility
Low PSSHigh PSS
45
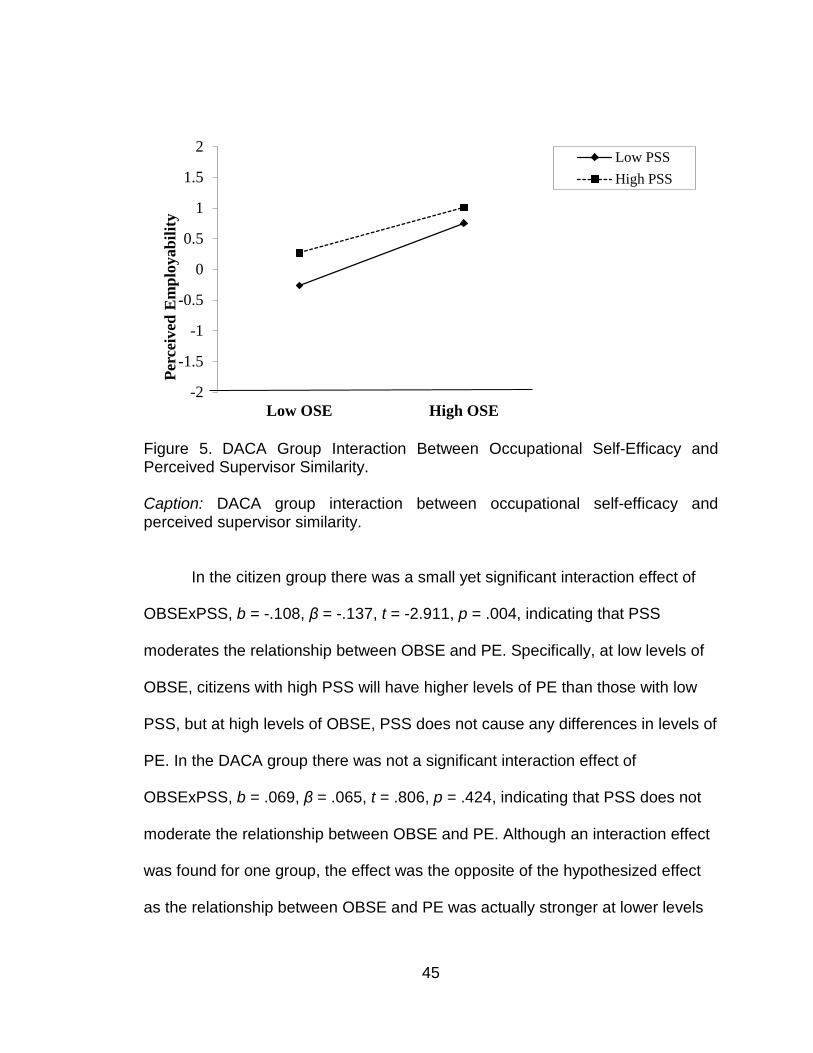
Figure 5. DACA Group Interaction Between Occupational Self-Efficacy and Perceived Supervisor Similarity. Caption: DACA group interaction between occupational self-efficacy and perceived supervisor similarity.
In the citizen group there was a small yet significant interaction effect of
OBSExPSS, b = -.108, β = -.137, t = -2.911, p = .004, indicating that PSS
moderates the relationship between OBSE and PE. Specifically, at low levels of
OBSE, citizens with high PSS will have higher levels of PE than those with low
PSS, but at high levels of OBSE, PSS does not cause any differences in levels of
PE. In the DACA group there was not a significant interaction effect of
OBSExPSS, b = .069, β = .065, t = .806, p = .424, indicating that PSS does not
moderate the relationship between OBSE and PE. Although an interaction effect
was found for one group, the effect was the opposite of the hypothesized effect
as the relationship between OBSE and PE was actually stronger at lower levels
-2
-1.5
-1
-0.5
0
0.5
1
1.5
2
Low OSE High OSE
Perc
eive
d E
mpl
oyab
ility
Low PSSHigh PSS
46
of PSS, not higher levels of PSS. Therefore, no evidence was found to support
hypothesis 9. Figures 6 and 7 display the interactions below. Additionally,
Figures 8 and 9 display the full model for both groups.
Figure 6. Citizen Group Interaction Between Organization Based Self-Esteem and Perceived Supervisor Similarity. Caption: Citizen group interaction between organization based self-esteem and perceived supervisor similarity.
-2
-1.5
-1
-0.5
0
0.5
1
1.5
2
Low OBSE High OBSE
Perc
eive
d E
mpl
oyab
ility
Low PSSHigh PSS
47
Figure 7. DACA Group Interaction Between Organization Based Self-Esteem and Perceived Supervisor Similarity. Caption: DACA group interaction between organization based self-esteem and perceived supervisor similarity.
Figure 8. Citizen Group Full Model.
-2
-1.5
-1
-0.5
0
0.5
1
1.5
2
Low OBSE High OBSE
Perc
eive
d E
mpl
oyab
ility
Low PSSHigh PSS
Occupational Self-Efficacy
Org Based Self-Esteem
Perceived Supervisor Similarity
Perceived Employability
.344*** (.348***)
.319*** (.332***)
.107** (.326**) -.108** (-.137**)
.095** (.099**)
48
Caption: All values are unstandardized b with standardized β in ( ). Significance is indicated with * at p < .05, ** at p < .01, and *** at p < .001. This model includes controls for Age, Years Worked, and Annual Income. R = 0.670, R2 = 0.449.
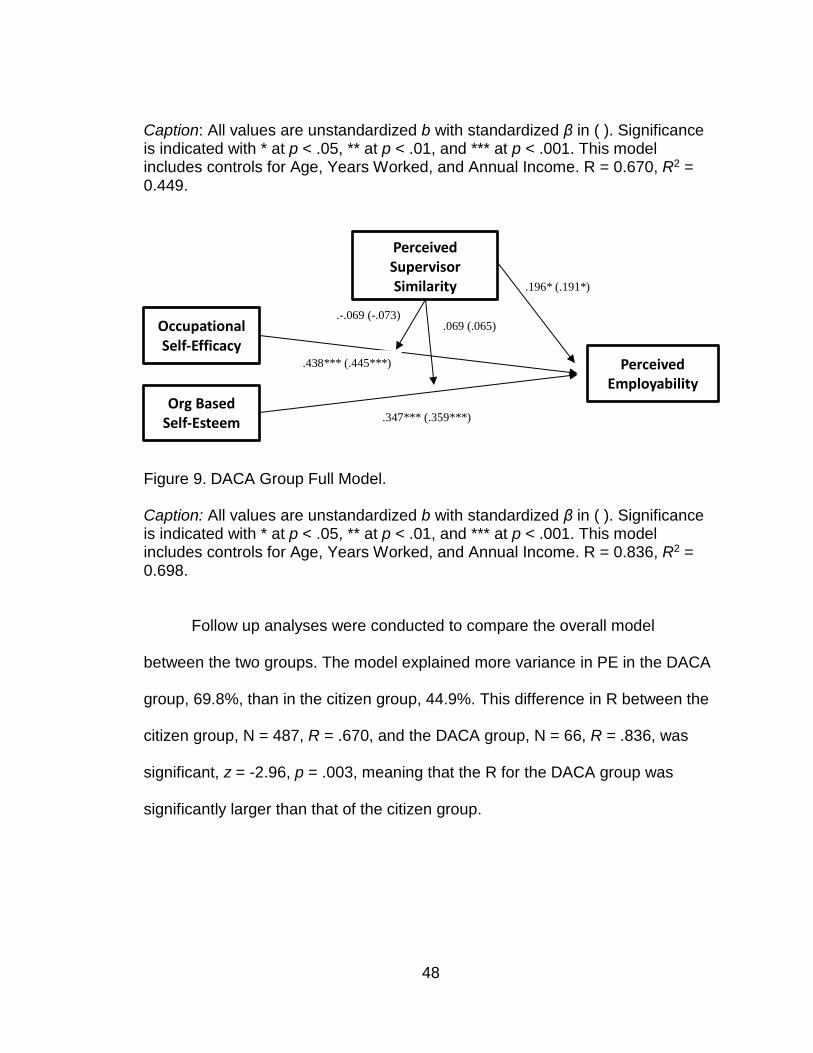
Figure 9. DACA Group Full Model. Caption: All values are unstandardized b with standardized β in ( ). Significance is indicated with * at p < .05, ** at p < .01, and *** at p < .001. This model includes controls for Age, Years Worked, and Annual Income. R = 0.836, R2 = 0.698.
Follow up analyses were conducted to compare the overall model
between the two groups. The model explained more variance in PE in the DACA
group, 69.8%, than in the citizen group, 44.9%. This difference in R between the
citizen group, N = 487, R = .670, and the DACA group, N = 66, R = .836, was
significant, z = -2.96, p = .003, meaning that the R for the DACA group was
significantly larger than that of the citizen group.
Occupational Self-Efficacy
Org Based Self-Esteem
Perceived Supervisor Similarity
Perceived Employability
.438*** (.445***)
.347*** (.359***)
.-.069 (-.073) .069 (.065)
.196* (.191*)
49
CHAPTER FOUR
DISCUSSION
The purpose of this study was to examine the effects of self-perceptions at
work on employability. Specifically, this study had three main goals. First, four
different types of self-perceptions were compared between U.S. citizens and
undocumented immigrants with deferred action to see if any differences existed
between the groups. Second, the relationship between self-perceptions such as
self-efficacy, self-esteem, and supervisor similarity were expected to predict
employability. Lastly, the perception of supervisor similarity was thought to
interact with both self-efficacy and self-esteem at work to predict employability.
First, no differences were found between the citizen group and the DACA
group in three of the four variables examined. The levels of OSE, OBSE, and
PSS were found to be nearly identical between both citizen participants and
DACA participants. Therefore, hypotheses 1, 2, and 6 were not supported. This
similarity was not expected, but can easily be explained. To have deferred action
you must be a childhood arrival and have completing schooling within the United
States. I expect that being raised in the United States from such an early age, as
well as completing their education in the U.S., may cause people with DACA to
more strongly identify as being Americans. Essentially, having been raised in the
same conditions makes them identical to citizens when it comes to how they
perceive they will be valued at work, how competent they feel at work, and how
well they can relate to their supervisors. Also, individuals with DACA may no
50
longer identify strongly as undocumented immigrants after a few years of
continuously working legally and driving legally without fear of deportation.
Additionally, it may be the case that people with DACA may raise their self-
esteem by comparing their group to undocumented immigrants who cannot work
or have not completed schooling in the United States, as this type of comparison
with a subordinate group is common and expected in intergroup dynamics (Tajifel
& Turner, 1979). Lastly, the samples of both groups were predominantly Hispanic
and near the same average age, which may have resulted in the similarity of
comparisons to their supervisors.
When it came to comparisons of PE between the two groups, surprisingly the
DACA group was found to exhibit higher levels than the citizen group. Therefore,
hypothesis 3 was also not supported. I would assume that the exceedingly high
level of their belief in the DACA group’s ability to obtain and maintain
employment comes from recently being given the opportunity to work. The DACA
program only went into effect late in 2012, with new first-time applicants
constantly being accepted. This recent change for undocumented young adults
of being allowed to work legally may make this group more inclined to feel
confident about going out and getting a job as opposed to an individual who has
always expected that they will one day naturally work. Wilson, Gunn, and Ross
(2009) proposed a theory of temporal self-appraisal in which positive events in
one’s life seem recent while negative effects seem distant. This temporal bias is
found to serve the purpose of increasing one’s self-evaluation of themselves.
51
Perhaps the recency of receiving deferred action may make the notion of being
able to get a job more salient, thereby resulting in higher PE scores. Ultimately,
the opportunity provided by deferred action to allow young undocumented
immigrants who may strongly identify as being American to step out of the
shadows and into legitimate working conditions seems to have had a significant
impact on their beliefs of value and competence in their workplace which has
now made those beliefs seemingly comparable to that of natural born citizens.
This is a significant finding that may be of interest to policy makers and a crucial
first step in examining more objective work-related outcomes among this new
working population.
In the second portion of this study, I aimed to examine clearly established
relationships between different types of work related self-perceptions, specifically
if OSE, OBSE, and PSS would predict PE. This was confirmed in both the citizen
group and the DACA group, therefore supporting hypotheses 4, 5, and 7. Work
related self-perceptions such as self-efficacy, self-esteem, and supervisor
similarity all have a positive relationship with employability, meaning that as your
levels of perceived competence, value, and similarity increase, your belief about
your ability to gain and maintain employment also increases. This study uniquely
contributed to this field of knowledge by confirming that these commonly
observed relationships are applicable among groups with different legal statuses,
primarily among the new workforce of undocumented immigrants with deferred
actions.
52
Within the DACA group these relationships were actually stronger and had
larger effect sizes compared to the citizen group. Follow-up analyses showed
that the overall variance explained in PE by the model ended up being
significantly larger in the DACA group than the citizen group. This shows that
self-perceptions have more of an impact in predicting PE in undocumented
immigrants than in citizens, whereas citizens may have other factors that play a
bigger role in determining their PE.
Lastly, I sought to better explain a potential moderator of PE. Specifically, I
believed that PSS would moderate the relationship between OSE and OBSE with
PE such that the positive relationship would be stronger at high levels of PSS.
This was confirmed only once in the citizen group when examining the
relationship between OSE and PE. The opposite significant interaction effect was
found when examining OBSE and PE. Within the DACA group, no moderating
effect of PSS was found.
The first interaction between self-efficacy and supervisor similarity in the
citizen group worked as expected. Therefore, hypothesis 8 was supported within
the citizen group. When OSE is low, differences in PSS have no effect on PE.
When OSE is high, citizens with high levels of PSS end up with higher levels of
PE while those with low PSS have lower PE. This seems to imply that if your
competence on the job is low, or your perceived ability to complete your required
tasks is low, then no amount of similarity or dis-similarity with your supervisor will
make you feel more employable. On the other hand, if your self-efficacy is high,
53
then positive or negative similarity comparisons with your supervisor are
meaningful and do have an impact on your PE. As stated earlier, promotion,
continuation, and turnover decisions are at times affected by supervisor similarity
(Hutzschenreuter., Kleindienst., & Greger, 2015; Williams, & O’Reilly, 1998). It
would seem though that this is only the case once you have a certain level of
efficacy in your job. This finding suggests that the well documented positive
outcomes of having a supervisor with deep-level similarities in perspective and
work style actually depends on having an already existing minimum level of self-
efficacy. This caveat partially supports and expands on Bandura’s (1994) Social
Cognitive Theory explaining how higher levels of self-efficacy leads to
considering more career options and greater career success, or more PE.
Except, when PSS is low this effect is not at all evident as PE levels are equal in
those with low or high OSE. This finding then enhances our understanding of
when self-efficacy affects PE.
The second meaningful interaction within the citizen group was that of self-
esteem and supervisor similarity on employability. This relationship was not in
the expected direction, therefore not supporting hypothesis 9. When OBSE is
low, citizens with low PSS have lower levels of PE while those with high levels of
PSS have higher PE. When OBSE is high, differences in PSS have no effect on
PE with PE levels being nearly equal. This indicates that when you feel less
valuable at your job, similarities with your supervisor will help improve your
overall beliefs about your ability to obtain and maintain employment. On the other
54
hand, when your self-esteem is high, these similarities have no impact on your
PE. According to Social Identity Theory, once a person identifies with a group,
social comparisons are made with other groups on the basis of striving to
achieve a positive social identity (Tajifel & Turner, 2004). These comparisons
serve to increase a person’s self-evaluations of oneself and raise their self-
esteem. It may then be that when a citizen’s OBSE is low, comparing oneself to
their supervisor affects PE because they are actively comparing themselves in an
attempt to increase their positive social standing and self-evaluation. This need
to compare themselves with their supervisor, which is brought about by having
low esteem, then serves to increase their PE when similarities do exist. Likewise,
when OBSE is high, comparisons with their supervisor are not as meaningful or
necessary because they already have a very positive social identity and self-
evaluation of themselves, therefore not affecting their PE. This explanation
makes sense within the framework of the theory that social comparisons are
done on the basis of increasing a person’s positive self-esteem. As stated earlier,
self-esteem has a well documented positive relationship with PE affecting the
likelihood of being employed, career self-management, career proactivity, and
career development (Dacre Pool & Sewell, 2007; Potgieter, 2012; Waddell,
2006). This finding adds to that body of research on the relationship between
self-esteem and employability such that a moderating effect of supervisor
similarity was found.
55
Lastly, within the DACA group no moderating effect of PSS was apparent.
Therefore, neither hypothesis 8 or 9 were supported. In both instances PSS
served to increase both the starting and ending levels of PE, meaning that
participants with high levels of PSS had higher PE at both low levels of OBE and
OBSE and high levels when compared to those with low PSS. There was no
interaction effect evident though. This difference between groups may have been
caused by confounding variables. Although income levels and number of years
worked were very similar in both groups, differences in education or job types
between both groups may have contributed to these null results in the DACA
group.
As mentioned earlier, immigrants tend to have lower status or more blue-collar
type jobs (“Demographics of Immigrants”, 2014). Previous research has pointed
out the difficulty of applying the same psychological measures across different
groups with different demographics, such as income levels (French & Agars,
2016). This typically does not result in the same outcomes across groups as
items tend to be written to appeal to white collar workers. For instance, some
items in the Perceived Supervisor Similarity Scale I used such as, “My supervisor
and I think alike in terms of coming up with a similar solution for a problem” or
“My supervisor and I analyze problems in a similar way” may be more applicable
to higher level positions. Higher level positions are more likely to provide
employees with more freedom to analyze problems and solve them however they
seem fit as opposed to lower levels positions which may have less autonomy or
56
decision making authority. Also, low income workers are more likely to work shift
positions and are less career oriented (French & Agars, 2016), which may cause
them to not look up to a direct supervisor who has very little authority
themselves. Ultimately, while PSS was found to moderate both relationships in
the citizen group, it did not moderate either in DACA group.
Limitations and Future Research
This study provided some much needed information on a population that
has very little existing research on them, undocumented immigrants with deferred
action. Although I believe it serves as an excellent starting point for future
research, there are many improvements that may be made as research on this
group of people continues. First, finding no differences in OBE, OBSE, or PSS
between the groups may have been a function of group identification. One
limitation of this study is assuming that people with DACA identify strongly as
undocumented immigrants even though they now have vastly different rights than
them (ability to work, cannot be deported, can drive legally). I argued that
growing up in those conditions should have had an effect on their self-
evaluations of efficacy and esteem at work, although that was not the case. For
this reason, future research based on group identification should include a
measure of group identification in order to evaluate if the group someone selects,
for instance their technical legal status, is also the group they actually identify
with. Additionally, if someone has deferred action, it would be beneficial to ask
57
how long they have possessed it to see if there are any differences in self-
evaluations depending on how long they have had it.
Another limitation of the present study was the lack of demographic
variables controlled for. Other variables to add would be job type and level of
education. Although my research aims to study differences that are argued to be
the cause of differences in legal status, it is difficult to say if that is truly the case.
Three variables were used as controls: income, years worked, and age, but
differences in the moderating effect of PSS may have been caused by
differences in level of education and job type between groups. More variables
should have been controlled for, or more differences in demographic variables
may been discovered, which would have allowed me to better understand and
explain my findings. The difficulty in including this in future research is the
likelihood of getting undocumented immigrants to participate in a study that asks
for a large amount of identifying information. Although more information would be
better, it may result in lower participation from groups who may be less trusting of
giving away their personal identifying information. Future research on this
population will have to balance the need for more information between the need
for more participants.
Another factor that may have affected the differences between the
moderating effect of PSS within groups may have been the scale used to
measure PSS, as mentioned earlier. Change can be made to ensure better
results. For instance, future research should instead instruct the participant to
58
focus on a supervisor, manager, or mentor in a higher position of power in the
organization that they look up to and interact with on a regular basis when
completing the scale. It may be the case that comparisons with a direct
supervisor will not be as impactful as comparisons with someone in a position of
more power. This would especially result in differences in outcomes if one person
is working a low-income job with a direct supervisor they do not look up to, while
another person is in middle management and is looking up to a director or
executive. Changes to the wording of the scale should be considered if dealing
with different groups in potentially different job types.
Another limitation of my study was the difference in sample size between
both groups. While the citizen group was large, exceeding 500 participants, the
DACA group had less than 100 participants. Although the DACA group was
approaching 100 participants, this difference made the groups difficult to
compare and resulted in low statistical power for the DACA group, although
effect sizes can still be compared. This difference in sample size was expected
though, and it is simply the nature of the study. The majority of individuals in a
study conducted in the United States will be American citizens, while only a small
percentage are bound to be undocumented immigrants with deferred action.
Future research on this group should focus on more specific recruitment
strategies to help obtain a larger sample as well as extending the amount of time
spent for data collection, although the more time is spent, the larger the
difference in group size becomes.
59
Lastly, the sample was mostly female Hispanic participants from
California, the majority of which were students at California State University San
Bernardino. Although this sample may accurately represent DACA recipients in
some ways (average age, ethnicity), many may not pursue higher education.
With the citizen group, the sample is in no way representative of the broader
average American which is more likely to be Caucasian and not currently in
college. Future research should build on this study by conducting similar
research in other areas of the country with samples that are demographically
different than mine to ensure the findings of the present study are replicable. This
will allow researchers to understand and explain if and how these groups differ,
or are similar, in a variety of work related contexts.
Theoretical Implications
Several theoretical implications can be made based off the findings of the
present study, primarily to the literature on self-perceptions and employability.
Previously well established relationships, such as OBE, OBSE, and PSS
predicting PE, were replicated. Specifically, these relationships were found to
exist similarly across groups with different legal statuses. It is important to test if
well established relationships between variables exist similarly within new groups
as they enter the workforce and this study helped to accomplish that.
Also, the findings contribute to the literature on supervisor similarity. My
research further solidified a significant, positive relationship between PSS and
OSE, OBSE and PE in the Citizen group and a significant, positive relationship
60
between PSS and OBSE and PE in the DACA group. Additionally, a difference
between groups was established on how PSS moderates the relationship
between OSE and PE, and OBSE and PE. This is due the citizen group’s PSS
moderating the effect on PE when participants had low self-esteem and high self-
efficacy. Although PSS did have a moderating effect on the PE of citizens, it did
not on members of the DACA group. This may indicate that group differences
exist in how this relationship takes place. One possible explanation could be a
difference in the social identities and categorizations of the participants and their
supervisors. According to Tajifel and Turner’s (1979) Social Categorization
Theory, not only is group membership defined by an individual themselves, but
also by others as them belonging to the group. Although we measured the
participants’ perceptions of similarity with their supervisor, we did not measure
the supervisor’s perception of similarity with their employee. We know that within
the LMX framework, perceived similarity leads to higher quality relationships
(Dulebohn, Bommer, Liden, Brouer, & Ferris, 2010) and when measured from the
supervisor’s point of view, to higher performance perceptions and pay decisions
(Turban, & Jones, 1988). Although both the DACA and Citizen groups had equal
levels of PSS, the perceived similarity of their supervisors may have been
different, thereby causing the moderating effect to only be seen in the Citizen in-
group. Although it is difficult to attribute this difference to simply legal status,
these findings serve as a crucial first step in continuing to explore this effect.
61
The present study also added to the literature on when supervisor
similarity works to increase positive self-perceptions within American citizens.
Specifically, it was found that at low levels of self-esteem, similarity will impact
employability, while the same is true only at high levels of self-efficacy.
Therefore, adding to the literature on social comparisons, my findings suggest
that comparisons to increase self-evaluations of employability are not effective
when one already has high esteem, making comparisons with a supervisor
meaningless in that regard. On the other hand, my findings also suggest that a
minimum level of efficacy is necessary before comparisons with a supervisor
affect one’s self-evaluations of employability.
Lastly, the basis for the present study was deeply rooted in the theories of
Social Identity theory and Realistic Group Conflict theory developed by Tajifel
and Turner. It is agreed upon that intergroup dynamics function in such a way
that people judge themselves and others as belonging to a group, begin to
identify with that group, form in-groups and out-groups, compare themselves to
others to increase positive self-evaluations, and this in turn leads to negative
outcomes for minority out-group members (Shore, Chung-Herrera, Dean,
Ehrhart, Jung, Randel, & Singh, 2009). It is thought that belonging to a deferred
action group also means a person belongs to other out-groups (ethnic minority,
low income, less education, less work experience) which would result in negative
self-evaluations. The present study, comparing DACA recipients to American
citizens, did not add to this existing literature on intergroup dynamics as no
62
differences in self-evaluations at work were found. Ultimately, this finding is a
significant contribution to the existing literature on Social Identity theory and
Realistic Group Conflict theory because it may show evidence that once a person
receives deferred action, they may no longer identify as part of a negative
outgroup, at least not as strongly, as they once did. Tajifel and Turner (2004)
explain that when social identity is unsatisfactory, people with either leave their
existing group or join a more positively perceived group. This may be the case
with DACA recipients and more research is necessary to identify is this is truly
the case.
Practical Implications
There exists a gap in the research when it comes to studying the newest
addition to the American workforce, individuals with deferred action. As Industrial
Organizational Psychologists, it our responsibility to examine this newly emerged
workforce in the context of differences in self-perceptions, and eventually how
that relates to work related outcomes, and the effect on diversity management
practices within organizations, just to name a few.
The main finding of the present study showed that there exists no
meaningful differences between citizens and DACA recipients in most self-
perceptions of themselves at work, and employees with DACA have higher levels
of PE. Likewise, the relationships between the variables were similar in both
groups and showed that positive self-perceptions of efficacy, esteem, and
supervisor similarity lead to positive perceptions of employability. Organizations
63
and managers that hire new employees with DACA can then expect to see no
noticeable difference in how that employee and a U.S. citizen evaluates
themselves in terms of efficacy and esteem. If these are variables that are
important to the success or outcomes of a specific job or task, then legal status
should not be a factor in considering who would be best for the job or task.
Although ethnicity, gender, age, and other demographics may cause differences
in self-perceptions, if a manager is attempting to hire employees with high levels
of OSE or OBSE then legal status, as long as the person is legally able to work,
should not be taken into account.
Another finding that affects how employees are managed is the strong
predictive capability of PSS. In the citizen group, PSS was moderately correlated
with OSE and OBSE. In the DACA group, PSS was moderately correlated with
OBSE. Therefore, if a supervisor is aiming to increase their employee’s self-
efficacy or self-esteem at work, this reinforces the importance of supervisors
identifying and emphasizing similarities with their employees. These deep level
similarities can be established through mentorship programs or direct training
opportunities.
Lastly, if organizations are hiring employees with deferred action, they
should make sure to practice inclusive diversity management practices. For
instance, research including mostly Hispanics has shown that efforts to support
diversity can lessen the negative effects of perceived racial discrimination on
affective commitment (Triana, Garcia, & Colella, 2010). Other research has
64
shown that equality management systems that include diversity training, and
monitoring recruitment, pay, and promotion across minorities helps improve
organizational performance through increasing productivity, innovation, and
The present study aimed at discovering if differences in self-perceptions at
work existed between U.S. citizens and undocumented immigrants with deferred
action. Although equal levels of occupational self-efficacy, organization based
self-esteem and perceived supervisor similarity were found, deferred action
recipients exhibited higher levels of perceived employability. Other meaningful
findings included confirming the positive relationship of these self-perceptions at
work across two groups with different legal statuses, as well as discovering the
moderating effect that perceived supervisor similarity can have on perceived
employability and self-esteem/efficacy. The results of this study add to the limited
research on individuals with deferred action in the workplace as well as
contributes to the literature regarding self-perceptions at work and employability.
As the pros and cons of providing individuals with deferred action are continued
to be debated, research on the topic can serve to provide evidence that allows
people to make data driven decisions on the outcomes of this topic.
65
APPENDIX A
MEASURES
66
Demographics
Participants will be asked to indicate which responses most accurately reflect themselves through the following forced choice items. Gender:
Male Female Other Age: _____ years Ethnicity: Asian
African American White/Caucasian Middle Eastern American Indian Hispanic/Latino Other
Number of Years Working: ____
Legal Status:
Undocumented immigrant Undocumented with deferred action Permanent resident Naturalized citizen Natural born citizen
Income: ___________
(please enter your estimated annual income in USD by sliding the cursor)
67
Careless Response Checks
The following items will be interjected within each scale through the survey to check for careless responding. “Please respond with Strongly Agree if you are reading this item.” “Please respond with Strongly Disagree if you are reading this item.” “Please respond with Neutral if you are reading this item.”