Putnam California Tax Exempt Income Fund FUND SYMBOL CLASS A PCTEX Annual report 9 | 30 | 18 Income funds invest in bonds and other securities with the goal of providing a steady stream of income over time.
Transcript
Putnam California Tax Exempt Income Fund
FUND SYMBOL CLASS A
PCTEX
Annual report 9 | 30 | 18
Income funds invest in bonds and other securities with the goal of providing a steady stream of income over time.
Putnam California Tax Exempt Income FundAnnual report 9 | 30 | 18
Message from the Trustees 1
About the fund 2
Interview with your fund’s portfolio manager 5
Your fund’s performance 9
Your fund’s expenses 12
Terms and definitions 14
Other information for shareholders 15
Important notice regarding Putnam’s privacy policy 16
Trustee approval of management contract 17
Financial statements 21
Federal tax information 49
About the Trustees 50
Officers 52
Consider these risks before investing: Bond prices may fall or fail to rise over time for several reasons, including general financial market conditions, changing market perceptions (including perceptions about the risk of default and expectations about monetary policy or interest rates), changes in government inter-vention in the financial markets, and factors related to a specific issuer or industry. These and other factors may lead to increased volatility and reduced liquidity in the fund’s portfolio holdings. The fund’s performance will be closely tied to the economic and political conditions in California and can be more volatile than the performance of a more geographically diversified fund. To the extent investments in securities of issuers located outside of California are made, the fund may also be exposed to the risks of affecting other states. Certain provisions of the California Constitution and state statutes limit the taxing and spending authority of California’s government entities, which could impair the ability of California issuers to pay principal and/or interest on their obligations. Capital gains, if any, are taxed at the federal and, in most cases, state levels. For some investors, investment income may be subject to the federal alternative minimum tax. Bond investments are subject to interest-rate risk (the risk of bond prices falling if interest rates rise) and credit risk (the risk of an issuer defaulting on interest or principal payments). Interest-rate risk is greater for longer-term bonds, and credit risk is greater for below-investment-grade bonds. Unlike bonds, funds that invest in bonds have fees and expenses. Tax-exempt bonds may be issued under the Internal Revenue Code only by limited types of issuers for limited types of projects. As a result, the fund’s investments may be focused in certain market segments and be more vulnerable to fluc-tuations in the values of the securities it holds than a more broadly invested fund. Interest the fund receives might be taxable. You can lose money by investing in the fund.
November 7, 2018
Dear Fellow Shareholder:
Global financial markets met with increased challenges as we entered the final quarter of 2018. After rising to record highs in the summer, U.S. stocks declined in October as concerns mounted over rising interest rates and the escalating U.S.–China trade conflict. International stock markets, which had already been lagging, experienced selloffs as well. Fixed-income markets have also encountered headwinds as the Federal Reserve has continued its path of normalizing monetary policy. Against this backdrop, markets may remain choppy, despite a solid economy. Fortunately, navigating changing markets is nothing new to Putnam’s experienced investment professionals, who continue to monitor risks and seek opportunities.
We would like to take this opportunity to extend our thanks to Jameson A. Baxter, who retired from her position as Chair of your Board of Trustees on June 30, 2018. It is hard to express in a few words the extent of Jamie’s commitment to protecting the interests of Putnam shareholders like you. In addition to her professional and directorship experience, Jamie brought intelligence, insight, and compassion to a board she served for decades. Jamie began as a Trustee in 1994, served as Vice Chair for six years, and became Chair in 2011. We are also pleased to announce the appointment of Kenneth R. Leibler as your new Board of Trustees Chair. Ken became a Trustee in 2006, has served as Vice Chair since 2016, and now leads the Board in overseeing your fund and protecting your interests.
Thank you for investing with Putnam.
Respectfully yours,
Robert L. ReynoldsPresident and Chief Executive OfficerPutnam Investments
Kenneth R. LeiblerChair, Board of Trustees
Message from the Trustees
About the fund
Municipal bonds can play a key role in a tax-smart investment planThere’s an old adage in investing: “It’s not how much you make that matters, it’s how much you keep.” That’s particularly true when it comes to the fixed-income markets and the impact that taxes can have on your investment. The good news is that, unlike Treasuries or corporate bonds, the interest paid on municipal bonds is generally free from federal income taxes. Moreover, California residents generally pay no state income taxes on the distributions paid by municipal bonds issued in the Golden State. That can make municipal bonds particularly attractive to investors subject to higher personal income tax rates.
Putnam California Tax Exempt Income Fund offers an active, research-intensive investment approach.
Paul M. Drury, CFAPortfolio ManagerIndustry since 1989At Putnam since 1989
Garrett L. Hamilton, CFAPortfolio ManagerIndustry since 2006At Putnam since 2016
Tax benefits can make municipal bond income even more attractive
INDEX-BASED YIELDS AS OF 9/30/18 (annual after-tax income generated by a hypothetical $100,000 investment)
Source: Putnam, as of 9/30/18. Past performance is no guarantee of future results. Yields for Treasuries, investment-grade corporates, and municipal bonds are represented by the average “yield to worst” — a calculation of the lowest possible yield generated without defaulting — of the Bloomberg Barclays U.S. Treasury Index, the Bloomberg Barclays U.S. Credit Index, and the Bloomberg Barclays Municipal Bond Index, respectively. You cannot invest directly in an index. Bond investments are subject to interest-rate risk (the risk of bond prices falling if interest rates rise) and credit risk (the risk of an issuer defaulting on interest or principal payments). Interest-rate risk is greater for longer-term bonds, and credit risk is greater for below-investment-grade bonds. Income from municipal bonds may be subject to the alternative minimum tax. Taxable-equivalent yield and annual after-tax income are based on a 40.80% federal income tax rate. This rate reflects the Tax Cuts and Jobs Act of 2017 and includes the 3.80% Medicare surtax.
Defaults in the municipal bond market have been a relative rarity
FIVE-YEAR AVERAGE CUMULATIVE DEFAULT RATES, ALL RATED SECURITIES
0.09%
6.70%
Municipal bonds Global corporate bondsSource: Moody’s, U.S. Municipal Bond Defaults and Recoveries, 1970–2017 (June 2018). Most recent data available.
We focus on sector and security selection in managing the fund, seeking municipal bonds that offer a stable or positive credit trajectory.
California Tax Exempt Income Fund 3 2 California Tax Exempt Income Fund
Performance history as of 9/30/18
Annualized total return (%) comparison
LIFE OF FUND(since 4/29/83)
10 YEARS 5 YEARS 3 YEARS 1 YEAR
6.126.48 6.17
4.99 4.75 5.01
3.933.54
4.25
2.30 2.24 2.48
0.66 0.350.72
The fund — class A sharesbefore sales chargePutnam California Tax ExemptIncome Fund (PCTEX)
Fund’s benchmarkBloomberg BarclaysMunicipal Bond Index
Fund’s Lipper peer group averageCalifornia MunicipalDebt Funds
Current performance may be lower or higher than the quoted past performance, which cannot guarantee future results. Share price, principal value, and return will fluctuate, and you may have a gain or a loss when you sell your shares. Performance of class A shares assumes reinvestment of distributions and does not account for taxes. Fund returns in the bar chart do not reflect a sales charge of 4.00%; had they, returns would have been lower. See below and pages 9–11 for additional performance information. For a portion of the periods, the fund had expense limitations, without which returns would have been lower. To obtain the most recent month-end performance, visit putnam.com.
Recent broad market index and fund performance
17.91%
1.59%
0.66%
0.35%
–1.22%
U.S. stocks (S&P 500 Index)
Cash (ICE BofAML U.S. 3-Month Treasury Bill Index)
Putnam California Tax Exempt Income Fund (class A shares before sales charge)
Fund’s benchmark (Bloomberg Barclays Municipal Bond Index)
U.S. bonds (Bloomberg Barclays U.S. Aggregate Bond Index)
This comparison shows your fund’s performance in the context of broad market indexes for the 12 months ended 9/30/18. See above and pages 9–11 for additional fund performance information. Index descriptions can be found on pages 14–15.
4 California Tax Exempt Income Fund
Interview with your fund’s portfolio manager
Paul M. Drury, CFAPortfolio Manager
Paul holds a B.A. from Suffolk University. He has been in the investment industry since he joined Putnam in 1989.
In addition to Paul, your fund’s portfolio manager is Garrett L. Hamilton, CFA.
Paul, how was the market for municipal bonds during the reporting period?In an increasingly challenging market envi-ronment, municipal bonds netted slightly positive performance. While the Tax Cuts and Jobs Act enacted in December 2017 retained the tax-exempt status of municipal bonds and kept the highest individual tax rate nearly intact, it reduced the corporate income tax rate from 35% to 21%, making municipal bonds a less compelling investment for corporate buyers. Consequently, municipal assets held by banks declined $26.7 billion on a year-to-date basis through June 30, 2018. [Most recent data available.]
Additionally, with U.S. economic growth continuing to surprise to the upside, municipal bond yields moved higher in tandem with rising Treasury rates and expectations for higher interest rates. [Bond prices generally fall as rates rise.] During the course of the 12-month reporting period, the Federal Reserve raised its benchmark rate four times in December 2017 and in March, June, and September 2018 to help temper inflationary pressures arising from the stronger growth. At period-end, the federal funds rate stood at a target range of 2.00% to 2.25%.
Paul Drury discusses the investing environment and fund performance for the 12 months ended September 30, 2018, as well as his outlook for the municipal bond market in the months ahead.
Interview with your fund’s portfolio manager
Performance history as of 9/30/18
Annualized total return (%) comparison
LIFE OF FUND(since 4/29/83)
10 YEARS 5 YEARS 3 YEARS 1 YEAR
6.126.48 6.17
4.99 4.75 5.01
3.933.54
4.25
2.30 2.24 2.48
0.66 0.350.72
The fund — class A sharesbefore sales chargePutnam California Tax ExemptIncome Fund (PCTEX)
Fund’s benchmarkBloomberg BarclaysMunicipal Bond Index
Fund’s Lipper peer group averageCalifornia MunicipalDebt Funds
Current performance may be lower or higher than the quoted past performance, which cannot guarantee future results. Share price, principal value, and return will fluctuate, and you may have a gain or a loss when you sell your shares. Performance of class A shares assumes reinvestment of distributions and does not account for taxes. Fund returns in the bar chart do not reflect a sales charge of 4.00%; had they, returns would have been lower. See below and pages 9–11 for additional performance information. For a portion of the periods, the fund had expense limitations, without which returns would have been lower. To obtain the most recent month-end performance, visit putnam.com.
Recent broad market index and fund performance
17.91%
1.59%
0.66%
0.35%
–1.22%
U.S. stocks (S&P 500 Index)
Cash (ICE BofAML U.S. 3-Month Treasury Bill Index)
Putnam California Tax Exempt Income Fund (class A shares before sales charge)
Fund’s benchmark (Bloomberg Barclays Municipal Bond Index)
U.S. bonds (Bloomberg Barclays U.S. Aggregate Bond Index)
This comparison shows your fund’s performance in the context of broad market indexes for the 12 months ended 9/30/18. See above and pages 9–11 for additional fund performance information. Index descriptions can be found on pages 14–15.
California Tax Exempt Income Fund 5
Credit quality overview
AAA 8.2%
AA 48.9
A 25.9
BBB 9.5
BB 0.4
B 0.4
Not rated 5.0
Cash and net other assets 1.7
Credit qualities are shown as a percentage of the fund’s net assets as of 9/30/18. A bond rated BBB or higher (SP-3 or higher, for short-term debt) is considered investment grade. This chart reflects the highest security rating provided by one or more of Standard & Poor’s, Moody’s, and Fitch. Ratings may vary over time.
Cash and net other assets, if any, represent the market value weights of cash, derivatives, and short-term securities in the portfolio. The fund itself has not been rated by an independent rating agency.
Sector allocations
Local debt 19.5%
State debt 12.2
Transportation 10.9
Land 10.4
Utilities 10.0
Health care 9.3
Education 8.5
Prerefunded 7.3
Other sectors 10.2
Cash and net other assets 1.7
Allocations are shown as a percentage of the fund’s net assets as of 9/30/18. Cash and net other assets, if any, represent the market value weights of cash, derivatives, short-term securities, and other unclassified assets in the portfolio. Summary information may differ from the information in the portfolio schedule notes included in the financial statements due to the inclusion of derivative securities, any interest accruals, the use of different classifications of securities for presentation purposes, and rounding. Holdings and allocations may vary over time.
6 California Tax Exempt Income Fund
One positive factor counteracting these demand dynamics was the tax law’s elimination of a number of deductions, which made the tax-exempt status of municipal bonds more attractive to retail buyers, especially in high-tax states such as California and New York.
The municipal bond market also continued to adjust to fluctuating supply dynamics created by the tax law. With the legislation’s elimination of advanced refundings, new-issue supply fell. A refunding occurs when an issuer refinances a bond by issuing a second bond at a lower interest rate to pay off the original, older higher-yielding bond, thereby reducing interest cost. On a year-to-date basis, new municipal bond issuance totaled $247 billion, representing a 15% drop from the same period a year earlier, according to the Bond Buyer. A decline in available supply helps to support prices and provided a counterweight to weaker demand from banks.
Despite higher rates and the mixed supply/demand technicals, municipal bonds outper-formed the broader fixed-income markets for the period. The Bloomberg Barclays Municipal Bond Index [the benchmark] returned 0.35% for the reporting period, outperforming the broader fixed-income markets, which returned –1.22%, as measured by the Bloomberg Barclays U.S. Aggregate Bond Index. The ICE BofAML U.S. 3-Month Treasury Bill Index outperformed both these benchmarks with a return of 1.59% for the same period.
How did the fund perform during the reporting period?For the 12 months ended September 30, 2018, the fund outperformed its benchmark but underperformed the average return for its Lipper peer group, California Municipal Debt Funds. This result was due to the fund’s higher credit quality versus its peer universe.
What was your investment strategy in this environment?With the flattening of the yield curve, we saw better relative value in bonds with maturities of 15 to 20 years. As such, we favored an overweight position in bonds with longer intermediate
maturities while underweighting shorter intermediate and long maturity holdings. Consequently, the fund’s yield-curve positioning had more of a bulleted portfolio structure focused on the middle of the curve at period-end. This positioning resulted in an average maturity of approximately 15 years. Duration positioning, which affects the portfolio’s sensitivity to interest rates, moved from a generally neutral stance to being slightly short relative to the benchmark by the end of the period.
From a credit-quality standpoint, the fund held an overweight exposure to higher-quality bonds rated A and BBB. We continue to look for opportunities to move higher up on the credit quality spectrum. While municipal credit fundamentals remain stable, credit spreads remain at or near post-crisis lows. From a sector-positioning perspective, we continue to favor state- and local-backed debt, transporta-tion, and continuing-care retirement facilities bonds relative to the fund’s Lipper group.
The fund also continued to hold an underweight position in Puerto Rico-based issuers relative to its Lipper peers. In our view, Puerto Rico’s current economic and financial situations remain extremely difficult, especially after the cata-strophic damage inflicted by Hurricane Maria. The majority of Puerto Rico’s bonds are in default and are not currently making coupon payments. The eventual recovery value and economic return of investing in such debt will be deter-mined by the ongoing negotiations between the Commonwealth, the federal control board, and creditors, as well as the long-term economic growth of the Island. The uncertainty and vola-tility of these factors causes us to remain cautious and prefer an underweight position. That said, Puerto Rico bond prices have risen dramatically during 2018 to date as the market priced in the potential of higher recoveries.
Tax-exempt coupon income helps to partially offset price declines resulting from rising interest rates. Paul Drury
California Tax Exempt Income Fund 7
What is your near-term outlook for the municipal bond market?In its policy statement at its September 2018 meeting, the Fed cited strong economic growth and forecasted that the U.S. economy would see at least three more years of growth. As part of that communication, the Fed also eliminated the word “accommodative” from its comments about monetary policy and implied that three more rate hikes were likely in 2019.
With regard to our near-term outlook for interest rates over the next three to six months, we believe the Fed will introduce its fourth and final rate hike of 2018 in December. While we expect interest rates to follow a gradual path higher over the balance of the Fed’s hiking cycle, there may be short-term periods that feel more abrupt. It is our view that interest rates have reached levels where income return is
sufficient to more than offset our outlook for potential capital depreciation over the course of the Fed’s rate-hiking cycle. In other words, we still see value in the asset class, even in a rising-rate environment.
Thank you, Paul, for your time and insights today.
The views expressed in this report are exclusively those of Putnam Management and are subject to change. They are not meant as investment advice.
Please note that the holdings discussed in this report may not have been held by the fund for the entire period. Portfolio composition is subject to review in accordance with the fund’s investment strategy and may vary in the future. Current and future portfolio holdings are subject to risk. Statements in the Q&A concerning the fund’s performance or portfolio composition relative to those of the fund’s Lipper peer group may reference information produced by Lipper Inc. or through a third party.
Comparison of top sector weightings
17.2%19.5%
Local debtas of 3/31/18
as of 9/30/18
11.4%10.0%
Utilities
9.9%10.4%
Land
13.1%10.9%
Transportation
14.0%12.2%
State debt
This chart shows how the fund’s top weightings have changed over the past six months. Allocations are shown as a percentage of the fund’s net assets. Current period summary information may differ from the information in the portfolio schedule notes included in the financial statements due to the inclusion of derivative securities, any interest accruals, the use of different classifications of securities for presentation purposes, and rounding. Holdings and allocations may vary over time.
8 California Tax Exempt Income Fund
Your fund’s performanceThis section shows your fund’s performance, price, and distribution information for periods ended September 30, 2018, the end of its most recent fiscal year. In accordance with regulatory requirements for mutual funds, we also include expense information taken from the fund’s current prospectus. Performance should always be considered in light of a fund’s investment strategy. Data represent past performance. Past performance does not guarantee future results. More recent returns may be less or more than those shown. Investment return and principal value will fluctuate, and you may have a gain or a loss when you sell your shares. Performance information does not reflect any deduction for taxes a shareholder may owe on fund distributions or on the redemption of fund shares. For the most recent month-end performance, please visit the Individual Investors section at putnam.com or call Putnam at 1-800-225-1581. Class R6 and Y shares are not available to all investors. See the Terms and definitions section in this report for definitions of the share classes offered by your fund.
Fund performance Total return for periods ended 9/30/18
Net asset value 6.20 66.25 5.21 22.44 4.13 7.70 2.50 0.84
Class Y (1/2/08)
Net asset value 6.20 66.30 5.22 22.48 4.14 7.73 2.51 0.87
Current performance may be lower or higher than the quoted past performance, which cannot guarantee future results. After-sales-charge returns for class A and M shares reflect the deduction of the maximum 4.00% and 3.25% sales charge, respectively, levied at the time of purchase. Class B share returns after contingent deferred sales charge (CDSC) reflect the applicable CDSC, which is 5% in the first year, declining over time to 1% in the sixth year, and is eliminated thereafter. Class C share returns after CDSC reflect a 1% CDSC for the first year that is eliminated thereafter. Class Y shares have no initial sales charge or CDSC. Performance for class B, C, M, and Y shares before their inception is derived from the historical performance of class A shares, adjusted for the applicable sales charge (or CDSC) and the higher operating expenses for such shares, except for class Y shares, for which 12b-1 fees are not applicable. Performance for class R6 shares prior to their inception is derived from the historical performance of class Y shares and has not been adjusted for the lower investor servicing fees applicable to class R6 shares; had it, returns would have been higher.
For a portion of the periods, the fund had expense limitations, without which returns would have been lower.
Class B share performance reflects conversion to class A shares after eight years.
Class C share performance reflects conversion to class A shares after 10 years.
California Tax Exempt Income Fund 9
Comparative index returns For periods ended 9/30/18
Annual average
(life of fund) 10 yearsAnnual average 5 years
Annual average 3 years
Annual average 1 year
Bloomberg Barclays Municipal Bond Index 6.48% 59.11% 4.75% 18.99% 3.54% 6.87% 2.24% 0.35%
Lipper California Municipal Debt Funds category average*
6.17 63.41 5.01 23.22 4.25 7.64 2.48 0.72
Index and Lipper results should be compared with fund performance before sales charge, before CDSC, or at net asset value.
* Over the 1-year, 3-year, 5-year, 10-year, and life-of-fund periods ended 9/30/18, there were 123, 106, 101, 84, and 3 funds, respectively, in this Lipper category.
Change in the value of a $10,000 investment ($9,600 after sales charge)Cumulative total return from 9/30/08 to 9/30/18
Past performance does not indicate future results. At the end of the same time period, a $10,000 investment in the fund’s class B and C shares would have been valued at $15,468 and $15,050, respectively, and no contingent deferred sales charges would apply. A $10,000 investment in the fund’s class M shares ($9,675 after sales charge) would have been valued at $15,312. A $10,000 investment in the fund’s class R6 and Y shares would have been valued at $16,625 and $16,630, respectively.
$5,000
$10,000
$15,000
’08 ’09 ’10 ’11 ’12 ’13 ’14 ’15 ’16 ’17 ’18
Putnam California Tax Exempt Income Fund class A shares a�er sales charge
Bloomberg Barclays Municipal Bond Index
$9,600
$15,618
$15,911
10 California Tax Exempt Income Fund
Fund price and distribution information For the 12-month period ended 9/30/18
Distributions Class A Class B Class C Class M Class R 6 Class Y
Number 12 12 12 12 5 12
Income 1 $0.243171 $0.192309 $0.179529 $0.219834 $0.088881 $0.260416
Capital gains 2 — — — — —
Total $0.243171 $0.192309 $0.179529 $0.219834 $0.088881 $0.260416
The classification of distributions, if any, is an estimate. Before-sales-charge share value and current dividend rate for class A and M shares, if applicable, do not take into account any sales charge levied at the time of purchase. After-sales-charge share value, current dividend rate, and current 30-day SEC yield, if applicable, are calculated assuming that the maximum sales charge (4.00% for class A shares and 3.25% for class M shares) was levied at the time of purchase. Final distribution information will appear on your year-end tax forms.
* Inception date of class R6 shares. 1 For some investors, investment income may be subject to the federal alternative minimum tax. 2 Capital gains, if any, are taxable for federal and, in most cases, state purposes. 3 Most recent distribution, including any return of capital and excluding capital gains, annualized and divided by share
price before or after sales charge at period-end. 4 Assumes maximum 54.10% federal and state combined tax rate for 2018. Results for investors subject to lower tax
rates would not be as advantageous. 5 Based only on investment income and calculated using the maximum offering price for each share class, in
accordance with SEC guidelines.
California Tax Exempt Income Fund 11
Your fund’s expensesAs a mutual fund investor, you pay ongoing expenses, such as management fees, distribution fees (12b-1 fees), and other expenses. Using the following information, you can estimate how these expenses affect your investment and compare them with the expenses of other funds. You may also pay one-time transaction expenses, including sales charges (loads) and redemption fees, which are not shown in this section and would have resulted in higher total expenses. For more information, see your fund’s prospectus or talk to your financial representative.
Expense ratiosClass A Class B Class C Class M Class R6 Class Y
Total annual operating expenses for the fiscal year ended 9/30/17 0.74% 1.37% 1.52% 1.02% 0.52%* 0.52%
Annualized expense ratio for the six-month period ended 9/30/18† 0.74% 1.37% 1.52% 1.02% 0.52% 0.52%
Fiscal-year expense information in this table is taken from the most recent prospectus, is subject to change, and may differ from that shown for the annualized expense ratio and in the financial highlights of this report.
Expenses are shown as a percentage of average net assets. * Other expenses are based on expenses of class A shares for the fund’s last fiscal year, restated to reflect the lower
investor servicing fees applicable to class R6 shares. † Expense ratios for each class are for the fund’s most recent fiscal half year. As a result of this, ratios may differ from
expense ratios based on one-year data in the financial highlights.
Expenses per $1,000The following table shows the expenses you would have paid on a $1,000 investment in each class of the fund from 4/1/18 to 9/30/18. It also shows how much a $1,000 investment would be worth at the close of the period, assuming actual returns and expenses.
Class A Class B Class C Class M Class R6 Class Y
Expenses paid per $1,000*† $3.72 $6.88 $7.63 $5.12 $1.89‡ $2.62
Ending value (after expenses) $1,005.50 $1,002.40 $1,001.60 $1,004.10 $1,006.10 $1,006.60
* Expenses for each share class are calculated using the fund’s annualized expense ratio for each class, which represents the ongoing expenses as a percentage of average net assets for the six months ended 9/30/18. The expense ratio may differ for each share class.
† Expenses are calculated by multiplying the expense ratio by the average account value for the period; then multiplying the result by the number of days in the period; and then dividing that result by the number of days in the year.
‡ Had expenses for shares of any new class been shown for the entire period from 3/1/18 to 9/30/18, they would have been higher.
12 California Tax Exempt Income Fund
Estimate the expenses you paidTo estimate the ongoing expenses you paid for the six months ended 9/30/18, use the following calculation method. To find the value of your investment on 4/1/18, call Putnam at 1-800-225-1581.
How to calculate the expenses you paid
Value of your investment on 4/1/18 ÷ $1,000 x Expenses paid per $1,000 = Total expenses paid
Example Based on a $10,000 investment in class A shares of your fund.
$10,000 ÷ $1,000 x $3.72 (see preceding table) = $37.20
Compare expenses using the SEC’s methodThe Securities and Exchange Commission (SEC) has established guidelines to help investors assess fund expenses. Per these guidelines, the following table shows your fund’s expenses based on a $1,000 investment, assuming a hypothetical 5% annualized return. You can use this information to compare the ongoing expenses (but not transaction expenses or total costs) of investing in the fund with those of other funds. All mutual fund shareholder reports will provide this information to help you make this comparison. Please note that you cannot use this information to estimate your actual ending account balance and expenses paid during the period.
Class A Class B Class C Class M Class R6 Class Y
Expenses paid per $1,000*† $3.75 $6.93 $7.69 $5.16 $2.64 $2.64
Ending value (after expenses) $1,021.36 $1,018.20 $1,017.45 $1,019.95 $1,022.46 $1,022.46
* Expenses for each share class are calculated using the fund’s annualized expense ratio for each class, which represents the ongoing expenses as a percentage of average net assets for the six months ended 9/30/18. The expense ratio may differ for each share class.
† Expenses are calculated by multiplying the expense ratio by the average account value for the six-month period; then multiplying the result by the number of days in the six-month period; and then dividing that result by the number of days in the year.
California Tax Exempt Income Fund 13
Terms and definitions
Important termsTotal return shows how the value of the fund’s shares changed over time, assuming you held the shares through the entire period and reinvested all distributions in the fund.
Before sales charge, or net asset value, is the price, or value, of one share of a mutual fund, without a sales charge. Before-sales-charge figures fluctuate with market conditions, and are calculated by dividing the net assets of each class of shares by the number of outstanding shares in the class.
After sales charge is the price of a mutual fund share plus the maximum sales charge levied at the time of purchase. After-sales-charge perfor-mance figures shown here assume the 4.00% maximum sales charge for class A shares and 3.25% for class M shares.
Contingent deferred sales charge (CDSC) is generally a charge applied at the time of the redemption of class B or C shares and assumes redemption at the end of the period. Your fund’s class B CDSC declines over time from a 5% maximum during the first year to 1% during the sixth year. After the sixth year, the CDSC no longer applies. The CDSC for class C shares is 1% for one year after purchase.
Share classesClass A shares are generally subject to an initial sales charge and no CDSC (except on certain redemptions of shares bought without an initial sales charge).
Class B shares are closed to new investments and are only available by exchange from another Putnam fund or through dividend and/or capital gains reinvestment. They are not subject to an initial sales charge and may be subject to a CDSC.
Class C shares are not subject to an initial sales charge and are subject to a CDSC only if the shares are redeemed during the first year.
Class M shares have a lower initial sales charge and a higher 12b-1 fee than class A shares and no CDSC.
Class R6 shares are not subject to an initial sales charge or CDSC and carry no 12b-1 fee. They are generally only available to employer-sponsored retirement plans, corporate and institutional clients, and clients in other approved programs.
Class Y shares are not subject to an initial sales charge or CDSC and carry no 12b-1 fee. They are generally only available to corporate and institutional clients and clients in other approved programs.
Fixed-income termsCurrent rate is the annual rate of return earned from dividends or interest of an investment. Current rate is expressed as a percentage of the price of a security, fund share, or principal investment.
Yield curve is a graph that plots the yields of bonds with equal credit quality against their differing maturity dates, ranging from shortest to longest. It is used as a benchmark for other debt, such as mortgage or bank lending rates.
Comparative indexesBloomberg Barclays Municipal Bond Index is an unmanaged index of long-term fixed-rate investment-grade tax-exempt bonds.
Bloomberg Barclays U.S. Aggregate Bond Index is an unmanaged index of U.S. investment-grade fixed-income securities.
ICE BofAML (Intercontinental Exchange Bank of America Merrill Lynch) U.S. 3-Month Treasury Bill Index is an unmanaged index that seeks to measure the performance of U.S. Treasury bills available in the marketplace.
S&P 500 Index is an unmanaged index of common stock performance.
14 California Tax Exempt Income Fund
ICE Data Indices, LLC (“ICE BofAML”), used with permis-sion. ICE BofAML permits use of the ICE BofAML indices and related data on an “as is” basis; makes no warran-ties regarding same; does not guarantee the suitability, quality, accuracy, timeliness, and/or completeness of the ICE BofAML indices or any data included in, related to, or derived therefrom; assumes no liability in connec-tion with the use of the foregoing; and does not sponsor, endorse, or recommend Putnam Investments, or any of its products or services.
Indexes assume reinvestment of all distributions and do not account for fees. Securities and performance of a fund and an index will differ. You cannot invest directly in an index.
Lipper is a third-party industry-ranking entity that ranks mutual funds. Its rankings do not reflect sales charges. Lipper rankings are based on total return at net asset value relative to other funds that have similar current invest-ment styles or objectives as determined by Lipper. Lipper may change a fund’s category assignment at its discretion. Lipper category averages reflect performance trends for funds within a category.
Other information for shareholders
Proxy votingPutnam is committed to managing our mutual funds in the best interests of our shareholders. The Putnam funds’ proxy voting guidelines and procedures, as well as information regarding how your fund voted proxies relating to portfolio securities during the 12-month period ended June 30, 2018, are available in the Individual Investors section of putnam.com and on the Securities and Exchange Commis-sion (SEC) website, www.sec.gov. If you have questions about finding forms on the SEC’s website, you may call the SEC at 1-800-SEC-0330. You may also obtain the Putnam funds’ proxy voting guidelines and procedures at no charge by calling Putnam’s Shareholder Services at 1-800-225-1581.
Fund portfolio holdingsThe fund will file a complete schedule of its portfolio holdings with the SEC for the first and
third quarters of each fiscal year on Form N-Q. Shareholders may obtain the fund’s Form N-Q on the SEC’s website at www.sec.gov. In addition, the fund’s Form N-Q may be reviewed and copied at the SEC’s Public Reference Room in Washington, D.C. You may call the SEC at 1-800-SEC-0330 for information about the SEC’s website or the operation of the Public Reference Room.
Trustee and employee fund ownershipPutnam employees and members of the Board of Trustees place their faith, confidence, and, most importantly, investment dollars in Putnam mutual funds. As of September 30, 2018, Putnam employees had approximately $508,000,000 and the Trustees had approxi-mately $69,000,000 invested in Putnam mutual funds. These amounts include investments by the Trustees’ and employees’ immediate family members as well as investments through retirement and deferred compensation plans.
California Tax Exempt Income Fund 15
Important notice regarding Putnam’s privacy policy
In order to conduct business with our shareholders, we must obtain certain personal information such as account holders’ names, addresses, Social Security numbers, and dates of birth. Using this information, we are able to maintain accurate records of accounts and transactions.
It is our policy to protect the confidentiality of our shareholder information, whether or not a shareholder currently owns shares of our funds. In particular, it is our policy not to sell information about you or your accounts to outside marketing firms. We have safeguards in place designed to prevent unauthorized access
to our computer systems and procedures to protect personal information from unauthorized use.
Under certain circumstances, we must share account information with outside vendors who provide services to us, such as mailings and proxy solicitations. In these cases, the service providers enter into confidentiality agreements with us, and we provide only the information necessary to process transactions and perform other services related to your account. Finally, it is our policy to share account information with your financial representative, if you’ve listed one on your Putnam account.
16 California Tax Exempt Income Fund
Trustee approval of management contract
Trustee approval of management contract
General conclusionsThe Board of Trustees of The Putnam Funds oversees the management of each fund and, as required by law, determines annually whether to approve the continuance of your fund’s management contract with Putnam Investment Management, LLC (“Putnam Management”) and the sub-management contract with respect to your fund between Putnam Management and its affiliate, Putnam Investments Limited (“PIL”). The Board, with the assistance of its Contract Commit-tee, requests and evaluates all information it deems reasonably necessary under the circum-stances in connection with its annual contract review. The Contract Committee consists solely of Trustees who are not “interested persons” (as this term is defined in the Investment Company Act of 1940, as amended (the “1940 Act”)) of The Putnam Funds (“Independent Trustees”).
At the outset of the review process, members of the Board’s independent staff and independent legal counsel discussed with representatives of Putnam Management the annual contract review materials furnished to the Contract Committee during the course of the previous year’s review, identifying possible changes in these materi-als that might be necessary or desirable for the coming year. Following these discussions and in consultation with the Contract Committee, the Independent Trustees’ independent legal counsel requested that Putnam Management and its affiliates furnish specified information, together with any additional information that Putnam Management considered relevant, to the Contract Committee. Over the course of several months ending in June 2018, the Contract Committee met on a number of occasions with representatives of Putnam Management, and separately in executive session, to consider the information that Putnam Management provided. Throughout this process, the Contract Committee was assisted by the members of the Board’s independent staff and by independent legal counsel for The Putnam Funds and the Independent Trustees.
In May 2018, the Contract Committee met in executive session to discuss and consider its recommendations with respect to the contin-uance of the contracts. At the Trustees’ June 2018 meeting, the Contract Committee met in executive session with the other Independent Trustees to review a summary of the key financial,
performance and other data that the Contract Committee considered in the course of its review. The Contract Committee then presented its written report, which summarized the key factors that the Committee had considered and set forth its recommendations. The Contract Committee recommended, and the Independent Trustees approved, the continuance of your fund’s manage-ment and sub-management contracts, effective July 1, 2018. (Because PIL is an affiliate of Putnam Management and Putnam Management remains fully responsible for all services provided by PIL, the Trustees have not attempted to evaluate PIL as a separate entity, and all subsequent refer-ences to Putnam Management below should be deemed to include reference to PIL as necessary or appropriate in the context.)
The Independent Trustees’ approval was based on the following conclusions:
• That the fee schedule in effect for your fund repre-sented reasonable compensation in light of the nature and quality of the services being provided to the fund, the fees paid by competitive funds, the costs incurred by Putnam Management in providing services to the fund, and the appli-cation of certain reductions and waivers noted below; and
• That the fee schedule in effect for your fund represented an appropriate sharing between fund shareholders and Putnam Management of such economies of scale as may exist in the management of the fund at current asset levels.
These conclusions were based on a comprehen-sive consideration of all information provided to the Trustees and were not the result of any single factor. Some of the factors that figured particu-larly in the Trustees’ deliberations and how the Trustees considered these factors are described below, although individual Trustees may have evaluated the information presented differently, giving different weights to various factors. It is also important to recognize that the management arrangements for your fund and the other Putnam funds are the result of many years of review and discussion between the Independent Trustees and Putnam Management, that some aspects of the arrangements may receive greater scrutiny in some years than others, and that the Trust-ees’ conclusions may be based, in part, on their consideration of fee arrangements in previous
California Tax Exempt Income Fund 17
years. For example, with some minor exceptions, the funds’ current fee arrangements under the management contracts were first implemented at the beginning of 2010 following extensive review by the Contract Committee and discussions with representatives of Putnam Management, as well as approval by shareholders.
Management fee schedules and total expensesThe Trustees reviewed the management fee schedules in effect for all Putnam funds, includ-ing fee levels and breakpoints. The Trustees also reviewed the total expenses of each Putnam fund, recognizing that in most cases management fees represented the major, but not the sole, deter-minant of total costs to fund shareholders. (In a few instances, funds have implemented so-called “all-in” management fees covering substantially all routine fund operating costs.)
In reviewing fees and expenses, the Trustees generally focus their attention on material changes in circumstances — for example, changes in assets under management, changes in a fund’s investment strategy, changes in Putnam Management’s operating costs or profitability, or changes in competitive practices in the mutual fund industry — that suggest that consideration of fee changes might be warranted. The Trustees concluded that the circumstances did not indicate that changes to the management fee structure for your fund would be appropriate at this time.
Under its management contract, your fund has the benefit of breakpoints in its management fee schedule that provide shareholders with econo-mies of scale in the form of reduced fee rates as assets under management in the Putnam family of funds increase. The Trustees concluded that the fee schedule in effect for your fund represented an appropriate sharing of econo-mies of scale between fund shareholders and Putnam Management.
As in the past, the Trustees also focused on the competitiveness of each fund’s total expense ratio. In order to support the effort to have fund expenses meet competitive standards, the Trust-ees and Putnam Management have implemented expense limitations that were in effect during your fund’s fiscal year ending in 2017. These expense limitations were: (i) a contractual expense limitation applicable to all open-end funds of 25 basis points on investor servicing fees and expenses and (ii) a contractual expense limitation
applicable to specified open-end funds, including your fund, of 20 basis points on so-called “other expenses” (i.e., all expenses exclusive of manage-ment fees, distribution fees, investor servicing fees, investment-related expenses, interest, taxes, brokerage commissions, acquired fund fees and expenses and extraordinary expenses). These expense limitations attempt to maintain competitive expense levels for the funds. Most funds, including your fund, had sufficiently low expenses that these expense limitations were not operative during their fiscal years ending in 2017. Putnam Management has agreed to maintain these expense limitations until at least January 30, 2020. Putnam Management’s support for these expense limitation arrangements was an import-ant factor in the Trustees’ decision to approve the continuance of your fund’s management and sub-management contracts.
The Trustees reviewed comparative fee and expense information for a custom group of competitive funds selected by Broadridge Financial Solutions, Inc. (“Broadridge”). This comparative information included your fund’s percentile ranking for effective management fees and total expenses (excluding any applicable 12b-1 fee), which provides a general indication of your fund’s relative standing. In the custom peer group, your fund ranked in the first quintile in effective management fees (determined for your fund and the other funds in the custom peer group based on fund asset size and the applicable contractual management fee schedule) and in the first quintile in total expenses (excluding any appli-cable 12b-1 fees) as of December 31, 2017. The first quintile represents the least expensive funds and the fifth quintile the most expensive funds. The fee and expense data reported by Broadridge as of December 31, 2017 reflected the most recent fiscal year-end data available in Broadridge’s database at that time.
In connection with their review of fund manage-ment fees and total expenses, the Trustees also reviewed the costs of the services provided and the profits realized by Putnam Management and its affiliates from their contractual relationships with the funds. This information included trends in revenues, expenses and profitability of Putnam Management and its affiliates relating to the investment management, investor servicing and distribution services provided to the funds. In this regard, the Trustees also reviewed an analysis of Putnam Management’s revenues, expenses and profitability, allocated on a fund-by-fund basis,
18 California Tax Exempt Income Fund
with respect to the funds’ management, distribu-tion, and investor servicing contracts. For each fund, the analysis presented information about revenues, expenses and profitability for each of the agreements separately and for the agree-ments taken together on a combined basis. The Trustees concluded that, at current asset levels, the fee schedules in place represented reasonable compensation for the services being provided and represented an appropriate sharing between fund shareholders and Putnam Management of such economies of scale as may exist in the management of the Putnam funds at that time.
The information examined by the Trustees in connection with their annual contract review for the Putnam funds included information regard-ing fees charged by Putnam Management and its affiliates to institutional clients, including defined benefit pension and profit-sharing plans and sub-advised mutual funds. This information included, in cases where an institutional product’s investment strategy corresponds with a fund’s strategy, comparisons of those fees with fees charged to the Putnam funds, as well as an assess-ment of the differences in the services provided to these different types of clients as compared to the services provided to the Putnam funds. The Trustees observed that the differences in fee rates between these clients and the Putnam funds are by no means uniform when examined by individual asset sectors, suggesting that differ-ences in the pricing of investment management services to these types of clients may reflect, among other things, historical competitive forces operating in separate markets. The Trust-ees considered the fact that in many cases fee rates across different asset classes are higher on average for mutual funds than for institutional clients, as well as the differences between the services that Putnam Management provides to the Putnam funds and those that it provides to its other clients. The Trustees did not rely on these comparisons to any significant extent in conclud-ing that the management fees paid by your fund are reasonable.
Investment performanceThe quality of the investment process provided by Putnam Management represented a major factor in the Trustees’ evaluation of the quality of services provided by Putnam Management under your fund’s management contract. The Trustees were assisted in their review of the Putnam funds’ investment process and performance by the work
of the investment oversight committees of the Trustees and the full Board of Trustees, which meet on a regular basis with the funds’ portfolio teams and with the Chief Investment Officers and other senior members of Putnam Management’s Investment Division throughout the year. The Trustees concluded that Putnam Management generally provides a high-quality investment process — based on the experience and skills of the individuals assigned to the management of fund portfolios, the resources made available to them, and in general Putnam Manage-ment’s ability to attract and retain high-quality personnel — but also recognized that this does not guarantee favorable investment results for every fund in every time period.
The Trustees considered that 2017 was a strong year for the performance of the Putnam funds, with generally favorable results for most asset classes, including U.S. equity, international and global equity, taxable and tax exempt fixed income, and global asset allocation Funds. In this regard, the Trustees considered that, for the one-year period ended December 31, 2017, the Putnam open-end Funds’ performance, on an asset-weighted basis, ranked in the 32nd percentile of their Lipper peers (excluding those Putnam funds that are evaluated based on their total returns and/or comparisons of those returns versus selected investment benchmarks or targeted annual returns). The Trustees observed that this strong performance has continued a positive trend that began in mid-year 2016 across most Putnam funds. They noted that the longer-term performance of the Putnam funds continued to be strong, exemplified by the fact that the Putnam funds were ranked by the Barron’s/Lipper Fund Families survey as the 7th-best performing mutual fund complex out of 55 complexes for the five-year period ended December 31, 2017 and the 9th-best performing mutual fund complex out of 50 complexes for the ten-year period ended 2017. In addition, the survey ranked the Putnam funds 7th out of 59 mutual fund complexes for the one-year period ended 2017; the Putnam funds have ranked 1st or 2nd in the survey for the one-year period three times since 2009 (most recently in 2013). They also noted, however, the disappointing investment performance of some funds for periods ended December 31, 2017 and considered information provided by Putnam Management regarding the factors contributing to the underperformance and actions being taken to improve the performance
California Tax Exempt Income Fund 19
of these particular funds. The Trustees indicated their intention to continue to monitor closely the performance of those funds, including the effec-tiveness of any efforts Putnam Management has undertaken to address underperformance and whether additional actions to address areas of underperformance are warranted.
For purposes of the Trustees’ evaluation of the Putnam Funds’ investment performance, the Trustees generally focus on a competitive indus-try ranking of each fund’s total net return over a one-year, three-year and five-year period. For a number of Putnam funds with relatively unique investment mandates for which Putnam Manage-ment informed the Trustees that meaningful competitive performance rankings are not consid-ered to be available, the Trustees evaluated performance based on their total gross and net returns and, in most cases, comparisons of those returns with the returns of selected investment benchmarks. In the case of your fund, the Trustees considered that its class A share cumulative total return performance at net asset value was in the following quartiles of its Lipper Inc. (“Lipper”) peer group (Lipper California Municipal Debt Funds) for the one-year, three-year and five-year periods ended December 31, 2017 (the first quartile repre-senting the best-performing funds and the fourth quartile the worst-performing funds):
One-year period 2ndThree-year period 3rdFive-year period 3rd
Over the one-year, three-year and five-year periods ended December 31, 2017, there were 115, 108 and 96 funds, respectively, in your fund’s Lipper peer group. (When considering perfor-mance information, shareholders should be mindful that past performance is not a guarantee of future results.)
The Trustees considered Putnam Management’s continued efforts to support fund performance through initiatives including structuring compen-sation for portfolio managers and research analysts to enhance accountability for fund performance, emphasizing accountability in the portfolio management process, and affirming its commitment to a fundamental-driven approach to investing. The Trustees noted further that Putnam Management continued to strengthen its fundamental research capabilities by adding new investment personnel.
Brokerage and soft-dollar allocations; investor servicingThe Trustees considered various potential benefits that Putnam Management may receive in connection with the services it provides under the management contract with your fund. These include benefits related to brokerage allocation and the use of soft dollars, whereby a portion of the commissions paid by a fund for brokerage may be used to acquire research services that are expected to be useful to Putnam Management in managing the assets of the fund and of other clients. Subject to policies established by the Trustees, soft dollars generated by these means are used predominantly to acquire brokerage and research services (including third-party research and market data) that enhance Putnam Manage-ment’s investment capabilities and supplement Putnam Management’s internal research efforts. However, the Trustees noted that a portion of available soft dollars continues to be used to pay fund expenses. The Trustees indicated their continued intent to monitor regulatory and indus-try developments in this area with the assistance of their Brokerage Committee. The Trustees also indicated their continued intent to monitor the allocation of the Putnam funds’ brokerage in order to ensure that the principle of seeking best price and execution remains paramount in the portfolio trading process.
Putnam Management may also receive benefits from payments that the funds make to Putnam Management’s affiliates for investor or distribution services. In conjunction with the annual review of your fund’s management and sub-management contracts, the Trustees reviewed your fund’s investor servicing agreement with Putnam Inves-tor Services, Inc. (“PSERV”) and its distributor’s contracts and distribution plans with Putnam Retail Management Limited Partnership (“PRM”), both of which are affiliates of Putnam Manage-ment. The Trustees concluded that the fees payable by the funds to PSERV and PRM, as appli-cable, for such services are fair and reasonable in relation to the nature and quality of such services, the fees paid by competitive funds, and the costs incurred by PSERV and PRM, as applicable, in providing such services. Furthermore, the Trust-ees were of the view that the services provided were required for the operation of the funds, and that they were of a quality at least equal to those provided by other providers.
20 California Tax Exempt Income Fund
Financial statements
California Tax Exempt Income Fund 21
Financial statements
These sections of the report, as well as the accompanying Notes, preceded by the Report of Independent Registered Public Accounting Firm, constitute the fund’s financial statements.
The fund’s portfolio lists all the fund’s invest-ments and their values as of the last day of the reporting period. Holdings are organized by asset type and industry sector, country, or state to show areas of concentration and diversification.
Statement of assets and liabilities shows how the fund’s net assets and share price are determined. All investment and non-investment assets are added together. Any unpaid expenses and other liabilities are subtracted from this total. The result is divided by the number of shares to determine the net asset value per share, which is calculated separately for each class of shares. (For funds with preferred shares, the amount subtracted from total assets includes the liquidation preference of preferred shares.)
Statement of operations shows the fund’s net investment gain or loss. This is done by first adding up all the fund’s earnings — from dividends and interest income — and subtracting its operating expenses to determine net investment income (or
loss). Then, any net gain or loss the fund realized on the sales of its holdings — as well as any unreal-ized gains or losses over the period — is added to or subtracted from the net investment result to determine the fund’s net gain or loss for the fiscal year.
Statement of changes in net assets shows how the fund’s net assets were affected by the fund’s net investment gain or loss, by distributions to shareholders, and by changes in the number of the fund’s shares. It lists distributions and their sources (net investment income or realized capital gains) over the current reporting period and the most recent fiscal year-end. The distributions listed here may not match the sources listed in the Statement of operations because the distributions are deter-mined on a tax basis and may be paid in a different period from the one in which they were earned.
Financial highlights provide an overview of the fund’s investment results, per-share distributions, expense ratios, net investment income ratios, and portfolio turnover in one summary table, reflecting the five most recent reporting periods. In a semiannual report, the highlights table also includes the current reporting period.
Report of Independent Registered Public Accounting Firm
The Board of Trustees and Shareholders Putnam California Tax Exempt Income Fund:
Opinion on the Financial Statements
We have audited the accompanying statement of assets and liabilities of Putnam California Tax Exempt Income Fund (the “fund”), including the fund’s portfolio, as of September 30, 2018, and the related statement of operations for the year then ended, the statements of changes in net assets for each of the years in the two-year period then ended, and the related notes (collectively, the “financial statements”) and the financial highlights for each of the years or periods in the five-year period then ended. In our opinion, the financial statements and financial highlights present fairly, in all material respects, the financial position of the fund as of September 30, 2018, and the results of its operations for the year then ended, the changes in its net assets for each of the years in the two-year period then ended, and the financial highlights for each of the years or periods in the five-year period then ended, in conformity with U.S. generally accepted accounting principles.
Basis for Opinion
These financial statements and financial highlights are the responsibility of the fund’s management. Our responsibility is to express an opinion on these financial statements and financial highlights based on our audits. We are a public accounting firm registered with the Public Company Accounting Oversight Board (United States) (“PCAOB”) and are required to be independent with respect to the fund in accordance with the U.S. federal securities laws and the applicable rules and regulations of the Securities and Exchange Commission and the PCAOB.
We conducted our audits in accordance with the standards of the PCAOB. Those standards require that we plan and perform the audit to obtain reasonable assurance about whether the financial statements and financial highlights are free of material misstatement, whether due to error or fraud. Our audits included performing procedures to assess the risks of material misstatement of the financial statements and financial highlights, whether due to error or fraud, and performing procedures that respond to those risks. Such procedures included examining, on a test basis, evidence regarding the amounts and disclosures in the financial statements and financial highlights. Such procedures included confirmation of securities owned as of September 30, 2018, by correspondence with the custodian and brokers or by other appropriate auditing procedures. Our audits also included evaluating the accounting principles used and significant estimates made by management, as well as evaluating the overall presentation of the financial statements and financial highlights. We believe that our audits provide a reasonable basis for our opinion.
We have served as the auditor of one or more Putnam investment companies since 1999.
Boston, Massachusetts November 7, 2018
22 California Tax Exempt Income Fund
California Tax Exempt Income Fund 23
Key to holding’s abbreviationsABAG Association Of Bay Area Governments
AGC Assured Guaranty Corp.
AGM Assured Guaranty Municipal Corporation
AMBAC AMBAC Indemnity Corporation
BAM Build America Mutual
COP Certificates of Participation
FCS Farm Credit System
FGIC Financial Guaranty Insurance Company
FHL Banks Coll. Federal Home Loan Banks System Collateralized
FNMA Coll. Federal National Mortgage Association Collateralized
FRN Floating Rate Notes: the rate shown is the current interest rate or yield at the close of the reporting period. Rates may be subject to a cap or floor. For certain securities, the rate may represent a fixed rate currently in place at the close of the reporting period.
G.O. Bonds General Obligation Bonds
NATL National Public Finance Guarantee Corp.
U.S. Govt. Coll. U.S. Government Collateralized
VRDN Variable Rate Demand Notes, which are floating-rate securities with long-term maturities that carry coupons that reset and are payable upon demand either daily, weekly or monthly. The rate shown is the current interest rate at the close of the reporting period. Rates are set by remarketing agents and may take into consideration market supply and demand, credit quality and the current SIFMA Municipal Swap Index rate, which was 1.56% as of the close of the reporting period.
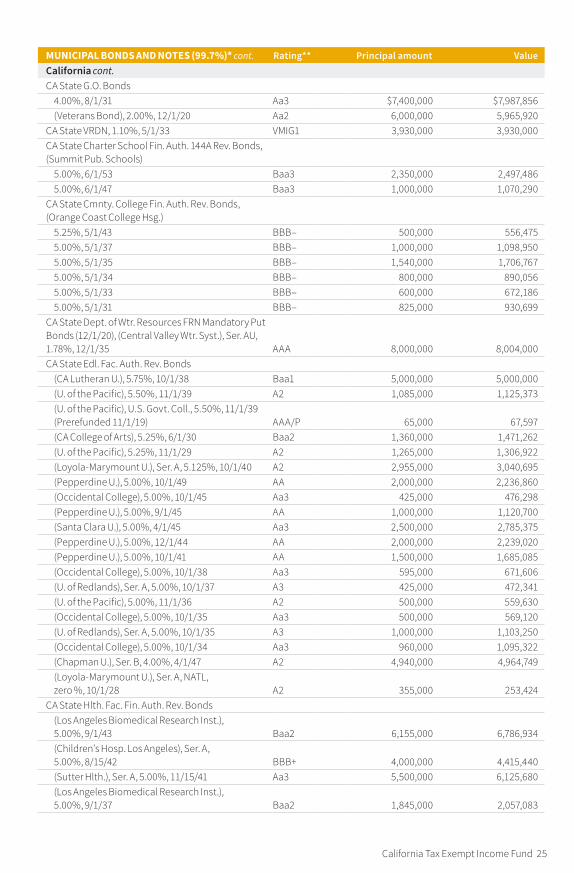
MUNICIPAL BONDS AND NOTES (99.7%)* Rating** Principal amount ValueCalifornia (97.2%)ABAG Fin. Auth. for Nonprofit Corps. Rev. Bonds
Ser. B, AGM, 5.00%, 10/1/37 AA 450,000 500,378Ser. A, AMBAC, zero %, 10/1/19 BBB+ 365,000 355,474Ser. A, AMBAC, U.S. Govt. Coll., zero %, 10/1/19 (Escrowed to maturity) Aaa 4,635,000 4,551,570
Albany, Unified School Dist. G.O. Bonds, (Election 2016), Ser. B
Bay Area Toll Auth. Mandatory Put Bonds (4/1/19), Ser. C, 1.875%, 4/1/47 AA 1,750,000 1,750,193Bay Area Toll Auth. Rev. Bonds, (San Francisco Bay Area Sub. Toll Bridge), Ser. S-7, 4.00%, 4/1/38 AA– 9,850,000 10,187,264Bay Area Toll Auth. of CA Rev. Bonds
CA State Dept. of Wtr. Resources FRN Mandatory Put Bonds (12/1/20), (Central Valley Wtr. Syst.), Ser. AU, 1.78%, 12/1/35 AAA 8,000,000 8,004,000CA State Edl. Fac. Auth. Rev. Bonds
(CA Lutheran U.), 5.75%, 10/1/38 Baa1 5,000,000 5,000,000(U. of the Pacific), 5.50%, 11/1/39 A2 1,085,000 1,125,373(U. of the Pacific), U.S. Govt. Coll., 5.50%, 11/1/39 (Prerefunded 11/1/19) AAA/P 65,000 67,597(CA College of Arts), 5.25%, 6/1/30 Baa2 1,360,000 1,471,262(U. of the Pacific), 5.25%, 11/1/29 A2 1,265,000 1,306,922(Loyola-Marymount U.), Ser. A, 5.125%, 10/1/40 A2 2,955,000 3,040,695(Pepperdine U.), 5.00%, 10/1/49 AA 2,000,000 2,236,860(Occidental College), 5.00%, 10/1/45 Aa3 425,000 476,298(Pepperdine U.), 5.00%, 9/1/45 AA 1,000,000 1,120,700(Santa Clara U.), 5.00%, 4/1/45 Aa3 2,500,000 2,785,375(Pepperdine U.), 5.00%, 12/1/44 AA 2,000,000 2,239,020(Pepperdine U.), 5.00%, 10/1/41 AA 1,500,000 1,685,085(Occidental College), 5.00%, 10/1/38 Aa3 595,000 671,606(U. of Redlands), Ser. A, 5.00%, 10/1/37 A3 425,000 472,341(U. of the Pacific), 5.00%, 11/1/36 A2 500,000 559,630(Occidental College), 5.00%, 10/1/35 Aa3 500,000 569,120(U. of Redlands), Ser. A, 5.00%, 10/1/35 A3 1,000,000 1,103,250(Occidental College), 5.00%, 10/1/34 Aa3 960,000 1,095,322(Chapman U.), Ser. B, 4.00%, 4/1/47 A2 4,940,000 4,964,749(Loyola-Marymount U.), Ser. A, NATL, zero %, 10/1/28 A2 355,000 253,424
CA State Hlth. Fac. Fin. Auth. Rev. Bonds(Los Angeles Biomedical Research Inst.), 5.00%, 9/1/43 Baa2 6,155,000 6,786,934(Children’s Hosp. Los Angeles), Ser. A, 5.00%, 8/15/42 BBB+ 4,000,000 4,415,440(Sutter Hlth.), Ser. A, 5.00%, 11/15/41 Aa3 5,500,000 6,125,680(Los Angeles Biomedical Research Inst.), 5.00%, 9/1/37 Baa2 1,845,000 2,057,083
26 California Tax Exempt Income Fund
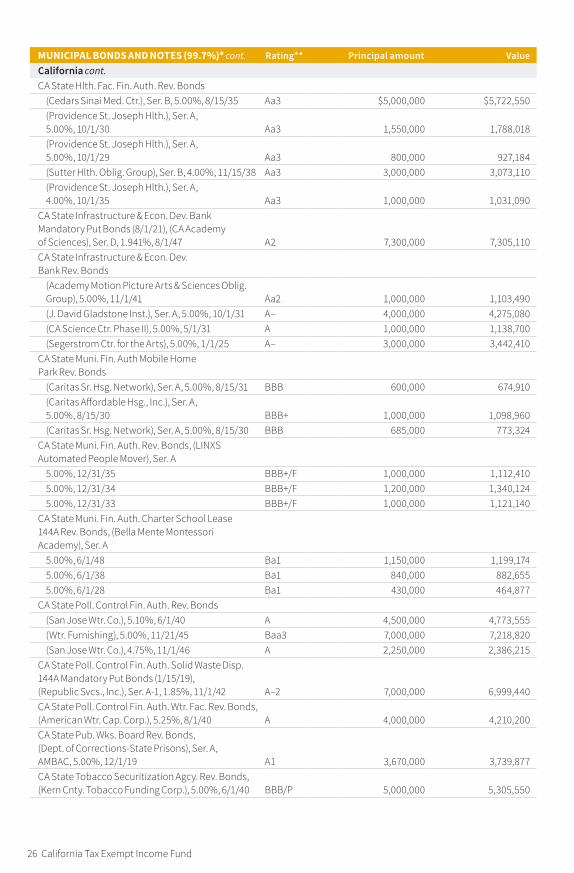
MUNICIPAL BONDS AND NOTES (99.7%)* cont. Rating** Principal amount ValueCalifornia cont.CA State Hlth. Fac. Fin. Auth. Rev. Bonds
(Cedars Sinai Med. Ctr.), Ser. B, 5.00%, 8/15/35 Aa3 $5,000,000 $5,722,550(Providence St. Joseph Hlth.), Ser. A, 5.00%, 10/1/30 Aa3 1,550,000 1,788,018(Providence St. Joseph Hlth.), Ser. A, 5.00%, 10/1/29 Aa3 800,000 927,184(Sutter Hlth. Oblig. Group), Ser. B, 4.00%, 11/15/38 Aa3 3,000,000 3,073,110(Providence St. Joseph Hlth.), Ser. A, 4.00%, 10/1/35 Aa3 1,000,000 1,031,090
CA State Infrastructure & Econ. Dev. Bank Mandatory Put Bonds (8/1/21), (CA Academy of Sciences), Ser. D, 1.941%, 8/1/47 A2 7,300,000 7,305,110CA State Infrastructure & Econ. Dev. Bank Rev. Bonds
(Academy Motion Picture Arts & Sciences Oblig. Group), 5.00%, 11/1/41 Aa2 1,000,000 1,103,490(J. David Gladstone Inst.), Ser. A, 5.00%, 10/1/31 A– 4,000,000 4,275,080(CA Science Ctr. Phase II), 5.00%, 5/1/31 A 1,000,000 1,138,700(Segerstrom Ctr. for the Arts), 5.00%, 1/1/25 A– 3,000,000 3,442,410
CA State Muni. Fin. Auth Mobile Home Park Rev. Bonds
CA State Poll. Control Fin. Auth. Rev. Bonds(San Jose Wtr. Co.), 5.10%, 6/1/40 A 4,500,000 4,773,555(Wtr. Furnishing), 5.00%, 11/21/45 Baa3 7,000,000 7,218,820(San Jose Wtr. Co.), 4.75%, 11/1/46 A 2,250,000 2,386,215
CA State Poll. Control Fin. Auth. Solid Waste Disp. 144A Mandatory Put Bonds (1/15/19), (Republic Svcs., Inc.), Ser. A-1, 1.85%, 11/1/42 A–2 7,000,000 6,999,440CA State Poll. Control Fin. Auth. Wtr. Fac. Rev. Bonds, (American Wtr. Cap. Corp.), 5.25%, 8/1/40 A 4,000,000 4,210,200CA State Pub. Wks. Board Rev. Bonds, (Dept. of Corrections-State Prisons), Ser. A, AMBAC, 5.00%, 12/1/19 A1 3,670,000 3,739,877CA State Tobacco Securitization Agcy. Rev. Bonds, (Kern Cnty. Tobacco Funding Corp.), 5.00%, 6/1/40 BBB/P 5,000,000 5,305,550
California Tax Exempt Income Fund 27
MUNICIPAL BONDS AND NOTES (99.7%)* cont. Rating** Principal amount ValueCalifornia cont.CA State U. Rev. Bonds
(Systemwide), Ser. A, 5.00%, 11/1/45 Aa2 $7,305,000 $8,178,459(Systemwide), Ser. A, 5.00%, 11/1/41 Aa2 13,340,000 14,973,216Ser. A, 5.00%, 11/1/37 Aa2 10,290,000 11,635,829
CA Statewide Cmnty. Dev. Auth. Rev. Bonds(Sr. Living — Presbyterian Homes), 7.25%, 11/15/41 BBB+/F 6,000,000 6,315,900(American Baptist Homes West), 5.75%, 10/1/25 BBB+/F 950,000 986,442(899 Charleston, LLC), Ser. A, 5.375%, 11/1/49 BB/P 1,000,000 1,057,490(899 Charleston, LLC), Ser. A, 5.25%, 11/1/44 BB/P 300,000 315,261(John Muir Hlth.), Ser. A, 5.00%, 8/15/51 A1 1,000,000 1,100,920(Front Porch Cmnty. & Svcs.), Ser. A, 5.00%, 4/1/47 A– 2,000,000 2,188,100(John Muir Hlth.), Ser. A, 5.00%, 8/15/46 A1 1,365,000 1,512,652(American Baptist Homes of the West), 5.00%, 10/1/45 BBB+/F 2,550,000 2,730,005AGM, 5.00%, 11/15/44 AA 5,195,000 5,683,590(American Baptist Homes of the West), 5.00%, 10/1/43 BBB+/F 1,190,000 1,248,346(Episcopal Cmntys. and Svcs.), 5.00%, 5/15/42 A–/F 3,250,000 3,434,633(Culinary Institute of America (The)), Ser. B, 5.00%, 7/1/41 Baa2 380,000 411,658(Enloe Med. Ctr.), 5.00%, 8/15/38 AA– 2,750,000 3,074,500(Marin Gen. Hosp.), Ser. A, 5.00%, 8/1/38 A– 500,000 565,190(Marin Gen. Hosp.), Ser. A, 5.00%, 8/1/37 A– 500,000 568,195(Marin Gen. Hosp.), Ser. A, 5.00%, 8/1/36 A– 725,000 827,008(Enloe Med. Ctr.), 5.00%, 8/15/35 AA– 1,580,000 1,781,924(Marin Gen. Hosp.), Ser. A, 5.00%, 8/1/35 A– 750,000 858,773(Marin Gen. Hosp.), Ser. A, 5.00%, 8/1/34 A– 650,000 747,104(Marin Gen. Hosp.), Ser. A, 5.00%, 8/1/33 A– 420,000 484,579(Viamonte Senior Living 1, Inc.), Ser. A, 5.00%, 7/1/33 AA– 125,000 146,218(Marin Gen. Hosp.), Ser. A, 5.00%, 8/1/32 A– 350,000 405,353(Viamonte Senior Living 1, Inc.), Ser. A, 5.00%, 7/1/32 AA– 100,000 117,437(Episcopal Cmntys. and Svcs.), 5.00%, 5/15/32 A–/F 600,000 640,638(Front Porch Cmnty. & Svcs.), Ser. A, 5.00%, 4/1/30 A– 310,000 352,960(Terraces at San Joaquin Gardens), Ser. A, 5.00%, 10/1/22 BB/P 2,200,000 2,350,898(Viamonte Senior Living 1, Inc.), Ser. A, 4.00%, 7/1/47 AA– 2,000,000 2,024,100(Front Porch Cmnty. & Svcs.), Ser. A, 4.00%, 4/1/47 A– 1,625,000 1,619,508(Marin Gen. Hosp.), Ser. A, 4.00%, 8/1/45 A– 2,500,000 2,519,575(Viamonte Senior Living 1, Inc.), Ser. A, 4.00%, 7/1/43 AA– 1,000,000 1,016,120(Viamonte Senior Living 1, Inc.), Ser. A, 4.00%, 7/1/39 AA– 875,000 893,401(Viamonte Senior Living 1, Inc.), Ser. A, 4.00%, 7/1/38 AA– 800,000 818,136(Viamonte Senior Living 1, Inc.), Ser. A, 4.00%, 7/1/37 AA– 620,000 636,101
28 California Tax Exempt Income Fund
MUNICIPAL BONDS AND NOTES (99.7%)* cont. Rating** Principal amount ValueCalifornia cont.CA Statewide Cmnty. Dev. Auth. Rev. Bonds
(Viamonte Senior Living 1, Inc.), Ser. A, 4.00%, 7/1/35 AA– $300,000 $310,527(Viamonte Senior Living 1, Inc.), Ser. B, 3.00%, 7/1/25 AA– 4,600,000 4,655,890(Cmnty. Fac. Dist. No. 1-Zone 1B), zero %, 9/1/20 BB/P 250,000 231,515
CA Statewide Cmnty. Dev. Auth. 144A Rev. Bonds(American Baptist Homes West), 6.25%, 10/1/39 BBB+/F 4,500,000 4,686,075(CA Baptist U.), Ser. A, 5.00%, 11/1/41 BB/P 1,535,000 1,680,226(CA Baptist U.), Ser. A, 5.00%, 11/1/32 BB/P 720,000 805,752
CA Statewide Fin. Auth. Tobacco Settlement Rev. Bonds, Class B, 5.625%, 5/1/29 Baa1 1,855,000 1,856,632Campbell, Union High School Dist. G.O. Bonds, (Election 2016), Ser. B
Centinela Valley, Union High School Dist. G.O. Bonds, Ser. C, AGM, 4.00%, 8/1/34 AA 5,000,000 5,267,850Ceres, Unified School Dist. G.O. Bonds, BAM
zero %, 8/1/40 AA 1,285,000 518,600zero %, 8/1/39 AA 1,075,000 455,037zero %, 8/1/38 AA 1,000,000 443,700zero %, 8/1/36 AA 545,000 267,562zero %, 8/1/34 AA 715,000 385,528zero %, 8/1/33 AA 250,000 141,393
Cerritos, G.O. Bonds, (Cerritos Cmnty. College Dist.), Ser. A, 5.00%, 8/1/39 Aa2 9,275,000 10,413,043Chula Vista, Indl. Dev. Rev. Bonds, (San Diego Gas)
MUNICIPAL BONDS AND NOTES (99.7%)* cont. Rating** Principal amount ValueCalifornia cont.Corona-Norco, Unified School Dist. Special Tax Bonds, (Cmnty. Fac. Dist. No. 98-1), 5.00%, 9/1/28 A– $1,590,000 $1,752,578Coronado, Cmnty. Dev. Successor Agcy. Tax Alloc. Bonds, Ser. A, 5.00%, 9/1/33 ## AA 14,000,000 15,744,260Desert Cmnty. College Dist. G.O. Bonds, 5.00%, 8/1/36 Aa2 1,000,000 1,142,000Eastern CA Muni. Waste Wtr. Dist. Rev. Bonds, Ser. A, 5.00%, 7/1/45 AA+ 2,740,000 3,081,925El Dorado, Irrigation Dist. Rev. Bonds, Ser. C, 4.00%, 3/1/34 Aa3 1,500,000 1,572,555Emeryville, Redev. Successor Agcy. Tax Alloc. Bonds, Ser. A, AGM
5.00%, 9/1/34 AA 500,000 556,9605.00%, 9/1/33 AA 385,000 432,6445.00%, 9/1/32 AA 450,000 507,2635.00%, 9/1/31 AA 590,000 666,4525.00%, 9/1/30 AA 815,000 922,996
Fairfield-Suisun, Unified School Dist. G.O. Bonds, (Election 2016)
M-S-R Energy Auth. Rev. Bonds, Ser. A, 6.50%, 11/1/39 BBB+ 6,000,000 8,227,800Merced, City School Dist. G.O. Bonds, (Election 2014), 5.00%, 8/1/45 Aa3 3,500,000 3,901,835Merced, Union High School Dist. G.O. Bonds, AGM
zero %, 8/1/44 AA 8,655,000 2,566,034zero %, 8/1/39 AA 5,005,000 1,951,500
Modesto, Irrigation Dist. Fin. Auth. Elec. Syst. Rev. Bonds, Ser. A, 5.00%, 10/1/40 A+ 2,790,000 3,069,558Murrieta Valley, Unified School Dist. G.O. Bonds, AGM, zero %, 9/1/31 AA 2,000,000 1,266,420
32 California Tax Exempt Income Fund
MUNICIPAL BONDS AND NOTES (99.7%)* cont. Rating** Principal amount ValueCalifornia cont.Murrieta, Pub. Fin. Auth. Special Tax Bonds, 5.00%, 9/1/26 A $1,000,000 $1,081,380Napa Valley, Cmnty. College Dist. G.O. Bonds
stepped-coupon zero % (4.00%, 2/1/21), 8/1/34 †† Aa2 1,500,000 1,434,345stepped-coupon zero % (4.00%, 2/1/21), 8/1/33 †† Aa2 2,500,000 2,403,625
Norco, Special Tax Bonds, (Norco Ridge Ranch), BAM5.00%, 9/1/33 AA 660,000 752,0305.00%, 9/1/30 AA 2,190,000 2,521,062
North Natomas, Cmnty. Fac. Special Tax Bonds, (Dist. No. 4), Ser. E, 5.25%, 9/1/33 BBB+ 1,500,000 1,649,490Northern CA Gas Auth. No. 1 FRN Rev. Bonds, Ser. B, 2.196%, 7/1/19 A3 3,310,000 3,310,596Oakland, G.O. Bonds, Ser. A, 5.00%, 1/15/35 Aa2 2,000,000 2,267,500Oakland, Alameda Cnty. Unified School Dist. G.O. Bonds
(Election of 2006), Ser. A, 6.125%, 8/1/29 (Prerefunded 8/1/19) Aa3 4,000,000 4,145,920Ser. A, 5.00%, 8/1/40 Aa3 4,000,000 4,498,520Ser. C, 5.00%, 8/1/38 Aa3 3,235,000 3,669,072Ser. C, 5.00%, 8/1/37 Aa3 8,520,000 9,691,244Ser. A, 5.00%, 8/1/35 Aa3 1,000,000 1,136,540
Orange Cnty., Cmnty. Fac. Dist. Special Tax Bonds, (Ladera Ranch — No. 04-1), Ser. A
Poway, Unified School Dist. G.O. Bonds, (Election of 2008), zero %, 8/1/29 Aa3 11,350,000 8,073,482Poway, Unified School Dist. Pub. Fin. Auth. Special Tax Bonds
Redding, Elec. Syst. Rev. Bonds, NATL, 6.368%, 7/1/22 (Escrowed to maturity) A 1,810,000 1,969,552Redwood City, Redev. Agcy., Tax Alloc. Bonds, (Redev. Area 2-A), AMBAC, zero %, 7/15/22 A 3,230,000 2,937,814Regents of the U. of CA Med. Ctr. (The) Rev. Bonds, Ser. L, 5.00%, 5/15/41 Aa3 2,000,000 2,230,200Ripon, Redev. Agcy. Tax Alloc. Bonds, (Cmnty. Redev.), NATL, 4.75%, 11/1/36 Baa2 1,365,000 1,365,396Riverside Cnty., Pub. Fin. Auth. Tax Allocation Bonds, Ser. A, BAM, 4.00%, 10/1/40 AA 1,250,000 1,264,138Riverside Cnty., Redev. Successor Agcy. Tax Alloc. Bonds, (Hsg.), Ser. B
BAM, stepped-coupon zero % (5.000%, 10/1/21), 10/1/41 †† A 1,990,000 1,890,619stepped-coupon zero % (5.000%, 10/1/21), 10/1/37 †† A 1,010,000 965,944stepped-coupon zero % (5.000%, 10/1/21), 10/1/32 †† AA 290,000 282,930BAM, stepped-coupon zero % (5.000%, 10/1/21), 10/1/29 †† AA 775,000 763,964stepped-coupon zero % (5.000%, 10/1/21), 10/1/28 †† AA 235,000 232,854BAM, stepped-coupon zero % (5.000%, 10/1/21), 10/1/26 †† AA 500,000 500,220BAM, stepped-coupon zero % (5.000%, 10/1/21), 10/1/24 †† AA 445,000 434,164
(Election 2012), Ser. I, 4.00%, 7/1/34 Aa2 5,000,000 5,322,550Ser. K-2, zero %, 7/1/35 Aa2 1,025,000 541,210Ser. K-2, zero %, 7/1/33 Aa2 1,645,000 958,245Ser. K-2, zero %, 7/1/32 Aa2 1,955,000 1,197,535
San Francisco City & Cnty. Arpt. Comm. Intl. Arpt. Rev. Bonds
Ser. A, 5.25%, 5/1/33 A1 4,000,000 4,413,040(San Francisco Intl. Arpt.), Ser. 2, 5.00%, 5/1/41 A1 5,000,000 5,485,000
San Francisco City & Cnty., G.O. Bonds, Ser. A4.00%, 6/15/36 Aaa 5,155,000 5,373,6754.00%, 6/15/33 Aaa 3,550,000 3,753,770
San Francisco City & Cnty., Rev. Bonds, (Pub. Util. Comm.), 4.00%, 11/1/39 Aa3 5,000,000 5,174,500San Francisco City & Cnty., Intl. Arpt. Comm. Rev. Bonds, Ser. B, 5.00%, 5/1/43 A1 3,280,000 3,563,130San Francisco City & Cnty., Pub. Util. Comm. Waste Wtr. Mandatory Put Bonds (10/1/23), (Green Bonds), Ser. C, 2.125%, 10/1/48 AA 3,000,000 2,988,000San Francisco City & Cnty., Pub. Util. Comm. Waste Wtr. Rev. Bonds, Ser. B
5.00%, 10/1/35 AA 2,000,000 2,342,8605.00%, 10/1/34 AA 3,500,000 4,122,2654.00%, 10/1/42 AA 5,000,000 5,154,650
California Tax Exempt Income Fund 35
MUNICIPAL BONDS AND NOTES (99.7%)* cont. Rating** Principal amount ValueCalifornia cont.San Francisco City & Cnty., Redev. Agcy. Cmnty. Successor Special Tax Bonds, (No. 6 Mission Bay South Pub. Impts.), Ser. A, 5.00%, 8/1/31 BBB/P $1,140,000 $1,238,667San Francisco, City & Cnty. Arpt. Comm. Rev. Bonds, (Intl. Arpt.)
MUNICIPAL BONDS AND NOTES (99.7%)* cont. Rating** Principal amount ValueCalifornia cont.Southern CA Pub. Pwr. Auth. Mandatory Put Bonds (5/1/21), (Canyon Pwr.), Ser. A, 2.25%, 7/1/40 Aa3 $12,800,000 $12,815,488Southern CA Pub. Pwr. Auth. Rev. Bonds
(Natural Gas No. 1), Ser. A, 5.25%, 11/1/24 A3 2,850,000 3,210,668(Natural Gas), Ser. A, 5.25%, 11/1/21 A3 1,500,000 1,623,855Ser. A, 5.00%, 7/1/40 Aa3 6,860,000 7,176,383
Southwestern Cmnty. College Dist. G.O. Bonds, (Election of 2008), Ser. C, zero %, 8/1/46 Aa2 5,000,000 1,471,150Stockton, Pub. Fin. Auth. Special Tax Bonds, Ser. A, BAM, 4.00%, 9/2/27 AA 570,000 623,768Stockton, Pub. Wtr. Fin. Auth. Rev. Bonds, (Delta Wtr. Supply), Ser. A
6.25%, 10/1/40 A 1,250,000 1,457,4136.25%, 10/1/38 A 2,235,000 2,610,4136.125%, 10/1/35 A 750,000 874,290
Stockton, Unified School Dist. COP5.00%, 2/1/36 A 1,000,000 1,123,5605.00%, 2/1/35 A 2,410,000 2,718,0465.00%, 2/1/34 A 2,295,000 2,598,1475.00%, 2/1/31 A 1,325,000 1,519,470
Stockton, Unified School Dist. G.O. Bonds, (Election 2012), Ser. A
5.00%, 8/1/42 AA 3,000,000 3,295,050AGM, 5.00%, 8/1/38 AA 1,000,000 1,100,030
Sunnyvale, Cmnty. Fac. Dist. Special Tax Bonds, 7.65%, 8/1/21 B+/P 1,725,000 1,729,433Sweetwater, G.O. Bonds, (Union High School Dist.), 5.00%, 8/1/35 A1 2,330,000 2,616,590Tobacco Securitization Auth. of Southern CA Rev. Bonds
2,000,000Mississippi (0.4%)MS State Bus. Fin. Commission Gulf Opportunity Zone VRDN, (Chevron USA, Inc.), Ser. E, 1.58%, 12/1/30 VMIG1 5,300,000 5,300,000
5,300,000New Jersey (0.1%)NJ State Hlth. Care Fac. Fin. Auth. VRDN, (Virtua Hlth.), Ser. C, 1.32%, 7/1/43 A-1 665,000 665,000
570,000Texas (1.0%)Harris Cnty., Cultural Ed. Fac. Fin. Corp. VRDN, (The Methodist Hosp.), Ser. C-1, 1.68%, 12/1/24 A-1+ 11,095,000 11,095,000
11,095,000
TOTAL INVESTMENTSTotal investments (cost $1,126,208,489) $1,150,571,142
Notes to the fund’s portfolio
Unless noted otherwise, the notes to the fund’s portfolio are for the close of the fund’s reporting period, which ran from October 1, 2017 through September 30, 2018 (the reporting period). Within the following notes to the portfolio, references to “Putnam Management” represent Putnam Investment Management, LLC, the fund’s manager, an indirect wholly-owned subsidiary of Putnam Investments, LLC and references to “ASC 820” represent Accounting Standards Codification 820 Fair Value Measurements and Disclosures.
* Percentages indicated are based on net assets of $1,153,851,703.
** The Moody’s, Standard & Poor’s or Fitch ratings indicated are believed to be the most recent ratings available at the close of the reporting period for the securities listed. Ratings are generally ascribed to securities at the time of issuance. While the agencies may from time to time revise such ratings, they undertake no obligation to do so, and the ratings do not necessarily represent what the agencies would ascribe to these securities at the close of the reporting period. Securities rated by Fitch are indicated by “/F.” Securities rated by Putnam are indicated by “/P.” The Putnam rating categories are comparable to the Standard & Poor’s classifications. If a security is insured, it will usually be rated by the ratings organizations based on the financial strength of the insurer. Ratings are not covered by the Report of Independent Registered Public Accounting Firm. For further details regarding security ratings, please see the Statement of Additional Information.
38 California Tax Exempt Income Fund
The accompanying notes are an integral part of these financial statements.
†† The interest rate and date shown parenthetically represent the new interest rate to be paid and the date the fund will begin accruing interest at this rate.
## Forward commitment, in part or in entirety (Note 1).
144A after the name of an issuer represents securities exempt from registration under Rule 144A of the Securities Act of 1933, as amended. These securities may be resold in transactions exempt from registration, normally to qualified institutional buyers.
On Mandatory Put Bonds, the rates shown are the current interest rates at the close of the reporting period and the dates shown represent the next mandatory put dates.
The dates shown parenthetically on prerefunded bonds represent the next prerefunding dates.
The dates shown on debt obligations are the original maturity dates.
The fund had the following sector concentrations greater than 10% at the close of the reporting period (as a percentage of net assets):
Local debt 19.1%State debt 12.3Transportation 10.7Utilities 10.7Health care 10.5Land 10.3
ASC 820 establishes a three-level hierarchy for disclosure of fair value measurements. The valuation hierarchy is based upon the transparency of inputs to the valuation of the fund’s investments. The three levels are defined as follows:
Level 1: Valuations based on quoted prices for identical securities in active markets.Level 2: Valuations based on quoted prices in markets that are not active or for which all significant inputs are observable, either directly or indirectly.Level 3: Valuations based on inputs that are unobservable and significant to the fair value measurement.
The following is a summary of the inputs used to value the fund’s net assets as of the close of the reporting period:
Valuation inputsInvestments in securities: Level 1 Level 2 Level 3Municipal bonds and notes $— $1,150,571,142 $— Totals by level $— $1,150,571,142 $—
During the reporting period, transfers within the fair value hierarchy, if any, did not represent, in the aggregate, more than 1% of the fund’s net assets measured as of the end of the period. Transfers are accounted for using the end of period pricing valuation method.
The accompanying notes are an integral part of these financial statements.
Statement of assets and liabilities 9/30/18
ASSETSInvestment in securities, at value (Note 1):
Unaffiliated issuers (identified cost $1,126,208,489) $1,150,571,142 Cash 11,838,362 Interest and other receivables 12,767,360 Receivable for shares of the fund sold 585,954 Receivable for investments sold 620,000 Prepaid assets 7,300 Total assets 1,176,390,118
LIABILITIESPayable for investments purchased 2,952,750 Payable for purchases of delayed delivery securities (Note 1) 15,734,880 Payable for shares of the fund repurchased 1,584,086 Payable for compensation of Manager (Note 2) 410,691 Payable for custodian fees (Note 2) 7,927 Payable for investor servicing fees (Note 2) 100,867 Payable for Trustee compensation and expenses (Note 2) 492,657 Payable for administrative services (Note 2) 4,749 Payable for distribution fees (Note 2) 595,825 Distributions payable to shareholders 530,687 Other accrued expenses 123,296 Total liabilities 22,538,415
Net assets $1,153,851,703
REPRESENTED BYPaid-in capital (Unlimited shares authorized) (Notes 1 and 4) $1,118,138,340 Total distributable earnings (Note 1) 35,713,363 Total — Representing net assets applicable to capital shares outstanding $1,153,851,703
COMPUTATION OF NET ASSET VALUE AND OFFERING PRICENet asset value and redemption price per class A share ($1,023,401,238 divided by 128,767,996 shares) $7.95 Offering price per class A share (100/96.00 of $7.95)* $8.28 Net asset value and offering price per class B share ($2,526,294 divided by 318,208 shares)** $7.94 Net asset value and offering price per class C share ($35,019,423 divided by 4,379,043 shares)** $8.00 Net asset value and redemption price per class M share ($2,628,017 divided by 331,572 shares) $7.93 Offering price per class M share (100/96.75 of $7.93)† $8.20 Net asset value, offering price and redemption price per class R6 share ($10,075 divided by 1,264 shares) $7.97 Net asset value, offering price and redemption price per class Y share ($90,266,656 divided by 11,323,988 shares) $7.97
*On single retail sales of less than $100,000. On sales of $100,000 or more the offering price is reduced.**Redemption price per share is equal to net asset value less any applicable contingent deferred sales charge.†On single retail sales of less than $50,000. On sales of $50,000 or more the offering price is reduced.
California Tax Exempt Income Fund 39
The accompanying notes are an integral part of these financial statements.
Statement of operations Year ended 9/30/18
INVESTMENT INCOMEInterest income $45,126,716 Total investment income 45,126,716
EXPENSESCompensation of Manager (Note 2) 5,314,738 Investor servicing fees (Note 2) 636,152 Custodian fees (Note 2) 16,385 Trustee compensation and expenses (Note 2) 49,007 Distribution fees (Note 2) 2,807,307 Administrative services (Note 2) 36,151 Other 313,000 Total expenses 9,172,740
REALIZED AND UNREALIZED GAIN (LOSS)Net realized gain (loss) on:
Securities from unaffiliated issuers (Notes 1 and 3) 23,691,007 Total net realized gain 23,691,007 Change in net unrealized appreciation (depreciation) on:
Securities from unaffiliated issuers (52,243,755)Total change in net unrealized depreciation (52,243,755)
Net loss on investments (28,552,748)
Net increase in net assets resulting from operations $7,512,277
40 California Tax Exempt Income Fund
The accompanying notes are an integral part of these financial statements.
Statement of changes in net assets
DECREASE IN NET ASSETS Year ended 9/30/18 Year ended 9/30/17OperationsNet investment income $36,065,025 $41,776,474 Net realized gain on investments 23,691,007 24,323,973 Net unrealized depreciation of investments (52,243,755) (66,146,554)Net increase (decrease) in net assets resulting from operations 7,512,277 (46,107)Distributions to shareholders (Note 1):
From ordinary incomeTaxable net investment income
Class A (1,109,278) (1,143,824)Class B (3,340) (4,494)Class C (46,724) (54,313)Class M (2,803) (3,747)Class Y (89,948) (72,603)
From tax-exempt net investment incomeClass A (31,960,108) (37,115,354)Class B (69,240) (110,291)Class C (910,805) (1,289,173)Class M (74,664) (108,292)Class R6 (112) — Class Y (2,830,758) (2,672,660)
Decrease from capital share transactions (Note 4) (103,215,899) (72,856,936)Total decrease in net assets (132,801,402) (115,477,794)
NET ASSETSBeginning of year 1,286,653,105 1,402,130,899
End of year (Note 1) $1,153,851,703 $1,286,653,105
California Tax Exempt Income Fund 41
Fund _FundCode, — NumbCols Columns — This section modified: 10/19/18 3:47:34 PM Fund _FundCode, — NumbCols Columns — This section modified: 10/19/18 3:47:34 PM
California Tax Exempt Income Fund 43 42 California Tax Exempt Income Fund
The accompanying notes are an integral part of these financial statements.
* Not annualized.
† For the period May 22, 2018 (commencement of operations) to September 30, 2018. a Total return assumes dividend reinvestment and does not reflect the effect of sales charges. b Includes amounts paid through expense offset arrangements, if any (Note 2). Also excludes acquired fund fees, if any.
c Includes interest and fees expense associated with borrowings which amounted to the following (Note 1):
Percentage of average net assetsSeptember 30, 2014 <0.01%
d Reflects a voluntary waiver of certain fund expenses in effect during the period. As a result of such waivers, the expenses of each class reflect a reduction of less than .01% as a percentage of average net assets per share for each class (Note 2).
Financial highlights (For a common share outstanding throughout the period)
INVESTMENT OPERATIONS LESS DISTRIBUTIONS RATIOS AND SUPPLEMENTAL DATA
Period ended
Net asset value, beginning of period
Net investment income (loss )
Net realized and unrealized
gain (loss) on investments
Total from investment operations
From net investment
income Total
dis tri bu tions Net asset value,
end of period
Total return at net asset value
(% ) a
Net assets, end of period
(in thousands )
Ratio of expenses to average
net assets (% ) b
Ratio of net investment
income (loss) to average
net assets (% )Portfolio
turnover (% )
Class A September 30, 2018 $8.14 .24 (.19 ) .05 (.24 ) (.24 ) $7.95 .66 $1,023,401 .73 2.95 40 September 30, 2017 8.39 .27 (.25 ) .02 (.27 ) (.27 ) 8.14 .26 1,146,710 .74 3.23 31 September 30, 2016 8.19 .29 .20 .49 (.29 ) (.29 ) 8.39 6.08 1,253,683 .75 d 3.43 d 16 September 30, 2015 8.23 .31 (.04 ) .27 (.31 ) (.31 ) 8.19 3.29 1,226,347 .74 3.73 14 September 30, 2014 7.81 .32 .42 .74 (.32 ) (.32 ) 8.23 9.63 1,278,391 .74 c 3.99 c 11 Class B September 30, 2018 $8.13 .19 (.19 ) — (.19 ) (.19 ) $7.94 .02 $2,526 1.37 2.32 40 September 30, 2017 8.38 .21 (.25 ) (.04 ) (.21 ) (.21 ) 8.13 (.37 ) 3,733 1.37 2.61 31 September 30, 2016 8.18 .23 .21 .44 (.24 ) (.24 ) 8.38 5.41 5,059 1.38 d 2.81 d 16 September 30, 2015 8.22 .25 (.04 ) .21 (.25 ) (.25 ) 8.18 2.64 5,360 1.37 3.10 14 September 30, 2014 7.80 .27 .42 .69 (.27 ) (.27 ) 8.22 8.96 6,364 1.37 c 3.36 c 11 Class C September 30, 2018 $8.19 .18 (.19 ) (.01 ) (.18 ) (.18 ) $8.00 (.13 ) $35,019 1.52 2.17 40 September 30, 2017 8.44 .20 (.25 ) (.05 ) (.20 ) (.20 ) 8.19 (.52 ) 49,093 1.52 2.45 31 September 30, 2016 8.23 .22 .21 .43 (.22 ) (.22 ) 8.44 5.33 60,951 1.53 d 2.64 d 16 September 30, 2015 8.27 .24 (.04 ) .20 (.24 ) (.24 ) 8.23 2.46 46,944 1.52 2.95 14 September 30, 2014 7.85 .25 .42 .67 (.25 ) (.25 ) 8.27 8.73 44,233 1.52 c 3.21 c 11 Class M September 30, 2018 $8.12 .22 (.19 ) .03 (.22 ) (.22 ) $7.93 .37 $2,628 1.02 2.66 40 September 30, 2017 8.37 .24 (.25 ) (.01 ) (.24 ) (.24 ) 8.12 (.02 ) 3,272 1.02 2.95 31 September 30, 2016 8.16 .26 .22 .48 (.27 ) (.27 ) 8.37 5.92 3,835 1.03 d 3.14 d 16 September 30, 2015 8.20 .28 (.04 ) .24 (.28 ) (.28 ) 8.16 3.00 3,033 1.02 3.45 14 September 30, 2014 7.79 .29 .41 .70 (.29 ) (.29 ) 8.20 9.22 2,670 1.02 c 3.71 c 11 Class R6 September 30, 2018 † $8.01 .09 (.04 ) .05 (.09 ) (.09 ) $7.97 .61 * $10 .19 * 1.15 * 40 Class Y September 30, 2018 $8.16 .26 (.19 ) .07 (.26 ) (.26 ) $7.97 .87 $90,267 .52 3.16 40 September 30, 2017 8.41 .28 (.25 ) .03 (.28 ) (.28 ) 8.16 .48 83,845 .52 3.44 31 September 30, 2016 8.21 .30 .21 .51 (.31 ) (.31 ) 8.41 6.29 78,603 .53 d 3.63 d 16 September 30, 2015 8.25 .32 (.04 ) .28 (.32 ) (.32 ) 8.21 3.50 58,017 .52 3.95 14 September 30, 2014 7.83 .33 .42 .75 (.33 ) (.33 ) 8.25 9.85 56,636 .52 c 4.20 c 11
44 California Tax Exempt Income Fund
Notes to financial statements 9/30/18
Within the following Notes to financial statements, references to “State Street” represent State Street Bank and Trust Company, references to “the SEC” represent the Securities and Exchange Commission, references to “Putnam Management” represent Putnam Investment Management, LLC, the fund’s manager, an indirect wholly-owned subsidiary of Putnam Investments, LLC and references to “OTC”, if any, represent over-the-counter. Unless otherwise noted, the “reporting period” represents the period from October 1, 2017 through September 30, 2018.
Putnam California Tax Exempt Income Fund (the fund) is a Massachusetts business trust, which is registered under the Investment Company Act of 1940, as amended, as a diversified open-end management investment company. The goal of the fund is to seek as high a level of current income exempt from federal income tax and California personal income tax as Putnam Management believes to be consistent with preservation of capital. The fund invests mainly in bonds that pay interest that is exempt from federal income tax and California personal income tax (but that may be subject to federal alternative minimum tax (AMT)), are investment-grade in quality, and have intermediate- to long-term maturities (i.e., three years or longer). Under normal circumstances, the fund invests so that at least 90% of the fund’s income distributions are exempt from federal income tax and California personal income tax, except during times of adverse market conditions, when more than 10% of the fund’s income distributions could be subject to these taxes. Such tax-exempt investments in which the fund will invest are issued by or for states, territories or possessions of the United States or by their political subdivisions, agencies, authorities or other government entities, and the income from these investments is exempt from both federal and California personal income tax. This investment policy cannot be changed without the approval of the fund’s shareholders. Putnam Management may consider, among other factors, credit, interest rate and prepayment risks, as well as general market conditions, when deciding whether to buy or sell investments.
The fund offers class A, class B, class C, class M, class R6 and class Y shares. The fund began offering class R6 shares on May 22, 2018. The fund registered class T shares in February 2017, however, as of the date of this report, class T shares had not commenced operations and are not available for purchase. Purchases of class B shares are closed to new and existing investors except by exchange from class B shares of another Putnam fund or through dividend and/or capital gains reinvestment. Class A and class M shares are sold with a maximum front-end sales charge of 4.00% and 3.25%, respectively. Class A shares generally are not subject to a contingent deferred sales charge, and class M, class R6 and class Y shares are not subject to a contingent deferred sales charge. Class B shares, which convert to class A shares after approximately eight years, are not subject to a front-end sales charge and are subject to a contingent deferred sales charge if those shares are redeemed within six years of purchase. Class C shares are subject to a one-year 1.00% contingent deferred sales charge and generally convert to class A shares after approximately ten years. Prior to April 1, 2018, class C shares did not convert to class A shares. The expenses for class A, class B, class C and class M shares may differ based on the distribution fee of each class, which is identified in Note 2. Class R6 and class Y shares, which are sold at net asset value, are generally subject to the same expenses as class A, class B, class C and class M shares, but do not bear a distribution fee, and in the case of class R6 shares, bear a lower investor servicing fee, which is identified in Note 2. Class R6 and class Y shares are not available to all investors.
In the normal course of business, the fund enters into contracts that may include agreements to indemnify another party under given circumstances. The fund’s maximum exposure under these arrangements is unknown as this would involve future claims that may be, but have not yet been, made against the fund. However, the fund’s management team expects the risk of material loss to be remote.
The fund has entered into contractual arrangements with an investment adviser, administrator, distributor, share-holder servicing agent and custodian, who each provide services to the fund. Unless expressly stated otherwise, shareholders are not parties to, or intended beneficiaries of these contractual arrangements, and these contrac-tual arrangements are not intended to create any shareholder right to enforce them against the service providers or to seek any remedy under them against the service providers, either directly or on behalf of the fund.
Under the fund’s Amended and Restated Agreement and Declaration of Trust, any claims asserted against or on behalf of the Putnam Funds, including claims against Trustees and Officers, must be brought in state and federal courts located within the Commonwealth of Massachusetts.
Note 1: Significant accounting policiesThe following is a summary of significant accounting policies consistently followed by the fund in the prepa-ration of its financial statements. The preparation of financial statements is in conformity with accounting principles generally accepted in the United States of America and requires management to make estimates and assumptions that affect the reported amounts of assets and liabilities in the financial statements and the reported amounts of increases and decreases in net assets from operations. Actual results could differ from those estimates. Subsequent events after the Statement of assets and liabilities date through the date that the financial statements were issued have been evaluated in the preparation of the financial statements.
California Tax Exempt Income Fund 45
Investment income, realized and unrealized gains and losses and expenses of the fund are borne pro-rata based on the relative net assets of each class to the total net assets of the fund, except that each class bears expenses unique to that class (including the distribution fees applicable to such classes). Each class votes as a class only with respect to its own distribution plan or other matters on which a class vote is required by law or determined by the Trustees. If the fund were liquidated, shares of each class would receive their pro-rata share of the net assets of the fund. In addition, the Trustees declare separate dividends on each class of shares.
Security valuation Portfolio securities and other investments are valued using policies and procedures adopted by the Board of Trustees. The Trustees have formed a Pricing Committee to oversee the implementation of these procedures and have delegated responsibility for valuing the fund’s assets in accordance with these procedures to Putnam Management. Putnam Management has established an internal Valuation Committee that is respon-sible for making fair value determinations, evaluating the effectiveness of the pricing policies of the fund and reporting to the Pricing Committee.
Tax-exempt bonds and notes are generally valued on the basis of valuations provided by an independent pricing service approved by the Trustees. Such services use information with respect to transactions in bonds, quota-tions from bond dealers, market transactions in comparable securities and various relationships between securities in determining value. These securities will generally be categorized as Level 2.
Certain investments, including certain restricted and illiquid securities and derivatives, are also valued at fair value following procedures approved by the Trustees. To assess the continuing appropriateness of fair valua-tions, the Valuation Committee reviews and affirms the reasonableness of such valuations on a regular basis after considering all relevant information that is reasonably available. Such valuations and procedures are reviewed periodically by the Trustees. These valuations consider such factors as significant market or specific security events such as interest rate or credit quality changes, various relationships with other securities, discount rates, U.S. Treasury, U.S. swap and credit yields, index levels, convexity exposures, recovery rates, sales and other multi-ples and resale restrictions. These securities are classified as Level 2 or as Level 3 depending on the priority of the significant inputs. The fair value of securities is generally determined as the amount that the fund could reason-ably expect to realize from an orderly disposition of such securities over a reasonable period of time. By its nature, a fair value price is a good faith estimate of the value of a security in a current sale and does not reflect an actual market price, which may be different by a material amount.
Security transactions and related investment income Security transactions are recorded on the trade date (the date the order to buy or sell is executed). Gains or losses on securities sold are determined on the identified cost basis.
Interest income is recorded on the accrual basis. All premiums/discounts are amortized/accreted on a yield-to-maturity basis. The premium in excess of the call price, if any, is amortized to the call date; thereafter, any remaining premium is amortized to maturity.
Securities purchased or sold on a forward commitment or delayed delivery basis may be settled at a future date beyond customary settlement time; interest income is accrued based on the terms of the securities. Losses may arise due to changes in the fair value of the underlying securities or if the counterparty does not perform under the contract.
Interfund lending The fund, along with other Putnam funds, may participate in an interfund lending program pursuant to an exemptive order issued by the SEC. This program allows the fund to borrow from other Putnam funds that permit such transactions. Interfund lending transactions are subject to each fund’s investment policies and borrowing and lending limits. Interest earned or paid on the interfund lending transaction will be based on the average of certain current market rates. During the reporting period, the fund did not utilize the program.
Lines of credit The fund participates, along with other Putnam funds, in a $317.5 million unsecured committed line of credit and a $235.5 million unsecured uncommitted line of credit, both provided by State Street. Borrow-ings may be made for temporary or emergency purposes, including the funding of shareholder redemption requests and trade settlements. Interest is charged to the fund based on the fund’s borrowing at a rate equal to 1.25% plus the higher of (1) the Federal Funds rate and (2) the overnight LIBOR for the committed line of credit and the Federal Funds rate plus 1.30% for the uncommitted line of credit. A closing fee equal to 0.04% of the committed line of credit and 0.04% of the uncommitted line of credit has been paid by the participating funds. In addition, a commitment fee of 0.21% per annum on any unutilized portion of the committed line of credit is allo-cated to the participating funds based on their relative net assets and paid quarterly. During the reporting period, the fund had no borrowings against these arrangements.
Federal taxes It is the policy of the fund to distribute all of its income within the prescribed time period and otherwise comply with the provisions of the Internal Revenue Code of 1986, as amended (the Code), applicable to regulated investment companies. It is also the intention of the fund to distribute an amount sufficient to avoid imposition of any excise tax under Section 4982 of the Code.
46 California Tax Exempt Income Fund
The fund is subject to the provisions of Accounting Standards Codification 740 Income Taxes (ASC 740). ASC 740 sets forth a minimum threshold for financial statement recognition of the benefit of a tax position taken or expected to be taken in a tax return. The fund did not have a liability to record for any unrecognized tax benefits in the accompanying financial statements. No provision has been made for federal taxes on income, capital gains or unrealized appreciation on securities held nor for excise tax on income and capital gains. Each of the fund’s federal tax returns for the prior three fiscal years remains subject to examination by the Internal Revenue Service.
Distributions to shareholders Income dividends are recorded daily by the fund and are paid monthly. Distri-butions from capital gains, if any, are recorded on the ex-dividend date and paid at least annually. The amount and character of income and gains to be distributed are determined in accordance with income tax regulations which may differ from generally accepted accounting principles. These differences include temporary and/or permanent differences from market discount. Reclassifications are made to the fund’s capital accounts to reflect income and gains available for distribution (or available capital loss carryovers) under income tax regulations. At the close of the reporting period, the fund reclassified $864,783 to increase undistributed net investment income, and $864,783 to decrease accumulated net realized gain.
Tax cost of investments includes adjustments to net unrealized appreciation (depreciation) which may not neces-sarily be final tax cost basis adjustments, but closely approximate the tax basis unrealized gains and losses that may be realized and distributed to shareholders. The tax basis components of distributable earnings and the federal tax cost as of the close of the reporting period were as follows:
Unrealized appreciation $32,920,248Unrealized depreciation (8,276,312 )Net unrealized appreciation 24,643,936Undistributed ordinary income 847,340Undistributed tax-exempt income 6,140,177Undistributed long-term gain 4,612,593Cost for federal income tax purposes $1,125,927,206
For the fiscal year ended September 30, 2017, the fund had undistributed net investment income of $6,624,804.
Note 2: Management fee, administrative services and other transactionsThe fund pays Putnam Management a management fee (based on the fund’s average net assets and computed and paid monthly) at annual rates that may vary based on the average of the aggregate net assets of all open-end mutual funds sponsored by Putnam Management (excluding net assets of funds that are invested in, or that are invested in by, other Putnam funds to the extent necessary to avoid “double counting” of those assets). Such annual rates may vary as follows:
0.590 % of the first $5 billion,
0.540 % of the next $5 billion,
0.490 % of the next $10 billion,
0.440 % of the next $10 billion,
0.390 % of the next $50 billion,
0.370 % of the next $50 billion,
0.360 % of the next $100 billion and
0.355 % of any excess thereafter.
For the reporting period, the management fee represented an effective rate (excluding the impact from any expense waivers in effect) of 0.432% of the fund’s average net assets.
Putnam Management has contractually agreed, through January 30, 2020, to waive fees and/or reimburse the fund’s expenses to the extent necessary to limit the cumulative expenses of the fund, exclusive of brokerage, interest, taxes, investment-related expenses, extraordinary expenses, acquired fund fees and expenses and payments under the fund’s investor servicing contract, investment management contract and distribution plans, on a fiscal year-to-date basis to an annual rate of 0.20% of the fund’s average net assets over such fiscal year-to-date period. During the reporting period, the fund’s expenses were not reduced as a result of this limit.
Putnam Investments Limited (PIL), an affiliate of Putnam Management, is authorized by the Trustees to manage a separate portion of the assets of the fund as determined by Putnam Management from time to time. PIL did not manage any portion of the assets of the fund during the reporting period. If Putnam Management were to engage the services of PIL, Putnam Management would pay a quarterly sub-management fee to PIL for its services at an annual rate of 0.40% of the average net assets of the portion of the fund managed by PIL.
The fund reimburses Putnam Management an allocated amount for the compensation and related expenses of certain officers of the fund and their staff who provide administrative services to the fund. The aggregate amount of all such reimbursements is determined annually by the Trustees.
California Tax Exempt Income Fund 47
Custodial functions for the fund’s assets are provided by State Street. Custody fees are based on the fund’s asset level, the number of its security holdings and transaction volumes.
Putnam Investor Services, Inc., an affiliate of Putnam Management, provides investor servicing agent functions to the fund. Putnam Investor Services, Inc. received fees for investor servicing for class A, class B, class C, class M, and class Y shares that included (1) a per account fee for each direct and underlying non-defined contribution account (retail account) of the fund; (2) a specified rate of the fund’s assets attributable to defined contribu-tion plan accounts; and (3) a specified rate based on the average net assets in retail accounts. Putnam Investor Services, Inc. has agreed that the aggregate investor servicing fees for each fund’s retail and defined contribution accounts for these share classes will not exceed an annual rate of 0.25% of the fund’s average assets attributable to such accounts.
Class R6 shares paid a monthly fee based on the average net assets of class R6 shares at an annual rate of 0.05%.
During the reporting period, the expenses for each class of shares related to investor servicing fees were as follows:
Class A $564,278
Class B 1,554
Class C 22,107
Class M 1,459
Class R6 2
Class Y 46,752
Total $636,152
The fund has entered into expense offset arrangements with Putnam Investor Services, Inc. and State Street whereby Putnam Investor Services, Inc.’s and State Street’s fees are reduced by credits allowed on cash balances. For the reporting period, the fund’s expenses were reduced by $111,049 under the expense offset arrangements.
Each Independent Trustee of the fund receives an annual Trustee fee, of which $877, as a quarterly retainer, has been allocated to the fund, and an additional fee for each Trustees meeting attended. Trustees also are reimbursed for expenses they incur relating to their services as Trustees.
The fund has adopted a Trustee Fee Deferral Plan (the Deferral Plan) which allows the Trustees to defer the receipt of all or a portion of Trustees fees payable on or after July 1, 1995. The deferred fees remain invested in certain Putnam funds until distribution in accordance with the Deferral Plan.
The fund has adopted an unfunded noncontributory defined benefit pension plan (the Pension Plan) covering all Trustees of the fund who have served as a Trustee for at least five years and were first elected prior to 2004. Benefits under the Pension Plan are equal to 50% of the Trustee’s average annual attendance and retainer fees for the three years ended December 31, 2005. The retirement benefit is payable during a Trustee’s lifetime, beginning the year following retirement, for the number of years of service through December 31, 2006. Pension expense for the fund is included in Trustee compensation and expenses in the Statement of operations. Accrued pension liability is included in Payable for Trustee compensation and expenses in the Statement of assets and liabilities. The Trustees have terminated the Pension Plan with respect to any Trustee first elected after 2003.
The fund has adopted distribution plans (the Plans) with respect to the following share classes pursuant to Rule 12b–1 under the Investment Company Act of 1940. The purpose of the Plans is to compensate Putnam Retail Management Limited Partnership, an indirect wholly-owned subsidiary of Putnam Investments, LLC, for services provided and expenses incurred in distributing shares of the fund. The Plans provide payments by the fund to Putnam Retail Management Limited Partnership at an annual rate of up to the following amounts (Maximum %) of the average net assets attributable to each class. The Trustees have approved payment by the fund at the following annual rate (Approved %) of the average net assets attributable to each class. During the reporting period, the class-specific expenses related to distribution fees were as follows:
Maximum % Approved % Amount
Class A 0.35 % * $2,340,126
Class B 1.00 % 0.85 % 25,538
Class C 1.00 % 1.00 % 427,535
Class M 1.00 % 0.50 % 14,108
Total $2,807,307
* Equals the weighted average of (i) 0.20% of the net assets of the fund attributable to class A shares purchased and paid for prior to April 1, 2005 and (ii) 0.25% of all other net assets of the fund attributable to class A shares.
48 California Tax Exempt Income Fund
For the reporting period, Putnam Retail Management Limited Partnership, acting as underwriter, received net commissions of $32,182 and $3 from the sale of class A and class M shares, respectively, and received $724 and $10 in contingent deferred sales charges from redemptions of class B and class C shares, respectively.
A deferred sales charge of up to 1.00% is assessed on certain redemptions of class A shares. For the reporting period, Putnam Retail Management Limited Partnership, acting as underwriter, received $4 on class A redemptions.
Note 3: Purchases and sales of securitiesDuring the reporting period, the cost of purchases and the proceeds from sales, excluding short-term investments, were as follows:
Cost of purchases Proceeds from sales
Investments in securities (Long-term ) $464,677,662 $565,905,248
U.S. government securities (Long-term ) — —
Total $464,677,662 $565,905,248
The fund may purchase or sell investments from or to other Putnam funds in the ordinary course of business, which can reduce the fund’s transaction costs, at prices determined in accordance with SEC requirements and policies approved by the Trustees. During the reporting period, purchases or sales of long-term securities from or to other Putnam funds, if any, did not represent more than 5% of the fund’s total cost of purchases and/or total proceeds from sales.
Note 4: Capital sharesAt the close of the reporting period, there were an unlimited number of shares of beneficial interest autho-rized. Transactions, including, if applicable, direct exchanges pursuant to share conversions, in capital shares were as follows:
YEAR ENDED 9/30/18 YEAR ENDED 9/30/17
Class A Shares Amount Shares Amount
Shares sold 7,848,927 $63,506,543 9,907,234 $80,309,915
Shares issued in connection with reinvestment of distributions 3,245,513 26,146,918 3,727,164 30,101,227
Net increase 1,054,861 $8,620,757 926,458 $7,594,167
At the close of the reporting period, Putnam Investments, LLC owned 1,262 class R6 shares of the fund (99.84% of class R6 shares outstanding), valued at $10,058.
Note 5: Market, credit and other risksIn the normal course of business, the fund trades financial instruments and enters into financial transactions where risk of potential loss exists due to changes in the market (market risk) or failure of the contracting party to the transaction to perform (credit risk). The fund may be exposed to additional credit risk that an institution or other entity with which the fund has unsettled or open transactions will default. The fund focuses a majority of its investments in the state of California and may be affected by economic and political developments in that state.
Federal tax information (Unaudited)
The fund has designated 96.63% of dividends paid from net investment income during the reporting period as tax exempt for Federal income tax purposes.
The Form 1099 that will be mailed to you in January 2019 will show the tax status of all distributions paid to your account in calendar 2018.
About the TrusteesINDEPENDENT TRUSTEES
Liaquat Ahamed Born 1952, Trustee since 2012Principal occupations during past five years: Pulitzer Prize-winning author of Lords of Finance: The Bankers Who
Broke the World, whose articles on economics have appeared in such publications as the New York Times, Foreign Affairs, and the Financial Times. Trustee of the Brookings Institution.
Other directorships: The Rohatyn Group, an emerging-market fund complex that manages money for institutions
Ravi AkhouryBorn 1947, Trustee since 2009Principal occupations during past five years: Trustee of the Rubin Museum. From 1992 to 2007, was Chairman and
CEO of MacKay Shields, a multi-product investment management firm.
Other directorships: English Helper, Inc., a private software company
Barbara M. Baumann Born 1955, Trustee since 2010Principal occupations during past five years: President and Owner of Cross Creek Energy Corporation, a strategic
consultant to domestic energy firms and direct investor in energy projects. Current Board member of The Denver Foundation. Former Chair and current Board member of Girls Incorporated of Metro Denver. Member of the Finance Committee, the Children’s Hospital of Colorado.
Other directorships: Buckeye Partners, L.P., a publicly traded master limited partnership focused on pipeline transport, storage, and distribution of petroleum products; Devon Energy Corporation, a leading independent natural gas and oil exploration and production company
Katinka DomotorffyBorn 1975, Trustee since 2012Principal occupations during past five years: Voting member of the Investment Committees of the Anne Ray Charitable
Trust and Margaret A. Cargill Foundation, part of the Margaret A. Cargill Philanthropies. Until 2011, Partner, Chief Investment Officer, and Global Head of Quantitative Investment Strategies at Goldman Sachs Asset Management.
Other directorships: Great Lakes Science Center; College Now Greater Cleveland
Catharine Bond HillBorn 1954, Trustee since 2017Principal occupations during past five years: Managing Director of Ithaka S+R, a not-for-profit service that helps
the academic community navigate economic and technological change. From 2006 to 2016, served as the 10th President of Vassar College. Prior to 2006, was Provost of Williams College.
Other directorships: Director of Yale-NUS College; Alumni Fellow to the Yale Corporation
Dr. Paul L. JoskowBorn 1947, Trustee since 1997Principal occupations during past five years: Elizabeth and James Killian Professor of Economics, Emeritus at the
Massachusetts Institute of Technology (MIT). Until 2017, President of the Alfred P. Sloan Foundation, a philanthropic institution focused primarily on research and education issues related to science, technology, and economic performance. Prior to 2007, served as the Director of the Center for Energy and Environmental Policy Research at MIT. Prior to 1998, served as Head of the Department of Economics at MIT.
Other directorships: Yale University; Exelon Corporation, an energy company focused on power services; Boston Symphony Orchestra; Prior to April 2013, served as Director of TransCanada Corporation and TransCanada Pipelines Ltd., energy companies focused on natural gas transmission, oil pipelines and power services
50 California Tax Exempt Income Fund
Kenneth R. LeiblerBorn 1949, Trustee since 2006 Vice Chair from 2016 to 2018, and Chair since 2018Principal occupations during past
five years: Founder and former Chairman of Boston Options Exchange, an electronic marketplace for the trading of derivative securities. Vice Chair Emeritus of the Board of Trustees of Beth Israel Deaconess Hospital in Boston, Massachusetts, and former Director of Beth Israel Deaconess Care Organization. Until November 2010, Director of Ruder Finn Group, a global communications and advertising firm.
Other directorships: Eversource Corporation, which operates New England’s largest energy delivery system
Robert E. PattersonBorn 1945, Trustee since 1984Principal occupations during past five years: Co-Chairman of Cabot Properties, Inc., a private equity firm
investing in commercial real estate, and Chairman or Co-Chairman of the Investment Committees for various Cabot Funds. Past Chairman and Trustee of the Joslin Diabetes Center.
George Putnam, IIIBorn 1951, Trustee since 1984Principal occupations during past five years: Chairman of New Generation Research, Inc., a publisher of financial
advisory and other research services. Founder and President of New Generation Advisors, LLC, a registered investment advisor to private funds. Director of The Boston Family Office, LLC, a registered investment advisor.
Manoj P. SinghBorn 1952, Trustee since 2017Principal occupations during past five years: Until 2015, Chief Operating Officer and Global Managing Director at
Deloitte Touche Tohmatsu, Ltd., a global professional services organization. Served on the Deloitte U.S. Board of Directors and the boards of Deloitte member firms in China, Mexico, and Southeast Asia.
Other directorships: Director of Abt Associates, a global research firm focused on health, social and environmental policy, and international development. Trustee of Carnegie Mellon University. Trustee of Rubin Museum of Art. Director of Pratham USA, an organization dedicated to children’s education in India. Member of the Advisory Board of Altimetrik, a business transformation and technology solutions firm. Director of DXC Technology, a global IT services and consulting company
INTERESTED TRUSTEE
Robert L. Reynolds*
Born 1952, Trustee since 2008 and President of the Putnam Funds since 2009
Principal occupations during past five years: President and Chief Executive
Officer of Putnam Investments since 2008 and, since 2014, President and Chief Executive Officer of Great-West Financial, a financial services company that provides retirement savings plans, life insurance, and annuity and executive benefits products, and of Great-West Lifeco U.S. Inc., a holding company that owns Putnam Investments and Great-West Financial. Prior to joining Putnam Investments, served as Vice Chairman and Chief Operating Officer of Fidelity Investments from 2000 to 2007.
* Mr. Reynolds is an “interested person” (as defined in the Investment Company Act of 1940) of the fund and Putnam Investments. He is President and Chief Executive Officer of Putnam Investments, as well as the President of your fund and each of the other Putnam funds.
The address of each Trustee is 100 Federal Street, Boston, MA 02110.
As of September 30, 2018, there were 100 Putnam funds. All Trustees serve as Trustees of all Putnam funds.
Each Trustee serves for an indefinite term, until his or her resignation, retirement at age 75, removal, or death.
California Tax Exempt Income Fund 51
The principal occupations of the officers for the past five years have been with the employers as shown above, although in some cases they have held different positions with such employers. The address of each officer is 100 Federal Street, Boston, MA 02110.
OfficersIn addition to Robert L. Reynolds, the other officers of the fund are shown below:
Jonathan S. Horwitz (Born 1955)Executive Vice President, Principal Executive Officer, and Compliance LiaisonSince 2004
Robert T. Burns (Born 1961)Vice President and Chief Legal OfficerSince 2011General Counsel, Putnam Investments, Putnam Management, and Putnam Retail Management
James F. Clark (Born 1974)Vice President and Chief Compliance OfficerSince 2016Chief Compliance Officer, Putnam Investmentsand Putnam Management
Michael J. Higgins (Born 1976)Vice President, Treasurer, and ClerkSince 2010
Janet C. Smith (Born 1965)Vice President, Principal Financial Officer, Principal Accounting Officer, and Assistant TreasurerSince 2007Head of Fund Administration Services, Putnam Investments and Putnam Management
Susan G. Malloy (Born 1957)Vice President and Assistant TreasurerSince 2007Head of Accounting, Middle Office, & Control Services, Putnam Investments and Putnam Management
Mark C. Trenchard (Born 1962)Vice President and BSA Compliance OfficerSince 2002Director of Operational Compliance, Putnam Investments and Putnam Retail Management
Nancy E. Florek (Born 1957)Vice President, Director of Proxy Voting and Corporate Governance, Assistant Clerk, and Assistant TreasurerSince 2000
Denere P. Poulack (Born 1968)Assistant Vice President, Assistant Clerk, and Assistant TreasurerSince 2004
52 California Tax Exempt Income Fund
Fund informationFounded over 80 years ago, Putnam Investments was built around the concept that a balance between risk and reward is the hallmark of a well-rounded financial program. We manage funds across income, value, blend, growth, sustainable, asset allocation, absolute return, and global sector categories.
Investment ManagerPutnam Investment Management, LLC 100 Federal Street Boston, MA 02110
Investment Sub-AdvisorPutnam Investments Limited 16 St James’s Street London, England SW1A 1ER
Marketing ServicesPutnam Retail Management 100 Federal Street Boston, MA 02110
CustodianState Street Bank and Trust Company
Legal CounselRopes & Gray LLP
Independent Registered Public Accounting FirmKPMG LLP
TrusteesKenneth R. Leibler, Chair Liaquat Ahamed Ravi Akhoury Barbara M. Baumann Katinka Domotorffy Catharine Bond Hill Paul L. Joskow Robert E. Patterson George Putnam, III Robert L. Reynolds Manoj P. Singh
OfficersRobert L. Reynolds President
Jonathan S. Horwitz Executive Vice President, Principal Executive Officer, and Compliance Liaison
Robert T. Burns Vice President and Chief Legal Officer
James F. Clark Vice President and Chief Compliance Officer
Michael J. Higgins Vice President, Treasurer, and Clerk
Janet C. Smith Vice President, Principal Financial Officer, Principal Accounting Officer, and Assistant Treasurer
Susan G. Malloy Vice President and Assistant Treasurer
Mark C. Trenchard Vice President and BSA Compliance Officer
Nancy E. Florek Vice President, Director of Proxy Voting and Corporate Governance, Assistant Clerk, and Assistant Treasurer
Denere P. Poulack Assistant Vice President, Assistant Clerk, and Assistant Treasurer
This report is for the information of shareholders of Putnam California Tax Exempt Income Fund. It may also be used as sales literature when preceded or accompanied by the current prospectus, the most recent copy of Putnam’s Quarterly Performance Summary, and Putnam’s Quarterly Ranking Summary. For more recent performance, please visit putnam.com. Investors should carefully consider the invest-ment objectives, risks, charges, and expenses of a fund, which are described in its prospectus. For this and other information or to request a prospectus or summary prospectus, call 1-800-225-1581 toll free. Please read the prospectus carefully before investing. The fund’s Statement of Additional Information contains additional information about the fund’s Trustees and is available without charge upon request by calling 1-800-225-1581.