48
CALIFORNIA’S BIOLOGICAL ASSESSMENT PROGRAM April 5, 2005 Jim Harrington WPCL Bioassessment Laboratory
| Date post: | 31-Dec-2015 |
| Category: |
Documents |
| Upload: | zephania-houston |
| View: | 27 times |
| Download: | 2 times |
CALIFORNIA’S BIOLOGICALASSESSMENT PROGRAM
April 5, 2005Jim HarringtonWPCL Bioassessment Laboratory

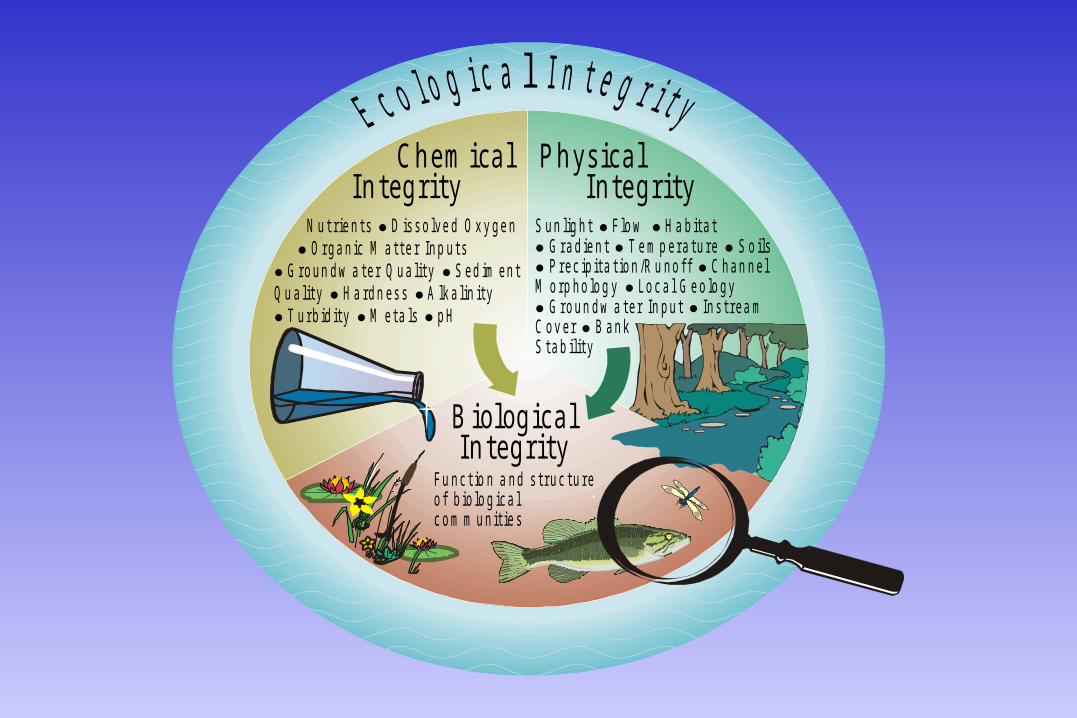
P hysi calI ntegr i ty
B iologicalI ntegr i ty
C hem icalI ntegr i ty
P hysical I ntegr i ty
B iologicalI ntegri ty
ChemicalI ntegri ty
l
N u t r ie n t s D is s o lv e d O x y g e n O r g a n ic M a t t e r I n p u t s
G r o u n d w a t e r Q u a l it y S e d im e n tQ u a l it y H a rd n e s s A lk a l in it y
T u r b id it y M e t a ls p H
S u n l ig h t F lo w H a b it a t G r a d ie n t T e m p e r a t u r e
C h a n n e l M o rp h o lo g y L o c a l G e o lo g y
G r o u n d w a t e r I n p u t I n s t r e a m C o v e r
S o i lsP r e c ip it a t io n /R u n o ff
B a n k S t a b i l i t y
F u n c t io n a n d s t r u c t u r e o f b io lo g ic a l c o m m u n it ie s


Integrates the effects of water quality over time
Advantages of Bioassessment
Sensitive to multiple aspects of water and habitat quality
Provides the public with a more familiarexpressions of ecological health

Adds a more direct assessment of ecological health since it measures the biological communities that live in aquatic systems
Advantages of Bioassessment
Better defines the effects of point source discharges and provides more relevant measures to evaluate discharges of non-chemical substances (e.g. sediment, flow augmentation and habitat alteration)
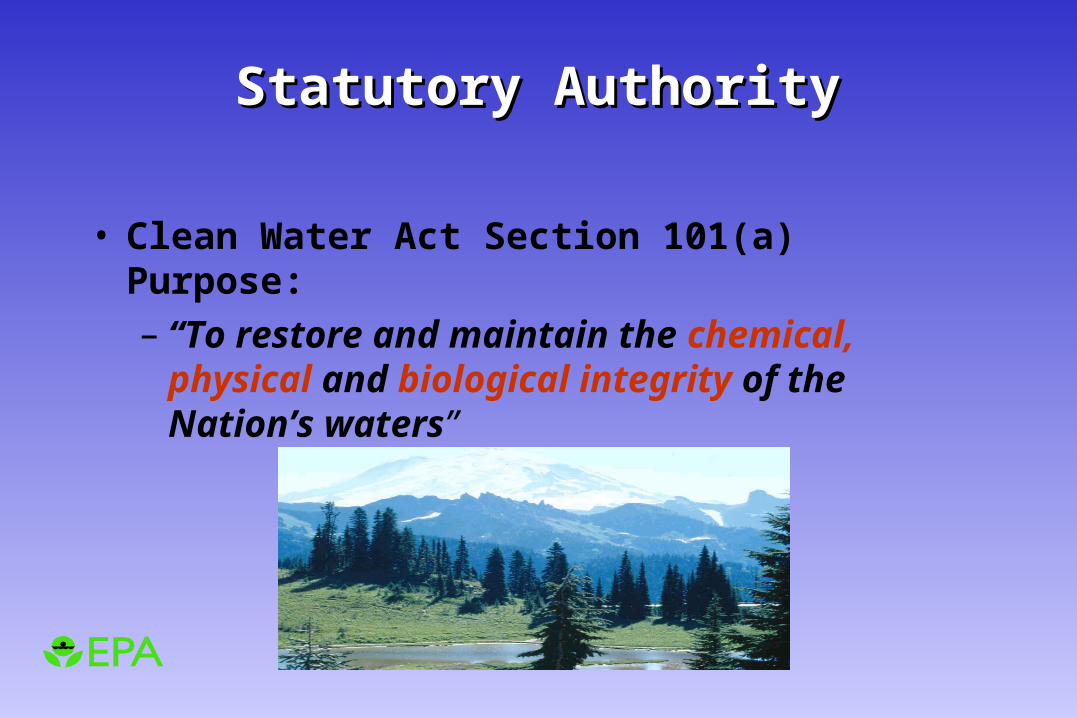
Statutory AuthorityStatutory Authority
• Clean Water Act Section 101(a) Purpose:– “To restore and maintain the
chemical, physical and biological integrity of the Nation’s waters”

Use of Bioassessment in Water Quality Monitoring
Bioassessment
Data
Water Quality Standards and
Criteria(CWA §303c)
Aquatic Life Use Assessments(CWA §305b)
Comprehensive Watershed
Assessments
Evaluation and Permitting of Habitat
Modifications(CWA §404)
Hazardous Waste Site
Assessments(CWA §104e)
Comprehensive Risk
Assessment
Nonpoint Source Assessment(CWA §319)
Listing of Impaired Waters
(CWA §303d)
Wet Weather Discharge (CSOs,
Stormwater)
Point Source
Discharge Permitting(CWA §402)
Marine Protection
and Sanctuaries Act– Ocean Dumping (MPRSA)
Sewage Treatment
Plant Discharges in Marine Waters(CWA
§301h)
Marine Point
Source Discharge Permitting
(CWA §403c)

Stressor Identification
Identifying Unknown causes of biological impairment
How Do We Do Bioassessments

Florida’s BioassessmentProgram
Florida Department of Environmental Protection

12
Bioassessment Program Steps
1. Classify environments (e.g., regionalization)2. Standardize sampling methods3. Develop assessment approach (IBI)4. Perform biological surveys5. Select metrics (positive biological signals)6. Incorporate Quality Assurance activities7. Incorporate training and testing
(certification)8. Integrate into programs9. Report results (Ecosummaries)10. Revise biocriteria

Streams and Wadeable Rivers
=developing basic bioassessment program
=basic bioassessment program in place
=developing quantitative biocriteria
=quantitative biocriteria adopted in or implemented through water quality standards
May be next
May be next

How Do We Do BioassessmentsIn California

Benthic Macroinvertebrates
Ubiquitous
Relatively stationary
Their large species diversity providesa spectrum of responses to environmental stresses

CaddisfliesCaddisflies
MayfliesMayflies
StonefliesStoneflies
Dragonflies and DamselfliesDragonflies and Damselflies
Sensitive Organisms in StreamsSensitive Organisms in Streams
Expected Response to Stress: abundance & proportionExpected Response to Stress: abundance & proportion

MidgesMidgesLeechesLeeches
SnailsSnailsScudsScuds
Tolerant Organisms in StreamsTolerant Organisms in Streams
Expected Response to Stress: abundance & proportionExpected Response to Stress: abundance & proportion

Rapid Biological AssessmentCalifornia Stream Bioassessment Procedure (CSBP)
for High and Low Gradient Streams
Benthic Macroinvertebraes
Riffle Habitat for High Gradient Streams
Multi-habitat for LowGradient Streams
Other Protocols for Historic Projects
Cost effective

U.S. EPA RBPQuantify: Canopy Cover Stream Size Substrate Flow
Rapid Biological Assessment
Rapid Physical/Habitat

>2500 DFG sites
Many More UsingCSBP

Application of a benthic invertebrate
IBI to regional 305(b) reporting in southern California
Peter R. Ode, Andrew C. Rehn and Jason T. MayPeter R. Ode, Andrew C. Rehn and Jason T. May
Aquatic Bioassessment LaboratoryAquatic Bioassessment LaboratoryWater Pollution Control Laboratory Water Pollution Control Laboratory
California Department of Fish and GameCalifornia Department of Fish and GameCalifornia State University, ChicoCalifornia State University, Chico

Existing Data: EPA’s EMAP (2000-2002; multiple methods):
CSBP- targeted riffle EMAP- multihabitatUSFS/Hawkins- targeted riffle
USFS (2000, 2001, Hawkins method) CSBP (2000-2002, multiple programs)
Regions 3, 4, 7, 8, 9

Development set (75% of sites) to create IBI
Validation set (25% of sites) to test IBI
66 sites
140 sites
47 sites
22 sites

Index Development ApproachIndex Development Approach(SoCal IBI)(SoCal IBI)
62 Candidate Metrics
Range Test(range at least 0 – 2)
Signal:Noise Test(S:N variance ratio > 3)
13 Metrics Eliminated 22 Metrics Eliminated
Redundancy Test(Pearson Coefficient
< 0.75)
10 Metrics Eliminated
Correction for Natural Variability
0 Metrics Corrected
ResponsivenessTest
7 Final Metrics
10 Metrics Eliminated

SoCal IBI ScoresN_Coleop_T N_EPT_T N_Pred_T P_CFCG_I P_Int_I P_NonIns_T P_Tol_T Metric
Score All Sites 6 8 All Sites 6 8 6 8 All Sites All Sites
10 >5 >17 >18 >12 0-59 0-39 25-100 42-100 0-8 0-4
9 16-17 17-18 12 60-63 40-46 23-24 37-41 9-12 5-8
8 5 15 16 11 64-67 47-52 21-22 32-36 13-17 9-12
7 4 13-14 14-15 10 68-71 53-58 19-20 27-31 18-21 13-16
6 11-12 13 9 72-75 59-64 16-18 23-26 22-25 17-19
5 3 9-10 11-12 8 76-80 65-70 13-15 19-22 26-29 20-22
4 2 7-8 10 7 81-84 71-76 10-12 14-18 30-34 23-25
3 5-6 8-9 6 85-88 77-82 7-9 10-13 35-38 26-29
2 1 4 7 5 89-92 83-88 4-6 6-9 39-42 30-33
1 2-3 5-6 4 93-96 89-94 1-3 2-5 43-46 34-37
0 0 0-1 0-4 0-3 97-100 95-100 0 0-1 47-100 38-100
Very Poor Poor Fair Good Very Good
0-14 15-28 29-42 43-56 57-70 Biological metrics for IBI Number of coleopteran taxa Number of EPT taxa Number of Predator taxa Percent collector filterers and collector gatherers Percent Intolerant Individuals Percent non-insect taxa Percent tolerant taxa

Very Good

Good
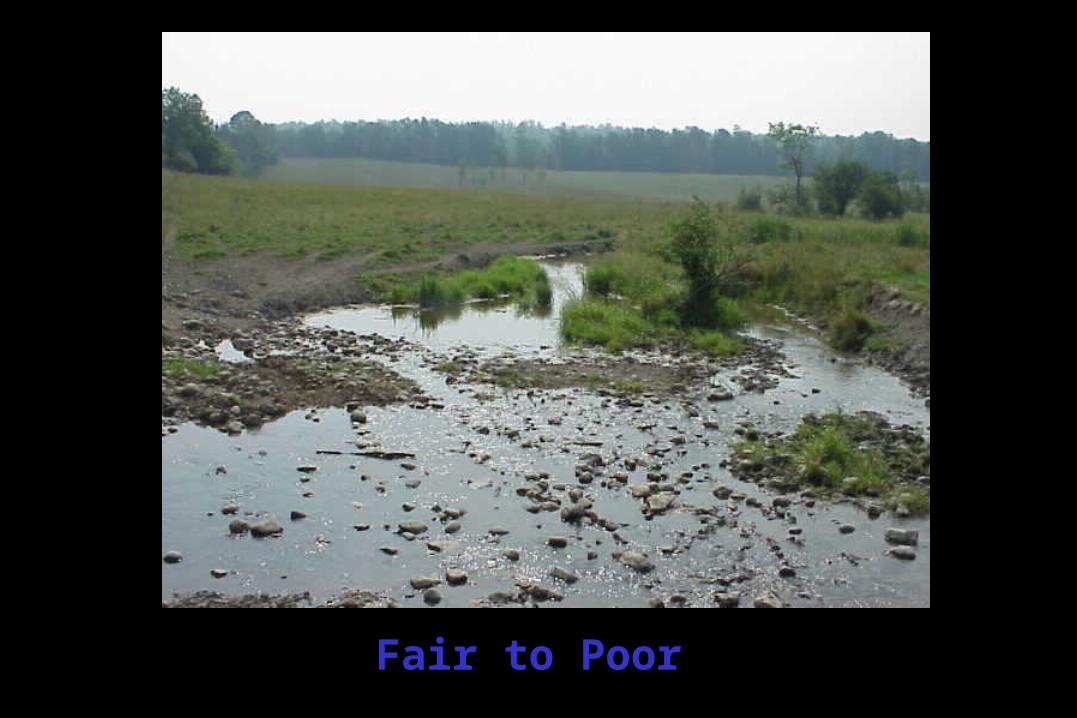
Fair to Poor

Very Poor
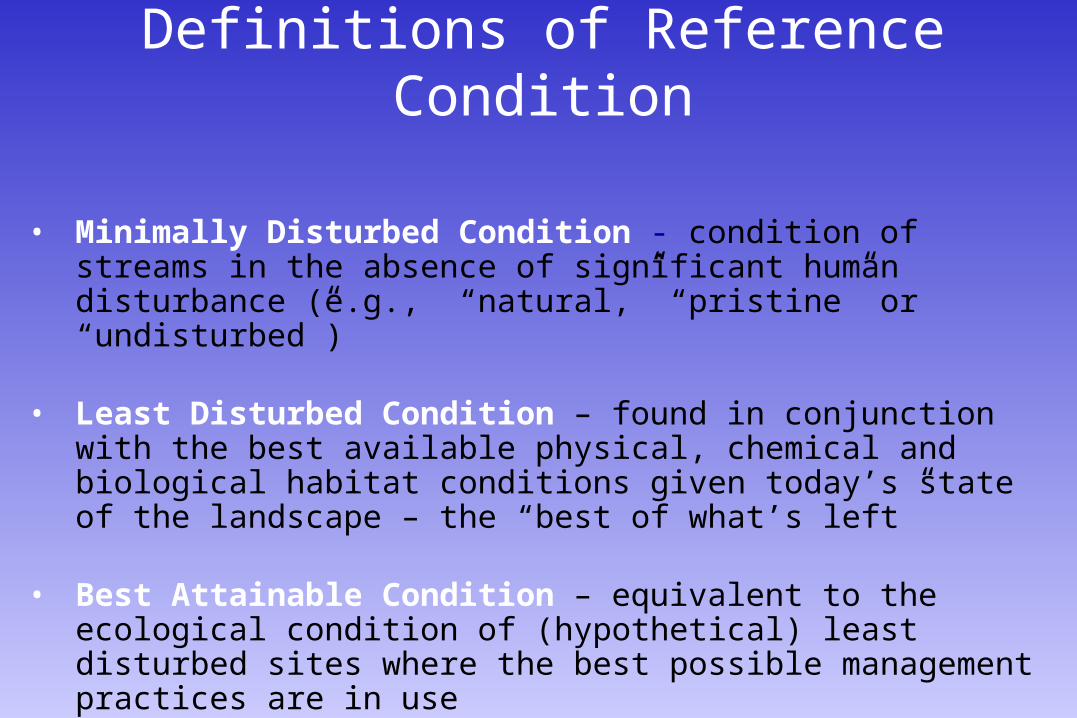
Definitions of Reference Condition
• Minimally Disturbed Condition - condition of streams in the absence of significant human disturbance (e.g., “natural,” “pristine” or “undisturbed”)
• Least Disturbed Condition – found in conjunction with the best available physical, chemical and biological habitat conditions given today’s state of the landscape – the “best of what’s left”
• Best Attainable Condition – equivalent to the ecological condition of (hypothetical) least disturbed sites where the best possible management practices are in use

Sierra Foothill EcoregionSierra Foothill Ecoregion
Reference SitesReference Sites
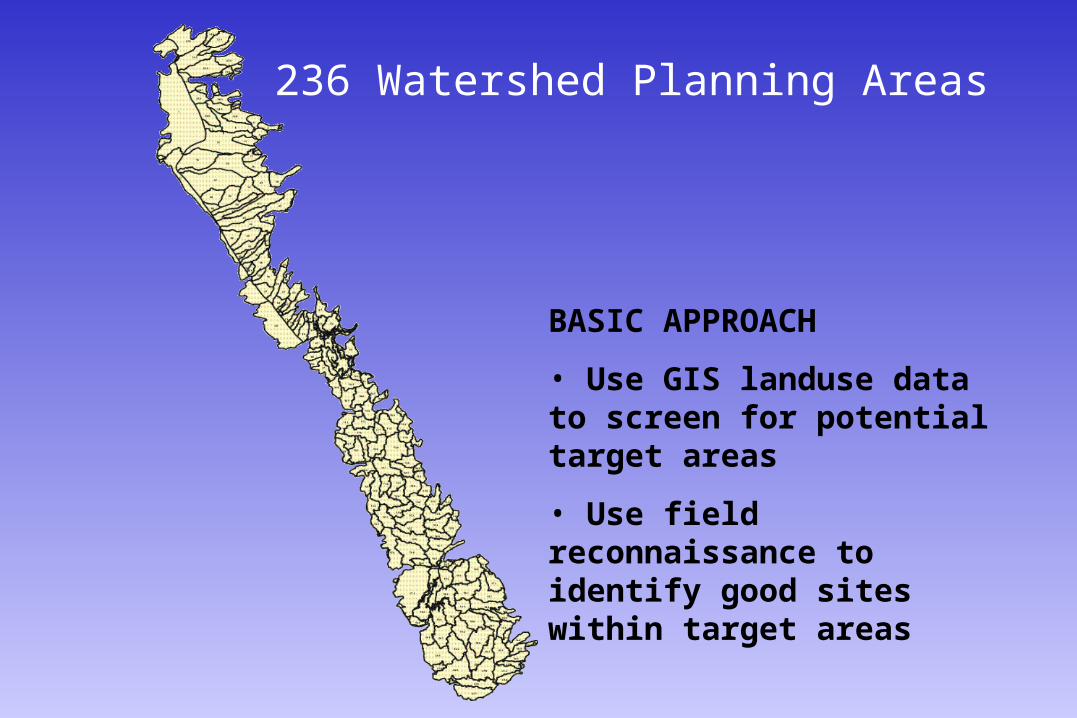
236 Watershed Planning Areas
BASIC APPROACH
• Use GIS landuse data to screen for potential target areas
• Use field reconnaissance to identify good sites within target areas

National Landcover Database (NLCD)
•Identifies different types of landuse at a resolution of 30 meter pixels •Based on Landsat 1992 imagery •USGS and EPA joint developed

Flow ConditionsHabitat ConditionsLocal Landscape AssessmentOwnershipAccess Issues
Rapid Reconnaissance:
154 sites reviewed

Final Reference Sites
1st Order Streams - 72nd Order Streams - 8 3rd Order Streams - 114th Order Streams - 4

California Regional WaterQuality Control Boards
1
2
3
4
5a
5b
5c 6
78
9
How Do We UseBioassessment Data

BIO
LO
GIC
AL
CO
ND
ITIO
N
STRESSOR GRADIENT (Dominant Land Use)
Historic
Pre-Colombian
Minimally Disturbed
Least Disturbed/Best Attainable
---------------------CWA Interim Goal Threshold -------------------------------------
Natural Pristine
Prairie
Forested
Grazed
Agricultural
Urban
Mining/ Industrial
“As Naturally Occurs”
Biological Integrity
Supports CWA Interim Goal*
Nonattainment of CWA Interim Goal
Curve Colors
*Protection & Propagation of Fish, Shellfish and Wildlife


Hypothetical Subcategorized Biologically-BasedAquatic Life Uses
Designated Uses
Bio
log
ical C
on
dit
ion
IBI = 60
IBI = 50
IBI = 40
IBI = 30
IBI = 20
IBI = 10
Cold water salmon fishery/natural spawning
Cold water salmon nursery/rookery
Cold water salmon passage
Seasonal cold water salmon passage
Habitat restoration
Limited aquatic life habitat

Bio
logi
cal C
ond
itio
n
Designated Aquatic Life Uses: Ohio Example
Increasing Effect of Human Activity
Warmwater Habitat:… comparable to the 25%ile of ecoregional reference sites
Limited Resource Waters: lack potential … substantially degraded….irretrievable habitat modifications
Modified Warm Water Habitat: …irretrievable, human modifications of physical habitat …
Exceptional Warmwater Habitat: an unusual, balanced integrated community of organisms having a species composition, diversity & functional composition comparable to 75% of statewide ref sites.
11
44
66
55
22
33
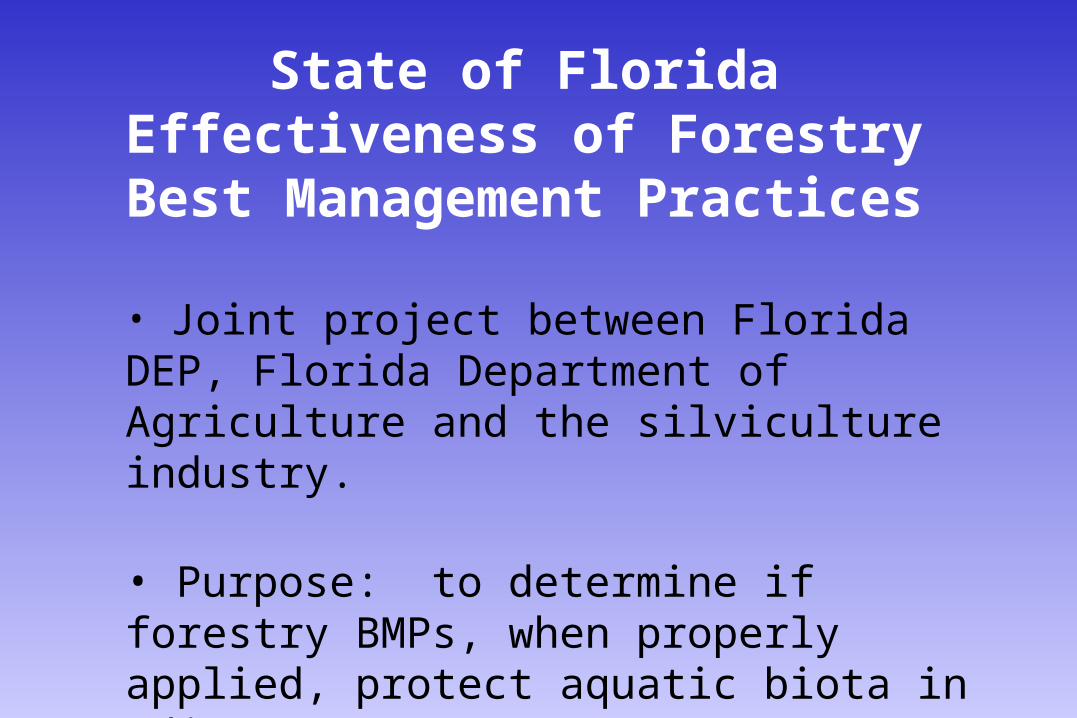
State of FloridaEffectiveness of Forestry
Best Management Practices
• Joint project between Florida DEP, Florida Department of Agriculture and the silviculture industry.
• Purpose: to determine if forestry BMPs, when properly applied, protect aquatic biota in adjacent streams

Examples of forestry BMPs
• Undisturbed buffer zone (SMZ)• Site preparation to prevent erosion• Control fertilizers and pesticides• Design roads/drainage easements
for minimum erosion/deposition

Experimental DesignExperimental Design
ReferenceSite
Test Site
A
B
C
A
B
CProposed SilvicultureArea
Flow
1996
ReferenceSite
Test Site
A
B
C
A
B
C
Silviculturewith BMPs
Flow
1997, 1998
BeforeBeforeSilvicultureSilvicultureActivitiesActivities
AfterAfterSilvicultureSilvicultureActivitiesActivities

San Julia SCI ResultsSan Julia SCI Results
R 96 T 96 R 97 T 97 R 98 T 98
0
5
10
15
20
25
30
35
Clearcutting (3 & 4-96),Site Prep (9-96), Replanting (1-97)
Good
Excellent
No significant time or treatment differences

Bio
logi
cal
Con
dit
ion
The Biological Condition Gradient
Increasing Effect of Human Activity
Natural structure and function of biotic community maintained
Minimal changes in structure & function
Evident changes in structure and minimal changes in function
Moderate changes in structure & minimal changes in function
Major changes in structure & moderate changes in function
Severe changes in structure & function
1122
33
44
55
66

Get to Know Your Mayflies

AndyourBeetles

Thanks for Listening


