United States Department of Agriculture D E P A R TMENT O F AG RIC U L T U R E Forest Service Pacific Northwest Research Station General Technical Report PNW-GTR-994 December 2020 California’s Forest Products Industry and Timber Harvest, 2016 Kate C. Marcille, Todd A. Morgan, Chelsea P. McIver, and Glenn A. Christensen
Transcript
United States Department of Agriculture
DE
PAR TMENT OF AGRICULTU
RE
Forest Service
Pacific Northwest Research Station
General Technical Report PNW-GTR-994
December 2020
California’s Forest Products Industry and Timber Harvest, 2016Kate C. Marcille, Todd A. Morgan, Chelsea P. McIver, and Glenn A. Christensen
In accordance with Federal civil rights law and U.S. Department of Agriculture (USDA) civil rights regulations and policies, the USDA, its Agencies, offices, and employees, and institutions participating in or administering USDA programs are prohibited from discriminating based on race, color, national origin, religion, sex, gender identity (including gender expression), sexual orientation, disability, age, marital status, family/parental status, income derived from a public assistance program, political beliefs, or reprisal or retaliation for prior civil rights activity, in any program or activity conducted or funded by USDA (not all bases apply to all programs). Remedies and complaint filing deadlines vary by program or incident.
Persons with disabilities who require alternative means of communication for program information (e.g., Braille, large print, audiotape, American Sign Language, etc.) should contact the responsible Agency or USDA’s TARGET Center at (202) 720-2600 (voice and TTY) or contact USDA through the Federal Relay Service at (800) 877-8339. Additionally, program information may be made available in languages other than English.
To file a program discrimination complaint, complete the USDA Program Discrimination Complaint Form, AD-3027, found online at http://www.ascr.usda.gov/complaint_filing_cust.html and at any USDA office or write a letter addressed to USDA and provide in the letter all of the information requested in the form. To request a copy of the complaint form, call (866) 632-9992. Submit your completed form or letter to USDA by: (1) mail: U.S. Department of Agriculture, Office of the Assistant Secretary for Civil Rights, 1400 Independence Avenue, SW, Washington, D.C. 20250-9410; (2) fax: (202) 690-7442; or (3) email: [email protected].
USDA is an equal opportunity provider, employer, and lender.
AuthorsKate C. Marcille is a forest economist, Chelsea P. McIver is a research social scientist, and Todd A. Morgan is director of the Forest Industry Research Program, Bureau of Business and Economic Research, University of Montana, Gallagher Business Building, 32 Campus Drive, Missoula, MT 59812; Glenn A. Christensen is a forester, U.S. Department of Agriculture, Forest Service, Pacific Northwest Research Station, Forestry Sciences Laboratory, 620 SW Main Street, Suite 502, Portland, OR 97205.
Cover: (top row) Multi-age California timber and forestlands, and active California logging site; (middle row) redwood stand in Northern California, decked logs and log sorter in California mill yard, and redwood logs and finished fence boards; (bottom row) mill residual piles at California biomass energy facility, tree tops and logging slash pile, and cants being processed in a California mill. All photos by the Univer-sity of Montana Bureau of Business and Economic Research.
AbstractMarcille, Kate C.; Morgan, Todd A.; McIver, Chelsea P.; Christensen, Glenn
A. 2020. California’s forest products industry and timber harvest, 2016. Gen. Tech. Rep. PNW-GTR-994. Portland, OR: U.S. Department of Agriculture, For-est Service, Pacific Northwest Research Station. 58 p.
This report traces the flow of California’s 2016 timber harvest through the primary wood products industry and characterizes the structure, condition, and economic impacts of California’s forest products sector. Historical changes in the forest products industry are presented, as well as trends in timber harvest, production, sawmill capacity, mill residuals, and sales value. Also discussed are employment and worker earnings in the state’s primary and secondary forest products industries. Periodic survey data collected from the forest products industry provides detailed information on California’s timber resources, wood utilization, and the economic contributions of the industry to the state economy.
Highlights• A total of 80 primary forest products facilities operated in California dur-
ing 2016. These included 32 sawmills, 23 bioenergy plants, 12 bark and mulch facilities, 2 veneer plants, 1 particleboard plant, and 10 manufactur-ers of other primary wood products.
• California’s timber harvest was 1,572 million board feet (MMBF) Scribner in 2016, representing a 10 percent increase since 2012. More than 48 per-cent (759 MMBF) of the timber harvested came from five counties. Similar to 2012, Shasta County provided the largest proportion at 13 percent (208 MMBF) followed by Humboldt County at 11 percent (178 MMBF).
• About 80 percent of California’s 2016 timber harvest came from private lands, 17 percent from national forests, and the remaining 3 percent from other public sources. Nearly all (97 percent) of the timber harvested in California was processed within the state.
• About 27 percent of California’s 2016 timber harvest was comprised of true fir species, followed by Douglas-fir (24 percent), ponderosa pine (23 per-cent), and redwood (14 percent).
• More than 13 percent of the timber harvested in 2016 was dead. California’s large-scale tree mortality event during 2015 and 2016 led to increased report-ing of dead trees received by timber processors, up from 2 percent in 2012. Ponderosa pine—one of the species most affected by the bark beetle epi-demic—saw a 16 percent increase in reported dead volume from 2012 to 2016.
• Converting all inputs, outputs, and mill residuals to cubic feet allows for more complete accounting of wood fiber from harvest through primary processing. Of the 367 million cubic feet (MMCF) of wood fiber (exclud-ing bark) harvested in California in 2016, approximately 43 percent was used to generate energy, usually in the form of heat for steam or electricity. Another 32 percent of the volume became lumber, and the remaining 25 percent was used as raw material for a variety of other products.
• Total sales value for California’s primary forest products was about $1.5 bil-lion in 2016, with lumber accounting for 65 percent of the total reported prod-ucts. The majority (74 percent) of all primary forest products manufactured in California were sold in state. Two sectors—sawmills and bioenergy plants—accounted for more than 83 percent of the industry sales value in 2016.
• California sawmills produced more than 2,000 MMBF of lumber in 2016, accounting for more than 6 percent of U.S. production of softwood lumber and just over 4 percent of U.S. consumption.
• California’s forest products industry’s annual capacity to process sawtimber has continued to decrease, from 6,000 MMBF Scribner in the late 1980s to 1,870 MMBF in 2016 (up slightly from 1,780 MMBF in 2012). Of this total timber-processing capacity, 73 percent was utilized in 2016.
• In 2016, approximately 57,890 workers, earning $3.64 billion, were employed in California’s forest industry, including primary and secondary wood and paper products, private sector forestry and logging, and forestry support activities. Wood products manufacturing accounted for 50 percent of employ-ment and 38 percent of earnings within California’s overall forest industry.
• In addition to direct employment and income generated by California’s for-est industry, the University of Montana Bureau of Business and Economic Research estimated indirect and induced economic contributions for each sector of the industry. For example, the wood products manufacturing sec-tor alone supported more than 66,200 full- and part-time jobs (direct, indi-rect, and induced) and an associated $3.43 billion in labor income during 2016. For every wood products manufacturing job in California, another 1.3 jobs are supported in a related sector of the state economy.
• California’s primary wood-processing facilities produced nearly 2.1 mil-lion bone-dry tons (1.75 million bone-dry units) of residuals in 2016. Wood residuals accounted for 72 percent of total residual volume generated by primary processing facilities and bark constituted the remaining 28 percent of residuals.
• Nearly 58 percent of total residuals were utilized by the biomass energy sector, over 31 percent by the landscape bark and other products sector, and 11 percent by the reconstituted board sector; less than 1 percent of mill residuals went unutilized.
Contents 1 Introduction 1 Forest Industries Data Collection System 2 California’s Timber Harvest, Products, and Flow 3 California’s Timberlands 4 Harvest by Ownership 5 Harvest by Geographic Source 12 Harvest by Species 14 Harvest by Product Type 16 Product Type by Ownership Class 17 Product Type by Species 18 Timber Flow 23 End Uses of California’s 2016 Timber Harvest 28 California’s Forest Products Industry 30 Industry Concentrations 32 Sales Value, Product Markets, and Market Areas 35 Trends and Capacity by Sector 35 Sawmill Sector 36 Veneer and Plywood Sector 38 Residual-Utilizing Sector 38 Bioenergy Sector 40 Other Sectors 40 Input and Output Capacity 44 Lumber Recovery Factors and Overrun 45 Mill Residuals: Quantity, Type, and Use 48 Forest Industry Employment and Earnings 52 Economic Contribution of California’s Forest Industry 53 Acknowledgments 54 References
1
California’s Forest Products Industry and Timber Harvest, 2016
IntroductionThis report describes the utilization of California’s 2016 timber harvest and charac-terizes the condition, structure, and operation of the state’s primary forest products industry. Primary forest products manufacturers are firms that process timber into goods such as lumber or veneer, and facilities such as biomass power and particle-board plants that use low-value woody biomass removed from harvest sites or wood fiber residuals generated by timber-processing facilities. This report also describes recent and historical trends in the state’s timber use, including raw material sources, inventory, growth, and harvest. Other areas covered in this report include the extent and efficiency of California’s wood-processing infrastructure and the volume and value of finished products and residuals, as well as employment and sales trends across the forest industry.
A statewide census of California’s primary forest products manufacturers provided most of the information presented in this report. The industry census also included firms in adjacent states using raw material from California during the 2016 calendar year. The 2016 California forest products industry report focuses on changes within the state’s forest products industry since the 2012 census (McIver et al. 2015). For a more detailed discussion of historical trends in timber harvesting and processing for California, see McIver et al. (2015) and Morgan et al. (2004, 2012).
The University of Montana’s Bureau of Business and Economic Research (BBER) and the U.S. Department of Agriculture (USDA) Forest Service, Pacific Northwest (PNW) Research Station cooperated in the analysis and preparation of this report. BBER, in cooperation with the Forest Inventory and Analysis (FIA) program at the PNW Research Station, has been studying the region’s forest products industry since 1998. This report represents BBER’s fourth such study of California’s timber harvest and forest products industry since 2000.
Forest Industries Data Collection SystemIn cooperation with the FIA programs at the Rocky Mountain and PNW Research Stations, BBER developed the Forest Industries Data Collection System (FIDACS) to collect, compile, and disseminate state and county information on the operations of the forest products industry across the West.
Primary forest products firms operating in California in 2016 were identi-fied through various phone directories, industry associations, Internet searches, previous BBER censuses, and help from in-state cooperators. Through a written or electronic questionnaire, or via a telephone or in-person interview, information was collected from timber-processing and wood residual-utilizing facilities about their 2016 operations. Of the 80 primary wood-processing facilities operating in
2
GENERAL TECHNICAL REPORT PNW-GTR-994
California during 2016, about 64 percent responded to the inquiry and accounted for 77 percent of the state’s timber harvest volume. Each wood-processing facility completed a single questionnaire, which included the following information:• Plant location, production capacity, and employment• Volume and type of raw material received, by county and ownership• Species mix of timber received and live/dead proportions• Finished product volumes, types (including energy), sales value, and mar-
ket locations• Residual volume produced, and utilization and marketing of wood and
bark residuals
For those wood-processing facilities that did not return the questionnaire, a variety of sources were used to estimate values:• Current data collected for facilities of a similar size, product type, and location• Information on market trends and prices• Data from other sources, including the Western Wood Products Association
(WWPA 1964–2016) and Random Lengths (1976–2016)
Further, information from federal, state, and private sources was used to verify estimates of the total timber harvest, lumber production, employment, and sales value of products. Manufacturers who participated in the 2016 California forest industry census processed virtually all of the state’s commercial timber harvest.
Information collected through FIDACS is stored by BBER. Results and sum-mary tables are available online upon compilation and review (http://www.bber.umt.edu/fir). Key data from other sources are made available online to provide the most recent measures of general industry activity, and references to other publications characterizing forest industry conditions are included. Additional information is available by request. However, individual firm-level data are confidential and will not be released.
California’s Timber Harvest, Products, and FlowThis section discusses the ownership of California’s timberlands, historical trends in California’s timber harvest, and the wood products industry’s use of timber dur-ing 2016. It presents ownership and geographic sources of timber, species composi-tion, types of timber harvested and processed, utilization of harvested wood fiber, and flow of the timber both within the state of California and from California to other states and countries.
Timber harvest data are available from several sources, including the California Department of Tax and Fee Administration (annual) (CDTFA 2018) and the PNW Research Station (annual and periodic); these sources were used for historical
California’s Forest Products Industry and Timber Harvest, 2016
comparisons. However, the detailed harvest volumes presented in this report for 2016 are the result of a full census of California and out-of-state mills receiving timber harvested in California during 2016, as described in the “Forest Industries Data Collection System” section of this report. Differences may exist between the numbers published here and those published by other sources. These differences are the results of differing reporting units and conversion factors, rounding error, and scaling discrepancies among timber sellers (agencies and private owners) and between sellers and buyers, as well as other reporting variations.
California’s TimberlandsCalifornia has about 100 million ac of land area, of which 32 million ac (30 percent) are forested. Forest land is defined as “land that is at least 10 percent stocked by forest trees of any size, or land formerly having such tree cover, and not currently developed for a nonforest use” (Christensen et al. 2015, USDA FS 2019). Of the total forest land in California, private landowners hold 12.3 million ac (39 percent), national forest lands account for 15.3 million ac (48 percent), and other public lands account for 4.2 million ac (13 percent). About 16 million (52 percent) of the 32 million ac of forest land in California are classified as timberland. Timberland is forest land that is producing, or capable of producing, more than 20 cubic feet (ft3) of wood per acre per year at culmination of mean annual increment and excludes reserved lands, such as national parks and wilderness areas (Helms 1998). Within California, national forests contain 8.8 million ac (54 percent) of timberland, private landowners hold approxi-mately 7.2 million ac (44 percent), and other public landowners, including the U.S. Department of the Interior Bureau of Land Management and state and local govern-ments, hold the remaining 2 percent (less than 1 million ac) (USDA FS 2019).
California’s timberland contains approximately 335,000 million board feet (MMBF) Scribner of sawtimber (USDA FS 2015). Sawtimber is timber of “suf-ficient size and quality to be suitable for conversion into lumber” (Random Lengths 1993). Sawtimber volume is calculated from growing-stock trees that are at least 11 inches diameter at breast height (d.b.h.) for hardwoods, and 9 inches d.b.h. for softwoods. Measured in board feet Scribner, live sawtimber on timberland consists of 92 percent conifers and 8 percent hardwoods. By species, Douglas-fir (Pseu-dotsuga menziesii (Mirb.) Franco) accounts for 31 percent of the Scribner board foot sawtimber volume on timberland. Other species contributing the majority of volume on timberland are true firs (Abies spp.) (16 percent), ponderosa pine (Pinus ponderosa Dougl. ex Laws) and Jeffrey pine (Pinus jeffreyi Balf.) (18 percent), redwood (Sequoia sempervirens (D. Don) Endl.) (10 percent), and sugar pine (Pinus lambertiana Dougl.) (5 percent) (USDA FS 2015).
4
GENERAL TECHNICAL REPORT PNW-GTR-994
Harvest by Ownership The timber volume harvested in California during 2016 was nearly 1,600 MMBF Scribner (table 1), an increase of about 10 percent from the 2012 harvest of 1,400 MMBF and 9 percent less than the 2006 harvest of 1,700 MMBF (McIver et al. 2015, Morgan et al. 2012). The timber harvest during 2016 was almost 87 percent of the average volume of the previous 20 years, and less than 50 percent of the 50-year average.
Table 1—California’s timber harvest by ownership class, selected years
Public:National forest 15.0 13.0 14.3 16.9State 0.8 0.2 2.0 3.3Bureau of Land Management 0.3 0 0 0Other public 0 0 0 0.2
16.2 13.2 16.3 20.4
Total 100.0 100.0 100.0 100.0a Volume in Scribner log rule.Source: McIver et al. 2015; Morgan et al. 2004, 2012.
The timber volume harvested in California during 2016 was nearly 1,600 MMBF Scribner (table 1), an increase of about 10 percent from the 2012 harvest of 1,400 MMBF and 9 percent less than the 2006 harvest of 1,700 MMBF.
5
California’s Forest Products Industry and Timber Harvest, 2016
Timber harvested from California’s timberlands originated from three broad land ownership categories: industrial timberland, nonindustrial private forest land, and public lands. California’s timber harvest consisted largely of true firs, Douglas-fir, ponderosa pine, redwood, and sugar pine.
Private lands have been the source of most of California’s timber harvest since the 1940s (fig. 1). During the private harvest declines of the 1960s, 1970s, and 1980s, timber harvested from national forests became increasingly important as a source of raw material for California’s forest products industry. Over the past three decades, both private and national forest timber harvests have declined, with reductions in harvest from national forests exceeding the reductions in harvest from private land. National forest timber offerings have declined since the 1980s for many reasons, including social, political, and legal constraints on harvesting. For more information on California’s historical timber harvest, refer to McIver et al. (2015) and Morgan et al. (2012).
The share of timber harvest from industrial private lands grew from about 54 percent in 2006 to 70 percent in 2012 and decreased to 67 percent in 2016. The share and total harvest from nonindustrial private lands decreased dramatically from 32 percent (556 MMBF) in 2006 to 13 percent (185 MMBF) in 2012 and maintained a similar proportion in 2016 despite total nonindustrial private harvest increasing to nearly 200 MMBF. Combined, the timber harvest from industrial and nonindustrial private lands in 2016 accounted for nearly 80 percent of the total harvest in California in 2016—down slightly from 83 percent in 2012. However, private timberlands account for nearly 44 percent of the total timberland in the state (fig. 2). The majority of timberland acres and sawtimber volume in the state are managed by the U.S. Forest Service and other public owners (e.g., the Bureau of Land Management and the state of California), but national forests and other public lands accounted for only 20 percent (321 MMBF) of the total 2016 harvest—up from 16 percent (232 MMBF) in 2012.
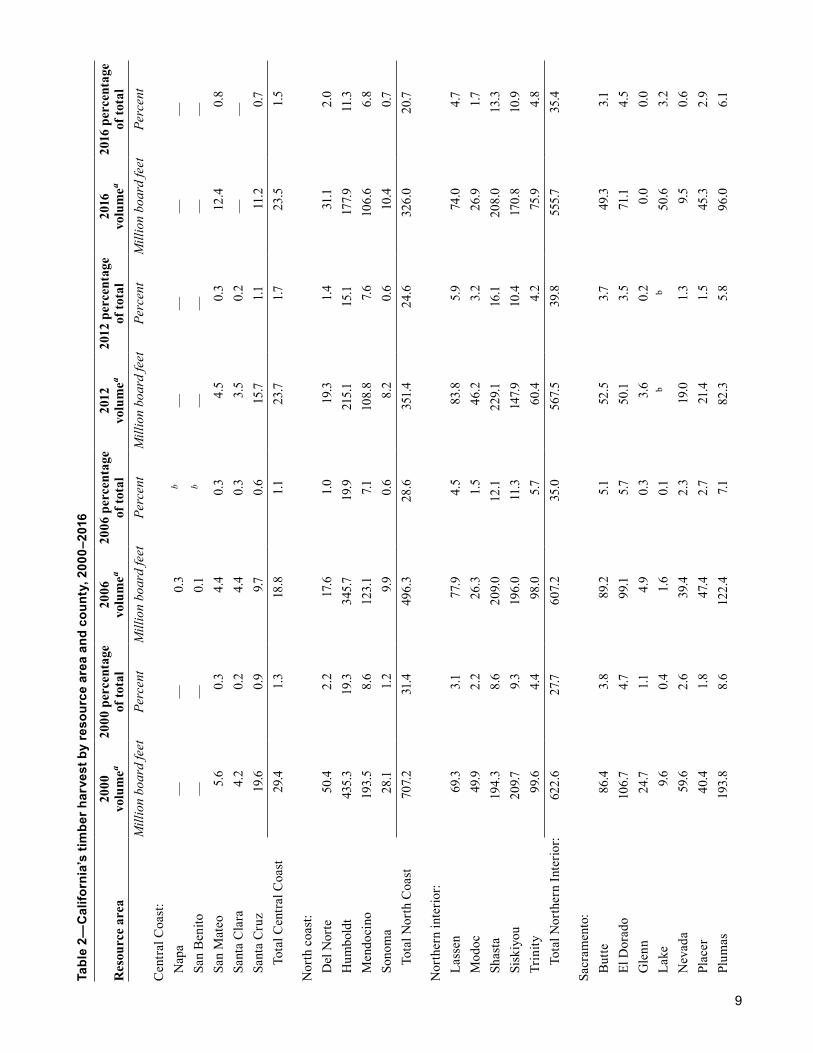
Harvest by Geographic SourceSix multicounty geographic resource areas are used to describe major wood-producing regions in California (fig. 3): North Coast, Northern Interior, Sacramento, San Joaquin, Central Coast, and Southern California. In 2016, nearly 86 percent (1,300 MMBF Scribner) of California’s total timber harvest came from the North Coast, Northern Interior, and Sacramento regions (table 2). Historically, these regions have provided more than 85 percent of California’s timber harvest (Barrette et al. 1970; California State Board of Equalization 1978–2017; Hiserote and Howard 1978; Howard 1974, 1984; Howard and Ward 1988, 1991; McIver et al. 2015; Mor-gan et al. 2004, 2012). Most of the remaining timber harvest volume came from the
6
GENERAL TECHNICAL REPORT PNW-GTR-994
0
1,000
2,000
3,000
4,000
5,000
6,000
7,000
1952
1954
1956
1958
1960
1962
1964
1966
1968
1970
1972
1974
1976
1978
1980
1982
1984
1986
1988
1990
1992
1994
1996
1998
2000
2002
2004
2006
2008
2010
2012
2014
2016
Tim
ber h
arve
st (m
illio
n bo
ard
feet
, Scr
ibne
r)
Year
National forests Bureau of Land Management Tribal State Private
Figure 1—California’s timber harvest by ownership class, 1952–2016.
7
California’s Forest Products Industry and Timber Harvest, 2016
San Joaquin region, accounting for 12.5 percent (198 MMBF) of the 2016 harvest, up from 9.5 percent (135 MMBF) during 2012.
Five counties in northern California accounted for 48 percent (759 MMBF) of California’s total timber harvest in 2016 (table 3). This represents a decrease in the proportional and total harvest contribution from 2012, when the top five counties in the state provided 55 percent (785 MMBF) of the total statewide harvest. As in 2012, Shasta County provided the largest proportion of California’s timber harvest in 2016 at 13 percent (208 MMBF) followed by Humboldt County at 11 percent (178 MMBF). Historically, Humboldt County provided the largest share of California’s timber harvest—around 20 percent of the annual total dating back to 1976—but was surpassed by Shasta County in 2012. Other California counties that have gener-ally been top timber producers include Mendocino, Plumas, Shasta, Siskiyou, and Trinity (Barrette et al. 1970; Hiserote and Howard 1978; Howard 1974, 1984; How-ard and Ward 1988, 1991; McIver et al. 2015; Morgan et al. 2004, 2012; Ward 1995, 1997). During 2016, timber harvest volumes were more evenly distributed across counties, with the top five counties providing decreasing proportional contributions to the overall state timber harvest.
53.6 57.8
16.9
2.83.1
3.5
43.6 39.1
79.6
100
90
80
70
60
50
40
30
20
10
0Timberland
areaSawtimber tree volume
Harvested volume
Ow
ners
hip
clas
s (p
erce
nt)
National forestOther publicPrivate and tribal
Timberland characteristic
Figure 2—Characteristics of California’s timberland by ownership class, 2016.
Shasta County provided the largest proportion of California’s timber harvest in 2016 at 13 percent (208 MMBF) followed by Humboldt County at 11 percent (178 MMBF).
8
GENERAL TECHNICAL REPORT PNW-GTR-994
Figure 3—California’s geographic resource areas.
9
Tabl
e 2—
Cal
iforn
ia’s
tim
ber h
arve
st b
y re
sour
ce a
rea
and
coun
ty, 2
000–
2016
(con
tinue
d)
Res
ourc
e ar
ea20
00
volu
mea
2000
per
cent
age
of to
tal
2006
vo
lum
ea20
06 p
erce
ntag
e of
tota
l20
12
volu
mea
2012
per
cent
age
of to
tal
2016
vo
lum
ea20
16 p
erce
ntag
e of
tota
lM
illio
n bo
ard
feet
Perc
ent
Mill
ion
boar
d fe
etPe
rcen
tM
illio
n bo
ard
feet
Perc
ent
Mill
ion
boar
d fe
etPe
rcen
tC
entra
l Coa
st:
Nap
a—
—0.
3b
——
——
San
Ben
ito—
—0.
1b
——
——
San
Mat
eo5.
60.
34.
40.
34.
50.
312
.40.
8Sa
nta
Cla
ra4.
20.
24.
40.
33.
50.
2—
—Sa
nta
Cru
z19
.60.
99.7
0.6
15.7
1.111
.20.
7To
tal C
entra
l Coa
st29
.41.
318
.81.1
23.7
1.723
.51.
5
Nor
th c
oast
:D
el N
orte
50.4
2.2
17.6
1.0
19.3
1.4
31.1
2.0
Hum
bold
t43
5.3
19.3
345.7
19.9
215.
115
.117
7.911
.3M
endo
cino
193.
58.
612
3.1
7.110
8.8
7.610
6.6
6.8
Sono
ma
28.1
1.2
9.9
0.6
8.2
0.6
10.4
0.7
Tota
l Nor
th C
oast
707.
231
.449
6.3
28.6
351.
424
.632
6.0
20.7
Nor
ther
n in
terio
r:La
ssen
69.3
3.1
77.9
4.5
83.8
5.9
74.0
4.7
Mod
oc49
.92.
226
.31.
546
.23.
226
.91.7
Shas
ta19
4.3
8.6
209.
012
.122
9.116
.120
8.0
13.3
Sisk
iyou
209.7
9.3
196.
011
.314
7.910
.417
0.8
10.9
Trin
ity99
.64.
498
.05.7
60.4
4.2
75.9
4.8
Tota
l Nor
ther
n In
terio
r:62
2.6
27.7
607.
235
.056
7.5
39.8
555.7
35.4
Sacr
amen
to:
But
te86
.43.
889
.25.
152
.53.7
49.3
3.1
El D
orad
o10
6.7
4.7
99.1
5.750
.13.
571
.14.
5G
lenn
24.7
1.14.
90.
33.
60.
20.
00.
0La
ke9.
60.
41.
60.
1b
b50
.63.
2N
evad
a59
.62.
639
.42.
319
.01.
39.
50.
6Pl
acer
40.4
1.8
47.4
2.7
21.4
1.5
45.3
2.9
Plum
as19
3.8
8.6
122.
47.1
82.3
5.8
96.0
6.1
10
Tabl
e 2—
Cal
iforn
ia’s
tim
ber h
arve
st b
y re
sour
ce a
rea
and
coun
ty, 2
000–
2016
(con
tinue
d)
Res
ourc
e ar
ea20
00
volu
mea
2000
per
cent
age
of to
tal
2006
vo
lum
ea20
06 p
erce
ntag
e of
tota
l20
12
volu
mea
2012
per
cent
age
of to
tal
2016
vo
lum
ea20
16 p
erce
ntag
e of
tota
lM
illio
n bo
ard
feet
Perc
ent
Mill
ion
boar
d fe
etPe
rcen
tM
illio
n bo
ard
feet
Perc
ent
Mill
ion
boar
d fe
etPe
rcen
tSi
erra
33.1
1.5
16.3
0.9
30.5
2.1
56.1
3.6
Teha
ma
105.
34.
745
.72.
662
.64.
458
.93.
8Yo
lo2.
60.
1—
——
——
—Yu
ba36
.91.
67.
20.
420
.91.
522
.81.
4To
tal S
acra
men
to
699.
031
.147
3.3
27.3
342.
824
.045
9.6
29.3
San
Joaq
uin:
Alp
ine
——
bb
——
——
Am
ador
22.8
1.0
28.7
1.713
.50.
93.
40.
2C
alav
eras
67.0
3.0
34.9
2.0
41.4
2.9
58.8
3.7Fr
esno
19.8
0.9
5.9
0.3
6.8
0.5
29.3
1.7K
ern
3.6
0.2
——
2.8
0.2
1.70.
1M
ader
a4.
80.
20.
1b
16.2
1.15.
30.
3M
arip
osa
3.6
0.2
3.70.
24.
50.
314
.80.
9M
erce
d0.
3b
——
——
——
Stan
islau
s—
——
——
—0.
90.
1Tu
lare
8.9
0.4
7.70.
45.
00.
35.
00.
3Tu
olum
ne60
.72.
747
.22.
745
.23.
279
.15.
0To
tal S
an Jo
aqui
n19
1.4
8.5
128.
17.
413
5.3
9.5
198.
412
.5
Sout
hern
Cal
iforn
ia:
Inyo
——
——
3.4
0.2
——
Riv
ersid
e—
——
——
—8.
30.
5Sa
n B
erna
rdin
o—
—9.
550.
551.
20.
1—
—To
tal s
outh
ern
Cal
iforn
ia0
09.
60.
64.
60.
38.
30.
5
Stat
e to
tal
2,24
9.710
01,7
33.1
100
1,42
5.4
100
1,57
1.5
100
— =
zer
o.a V
olum
e in
Scr
ibne
r log
rule
.b
Volu
me
is le
ss th
an 0
.05
mill
ion
boar
d fe
et o
r per
cent
age
of to
tal h
arve
st is
less
than
0.0
5 pe
rcen
t.So
urce
s: M
cIve
r et a
l. 20
15; M
orga
n et
al.
2004
, 201
2.
11
Table 3—Total harvest for California’s leading timber harvest counties, 1976–2016County Volumea Total County Volumea Total Million board feet Percent Million board feet Percent1976: 1994:
Total county 1,270.6 39.5 Total county 759.3 48.3California total 3,214.0 California total 1,571.5
a Volume in Scribner log rule.Sources: Barrette et al. 1970; Hiserote and Howard 1978; Howard 1974, 1984; Howard and Ward 1988, 1991; McIver et al. 2015; Morgan et al. 2004, 2012; Ward 1995, 1997.
12
GENERAL TECHNICAL REPORT PNW-GTR-994
Harvest by SpeciesDuring 2016, true firs, Douglas-fir, ponderosa pine, redwood, and sugar pine were the most commonly harvested tree species, accounting for nearly 95 percent of California’s total harvest volume (table 4). These species have historically domi-nated California’s harvest, consistently accounting for 87 percent or more of the total volume (table 5). Over the years, Douglas-fir and true firs have been the high-est volume species. Douglas-fir provided the top timber harvest volume in 2012, while true firs were the leading species harvested in 2016, accounting for more than 27 percent (429 MMBF) of the volume harvested. From 2012 to 2016, the combined percentage provided by ponderosa pine and sugar pine has increased (30 percent of total harvest), while the redwood percentage of the total harvest decreased. These changes are in line with other long-term trends demonstrating a proportion-ate decrease in the volume of redwood and increases in the volume of true firs harvested, with pines maintaining a relatively consistent share of California’s state timber harvest (McIver et al. 2015; Morgan et al. 2004, 2012).
Tree mortality, while occurring naturally in all forests, can increase as a result of natural disturbances such as wildfire, pest outbreaks, windthrow, and drought (Christensen et al. 2017). Substantial tree mortality associated with several years of severe drought has been observed in California. On average, between 2001 and 2016, there were 10 billion live trees in California, of which 187 mil-lion died each year with the highest mortality rates occurring on national forest
Table 4—California’s timber harvest by species, 2016
Species Volumea TotalMillion board feet Percent
True firs 428.9 27.3Douglas-fir 370.7 23.6Ponderosa pine 359.0 22.8Redwood 218.4 13.9Sugar pine 112.9 7.2Incense cedar 54.4 3.5Lodgepole 14.2 0.9Other softwoodsb 7.8 0.5
Western hemlock 2.9 0.2Hardwoods 2.3 0.1
All species 1,571.5 100a Volume in Scribner log rule.b Other softwoods include Jeffrey pine, spruces, giant sequoia, and other coniferous species.
During 2016, true firs, Douglas-fir, ponderosa pine, redwood, and sugar pine were the most commonly harvested tree species, accounting for nearly 95 percent of California’s total harvest volume.
13
land (Christensen et al. 2017). Measurement of FIA plots from 2001–2005 and 2011–2015 provided estimates of average annual growth, removals, and mortality in California’s forests. Mean annual gross growth was 1.99 million ft3 per year and mean annual mortality was 903 thousand ft3 per year (Brodie and Palmer 2020). Although mortality across all ownerships was relatively high (45 percent of growth), mortality rates on national forests (70 percent of growth) were dramati-cally greater than on all private ownership (20 percent of growth) (Brodie and Palmer 2020). Despite these mortality rates, net change in California’s forest land was positive during this period.
Tree mortality during 2015 and 2016 is reflected in the more than 207 MMBF Scribner of reported dead timber harvest volume (table 6). Although the dead timber volume reported during the 2012 survey accounted for only 2 percent of the timber harvest in California, the dead volume reported in 2016 accounts for 13 percent of the state’s total harvest. Ponderosa pine—one of the species heavily affected by the bark beetle epidemic—saw a 16 percent increase in dead volume since 2012. Some of the species with high proportions of dead volume (e.g., Jeffrey pine and sugar pine) do not account for a large proportion of the timber harvested across the state. However, from 2000 to 2016, key timber harvest species such as ponderosa pine, Douglas-fir, and true fir species have seen significant increases in the proportion of reported dead volume. An increased proportion of timber harvest volume reported dead also was observed between 2000 and 2006 in California, with 11 percent of the timber harvest being reported as dead (Morgan et al. 2012).
Table 5—Percentage of California’s timber harvest by species, 1968–2016a
Incense cedar b 4.1 4.1 3.9 3.0 3.7 4.3 2.4 4.7 4.8 4.9 3.5
Hardwoods 0.2 0.2 0.2 0.4 0.5 0.5 d d 0.5 d d 0.1
Total 100 100 100 100 100 100 100 100 100 100 100 100a Harvest for years prior to 2000 does not include timber delivered to out-of-state mills.b Included in “Other softwoods.”c Other softwoods include western hemlock, lodgepole pine, spruces, and other coniferous species.d Less than 0.05 percent.Source: Barrette et al. 1970; Hiserote and Howard 1978; Howard 1974, 1984; Howard and Ward 1988, 1991; McIver et al. 2015; Morgan et al. 2004, 2012; Ward 1995, 1997.
The dead timber volume reported in 2016 accounts for 13 percent of the state’s total harvest. Ponderosa pine—one of the species heavily affected by the bark beetle epidemic—saw a 16 percent increase in dead volume since 2012.
14
GENERAL TECHNICAL REPORT PNW-GTR-994
Harvest by Product TypeProducts directly manufactured from timber are referred to as primary products—the first stage of wood processing. These products include lumber, plywood, veneer, posts and poles, pilings and timbers, house logs, and log furniture. Products made from chipping or grinding timber, as well as from the mill residuals (e.g., bark, sawdust, and planer shavings) generated in the production of primary products, are also included in this analysis. These reconstituted primary products include particleboard, medium-density fiberboard, hardboard, fuel pellets, and bioenergy. Other primary products made from mill residuals include decorative bark, mulch, soil amendments, and animal bedding.
Timber harvested in California during 2016 falls into four general timber product categories:• Sawlogs (timber used to produce lumber and other sawn products, as well
as logs harvested for export)• Veneer logs (timber sliced or peeled to make veneer for plywood or lami-
nated veneer lumber)• Bioenergy (woody biomass burned industrially to generate electricity or
steam)
Table 6—Proportion of California’s timber harvest by species reported as dead in 2000, 2006, 2012 and 2016
Species 2000 2006 2012 2016 - - - - - - - Percentage of dead timber - - - - - - -Jeffrey pine N/A N/A 40 40Sugar pine 10 5 6 27Lodgepole pine 11 4 21 18Ponderosa pine 8 6 2 18Cedara 3 9 0 15
Total harvest volume (MMBF) 2,249.7 1,733.1 1,425.4 1,571.5MMBF = million board feet. N/A = not applicable.a Includes Port Orford, incense, and western red cedar.b Other softwoods include western white pine, hemlock, spruces, and other coniferous species.Source: McIver et al. 2015; Morgan et al. 2004, 2012.
15
California’s Forest Products Industry and Timber Harvest, 2016
• Other products (including utility poles, house logs, log furniture, firewood, and fiber logs)
These four categories comprise the overall product types represented in Cali-fornia’s timber harvest.
Sawlogs accounted for 82 percent (1,292 MMBF) of the harvest in 2016, mark-ing a slightly smaller proportion than in 2012 (83 percent) and thus representing the smallest proportion on record. Historically, sawlogs have accounted for more than 85 percent of the total annual harvest (table 7). Veneer logs accounted for approximately 10 percent of the total harvest through the 1970s; however, since the 1980s, veneer logs have accounted for only 4 to 8 percent of California’s annual timber harvest. During 2016, veneer log harvest reached its highest percentage of California’s harvest since the mid-1970s with a notable increase to 11 percent of the statewide harvest, up from 8 percent in 2012.
Sawlogs and veneer logs have constituted the vast majority of harvested volume in California, with a relatively small portion of annual harvests used for other timber products. Bioenergy has been an expanding use of California’s timber in the past two decades, with a high of 8 percent (116 MMBF) of the harvest volume delivered to bioenergy producers in 2012—a significant increase over 2006 and 2000. However, in 2016, timber harvest volume for bioenergy dropped to about 5 percent (83 MMBF) of the total statewide harvest. During 2016, power purchase agreements between biomass facilities and power companies were nearing expira-tion, resulting in many bioenergy plants in California becoming idle for a portion
Table 7—Percentage of California’s timber harvest by product type, 1968–2016a
Total 100 100 100 100 100 100 100 100 100 100 100 100a Harvest for years prior to 2000 does not include timber delivered to out-of-state mills.b Includes reported log exports leaving California.c Included in “sawlogs.”d Included in “other.”e Includes utility poles, house logs, log furniture, firewood and fiber logs; does not include bioenergy.f Not reported prior to 2000.Source: Barrette et al. 1970; Hiserote and Howard 1978; Howard 1974, 1984; Howard and Ward 1988, 1991; McIver et al. 2015; Morgan et al. 2004, 2012; Ward 1995, 1997.
16
GENERAL TECHNICAL REPORT PNW-GTR-994
of 2016 while a resolution was sought (Souza 2016). The timing of these closures coincided with increased supply of dead wood being harvested from the Sierra Nevada Mountains, where drought and bark beetle outbreaks caused large-scale tree mortality in 2015 and 2016. This led Governor Jerry Brown to sign Senate Bill 859 in September 2016, which offered a temporary reprieve for biomass power facilities that use fuel from state-designated high-hazard-zone forests (CBEA 2016). Despite a decrease in the proportion of California’s timber harvest used by bioenergy facilities in 2016, the bioenergy sector remains an important part of California’s forest products industry.
Pulpwood has historically accounted for less than 2 percent of the annual har-vest volume because of the pulp and board sector’s heavy reliance on mill residuals. With the closure of California’s last remaining pulp mill in 2009, logs are no longer harvested in California to be used as pulp. Although there are no primary pulp or paper-manufacturing facilities in the state, secondary paper products are produced; these products are generally not as closely linked to forest management in Cali-fornia when compared to the primary forest products industry. Logs harvested for other products such as utility poles, house logs, log furniture, firewood, and fiber logs have historically accounted for less than 1 percent of the annual harvest since the mid-1990s. However, in 2016, these “other” timber products accounted for an increased percentage of the statewide harvest, up from 0.6 percent in 2012 to 1.4 percent during 2016.
Product Type by Ownership ClassMost of the volume harvested in California during 2016 came from private timber-lands (table 8). Timber used for sawlogs constituted the most harvested category across all ownership groups, both in 2012 and 2016. The sawlog product category increased by 10 percent from 2012 to 2016, up more than 112 MMBF and reversing the change observed between 2006 and 2012. Veneer and other timber products saw the largest increase, with 52 percent (67 MMBF) more volume harvested in 2016. During 2012, a shift away from volume harvested for sawlog products was observed as the bioenergy harvest experienced a dramatic increase of 186 percent (McIver et al. 2015). However, harvest for bioenergy saw a decline from 2012 to 2016, with 29 percent less volume (33 MMBF) in this product category. As general economic recovery has continued after the Great Recession, production of sawlogs and other higher quality wood products have experienced growth in California’s forest products industry.
In 2016, industrial lands provided the majority (66 percent) of California’s sawlog, veneer, and other log harvest, compared to 72 percent in 2012 and only 54
17
California’s Forest Products Industry and Timber Harvest, 2016
percent in 2006. Although nonindustrial lands again provided about 13 percent of the sawlog, veneer, and other log harvest in 2016, public lands saw an increased contribution to these product types, from 6 percent in 2012 to 20 percent in 2016. Private lands continue to provide the majority of timber harvest for high-value wood products, while public lands represent an increasing proportion of the saw, veneer, and other log harvest. Industrial lands also contributed 76 percent (63 MMBF) of wood used for bioenergy, which is up proportionally from 55 percent (64 MMBF) in 2012 and 73 percent (45 MMBF) in 2006. Public lands, primarily national forests, made up the remaining volume of wood used for bioenergy, at approximately 19.5 MMBF, or 24 percent—a notable decrease from the 51.9 MMBF (45 percent) contribution during 2012.
Product Type by SpeciesFrom 2012 to 2016, total volume harvested by species increased for true firs (up 13 percent), ponderosa pine (up 42 percent), redwood (up 5 percent), and sugar pine (up 31 percent). Although Douglas-fir remained the second most harvested of California’s species, it experienced a decline of 8 percent from 2012 to 2016. True firs and Douglas-fir were the species most harvested across all products, followed closely by ponderosa pine (table 9). However, ponderosa pine accounted for more of the sawlog volume than Douglas fir, and true firs and ponderosa pine together accounted for nearly half (48 percent) of all sawlog volume harvested in 2016. The harvest for veneer and other products increased substantially for each of the three leading species categories, with Douglas-fir up 23 percent, true firs up 54 percent, and ponderosa pine harvest for veneer and other products up 135 percent from 2012
Table 8—California’s timber harvest by ownership class and product type, 2016
Public timberlands: 261.6 39.5 19.5 320.6National forests 223.3 32.2 10.0 265.5Other public 38.3 7.3 9.4 55.1
Total 1,292.3 196.2 83.1 1,571.5a Includes log exports.b Other product types include house logs, firewood, furniture logs, fiber logs, and utility poles.c Volume in Scribner log rule.
In 2016, industrial lands provided the majority (66 percent) of California’s sawlog, veneer, and other log harvest, compared to 72 percent in 2012 and only 54 percent in 2006.
18
GENERAL TECHNICAL REPORT PNW-GTR-994
to 2016. True firs, Douglas-fir, and ponderosa pine accounted for the majority (76 percent) of the harvest for bioenergy in 2016. This represents a decrease both in volume and in proportional contribution from 2012. Similar to 2006 and 2012, hard-woods comprised very little (less than 0.5 percent) of the 2016 harvest. However, in 2016, hardwoods were used mostly for veneer and other wood products, compared to 2012 when hardwoods were primarily used for bioenergy.
Timber FlowThis section briefly details the movement of timber among California’s wood-producing regions, geographic resource areas, and individual counties, as well as between California and other states and countries. As a result of tracking the flow of timber into and out of the state, there are slight differences in the volume estimates of timber harvested in California versus timber received by facilities in the state.
In 2016, California’s sawmill, veneer, and other wood-processing facilities received 1,538 MMBF Scribner of logs (table 10). Of that volume, 79 percent came from private timberlands, about 17 percent from national forests, and about 4 percent from other public ownerships. Bioenergy facilities in California received about 83 MMBF of timber, in addition to mill residuals. Although veneer and other products saw an increase in total volume received, the contributions by ownership class remained fairly stable. National forests contributed 17 percent of the sawlog
Table 9—California’s timber harvest by species and product type, 2016
All species 1,292.3 196.2 83.1 1,571.5— = zero.a Includes log exports.b Other product types include house logs, firewood, furniture logs, fiber logs, and utility poles.c Volume in Scribner log rule.d Includes lodgepole pine, Jeffrey pine, giant sequoia, and western white pine.
19
California’s Forest Products Industry and Timber Harvest, 2016
timber volume received in 2016, up from the 2012 contribution of 12 percent. There was a similar increase in the volume received from national forest land for veneer and other products. Seventy-six percent of timber volume received by bioenergy facilities came from industrial private timberlands, 12 percent from national forests, and another 12 percent from nonindustrial and other public sources. This repre-sented a notable shift from 2012, when 37 percent of timber received by bioenergy facilities originated from national forests and only 8 percent came from other public and nonindustrial sources. Unlike during the 2012 California mill census, the residual-utilizing sector (i.e., reconstituted board and decorative bark facilities) did receive timber inputs for raw material owing in part to resource availability, processing capability, and market conditions. However, this sector continues to rely primarily on mill residuals for most feedstock.
Timber flow trends during 2016 were similar to those in both 2012 and 2006. Most (99 percent) of the timber used by California’s primary wood products industry was harvested from within the state. California timber-processing facili-ties received 1,538 MMBF Scribner of timber in 2016 (table 10). Wood-processing facilities received approximately 145 MMBF more in 2016 than in 2012, an increase of about 10 percent. In 2016, slightly more than 11 MMBF, or less than 1 percent, of timber processed in California came from outside the state. This represents an increase over 2012, when less than 4 MMBF (0.5 percent) of timber processed in California originated from other states. The log in-flow to California during 2016
Table 10—Timber volume received by California facilities by ownership and product, 2016
Public timberlands:National forests 223.6 28.2 10.0 261.9Other public 38.4 7.4 9.4 55.3
262.0 35.7 19.5 317.2
Total 1,278.2 177.0 83.1 1,538.3a Includes log exports.b Other product types include house logs, firewood, furniture logs, fiber logs, and utility poles.c Volume in Scribner log rule.
20
GENERAL TECHNICAL REPORT PNW-GTR-994
was still well below the 126.5 MMBF of timber imported from other states a decade ago. On the other hand, 44.8 MMBF (3 percent) of California’s timber harvest was shipped out of state to be processed (table 11). This constituted an increase over 2012, though the percentage of the total remained the same. It is also about half the log flow that left the state in 2006. All the timber that flowed into California, as well as all the volume that flowed out, was in the form of sawlogs and veneer logs. These volumes do not include logs exported internationally from California’s customs districts (see the “International and interstate timber flows” section for discussion).
Intrastate timber flow—This section briefly examines the flow of California timber to mills within the state. The number of timber-processing facilities in several California counties is so low that reporting county-level data would require disclosure of firm-level information. To avoid disclosing information, geographic resource areas are used to illustrate intrastate timber flow (table 12). Harvest and receiving areas reflect six multicounty geographic resource areas (fig. 3) where counties have been combined where neces-sary to conceal individual mill information.
In 2012, weak lumber markets in the wake of the Great Recession limited the flow of timber from California to other states as well as the importation of timber into California. However, between 2012 and 2016, log flow into California increased more than threefold to 11.5 MMBF, while log flow out of California increased by almost 24 percent. During 2016, 40 percent of harvested timber was processed in its county of harvest, and about 80 percent was processed in the geographic resource area of harvest. Timber traveled farther for primary processing in 2016 than in 2012, when nearly 50 percent of harvested timber was processed in its county of harvest and approximately 87 percent was processed in the resource area of harvest. Although 2012 saw an increase in the percentage of timber remaining in the same geographical location for processing post-harvest, 2016 was more in line with the trends observed
Table 11—Interstate timber flow into and out of California to processing facilities,a 2016
Saw and veneer logs 11.5 44.8 (33.2)Total 11.5 44.8 (33.2)
a Does not include international log exports or imports.b Volume in Scribner log rule.
During 2016, 40 percent of harvested timber was processed in its county of harvest, and about 80 percent was processed in the geographic resource area of harvest.
21
California’s Forest Products Industry and Timber Harvest, 2016
through 2006 when the percentage of timber processed within its county of harvest declined (Barrette et al. 1970, McIver et al. 2015, Morgan et al. 2012).
The remaining timber harvest volume was processed outside of its county or geographic resource area, flowing to another county, area, or state. Timber harvest volume not processed within its county or resource area of origin has tended to be delivered to mills in the north or western part of California or to Oregon. This trend continued in 2016 with the Northern Interior resource area shipping the largest volume of timber to be processed out-of-area, mostly to Oregon and the Sacramento resource area. Although the volume sent from the Northern Interior to the Sacra-mento resource area stayed fairly constant from 2012, more than three times the amount of volume was sent to Oregon from this resource area in 2016.
International and interstate timber flows—Interstate and international timber flow trends have changed since the 2012 mill census. As in 2012, mills that participated in the 2016 survey did not report using foreign timber, whereas during 2006, California timber-processing facilities used 60 MMBF of timber from Canada. Despite some increases in the distance traveled by California timber during 2016, the flow of Canadian logs to California has not
Table 12—California intrastate timber flow by geographic resource area, 2016
Receiving area
Harvest area
North Coast and Central
CoastaNorthern Interiorb Sacramentoc
San Joaquind
and Southern Californiae Out of statef Total harvest
Total received 320.3 571.9 471.6 174.5 44.8— = zero.; N/A = not applicable.a North Coast and Central Coast regions are combined to avoid disclosure; North Coast includes Del Norte, Humboldt, Mendocino, and Sonoma Counties and Central Coast includes Napa, Solano, Marin, Contra Costa, Alameda, San Francisco, San Mateo, Santa Clara, Santa Cruz, San Benito, and Monterey Counties.b Northern Interior region includes Lassen, Modoc, Siskiyou, Shasta, and Trinity Counties.c Sacramento region includes Butte, Colusa, El Dorado, Glenn, Lake, Nevada, Placer, Plumas, Sacramento, Sierra, Sutter, Tehama, Yolo, and Yuba Counties.d San Joaquin region Includes Alpine, Amador, Calaveras, Fresno, Kern, Kings, Madera, Mariposa, Merced, Mono, San Joaquin, Stanislaus, Tulare, and Tuolumne Counties.e Southern California region includes Imperial, Inyo, Los Angeles, Orange, San Luis Obispo, Riverside, San Bernardino, San Diego, Santa Barbara, and Ventura Counties.f Out-of-state region includes Oregon, and Nevada. They do not capture logs exported internationally.
22
GENERAL TECHNICAL REPORT PNW-GTR-994
resumed. Currently, there is no indication of increasing amounts of timber entering California from international sources, and the small amount of timber coming from other states is nowhere near the levels observed from the late 1960s through the 1990s (Barrette et al. 1970; Hiserote and Howard 1978; Howard 1974, 1984; Howard and Ward 1991; Ward 1995, 1997).
International softwood log exports from California have seen an increase over the past two decades. According to Zhou and Daniels (2018), the U.S. International Trade Commission (USITC), and other sources, California’s log exports were at a low starting in 1999 and lasting through the Great Recession. Recovery and increases across multiple sectors of the international forest product markets were observed from 2008 through 2012, with approximately 49 MMBF of softwood logs leaving California ports in 2012 (McIver et al. 2015). To identify changing trends in softwood log exports, data from the USITC were analyzed along with the most recent resource bulletin published on Pacific Northwest log exports from Zhou and Daniels (2018). The export data supplied by USITC reflected the forest product volumes and values that were exported through California customs districts. These custom districts encompass selected ports in their surrounding regions. What is not known is how much of these forest product volumes and values originated from timber harvested or products manufactured in California. Log export volume information was collected during the FIDACS census of California’s forest products industry when possible. However, the volumes and trends in this section rely on USITC export data and are discussed separately from FIDACS mill census data.
During 2016, softwood log exports through California ports totaled approxi-mately 55 MMBF, representing a 13 percent increase from 2012 (fig. 4) (USDC ITC 2018). Softwood log exports during 2016 represented a 164 percent increase over the low export levels reported from 2006 through 2009. Nearly 48 MMBF of the softwood log volume were exported by the San Francisco customs district, with the remaining 7 MMBF leaving from the San Diego and Los Angeles districts. In 2010, China began to significantly outpace other countries as the primary importer for California’s softwood logs. In 2016, 97 percent of softwood log exports from California were sent to China, with both Japan and Mexico each receiving another 1 percent. While Japan received about 75 percent of the log exports from California during 1996, its percentage continued to decrease over time as China emerged as the dominant international recipient of log exports. Ponderosa pine accounted for about 55 percent of California’s softwood log exports in 2016, while Douglas-fir constituted close to 11 percent. Total international softwood log exports through California’s customs districts during 2016 represented a volume equivalent to 3.5 percent of California’s total timber harvest.
23
California’s Forest Products Industry and Timber Harvest, 2016
0
10
20
30
40
50
60
70
1996
1997
1998
1999
2000
2001
2002
2003
2004
2005
2006
2007
2008
2009
2010
2011
2012
2013
2014
2015
2016
Log
expo
rt v
olum
e (m
illio
n bo
ard
feet
Scr
ibne
r)
Year
OthersMexicoKoreaJapanChina
End Uses of California’s 2016 Timber HarvestThis section traces California’s timber harvest through the various primary processing sectors. Timber, primary wood products, and mill residuals from manufacturing are commonly quantified in different units of measure. Timber inputs are generally reported in board feet Scribner west-side or east-side log rule. Volumes of mill outputs are provided in the measurement unit common to each product, such as board feet lumber tally or square feet of plywood ⅜-inch basis. Mill residuals are commonly reported in bone-dry units (BDU) or bone-dry tons. In this section, all volumes are expressed in cubic feet because expressing input, output, and residual volumes in a common unit of measure allows for more complete accounting of wood fiber from harvest through pri-mary processing.
Figure 4—Volume of California’s softwood log exports in million board feet Scribner by destination country, 1996–2016.
24
GENERAL TECHNICAL REPORT PNW-GTR-994
In this report, 1 BDU of residual is assumed to contain 96 ft3 of wood, and each thousand board feet (MBF) lumber tally is assumed to contain approximately 60 ft3of wood; board foot Scribner to cubic conversions for timber differ by timber product type, which reflect log size and quality. See Keegan et al. (2010a, 2010b) for more detail on the conversions and relationships of timber, lumber, and mill residual volumes.
The following conversion factors were developed using log size specifications as well as product and residual recovery information developed from the 2016 mill survey in California:• 5.32 board feet Scribner per cubic foot for sawlogs and export logs• 4.92 board feet Scribner per cubic foot for veneer logs• 4.29 board feet Scribner per cubic foot for reconstituted board and other logs• 1.0 board foot Scribner per cubic foot for wood used for bioenergy
To help clarify how board feet are related to cubic feet in the context of milling operations, consider this example:
Examining California’s sawmill sector, the estimated recovery of board feet lumber tally per board foot Scribner achieved by California sawmills in 2016 was 1.64. Based on this recovery, a thousand board feet (1 MBF) Scribner of logs would yield 1,640 board feet lumber tally of dry planed lumber. Assuming 1 MBF of lumber contains 60 ft3 (57.5 ft3 of lumber and 2.5 ft3 lost to shrinkage during dry-ing), 1.64 MBF lumber tally would contain 1.64 × 60 = 98.4 ft3 of solid wood. The remainder of the log inside bark would be in various forms of mill residual (exclud-ing bark). The average for all sawmills in California during 2016 was 0.57 BDU of mill residual in the form of sawdust, planer shavings, and chippable residual. A BDU of residual is 2,400 lbs of oven-dry wood and contains 96 ft3of solid wood fiber. A recovery of 1.64 MBF of lumber generates 1.64 × 0.57 × 96 = 90 ft3 of total residual. The residual and the green lumber together account for all the wood fiber in the thousand board feet Scribner of logs used to produce lumber. There are 188.1 ft3 of solid wood in the average sawlog processed in California, yielding 1,000/188.1 = 5.32 board feet Scribner per cubic foot of logs processed into lumber. This board foot/cubic foot ratio was used to calculate the volume of cubic feet in California’s sawlog harvest. See Keegan et al. (2010a) for more detail on the calculation of cubic feet in a given board foot volume of logs.
Figure 5 outlines timber flows of wood fiber by sector beginning with total statewide harvest and ending with finished primary products. Owing to the impor-tant role of bark in California’s forest products industry, figure 6 outlines by sector the flow and utilization of bark generated through timber harvest. California’s 2016
25
California’s Forest Products Industry and Timber Harvest, 2016
timber harvest was approximately 367 million cubic feet (MMCF) of bole (wood) and 57 MMCF of bark that went to timber-processing and residual-utilizing facili-ties both within and outside the state. Of the total harvest volume, approximately 233 MMCF (63 percent of bole volume) went to sawmills and was processed into lumber and other sawn products, and about 35 MMCF (nearly 10 percent of bole volume) went to veneer production (fig. 5). Only 5.6 MMCF (2 percent of bole volume) went directly to facilities that produce reconstituted board, posts, utility poles, log home kits, furniture, firewood, or bark products. In addition, reconsti-tuted board facilities in California, Oregon, and Washington received 21 MMCF of residuals from California’s sawmill, veneer, and other sectors. Bioenergy plants producing electricity received 83 MMCF of timber directly and 40 MMCF of wood mill residuals from other plants processing California timber, accounting for 33 percent of total cubic bole volume harvested. An additional 34 MMCF of residuals from sawmills and other primary processing facilities was utilized onsite for heat and steam generation, while nearly 31 MMCF of wood residuals went to other uses, including landscaping, mulch, pellets, and animal bedding.
Of the 233 MMCF of timber received by sawmills, 116 MMCF (50 percent of bole volume) became finished lumber, and about 5.5 MMCF were lost to lumber shrinkage during drying. Approximately 111 MCF of wood residuals were produced by the sawmill sector in California during 2016. Most of the wood mill residuals generated by sawmills were used to produce energy, both internally (32 MMCF) and at bioenergy facilities (35 MMCF). Nearly 30 MMCF of wood residuals were sold to other manufactures of landscaping, mulch, pellets, and animal bedding. A very small amount, less than 0.2 MMCF, of wood residuals from processing Cali-fornia timber into lumber was unused in 2016.
In addition to the 367 MMCF of harvested wood, bark was used by various industry sectors. Of the total bark that went to timber-processing facilities in California, the majority flowed to roundwood-processing facilities along with the wood bole (fig. 6). Decorative bark and landscaping facilities in California received an estimated 22 MMCF of bark residuals from wood-processing facilities in 2016. Bark residual was also used to generate heat, both internally (16 MMCF) and at bioenergy facilities (19 MMCF). Similarly to wood residuals, a very small amount of bark went unutilized in California during 2016.
Figure 7a demonstrates the final disposition of wood fiber harvested in Cali-fornia during 2016 (excluding bark), and figure 7b demonstrates the final disposi-tion of mill residuals generated by California’s primary wood products sector (including bark).
Most of the wood mill residuals generated by sawmills were used to produce energy, both internally (32 MMCF) and at bioenergy facilities (35 MMCF).
Export logs Raw material for board andother timber products
a Harvest volume does not include bark.b Other facilities include producers of posts, poles, utility poles, log homes, log furniture, firewood, bark, and other products.c Other uses include landscape, mulch, pellets, and animal bedding.
b
Residuals to bioenergy
c
c
c
Other residual usesc
Figure 5—Utilization of California’s timber harvest, 2016 (MMCF = million cubic feet).
27
California’s Forest Products Industry and Timber Harvest, 2016
47.2 MMCF0.1 MMCF 10.0 MMCF b
Bark facilitiesWood processing facilities a
Bioenergy
Wood processingfacilities bark
0 MMCF
a
b
Wood processing facilities include sawmills, veneer manufacturers, post, poles, utility poles, log homes, log furniture, firewood, board producers and log export entities.
Estimated.
Total bark57.2 MMCF
Bark to bioenergy8.7 MMCF
Bark for landscape/mulch22.2 MMCF
Internal energy16.2 MMCF
Unutilized residuals0.1 MMCF
Bark facilities 22.3 MMCF
Bioenergy18.7 MMCF
Figure 6—Utilization of bark and bark residuals generated from California’s 2016 timber harvest.
28
GENERAL TECHNICAL REPORT PNW-GTR-994
California’s Forest Products IndustryThe 2016 FIDACS census identified 80 active primary wood products facilities in California, up from 77 manufacturers identified in both 2012 and 2006, but signifi-cantly lower than the 262 operational facilities in 1968 (fig. 8, table 13). Over the past 50 years, most of these infrastructure losses have occurred in the lumber-pro-ducing (i.e., sawmill), veneer and plywood, and pulp and board sectors. Conversely, there has been an increase in the bioenergy, decorative bark, and other sectors owing in part to diversified markets, changes in resource utilization and availability, and advancements in manufacturing technology. Since the 2012 mill census, Cali-fornia gained two sawmills, one decorative bark facility, and three facilities in the “other” category, while losing three bioenergy facilities. In the case of bioenergy operations, the facilities remain intact, but were not active during the 2016 census. More detail on individual sectors is provided in the subsequent discussion.
The higher number of timber-processing facilities in 2000 versus the 1994 sur-vey was due primarily to the inclusion of the bioenergy and decorative bark sectors in the 2000 census, offsetting declines in the number of sawmill and pulp and board
33%
43%
6%
8%
3%7%
Lumber and shrinkageBiomass energy, including heatVeneerLandscaping, mulch, animal beddingExportsReconstituted board
58%31%
11%
BA
Figure 7—(A) Final disposition of wood harvested in California by industry sector, 2016 (excludes bark); (B) Final disposition of mill residuals in California, 2016 (includes bark).
The 2016 FIDACS census identified 80 active primary wood products facilities in California, up from 77 manufacturers identified in both 2012 and 2006.
29
California’s Forest Products Industry and Timber Harvest, 2016
Figure 8—California’s active timber-processing and residual-utilizing facilities, 2016.
30
GENERAL TECHNICAL REPORT PNW-GTR-994
facilities (Morgan et al. 2004, Ward 1997). Additional changes resulted from efforts to conduct a more comprehensive census of the industry starting in 2000, thus cap-turing more small sawmills and other facilities. Although this change in research protocol may have resulted in finding more mills, the downward trends continue in the number of facilities, volume of timber processed, and capacity—mirroring industry trends in other Western states (Hayes and Morgan 2017, Simmons and Morgan 2017, Simmons et al. 2016).
The downward trends associated with the forest products industry across the West can be attributed to several factors:1. A steep reduction in available timber, primarily due to reduced harvest lev-
els on federal and nonindustrial private lands.2. A prescriptive regulatory environment combined with reduced social
acceptability of timber harvest that has challenged forest management and industry operations.
3. Unfavorable market conditions associated with severe recessions in 1980 and 2007.
4. Concentration of production into large, capital-intensive, high-efficiency mills.
Additional factors affecting the structure and size of California’s forest products industry are discussed in more detail in the “Trends and Capacity by Sector” section.
Industry ConcentrationsWood product manufacturing facilities operated in 28 of California’s 58 counties during calendar year 2016 (fig. 8; table 14). There were nine active primary timber-processing facilities in Humboldt County in 2016, down from 12 active facilities during 2012. Shasta County also had nine active facilities during 2016, down from
Table 13—Active California primary wood products facilities by sector, 1968–2016
Industry sector 1968 1972 1976 1982 1985 1988 1992 1994 2000 2006 2012 2016Sawmills 216 176 142 101 89 93 56 53 47 33 30 32Veneer and plywood 26 25 21 10 6 6 3 4 2 2 2 2Pulp and board 17 18 7 10 11 11 9 12 7 4 1 1Bioenergy b b b b b b b b 25 25 26 23Decorative bark b b b b b b b b 10 10 11 12Othera 3 13 13 9 9 9 5 6 2 3 7 10
Total 262 232 183 130 115 119 73 75 93 77 77 80a “Other” includes log home producers, firewood producers, log furniture makers, fuel pellet facilities, and export entities, as well as utility pole manufacturers. b Data unavailable for bioenergy and decorative bark sectors for 1968–1994. Source: Barrette et al. 1970; Hiserote and Howard 1978; Howard 1974, 1984; Howard and Ward 1988, 1991; McIver et al. 2015; Morgan et al. 2004, 2012; Ward 1995, 1997.
Wood product manufacturing facilities operated in 28 of California’s 58 counties during 2016.
31
California’s Forest Products Industry and Timber Harvest, 2016
Table 14—Active California primary wood products facilities by county and sector, 2016
County Sawmills Veneer
Medium-density fiberboard and particleboard Bioenergy
2016 total 32 2 1 23 12 10 802012 total 30 2 1 26 11 7 772006 total 33 2 4 25 10 3 772000 total 47 2 5 25 10 4 93
— = zero.a “Other” includes log home producers, firewood, log furniture facilities, export entities, animal bedding, fuel pellets, and utility pole manufacturers.
32
GENERAL TECHNICAL REPORT PNW-GTR-994
10 operational facilities identified in both 2012 and 2006. Tuolumne County had eight processing facilities, one more than in 2012; Butte County had four facilities in 2016 versus two in 2012. Siskiyou and Sonoma Counties each had five opera-tional facilities in 2016 compared with four during 2012. Tulare County had only one active processing facility identified in 2016, down from the four operational facilities in 2012. Although no active facilities were identified during 2012, Colusa, Merced, Modoc, Nevada, and Sutter Counties all contained an operational primary wood-processing facility during 2016. Conversely, El Dorado, Madera, and Yuba Counties had lost their operational facilities since 2012 and contained none during the 2016 census.
Sales Value, Product Markets, and Market AreasThe total sales value reported by California’s primary forest products manufactur-ers in 2016 was about $1.5 billion. Although this represents an increase of more than $82 million over the 2012 total sales value, it is down $289 million from 2006 and $1.5 billion from 2000, in constant 2016 dollars. Table 15 shows that product sales were led by the sawmill sector at $984 million, followed by bioenergy, resid-ual-utilizing, and veneer and other primary wood products sectors. Sales values increased across all industries from 2012 with the exception of the bioenergy sector, which decreased by 21 percent. The economic impacts of each sector are discussed more thoroughly in subsequent sections.
Sales value and geographic destination by product type for California’s primary finished wood products in 2016 are shown in table 16 and figure 9. Mills usually distribute their products either through their own distribution channels or through independent wholesalers and selling agents. Because of subsequent transactions, the geographic destination reported here may not reflect final delivery points of shipments.
Table 15—Sales value of California’s primary wood products, 2000–2016
Total 3,077,338 1,813,066 1,441,813 1,524,273a Sales value from export logs included in 2016 total. b Residual-utilizing sector includes pulp, paper, and board manufacturers, animal bedding producers, fuel pellet manufacturers, and decorative bark.c Veneer and other products include log home accents, peeler cores, posts, poles, pilings, log furniture, firewood, exports (2016), and veneer.Source: McIver et al. 2015; Morgan et al. 2004, 2012.
California’s primary forest products manufacturers reported about $1.5 billion in total sales value in 2016. This is an $82 million increase compared to 2012, but a $289 million decrease from 2006 and $1.5 billion decrease from 2000, in constant 2016 dollars.
33
California’s Forest Products Industry and Timber Harvest, 2016
Sales of lumber and sawn products accounted for 65 percent of total sales in 2016. Bioenergy sales made up 19 percent ($273.5 million), the residual-utilizing sector accounted for 9 percent ($133.4 million), and veneer and other primary products made up the remaining 9 percent ($133 million). Although lumber and other sawn products as well as the residual-utilizing sector both saw increased sales values from 2012 to 2016, the veneer and other products sector experienced a dramatic increase in overall sales value. Note that export logs are included in the 2016 total sales value. However, even if export logs are removed, the veneer and other products sector experienced a 70 percent increase (in constant 2016 dollars) in overall sales value between 2012 and 2016. Bioenergy was the only sector to have 2016 sales that exceeded pre-recession 2006 sales.
At more than $1.1 billion and more than 74 percent of total sales, California is its own largest market for primary wood products. Most of the lumber (75 percent),
Table 16—Geographic destination and value of California’s primary wood products sales, 2016
All primary wood products 74.5 7.4 5.3 4.4 0.9 3.5 4.0 100.0a Other destinations include Pacific Rim and Canada.b Residual-utilizing sector includes facilities that use residues from the manufacture of lumber and other products, including pulp mills, board facilities, fuel pellet producers and bark plants.c Veneer and other primary wood products include log home accents, peeler cores, animal bedding, utility poles, firewood, furniture, exports (2016), and veneer.d Sales value from export logs included in 2016 total.Source: McIver et al. 2015; Morgan et al. 2004, 2012.
34
GENERAL TECHNICAL REPORT PNW-GTR-994
as well as all the energy and electricity produced by the bioenergy sector, are used in state. The veneer and other primary wood products category is the only one to generate greater sales value in out-of-state markets. After dropping by nearly 60 percent between 2006 and 2012, sales value from the residuals-utilizing sector increased by 3 percent in 2016. Following similar trends noted during 2012 as a result of the closure of California’s last pulp facility and reduction in out-of-state flow of residuals output, approximately 87 percent of the sales value of California’s residual-utilizing sector was used in state.
Veneer and other primary wood products manufactured in California were primar-ily sold out of state in 2016, with just 2 percent of veneer and other products sold in state, and 55 percent sold to Far West states, followed by other market areas (41 percent) and the Rocky Mountain states (2 percent). International log exports from California to Pacific Rim countries in 2016 drove the sale of primary wood products to other market areas. The proportion of veneer and other primary wood products sold in California during 2016 constituted a drop in in-state sales since 2012, when about 10 percent of veneer and other products were sold in California. Veneer being sold to plywood and laminated veneer lumber mills in Oregon accounted for much of this trend.
The distribution of California’s primary wood products has changed since previ-ous years. The value of sales to the Far West and Northeast states and international markets increased between 2012 and 2016, whereas the value of sales to states in the other regions decreased. The Far West states (fig. 9) constituted the largest out-of-state market for California primary wood products in 2016, at 7 percent of total sales value. The Rocky Mountain states accounted for the second-largest percentage of out-of-state sales value, at $80 million or 5 percent of 2016 sales, primarily through lumber and residual-utilizing product sales. The North Central states yielded about 4 percent of total sales value at more than $67 million, with nearly all of it (97 percent) as lum-ber. Sales to the South were approximately $53 million, roughly 3 percent, while the Northeast totaled $14 million, or 1 percent of California’s total primary wood product sales. Sales to Northeast states increased 17 percent from 2012 to 2016.
International product exports reported by participating mills constituted a similar percentage of California’s total primary wood products sales in 2016 relative to previous years. An estimated $61 million in products went to Canada and Pacific Rim countries, about 4 percent of total sales. This compares to $17 million or 1 percent in 2012, and $130 million or 7 percent in 2006 (in constant 2016 dollars). In 2016, the majority of sales (88 percent) to foreign countries was from the veneer and other products sector, driven primarily by log exports, with most of the rest coming from the sawmill sector. By comparison, the bulk of sales to other countries during 2006 was generated from the residual-utilizing sector.
35
California’s Forest Products Industry and Timber Harvest, 2016
Trends and Capacity by SectorSawmill SectorThe sawmill sector continues to be the largest component of California’s primary forest products industry in terms of sales value (tables 15 and 16) and volume of timber processed (table 10). The 32 sawmills operating in California during 2016 produced more than 2,000 MMBF of lumber, accounting for more than 6 percent of U.S. domestic softwood lumber production and just over 4 percent of U.S. lumber consumption (WWPA 1964–2016).
Lumber production in California peaked in the late 1950s and has generally been declining since (fig. 10), following trends similar to those experienced in other Western states over the course of the 20th century (Morgan et al. 2012). Lumber production and prices have been volatile since 2000, when production dropped to
Far West
Rocky Mountain
North Central
South
Northeast
California
Hawaii
Massachusetts
NewHampshire
Vermont
RhodeIsland
New Jersey
Connecticut
Delaware
Maryland
WestVirginia
Mississippi
Florida
Oregon
Washington
Alaska
Montana
Wyoming
ColoradoUtah
New MexicoArizona
Nevada
Idaho
Oklahoma
Texas
Kansas Missouri
Nebraska
South Dakota
North Dakota
Iowa
Minnesota
Wisconsin
IllinoisIndiana
Ohio
Michigan
Maine
New York
Pennsylvania
NorthCarolina
SouthCarolina
Virginia
Kentucky
Tennessee
Arkansas
Louisiana
AlabamaGeorgia
Florida
Figure 9—Domestic shipment destinations of California’s primary wood products, 2016.
The 32 sawmills operating in California during 2016 produced more than 2,000 MMBF of lumber, accounting for more than 6 percent of U.S. domestic softwood lumber production and just over 4 percent of U.S. lumber consumption.
36
GENERAL TECHNICAL REPORT PNW-GTR-994
3,100 MMBF, with a sales value of $1.8 billion. The declines continued into the first decade of the 21st century; despite very strong housing and lumber markets in 2004 and 2005, output and sales value were below 2000 levels. With weakening markets in 2009 and 2010, output fell to about 1,500 MMBF, and lumber sales were less than $1.0 billion (WWPA 1964–2016) (fig. 11). The industry began a slow recovery starting in 2010. By 2012, California produced 1,800 MMBF of lumber with sales of $756 million, and in 2016, the state produced more than 2,000 MMBF of lumber with sales of $833 million. Lumber production and associated sales in 2016 repre-sent a 60-percent increase over the lowest point of the Great Recession in 2009, but 48 percent less than pre-recession (2004) sales.
Veneer and Plywood SectorCurrently, there are no plywood plants in California and only two plants producing veneer for further manufacture into plywood and laminated-veneer lumber by mills located in Oregon. The plywood sector was relatively short lived in California. It emerged and almost completely disappeared over the course of 60 years (Morgan et al. 2004). With strong wood markets and the development of technology to make quality plywood out of abundant large-diameter Douglas-fir timber, California
California’s Forest Products Industry and Timber Harvest, 2016
plywood production grew rapidly in the 1950s and early 1960s, peaking in 1964 at 1,300 million ft2 (3/8-inch basis). A number of factors have accounted for the decline and near disappearance of California’s plywood and veneer industry. How-ard (1974) pointed out that large-diameter Douglas-fir logs became less available. At the same time, spikes in log exports in the late 1960s and early 1970s brought increased competition for logs (Morgan et al. 2004). More recently, substitute products such as oriented strand board captured large portions of construction markets once dominated by plywood. The veneer and plywood sector comprises a small proportion of California’s total forest products industry, but sales value in the sector increased by 70 percent from 2012 to 2016, and the percentage of timber harvested for veneer logs increased from slightly more than 8 percent to 11 percent. To maintain confidentiality and protect firm-level information, additional details regarding California’s current plywood and veneer sector cannot be disclosed.
Residual-Utilizing SectorIn 2016, there were 16 facilities in California manufacturing products from the mill residuals generated at sawmills and other plants that process timber into products. These included two animal bedding facilities, one particleboard facility, one fuel pellet producer, and 12 bark plants producing landscaping products such as decora-tive bark and mulch. From 2000 to 2012, the number of manufacturers using mill residuals declined from 17 to 15. In 2016, the residual-utilizing sector gained one new bark facility. The composition of the sector has remained relatively unchanged since the last survey, with many of the same facilities still utilizing mill residuals to generate products such as particleboard, decorative bark, mulch, shavings for animal bedding, and fuel pellets.
California’s 2016 timber harvest included slightly more than 57 MMCF of bark, of which roughly 35 MMCF was used to produce energy and about 22 MMCF was used for other products such as mulch and landscaping. As with other wood mill residuals in California during 2016, only a very small amount (less than 0.1 MMCF) of bark was not used.
Prior to the early 1970s, the bark removed from timber during the production of lumber and other primary products was usually burned onsite for fuel, buried in landfills, or burned as waste (Barrette et al. 1970). A market developed by the nursery and gardening industry led to the establishment of three decorative bark producers in California by 1975 (Hiserote and Howard 1978); this number grew to 10 by 2000 (Morgan et al. 2004) and by 2016 was up to 12. Sales for residual-utilizing manufacturers totaled more than $133 million in 2016, up $4.3 million (3 percent) from 2012. The increase in sales resulted from the addition of one bark facility as well as increased output across the residual-utilizing sector during 2016.
Bioenergy SectorWhile other sectors of the forest industry in California have declined over the past 100 years, the bioenergy sector saw steady growth through 2012. Although 2016 represented a decrease in bioenergy activity, the sector remains important to California’s forest products industry. The state’s bioenergy sector consists of a variety of facilities. Cogeneration plants at timber-processing facilities such as sawmills produce steam and electricity, whereas stand-alone facilities use various mixes of urban and agricultural waste, sawmill residuals, and timber to produce electricity. A total of 23 bioenergy facilities used some type of wood fiber, includ-ing timber, forest chips (i.e., trees or slash chipped in the forest), sawmill residuals, and agricultural or urban waste (i.e., orchard clippings, fruit pits or nutshells, and construction and demolition waste). Seven facilities operated exclusively on sawmill
39
California’s Forest Products Industry and Timber Harvest, 2016
residuals, the same as during 2012 and more than the two operating during 2006; four facilities used a mixture of forest chips and sawmill residuals; 10 facilities used a mixture of agricultural waste, urban waste, and sawmill residuals; and two facili-ties used forest chips, sawmill residuals, and urban and agricultural waste (down from four during 2012). The diversity of facilities and inputs in the bioenergy sector reflect the increasing emphasis put on alternative energy sources in California through state and federal energy and pollution policies (e.g., California’s AB 32 and Renewable Energy Standard), as well as advancements in technology.
The energy-producing capacity of the 23 active bioenergy facilities that used wood fiber in 2016 totaled 510 megawatts (MW) (Woody Biomass Utilization Group 2019), down from 551 MW in 2012 but higher than the 485 MW of capacity recorded in 2006. Several facilities with a history of using forest or mill residuals were idle during 2016 as power purchase agreements between biomass facilities and power companies neared the end of their contracts. California’s active bioenergy producers sold slightly more than 3 million megawatt-hours (MWh) of power in 2016. By comparison, the 26 bioenergy facilities active in 2012 produced 3.4 mil-lion MWh and the 25 bioenergy facilities active during 2006 produced 3.1 million MWh. One MWh can power an average California home for up to 2 months (USDE EIA 2018). All the energy produced was sold within the state of California, with a total sales value of $273.5 million (table 16). The sales value of electricity produced by bioenergy facilities decreased by 21 percent over 2012 sales, which was a combi-nation of decreased production as well as a 15 percent decrease in the price paid per kilowatt-hour, from $0.1015 in 2012 to $0.0867 in 2016 (constant 2016 dollars).
Measured in cubic feet, the bioenergy sector used about 33 percent of the wood fiber (excluding bark) from California’s timber harvest, as well as approximately 33 percent of the bark residuals produced. This includes more than 83 MMCF of timber harvested for bioenergy and approximately 48 MMCF (including bark) from other primary processing facilities. A dramatic reduction in the flow of bark residu-als from wood-processing facilities to bioenergy facilities was observed between 2012 and 2016, as bark residual streams shifted more toward decorative landscaping bark entities and internal energy production.
California’s bioenergy sector faced several challenges during 2016, contribut-ing to an overall reduction in activity across the sector. Biomass energy production continues to be faced with relatively high production cost, and other renewable energy sources, including solar and wind generated power have lower costs as a result of available subsidies, tax exemptions, smaller workforce requirements, and generally fewer operating expenses (Lofthouse et al. 2015). Biomass energy is made more economical through power purchase agreements between biomass
The energy-producing capacity of the 23 active bioenergy facilities that used wood fiber in 2016 totaled 510 megawatts (MW), down from 551 MW in 2012 but higher than the 485 MW of capacity recorded in 2006.
40
GENERAL TECHNICAL REPORT PNW-GTR-994
facilities and power companies, incentivizing the use of renewable energy gener-ated from woody biomass under California’s Green Building Action Plan (Execu-tive Order B-18-12). However, many power purchase agreements faced expiration deadlines during 2016, causing many facilities to be idle for parts of the year in anticipation of widespread closures (Benda 2016, Langley 2017). Concern over large-scale tree mortality and industry capacity to utilize harvested dead material led Governor Jerry Brown to sign Senate Bill 859 in September of 2016, which offered a temporary reprieve for biomass power facilities that use fuel from state-designated high-hazard zone forests. The bill and resulting Biofuel Renewable Auction Mechanism (BioRAM) program required electricity retailers to enter into 5-year contracts with biomass facilities that would source 80 percent of their feedstock from state-designated high-hazard-zone forests. In addition, the Bioen-ergy Market Adjusting Tariff (BioMAT) program, a feed-in tariff program for small bioenergy plants, requires state utility companies to purchase 50 MW from sustain-able forest management (Simet 2017).
Other SectorsThe remaining primary wood products manufacturers identified in 2016 included three log export operations, one utility pole producer, one house log facility, one commercial firewood operation, and one log furniture producer. The number and types of facilities comprising California’s other wood product manufacturers have varied throughout the years. Historical information on their operations is somewhat limited, and given the changing nature of the “other” sector it is difficult to make meaningful comparisons over time. Some of these producers are small operations that come and go with demand for their products, making it challenging to deter-mine the total number of facilities operating and obtain information from them. Because of the limited number of facilities, no production data for these firms can be reported, and sales data are included with the veneer sector.
Input and Output CapacityThis section focuses on two measures of capacity—input (timber-processing) capac-ity and output (production) capacity—from 1988 through 2016 and the proportion of that capacity used by the forest industry. Output capacity is the most commonly used measure of capacity, measuring the volume of finished product a mill could produce in a given time frame, generally per shift or per year. However, finished products are measured in a variety of units: board feet lumber tally (lumber), thousand square feet (plywood, veneer), lineal feet (house logs), etc., which makes it difficult to express the total capacity of the industry as a whole. Another way of expressing capacity is in input capacity, often measured as timber-processing
41
California’s Forest Products Industry and Timber Harvest, 2016
capacity, which is a measure of the volume of raw logs that a mill can process in a given time frame, generally per year and measured in board feet Scribner. Capacity for 2016 was developed from the FIDACS census of California’s forest products industry. Capacity for years preceding 2016 was either estimated from previous industry censuses (Howard and Ward 1991; McIver et al. 2015; Morgan et al. 2004, 2012; Ward 1995) or, for intervening years between periodic surveys, based on reported mill closures, openings, and expansions (Ehinger 2012, Random Lengths 1976–2016, Spelter et al. 2009).
Sawtimber-processing capacity—California’s sawtimber-processing plants include sawmills, veneer mills, house log facilities, and utility pole plants. Through the FIDACS census, California mills were asked for their 8-hour shift and annual production capacities given sufficient supplies of raw materials and firm market demand for their products. Large sawmills and veneer plants expressed annual production capacity equal to two to three 8-hour shifts daily for 240 to 300 operating days per year. Smaller mills generally reported annual capacity as only one shift per day, for not more than 250 days per year.
To combine capacity figures for the state’s sawtimber users and to estimate the industry’s total capacity to process sawtimber, capacity was expressed in units of raw material input (MMBF of timber Scribner Decimal C) and was called process-ing capacity. Sawmill capacity figures were adjusted to million board feet of timber Scribner Decimal C log scale by dividing production capacity in lumber tally by the mill’s calculated lumber recovery per board foot Scribner. For veneer plants, produc-tion capacity in square feet of 3/8-inch veneer was divided by each mill’s calculated veneer recovery figure. Capacities for utility pole plants were adjusted to thousand board feet Scribner by multiplying capacity in lineal feet by an average calculated using the average volume of a log that would be used for that product. The resulting pole volumes, quantified as pieces, were comparable in size to veneer and sawlogs.
California’s capacity to process timber in 2016 was an estimated 1,900 MMBF Scribner, of which 73 percent was used by mills processing nearly 1,400 MMBF Scribner (fig. 12). A slight increase in total capacity for processing sawtimber and capacity utilized was observed from 2012 to 2016; in 2012, total capacity was estimated at 1,800 MMBF and mills processed approximately 1,300 MMBF. There has been a 69 percent drop in capacity to process sawtimber in California since 1988, when capacity was 6,000 MMBF Scribner of log input and mills processed about 4,000 MMBF of timber. The major decline in capacity took place from 1988 to 1999 with a fall from 6,000 to 2,800 MMBF (Morgan et al. 2004). The capacity decline in the 1990s resulted primarily from the decline of roughly 2,000 MMBF
California’s capacity to process timber in 2016 was an estimated 1,900 MMBF Scribner, of which 73 percent was used by mills processing nearly 1,400 MMBF Scribner.
42
GENERAL TECHNICAL REPORT PNW-GTR-994
Scribner in federal timber sale offerings from national forests. Increased state regulations of timber harvest activities reduced the available private timber volume, as did increased costs of removal (Thompson and Dicus 2005). Additional changes in the use of private lands, including development, urbanization, or purchases and set-asides for parks or old-growth preservation, also contributed to reduced timber harvest across private forest lands. The Great Recession led to poor market condi-tions, and the portion of capacity used fell more dramatically than total capacity, with capacity used declining from around 80 percent during the 2000 to 2006 period to an estimated 50 percent in 2009 (Keegan et al. 2011; McIver et al. 2015). As markets have continued to rebound and slowly recover, production and capacity utilization increased to 73 percent in 2016.
Lumber production capacity—Capacity to produce lumber varies widely among California’s 32 sawmills, and the proportion of capacity utilized appears to increase as mill size increases (table 17). Total lumber produced by sawmills during 2016 was 2,022 MMBF, while production capacity was more than 2,296 MMBF lumber tally. Thus, approximately 88 percent
0
1,000
2,000
3,000
4,000
5,000
6,000
7,000
1988
1989
1990
1991
1992
1993
1994
1995
1996
1997
1998
1999
2000
2001
2002
2003
2004
2005
2006
2007
2008
2009
2010
2011
2012
2013
2014
2015
2016
Tim
ber p
roce
ssin
g ca
paci
ty (m
illio
n bo
ard
feet
Scr
ibne
r)
Year
Total capacityCapacity used
Figure 12—California’s capacity for processing sawtimber, 1988–2016.
43
California’s Forest Products Industry and Timber Harvest, 2016
of California’s annual lumber-producing capacity was utilized, up from 78 percent in 2012 and 80 percent in 2006. The majority, 1,697 MMBF (nearly 74 percent) of lumber-producing capacity, was concentrated in the 11 largest mills, each with over 100 MMBF annual capacity. There was a slight increase in the number of mills with 10 to 50 MMBF annual capacity as well as increases in their production capacity and their proportional contribu-tion to state total capacity. Owing to some mill closures, a 7 percent decrease in overall sawmill production capac-ity was observed from 2012 to 2016, although there was a 6 percent increase in actual production.
The degree of concentration of capacity among the largest mills increased from 2000, when 58 percent of capacity was in the size class of more than 100 MMBF capacity. During 2016, these largest mills accounted for more than 75 percent (1,528 MMBF) of lumber produc-tion in California and utilized on average 90 percent of their lumber-producing capacity, up significantly from 78 percent in 2012 and 85 percent in 2006. Mills with capacities of 50 to 100 MMBF accounted for 415 MMBF (18 percent) of total capacity—producing almost 348 MMBF (17 percent) of the state’s lum-ber—and utilized on average almost 84 percent of their capacity. While two more sawmills were active during 2016 than in 2012, some shifting between size classes occurred as new mills were added and some closed. The smallest 16 sawmills—with 50 MMBF production capacity or less—accounted for 8 percent (184 MMBF) of California’s lumber-producing capacity and about 7 percent (147 MMBF) of the state’s lumber production. Mills in the smallest size class utilized a lower percent-age of their available capacity than mills in the larger size classes. However, the small mills still used nearly 80 percent of their production capacity during 2016. For comparison, the 12 sawmills with processing capacity of 50 MMBF or less utilized about 71 percent of their available capacity in 2012.
Tabl
e 17
—N
umbe
r of a
ctiv
e C
alifo
rnia
saw
mill
s, c
apac
ity, p
rodu
ctio
n, a
nd p
ropo
rtio
n of
cap
acity
util
ized
by
capa
city
siz
e cl
ass,
201
6
Prod
uctio
n ca
paci
ty si
ze c
lass
Num
ber
of m
ills
Prod
uctio
n ca
paci
ty
Perc
enta
ge
of to
tal
capa
city
Ave
rage
ca
paci
ty
per
mill
Prod
uctio
n
Perc
enta
ge
of to
tal
prod
uctio
n
Ave
rage
pr
oduc
tion
per
mill
Cap
acity
ut
ilize
d
MM
BFa
Perc
ent
MM
BFa
MM
BFa
Perc
ent
MM
BFa
Perc
ent
10 M
MBF
or l
ess
1018
.10.
81.
88.
70.
40.
948
.310
to 5
0 M
MBF
616
6.4
7.2
27.7
138.
36.
823
.183
.150
to 1
00 M
MBF
541
5.0
18.1
83.0
347.
517
.269
.583
.7M
ore
than
100
MM
BF11
1,69
7.073
.915
4.3
1,52
7.975
.513
8.9
90.0
2016
Tot
al32
2,29
6.5
100.
071
.82,
022.
510
0.0
63.2
88.1
2012
Tot
al30
2,46
7.5
100.
082
.21,
917.0
100.
063
.977
.720
06 T
otal
333,
067.
210
0.0
92.9
2,45
3.3
100.
074
.380
.020
00 T
otal
473,
878.
510
0.0
82.5
3,13
7.710
0.0
66.8
80.9
MM
BF =
mill
ion
boar
d fe
et.
a Vo
lum
e in
mill
ion
boar
d fe
et lu
mbe
r tal
ly.
Sour
ce: M
cIve
r et a
l. 20
15; M
orga
n et
al.
2004
, 201
2.
44
GENERAL TECHNICAL REPORT PNW-GTR-994
Lumber Recovery Factors and OverrunProduct recovery ratios, or the volume of output per unit of input, are reported for California’s sawmills as lumber recovery factors (LRFs) and overrun. The LRF is the lumber output (in board feet lumber tally) divided by the timber input (in cubic feet). Overrun is the volume of lumber (in board feet lumber tally) obtained from a log in excess of the estimated volume based on log scale (board feet Scribner). Both overrun and LRF are measures of mill efficiency. Although overrun is the more common measure, it is not as useful as LRF because of the weakness of the Scrib-ner scale as a measure of log input. The average size of logs processed in California has decreased over the past 50 years. As log diameters decrease, the Scribner log rule underestimates by an increasing amount the volume of lumber that can be recovered from a log, thus leading to increased overrun.
The volume of sawtimber used by California’s sawmills in 2016 was approxi-mately 232 MMCF (fig. 5) and lumber production was 2,022 MMBF lumber tally. Thus the statewide LRF for California sawmills in 2016 was 8.72 board feet of lumber output per cubic foot of log input, a 10 percent increase since 2000 (Morgan et al. 2004, 2012) and a 2 percent decrease since 2012 (McIver et al. 2015).
Increases in LRF are attributable primarily to improvements in processing technology. Technological improvements have made California mills more efficient in numerous ways. For example, log size (diameter and length) sensing capabilities linked to computers determine the best sawing pattern for logs to recover either the greatest volume or greatest value from each log. Improved sawing accuracies have reduced the amount of size variation in sawn lumber, reducing the need for planing and increasing solid wood recovery. Thinner kerf saws reduce the percentage of the log that becomes sawdust, and curved sawing technology has increased recovery from logs with sweep and crook (Keegan et al. 2010a). Small deviations up or down in LRF from year to year are not unusual and can be caused by an array of factors, including the number, size, and type of sawmills in operation during a given year.
During 2016, California sawmills produced 2,022 MMBF lumber tally by processing 1,235 MMBF, Scribner Decimal C, of logs yielding an overrun of 64 percent or 1.64 board feet of lumber per board foot Scribner of log input. A com-parison of California sawmill overrun and LRF for various years is shown in figure 13. Though variations can be observed from year to year, both overrun and LRF for California sawmills has trended in an upward direction since 1968.
Despite the long-term trend toward smaller logs discussed above, the average log size processed by California sawmills increased slightly from 2012 to 2016 (table 18). During 2016, 78 percent of logs processed by sawmills had a small-end diameter greater than 10 inches. This represents an increase over the 75 percent of logs with small-end diameters of more than 10 inches in 2012 (McIver et al. 2015) and the 72 percent in 2006 (Morgan et al. 2012).
The statewide lumber recovery factor for California sawmills in 2016 was 8.72 board feet of lumber output per cubic foot of log input, a 10 percent increase since 2000 and a 2 percent decrease since 2012.
45
California’s Forest Products Industry and Timber Harvest, 2016
Mill Residuals: Quantity, Type, and UseIn 2016, roughly 50 percent of the total fiber (wood and bark) processed by primary wood manufacturing facilities ended up as mill residuals, down from 56 percent in 2012 and 60 percent in 2006 (McIver et al. 2015, Morgan et al. 2012). These residuals can present difficult and expensive disposal problems or they can be used to create additional products or energy to generate revenue. California’s substantial bioenergy industry is the largest consumer of the wood residual generated in the state, whereas sawmills are the largest residual producers. Facilities producing landscaping mulch, decorative bark, and animal bedding products are also large users of mill residuals in California.
1.141.23
1.32 1.271.39
1.53 1.531.64 1.63 1.64
6.847.38
7.957.62 7.43
7.74 7.968.30
8.87 8.72
10
9
8
7
6
5
4
3
2
1
00
0.5
1.0
1.5
2.0
2.5
3.0
1968 1972 1976 1982 1985 1994 2000 2006 2012 2016
Lum
ber r
ecov
ery
fact
or
Ove
rrun
Year
Lumber recovery factorOverrun
Figure 13—Lumber recovery factor and overrun in California sawmills, various years.
Table 18—Proportion of logs processed by sawmills by small-end diameter
Roughly 50 percent of the total fiber (wood and bark) processed by primary wood manufacturing facilities ended up as mill residuals, down from 56 percent in 2012 and 60 percent in 2006.
46
GENERAL TECHNICAL REPORT PNW-GTR-994
Three types of wood residuals are created by California’s primary wood prod-ucts industry: coarse or chippable residuals consisting of slabs, edging, trim, log ends, and pieces of veneer; fine residuals consisting primarily of planer shavings and sawdust; and bark. The 2016 census gathered information on volumes and uses of mill residuals. Actual residual volumes, reported in BDU, were obtained from facilities that sold all or most of their residuals. One BDU is the equivalent of 2,400 lbs of oven-dry wood. All mills reported, on a percentage basis, how their residuals were used.
Residual volume factors, which express mill residuals generated per unit of output produced, were derived from production and residual output volumes reported by mills. California’s sawmills produce residuals during their normal production process. Residual factors for 2000, 2006, 2012, and 2016 as shown in table 19 represent statewide averages. During 2016, sawmills in California pro-duced a similar amount of residuals per thousand board feet of lumber as in 2012, producing a slightly higher amount of planer shavings and slightly less bark. The 2016 and 2012 sawmill residual factors indicate lower residual production than during 2000 and 2006. Several factors can contribute to changes in mill residual production. In general, changes in the size and species mix of logs received and products produced by sawmills can cause residual factors to change (Keegan et al. 2010a, 2010b). Improved milling technology and increases in average log size tend to reduce the amount of planer shavings, sawdust, and coarse residual generated per unit of lumber.
In 2016, California sawmills generated 1.58 million BDU of mill residuals, accounting for 90 percent of all mill residuals generated that year (table 20). Veneer plants, a utility pole facility, a log home accent plant, and a log furniture facility accounted for the remaining 9 percent of mill residuals produced during 2016. Coarse residual accounted for the largest proportion of residuals at approximately
Total 0.92 0.85 0.77 0.78a Bone-dry units (2,400 lbs of oven-dry wood) of the various residual types generated for every thousand board feet (MBF) of lumber manufactured. Source: McIver et al. 2015; Morgan et al. 2004, 2012.
47
California’s Forest Products Industry and Timber Harvest, 2016
42 percent, with bark accounting for 27 percent. More than 99 percent of residuals generated by sawmills during 2016 was utilized, either internally by the mill or sold for other products.
More than 1.75 million BDU of wood products residuals were generated dur-ing 2016, which is 7 percent more than in 2012. Coarse residuals were the largest component of wood products residuals in the state (table 21). Facilities in California produced 754,214 BDU of coarse residuals, and only 80 BDU were not used. Sixty-two percent of coarse residuals was used to produce energy, 21 percent was used by reconstituted board plants, and 16 percent was sold and used for other products.
Fine residuals—sawdust and planer shavings—made up 29 percent of residu-als (505,216 BDU) in 2016. Fine residuals increased 22 percent from 2012 to 2016. Sawdust composed 57 percent and planer shavings 43 percent of fine residuals.
Table 20—Volume of wood residuals generated by California’s sawmills, 2016
Wood residuals Percentage of typeResidual type Used Unused Total Used Unused Total
— = zero.a Includes residuals from the manufacture of lumber, veneer, utility poles, log furniture, firewood, export logs, and house logs. b One bone-dry unit = 2,400 lbs of oven-dry wood.
More than 99 percent of residuals generated by sawmills during 2016 was utilized, either internally by the mill or sold for other products.
48
GENERAL TECHNICAL REPORT PNW-GTR-994
Nearly 100 percent of fine residuals were utilized, with less than 1 percent left unutilized, most of which was sawdust. Fine residuals were primarily used as fuel in the production of energy (277,734 BDU or 55 percent) or for landscaping and other products (194,234 BDU or 38 percent). In 2016, California timber-processing facilities generated 491,593 BDU of bark—practically all of which was used by other sectors. Fifty-three percent of bark (259,355 BDU) was used for bioenergy and 47 percent (231,061 BDU) was used as landscaping or soil additives.
Forest Industry Employment and EarningsData reported in the FIDACS mill census were used in conjunction with employ-ment and earnings data from the U.S. Department of Commerce (USDC) Regional Economic Information System to identify employment and labor income for Cali-fornia’s primary and secondary forest products industry. Although the U.S. govern-ment changed the way it reported economic data and classified employment by sector in 2001, the USDC Bureau of Economic Analysis (BEA) has made state-level personal income information available from 1998 through the present. This period formed the basis of the analysis in this section. For further reading on changes in government reporting systems for economic data, see Morgan et al. (2012).
Primary forest products manufacturers are just one component of the broader forest industry in California. The classification of forest industries used here fol-lows the North American Industry Classification System (NAICS) available online on the BEA website. The forest products industry shows up in four categories: • NAICS 113—forestry and logging• NAICS 1153—forestry support activities• NAICS 321—wood products manufacturing• NAICS 322—paper manufacturing (secondary)
These categories include employees who work in both the primary and second-ary wood products and paper-manufacturing sector. Given the absence of primary paper manufacturing in California, all figures mentioned pertain solely to recycled paper or secondary paper manufacturing. Note that the four NAICS categories used to characterize the forest industry likely underestimate total employment because they do not include log hauling (trucking) companies, lumber and construction material wholesalers, road construction and maintenance contractors, and forest management services performed by government agencies or nonprofit organiza-tions. Data from the Quarterly Census of Employment and Wages, a product of the U.S. Department of Labor Bureau of Labor Statistics, were combined with BEA data to estimate employment and labor income associated with forestry support activities. These publicly available data sources provide a point of comparison for
49
California’s Forest Products Industry and Timber Harvest, 2016
estimates of employees and labor income for the primary forest products manufac-turers as well as additional information on the larger forest industry.
In 2016, total employment in the forest industry in California was an estimated 57,890 full- and part-time workers (USDC BEA 2018a; USDL BLS 2017). Of these, approximately 28,680 workers were employed in the manufacturing of primary and secondary wood products. In addition, we estimate that nearly 5,200 were employed in forestry and logging and 1,595 provided supporting activities for forestry opera-tions. An additional 22,340 workers manufactured secondary paper products in California during 2016 (fig. 14).
Although 2009 is considered the end of the Great Recession, 2011 and 2012 had the lowest levels of total forest industry employment for California in the past two decades. Wood products manufacturing in California experienced the most dra-matic decline over the past 15 years, with all employment sectors seeing decreases
0
10
20
30
40
50
60
70
80
90
100
1998
1999
2000
2001
2002
2003
2004
2005
2006
2007
2008
2009
2010
2011
2012
2013
2014
2015
2016
Num
ber o
f wor
kers
(tho
usan
ds)
Total forest industry employmentWood products manufacturingSecondary paper manufacturingForestry and loggingSupport activities for forestry
Year
Figure 14—Employment in California’s forest industry, 1998–2016.
In 2016, total employment in the forest industry in California was an estimated 57,890 full- and part-time workers.
50
GENERAL TECHNICAL REPORT PNW-GTR-994
beginning in 2003 and lasting for nearly a decade. The Great Recession contributed to weak demand for wood products, and mill closures and curtailments were observed across all Western states. Recovery has been slow, but employment in California’s forest industry has experienced growth during recent years. Since 2012, total employment in the forest industry has been on an upward trend. The 9 percent growth in total forest industry employment from 2012 to 2016 was led by wood products manufacturing, which increased by 18 percent. Although forestry and logging employment decreased by 2 percent from 2012 to 2016, secondary paper manufacturing employment increased by 4 percent and forestry support activities by 2 percent over the same period.
Workers in the forest industry earned more than $3.6 billion in labor income or worker earnings in 2016 (USDC BEA 2018b; USDL BLS 2017) (fig. 15), with the average employee across all sectors of the forest industry making $60,500 annually. Labor income includes wages and salaries, some benefits, and earnings of the self-employed. Labor income growth for the forest industry as a whole (14 percent) between 2012 and 2016 exceeded total forest industry employment growth (9 percent) over the same period. Since 2012, inflation-adjusted earnings in the wood products manufacturing sector increased by 22 percent, slightly outpacing employment growth in that sector. The average wood products manufacturing employee earned approximately $48,000 in 2016. Despite decreasing employment in forestry and logging between 2012 and 2016, labor income for these employees grew by 30 percent over the same period. Labor income for forestry support activi-ties and secondary paper manufacturing increased between 2012 and 2016 by 2 and 7 percent, respectively—amounts that are similar to the employment growth in each sector over the same period.
Wage growth outpacing employment could be attributed to a variety of fac-tors, including general wage increases across forest industry sectors and efforts toward employee retention, as well as the inclusion of both full- and part-time workers in BEA employment estimates. For example, when wages grow faster than employment, it may point to employees who were previously working part time adding more hours or days, which increases wages paid by businesses but does not change the overall employment estimate. Although nearly every sector of the forest industry has experienced increasing labor income levels since 2012, income levels generally declined across the industry after 2006 (a 23 percent decrease), with the exception of support activities for forestry.
Support activities for forestry (NAICS 1153) encompasses a variety of activi-ties, including wildfire suppression and prevention activities, tree thinning and planting, and pest management. The employment and wage growth experienced in
Workers in the forest industry earned more than $3.6 billion in labor income or worker earnings in 2016.
51
California’s Forest Products Industry and Timber Harvest, 2016
this category may be explained by a number of interrelated factors. First, the timing of the upward trend (2009–2010) coincides with federal investments in infrastruc-ture made through the American Reinvestment and Recovery Act. Second, as timber harvest levels have declined, businesses previously involved in commercial timber harvesting have diversified into noncommercial thinning, fuels reduction, and wildfire suppression activities, thus causing these businesses to be reclassified from forestry and logging to support activities for forestry. Finally, investments in noncommercial forest management activities likely increased in Western states, including California, during this time because of extensive mortality resulting from the mountain pine beetle epidemic and severe drought conditions.
0
1,000
2,000
3,000
4,000
5,000
6,000
Labo
r inc
ome
(mill
ions
of 2
016
dolla
rs)
1998
1999
2000
2001
2002
2003
2004
2005
2006
2007
2008
2009
2010
2011
2012
2013
2014
2015
2016
Total forest industry employmentWood products manufacturingSecondary paper manufacturingForestry and loggingSupport activities for forestry
Year
Figure 15—Inflation-adjusted earnings in California’s forest industry, 1998–2016.
52
GENERAL TECHNICAL REPORT PNW-GTR-994
Economic Contribution of California’s Forest IndustryEconomic contribution analyses measure gross changes in economic activity in an existing regional economy that can be associated with an industry, event, or policy (Watson et al. 2007). For this report, we assessed the contribution of California’s forest industry as dollars spent on intermediate inputs, taxes, and labor and, in turn, by households. All these expenditures generate economic opportunities as they cycle through the state’s economy.
The wood products and secondary paper manufacturers, forestry and logging workers, and forestry support firms that constitute California’s forest industry directly contributed approximately 57,891 jobs and $3.6 billion dollars in labor income to the state. The activity associated with this direct employment generated additional economic opportunities, as they rely on other industries’ intermediate inputs and services, thus indirectly supporting employment and wages in additional sectors.
Using regional data and existing linkages within California’s economy repre-sented by the BEA’s RIMS II multipliers (USDC BEA 2016), we estimated that the wood products manufacturing sector alone supported more than 66,000 full- and part-time jobs and an associated $3.4 billion dollars in labor income in 2016 (table 22). In other words, for every wood products manufacturing job in the state, another 1.3 jobs were supported in related sectors, and for every $1 dollar paid in labor income by wood products manufacturers, another $1.50 is paid in supporting sectors, including forestry and logging, forestry support, trucking, wholesale trade, and management.
Likewise, we estimated that the 5,266 people employed in the forestry and logging sector support an additional 6,824 full- and part-time jobs along with more than $250 million dollars in labor income in supporting sectors, such as equipment sales and repair. Note that we intentionally do not aggregate sectors nor provide estimates of the total employment and labor income contribution for the entire forest industry. Doing so would result in double-counting, as some employment and labor income feature as both direct contribution of one sector and indirect or induced contributions of another sector. For example, some or all of direct employ-ment and labor income in the forestry and logging sector would be included as indirect and induced contributions of the wood products manufacturing sector because these manufacturers rely upon forestry and logging businesses to supply their raw material inputs.
Wood products and paper manufacturing represent both primary and secondary employment and labor income estimates. California’s secondary wood and paper products industries are concentrated near population centers in the state’s southern and central counties. The primary forest products industry is concentrated in the northern
For every wood products manufacturing job in the state, another 1.3 jobs were supported in related sectors, and for every $1 dollar paid in labor income by wood products manufacturers, another $1.50 is paid in supporting sectors.
53
California’s Forest Products Industry and Timber Harvest, 2016
counties, closer to where timber harvesting occurs. The primary por-tion of the industry is integrally linked to forest management practices in the state, while the link is not as pronounced with the secondary industry. Consequently, statewide policies and legislation, whether related to the environment, labor, or forest products industry, will generally have larger impacts on the residents of the northern counties than the state’s population as a whole.
Since 2012, the California State Legislature has been interested in wood utilization and increasing forest industry processing capacity in response to severe wildfires and tree mortality. Several state bills, policies, and key reports have indicated the need to increase wood-processing capacity across all sectors of the forest industry, including assembly bills about mass timber and innovative forest products (AB2518 and AB1823); the BioRAM and BioMAT programs for biomass energy facilities; the AB1504 California Forest Ecosystem and Harvested Wood Product Carbon Inventory; and other regional or local efforts. Forest industry processing capacity in California con-tinues to be challenged by many issues such as the high cost of doing business in California, labor shortage, lack of appropriate workforce skills, and the high cost or limited supply of raw materials. Despite these challenges, new opportunities and emerging markets for wood products, including low-value wood for biomass energy, may help increase the financial viability of ecosystem restoration goals and play a role in forest management efforts in response to beetle kill, drought, extreme weather conditions, and population expansion affecting California forests.
Acknowledgments We thank all the participating wood products facility owners, managers, and staff who provided detailed information about their operations. In addition, we are grateful for the comments and input provided by Steve Brink, California Forestry Association; Larry Swan and Helena Murray, USDA Forest Service State and Private Forestry; Bill Stewart, University of California, Berkeley; Nadia Tase, California Department of Forestry and Fire Protection; the USDA Forest Service, Forest Inventory and Analysis program; and all the reviewers of the manuscript and summary data tables.
Tabl
e 22
—Av
erag
e an
nual
em
ploy
men
t and
labo
r inc
ome
cont
ribut
ions
from
Cal
iforn
ia’s
fore
st in
dust
ry, 2
016
Sect
orD
irec
t em
ploy
men
t
Indi
rect
an
d in
duce
d em
ploy
men
t
Tota
l em
ploy
men
t co
ntri
butio
naD
irec
t lab
or
inco
me
Indi
rect
and
in
duce
d la
bor
inco
me
Tota
l lab
or
inco
me
cont
ribu
tiona
- - -
- - -
- - -
- - N
umbe
r of j
obs -
- - -
- - -
- - -
-- -
- - -
- - -
- Th
ousa
nd 2
016
dolla
rs -
- - -
- - -
- -W
ood
prod
uct m
anuf
actu
ring
28,6
8537
,534
66,2
191,
374,
406
2,06
1,26
53,
435,
671
Fore
stry
and
logg
ing
5,26
66,
824
12,0
9027
3,46
025
1,20
052
4,66
0Fo
rest
ry su
ppor
t act
iviti
es1,
595
627
2,22
210
5,09
353
,009
158,
102
Seco
ndar
y pa
per m
anuf
actu
ring
22,3
4558
,573
80,9
181,
886,
131
2,83
4,28
94,
720,
420
Tota
l for
est i
ndus
try
57,8
91a
a3,
639,
090
aa
a In
dire
ct a
nd in
duce
d em
ploy
men
t and
labo
r inc
ome
shou
ld n
ot b
e su
mm
ed fo
r mul
tiple
sect
ors b
ecau
se so
me
empl
oym
ent a
nd in
com
e sh
ows u
p as
bot
h di
rect
con
trib
utio
ns to
thei
r sec
tor a
nd
indi
rect
con
trib
utio
ns to
oth
er se
ctor
s.
54
GENERAL TECHNICAL REPORT PNW-GTR-994
Metric EquivalentsWhen you know: Multiply by: To find:Inches 2.54 CentimetersFeet (ft) 0.3048 MetersSquare feet (ft2) 0.0929 Square metersAcre (ac) 0.404 HectareCubic feet (ft3) 0.0283 Cubic metersCubic feet per acre (ft3/ac) 0.06997 Cubic meters per hectarePounds (lbs) 0.3732 Kilogram
ReferencesBarrette, B.R.; Gedney, D.R.; Oswald, D.D. 1970. California timber industries,
1968: mill characteristics and wood supply. Sacramento, CA: California Division of Forestry. 117 p.
Benda, D. 2016. Burney biomass plant gives notice it will shut down. Redding Record Searchlight. August 12. http://archive.redding.com/business/local/burney-biomass-plant-gives-notice-it-will-shut-down-39befbc2-2a3a-0489-e053-0100007f6940-390047131.html/. (31 July 2020).
Brodie, L.; Palmer, M. 2020. California’s forest resources, 2006–2015: 10-year Forest Inventory and Analysis report. Gen. Tech. Rep. PNW-GTR-983. Portland, OR: U.S. Department of Agriculture, Forest Service, Pacific Northwest Research Station. 60 p.
California Biomass Energy Alliance [CBEA]. 2016. California biomass energy alliance commends Governor Brown for assisting the biomass industry by signing Senate Bill 859. CBEA press release. September 14. http://www.calbiomass.org/news-events/. (4 August 2020).
California Department of Tax and Fee Administration [CDTFA 2018]. Timber yield tax and harvest values schedule. https://www.cdtfa.ca.gov/taxes-and-fees/timber-tax.htm. (28 March 2018).
Christensen, G.A.; Waddell, K.L.; Stanton, S.M.; Kuegler, O. 2015. California’s forest resources: Forest Inventory and Analysis, 2001–2010. Gen. Tech. Rep. PNW-GTR-913. Portland, OR: U.S. Department of Agriculture, Forest Service, Pacific Northwest Research Station. 293 p.
California’s Forest Products Industry and Timber Harvest, 2016
Christensen, G.A.; Gray, A.N.; Kuegler, O.; Tase, N.A.; Rosenberg, M. 2017. AB 1504 California forest ecosystem and harvested wood product carbon inventory: 2006–2015. Final report. Agreement no. 7CA02025. Sacramento, CA: California Department of Forestry and Fire Protection and California Board of Forestry and Fire Protection. 390 p.
Ehinger, P.F. 2012. Forest industry data for Oregon, Washington, Idaho, Montana and California: operating mills and other data. On file with: Paul F. Ehinger and Associates, 2300 Oakmont Way No. 212, Eugene, OR 97401.
Hayes, S.W.; Morgan, T.A. 2017. The forest products industry in Montana, part 2: industry sectors, capacity and outputs. Forest Industry Brief No. 4. Missoula, MT: University of Montana, Bureau of Business and Economic Research. 6 p. http://www.bber.umt.edu/pubs/forest/fidacs/MT2014.2%20Mills.pdf. (31 July 2020).
Helms, J.A., ed. 1998. The dictionary of forestry. Bethesda, MD: Society of American Foresters. 210 p.
Hiserote, B.A.; Howard, J.O. 1978. California’s forest industry, 1976. Resour. Bull. PNW-080. Portland, OR: U.S. Department of Agriculture, Forest Service, Pacific Northwest Forest and Range Experiment Station. 103 p.
Howard, J.O. 1974. California forest industry wood consumption and characteristics, 1972. Resour. Bull. PNW-52. Portland, OR: U.S. Department of Agriculture, Forest Service, Pacific Northwest Forest and Range Experiment Station. 97 p.
Howard, J.O. 1984. California’s forest products industry: 1982. Resour. Bull. PNW-119. Portland, OR: U.S. Department of Agriculture, Forest Service, Pacific Northwest Forest and Range Experiment Station. 79 p.
Howard, J.O.; Ward, F.R. 1988. California’s forest products industry: 1985. Resour. Bull. PNW-RB-150. Portland, OR: U.S. Department of Agriculture, Forest Service, Pacific Northwest Research Station. 72 p.
Howard, J.O.; Ward, F.R. 1991. California’s forest products industry: 1988. Resour. Bull. PNW-RB-181. Portland, OR.: U.S. Department of Agriculture, Forest Service, Pacific Northwest Research Station. 69 p.
Keegan, C.E., III; Morgan, T.A.; Blatner, K.A.; Daniels, J.M. 2010a. Trends in lumber processing in the Western United States, part 1: board foot Scribner volume per cubic foot of timber. Forest Products Journal. 60(2): 133–139.
Keegan, C.E., III; Morgan, T.A.; Blatner, K.A.; Daniels, J.M. 2010b. Trends in lumber processing in the Western United States, part 2: overrun and lumber recovery factors. Forest Products Journal. 60(2): 140–143.
Keegan, C.E.; Sorenson, C.B.; Morgan, T.A.; Hayes, S.W.; Daniels, J.M. 2011. Impact of the Great Recession and housing collapse on the forest products industry in the Western United States. Forest Products Journal. 61(8): 625–634.
Langley, M.E. 2017. Power plant looking for spark to reopen. Tracy Press. April 19. http://www.ttownmedia.com/tracy_press/news/power-plant-looking-for-spark-to reopen/article_193f1492-2561-11e7-b6f5-eb4ba2615c93.html. (31 July 2020).
Lofthouse, J.; Simmons, R.T.; Yonk, R.M. 2015. Reliability of renewable energy: biomass. Logan, UT: Utah State University, Institute of Political Economy. 26 p. https://www.strata.org/reliability-of-renewable-energy/biomass/. (31 July 2020).
Morgan, T.A.; Keegan, C.E., III; Dillon, T.; Chase, A.L.; Fried, J.S.; Weber, M.N. 2004. California’s forest products industry: a descriptive analysis. Gen. Tech. Rep. PNW-GTR-615. Portland, OR: U.S. Department of Agriculture, Forest Service, Pacific Northwest Research Station. 55 p.
Morgan, T.A.; Brandt, J.P.; Songster, K.E.; Keegan, C.E., III; Christensen, G.A. 2012. California’s forest products industry and timber harvest, 2006. Gen. Tech. Rep. PNW-GTR-866. Portland, OR: U.S. Department of Agriculture, Forest Service, Pacific Northwest Research Station. 48 p.
McIver, C.P.; Meek, J.P.; Scudder, M.G.; Sorenson, C.B.; Morgan, T.A.; Christensen, G.A. 2015. California’s forest products industry and timber harvest, 2012. Gen. Tech. Rep. PNW-GTR-908. Portland, OR: U.S. Department of Agriculture, Forest Service, Pacific Northwest Research Station. 49 p.
Random Lengths. 1976–2016. Forest product market prices and statistics yearbook. Eugene, OR: Random Lengths Publications, Inc.
Random Lengths. 1993. Terms of the trade. Eugene, OR: Random Lengths Publications, Inc. 351 p.
Simet, G. 2017. From high hazard to bioenergy boost. Biomass Magazine. September 4. http://biomassmagazine.com/articles/14628/from-high-hazard-to-bioenergy-boost. (31 July 2020).
Simmons, E.A.; Scudder, M.G.; Morgan, T.A.; Berg, E.C.; Christensen, G.A. 2016. Oregon’s forest products industry and timber harvest 2013 with trends through 2014. Gen. Tech. Rep. PNW-GTR-942. Portland, OR: U.S. Department of Agriculture, Forest Service, Pacific Northwest Research Station. 58 p.
California’s Forest Products Industry and Timber Harvest, 2016
Simmons, E.A.; Morgan, T.A. 2017. The forest products industry in Idaho, part 2: industry sectors, capacity and outputs. Forest Industry Brief No. 11. Missoula, MT: University of Montana, Bureau of Business and Economic Research. 8 p. http://www.bber.umt.edu/pubs/forest/fidacs/ID2015.2%20Mills.pdf. (31 July 2020).
Souza, C. 2016. State seeks way to solve ‘a big biomass problem.’ AgAlert: The Weekly Newspaper for California Agriculture. August 24. https://www.agalert.com/story/?id=10110. (31 July 2020).
Spelter, H.; McKeever, D.B.; Toth, T. 2009. Profile 2009: softwood sawmills in the United States and Canada. Res. Pap. FPL-RP-659. Madison, WI: U.S. Department of Agriculture, Forest Service, Forest Products Laboratory. 55 p.
Thompson, R.P.; Dicus, C.A. 2005. The impact of California’s changing environmental regulations on timber harvest planning costs. San Luis Obispo, CA: California Polytechnic State University. 40 p.
U.S. Department of Agriculture, Forest Service [USDA FS]. 2015. Pacific Northwest Forest Inventory and Analysis database (PNW-FIADB): annual inventory data for California, Oregon, and Washington 2001–2014. Portland, OR: Pacific Northwest Research Station, Forest Inventory and Analysis. https://www.fs.fed.us/pnw/rma/fia-topics/inventory-data/.
U.S. Department of Agriculture, Forest Service [USDA FS] 2019. Forest Inventory EVALIDator web application, version 1.8.0.00. St. Paul, MN: Northern Research Station, Forest Inventory and Analysis. http://apps.fs.usda.gov/Evalidator/evalidator.jsp.
U.S. Department of Commerce, International Trade Commission [USDC ITC]. 2018. USITC DataWeb: interactive tariff and trade data. Washington, DC. https://dataweb.usitc.gov/login.
U.S. Department of Energy, Energy Information Administration [USDE EIA]. 2018. Frequently asked questions. http://www.eia.gov/tools/faqs/faq.cfm?id=97&t. (May 2019).
U.S. Department of Labor, Bureau of Labor Statistics [USDL BLS]. 2017. Quarterly census of employment and wages (QCEW). https://www.bls.gov/cew/. (September 2018).
Ward, F.R. 1995. California’s forest products industry, 1992. Resour. Bull. PNW-RB-206. Portland, OR: U.S. Department of Agriculture, Forest Service, Pacific Northwest Research Station. 76 p.
Ward, F.R. 1997. California’s forest products industry, 1994. Resour. Bull. PNW-RB-217. Portland, OR: U.S. Department of Agriculture, Forest Service, Pacific Northwest Research Station. 60 p.
Watson, P.; Wilson, J.; Thilmany, D.; Winter, S. 2007. Determining economic contributions and impacts: What is the difference and why do we care? Journal of Regional Analysis and Policy. 37(2): 140–146.
Western Wood Products Association [WWPA]. 1964–2016. Statistical yearbook of the Western lumber industry. Portland, OR. Annual.
Woody Biomass Utilization Group. 2019. Woody biomass utilization: California forest products and biomass power plant map. Berkeley, CA: University of California, Division of Agriculture and Natural Resources. Data download from: https://ucanr.edu/sites/WoodyBiomass/Project/California_Biomass_Power_Plants/. (June 2019).
Zhou, X.; Daniels, J.M. 2018. Production, prices, employment and trade in Northwest forest industries, all quarters 2014. Resour. Bull. PNW-RB-267. Portland, OR: U.S. Department of Agriculture, Forest Service, Pacific Northwest Research Station. 162 p.