29
www.bsc.es CALIOPE Air Quality Forecasting Systems: Computational Resources and Database Dr. José Mª Baldasano, Kim Serradell Barcelona, 29 th May 2014
www.bsc.es
CALIOPE Air Quality Forecasting Systems:
Computational Resources and Database
Dr. José Mª Baldasano, Kim Serradell
Barcelona, 29th May 2014
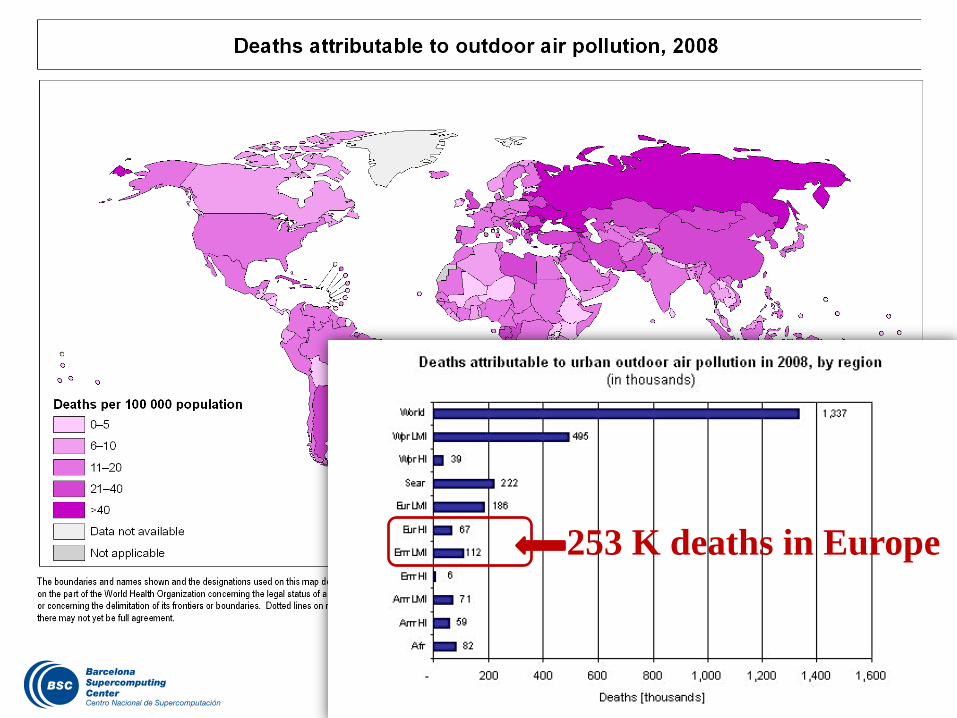
253 K deaths in Europe
5
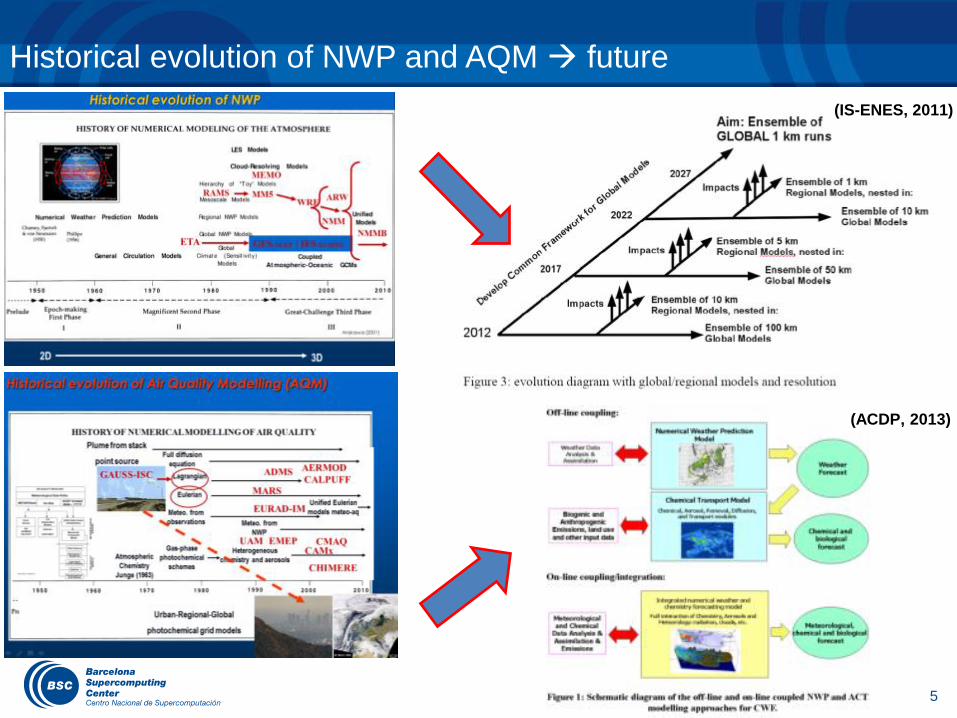
(IS-ENES, 2011)
Historical evolution of NWP and AQM future
(ACDP, 2013)
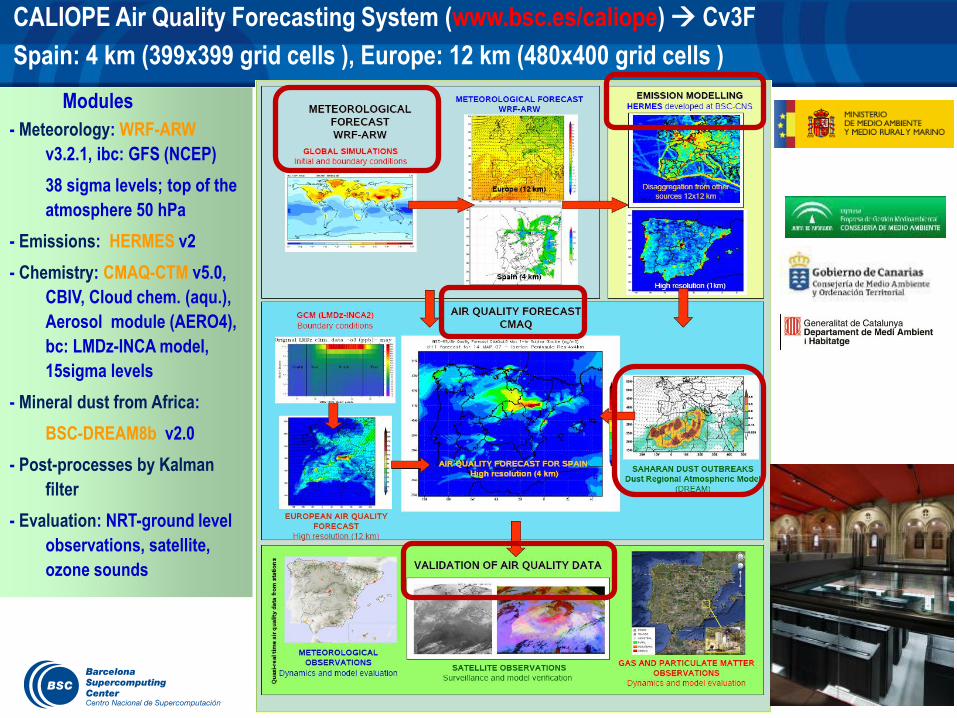
CALIOPE Air Quality Forecasting System (www.bsc.es/caliope) Cv3F
Spain: 4 km (399x399 grid cells ), Europe: 12 km (480x400 grid cells )
Modules
- Meteorology: WRF-ARW
v3.2.1, ibc: GFS (NCEP)
38 sigma levels; top of the
atmosphere 50 hPa
- Emissions: HERMES v2
- Chemistry: CMAQ-CTM v5.0,
CBIV, Cloud chem. (aqu.),
Aerosol module (AERO4),
bc: LMDz-INCA model,
15sigma levels
- Mineral dust from Africa:
BSC-DREAM8b v2.0
- Post-processes by Kalman
filter
- Evaluation: NRT-ground level
observations, satellite,
ozone sounds
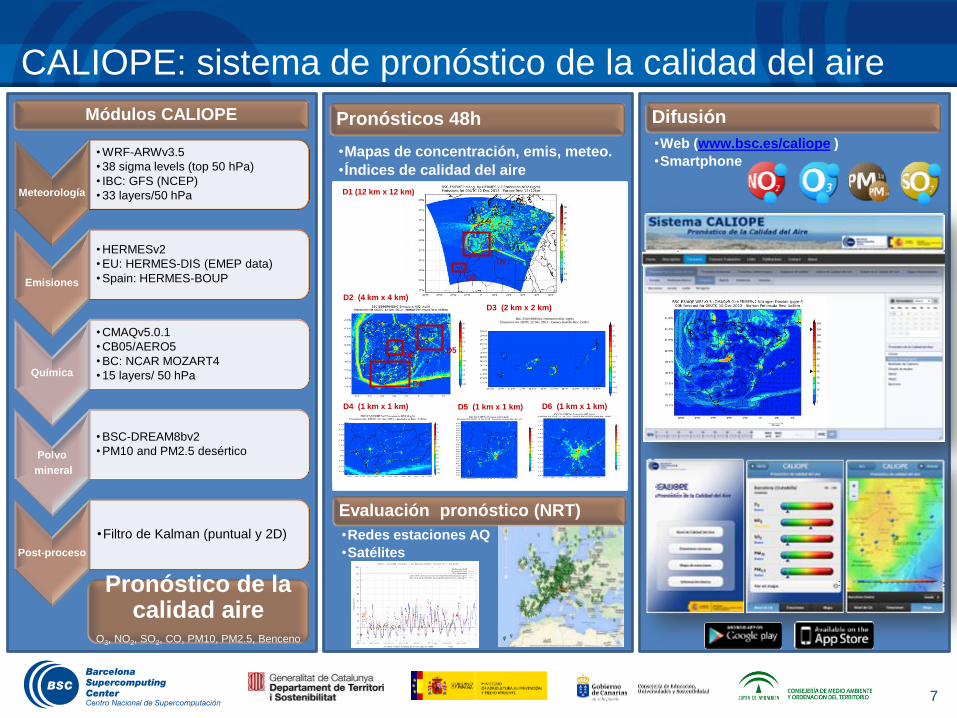
CALIOPE: sistema de pronóstico de la calidad del aire
7
Pronosticos
Meteorología
•WRF-ARWv3.5
•38 sigma levels (top 50 hPa)
• IBC: GFS (NCEP)
•33 layers/50 hPa
Emisiones
•HERMESv2
•EU: HERMES-DIS (EMEP data)
•Spain: HERMES-BOUP
Química
•CMAQv5.0.1
•CB05/AERO5
•BC: NCAR MOZART4
•15 layers/ 50 hPa
Polvo
mineral
•BSC-DREAM8bv2
•PM10 and PM2.5 desértico
Post-proceso
•Filtro de Kalman (puntual y 2D)
Pronósticos 48h
•Mapas de concentración, emis, meteo.
•Índices de calidad del aire
Difusión
•Web (www.bsc.es/caliope )
•Smartphone
Pronóstico de la calidad aire
O3, NO2, SO2, CO, PM10, PM2.5, Benceno
Módulos CALIOPE
Evaluación pronóstico (NRT)
•Redes estaciones AQ
•Satélites
4 km x 4 km
1 km x 1 km
D3 (2 km x 2 km)
D2
D3
D1 (12 km x 12 km)
D2 (4 km x 4 km)
D6 D5
D4
D5 (1 km x 1 km) D6 (1 km x 1 km) D4 (1 km x 1 km)
8
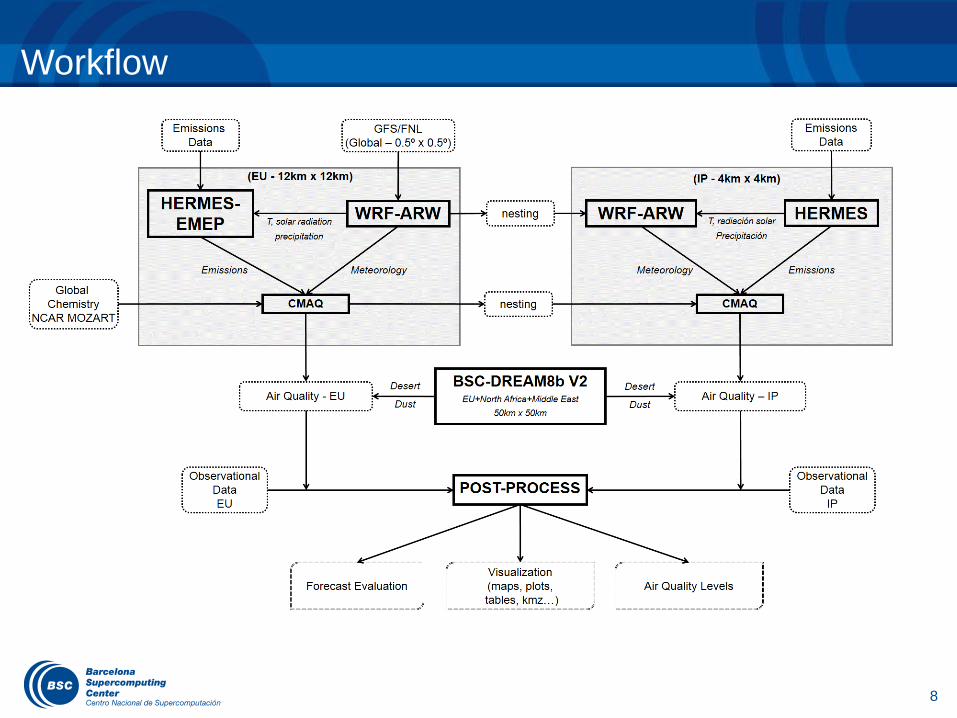
Workflow

9
Hardware Topology (I)
MARE
NOSTRUM
BSCCT01 (Webserver)
Drupal - CMS
BSCESWK002
forecast_start.sh
Forecastlog.sc
copy_images
copy_archive
CV2-DWNLD-METEO.SH
GFS
fore
cast
_st
art
.sh
SCR
IPTS
_op
t/d
ow
nlo
ad
_MSG
-IN
M.s
h
RA
DA
R/d
ow
nlo
ad
_MSG
-IN
M.s
h
AEMET
SIROCO downgencat
downdata
Data Download
Data Generated
Web Link
OMI SAT
sat_figures
Andalucía
Andorra
Cantabria
Baleares
Com. Madrid
Generalitat
Extremadura
FTP
put_netcdf_andalucia
maximum_andFile.php
BSCCT08.BSC.ES
Forecast Evaluation
wg
et
A. Madrid
METAR
download-metar.sh
EIONET
downdata
BB.DD.
MySQL
Datos AQ
Eval
Ficheros DRS AQ
Data vía ArcGIS server
Data Dump
Kalman Filter
Kriging
Data
shown at
website
Do
wn
loa
d_M
oz
art
.sh
MOZART NCAR
10
Hardware Topology (II)
5 machines involved
Receiving data from the outside is performed in a different
network for safety reasons
Constant file transfers are critical for the system
MySQL databases used as data federation center for further
analysis and visualization

11
BSC: MareNostrum supercomputer MNv3, December 2012 Nov2004 MNv1 Nov2006 MNv2
Peak Performance of 1,1 Petaflops 100.8 TB of main memory
Homogeneous Nodes 3,056 compute nodes
2x Intel SandyBridge-EP E5-2670/1600 20M 8-core at 2.6 GHz
8x4GB DDR3-1600 DIMMS (2GB/core)
Heterogeneous Nodes 42 heterogeneous compute nodes
2x Intel SandyBridge-EP E5-2670/1600 20M 8-core at 2.6 GH
2x Xeon Phi 5110 P
8x8GB DDR3-1600 DIMMS (4GB/core)
2 PB of disk storage Interconnection networks:
Infiniband FDR10
Gigabit Ethernet
Operating System: Linux - SuSe Distribution
12
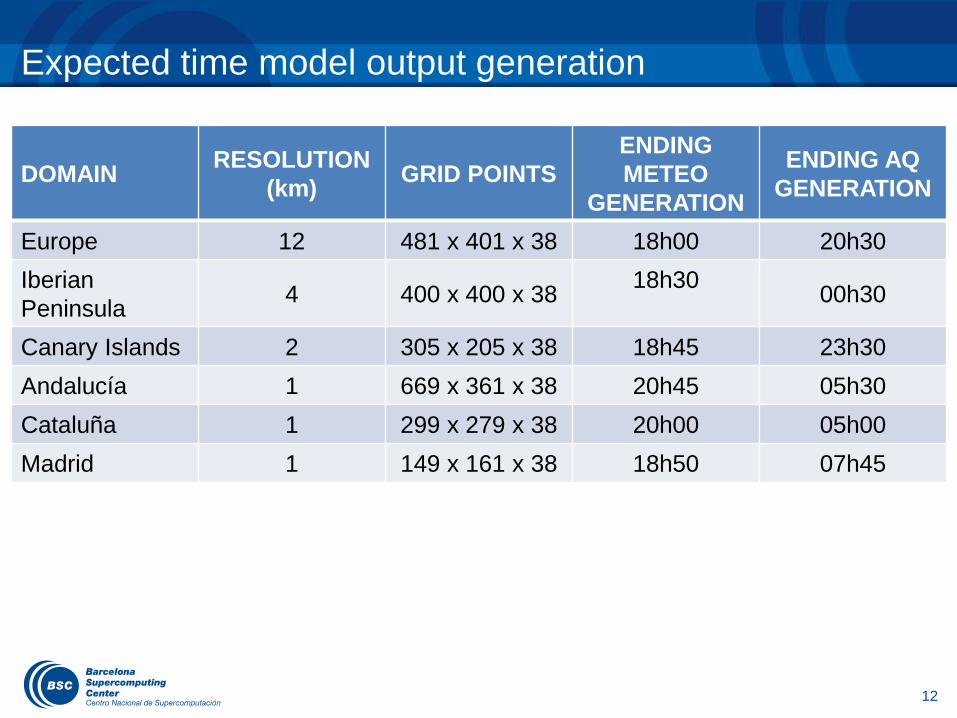
Expected time model output generation
DOMAIN RESOLUTION
(km) GRID POINTS
ENDING
METEO
GENERATION
ENDING AQ
GENERATION
Europe 12 481 x 401 x 38 18h00 20h30
Iberian
Peninsula 4 400 x 400 x 38
18h30
00h30
Canary Islands 2 305 x 205 x 38 18h45 23h30
Andalucía 1 669 x 361 x 38 20h45 05h30
Cataluña 1 299 x 279 x 38 20h00 05h00
Madrid 1 149 x 161 x 38 18h50 07h45
13
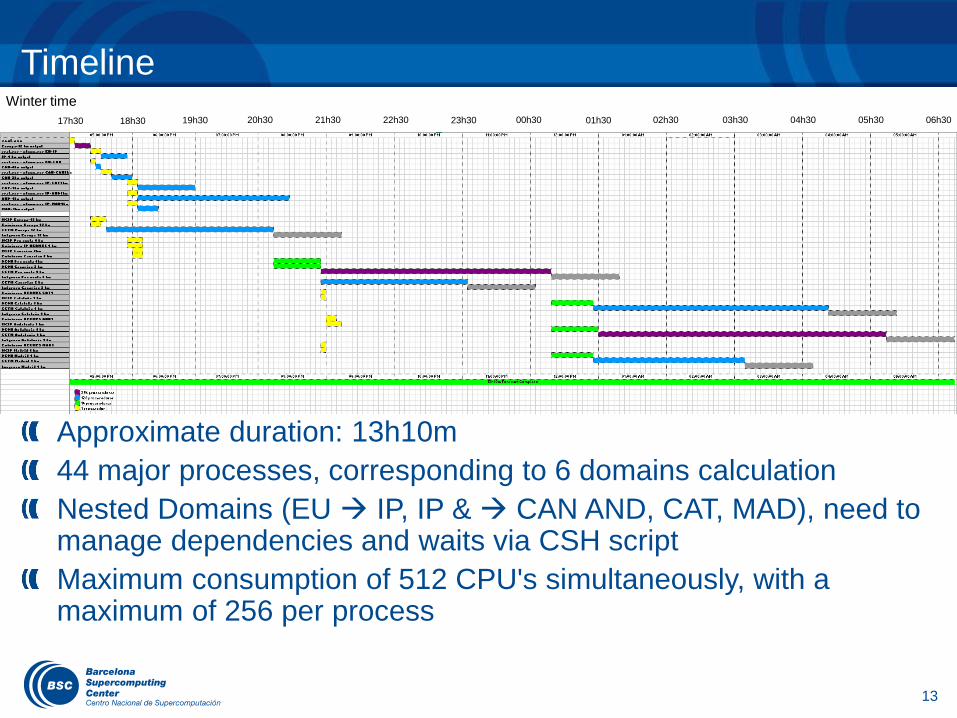
Timeline
Approximate duration: 13h10m
44 major processes, corresponding to 6 domains calculation
Nested Domains (EU IP, IP & CAN AND, CAT, MAD), need to manage dependencies and waits via CSH script
Maximum consumption of 512 CPU's simultaneously, with a maximum of 256 per process
Winter time
17h30 18h30 19h30 20h30 21h30 22h30 23h30 00h30 01h30 02h30 03h30 04h30 05h30 06h30
prova
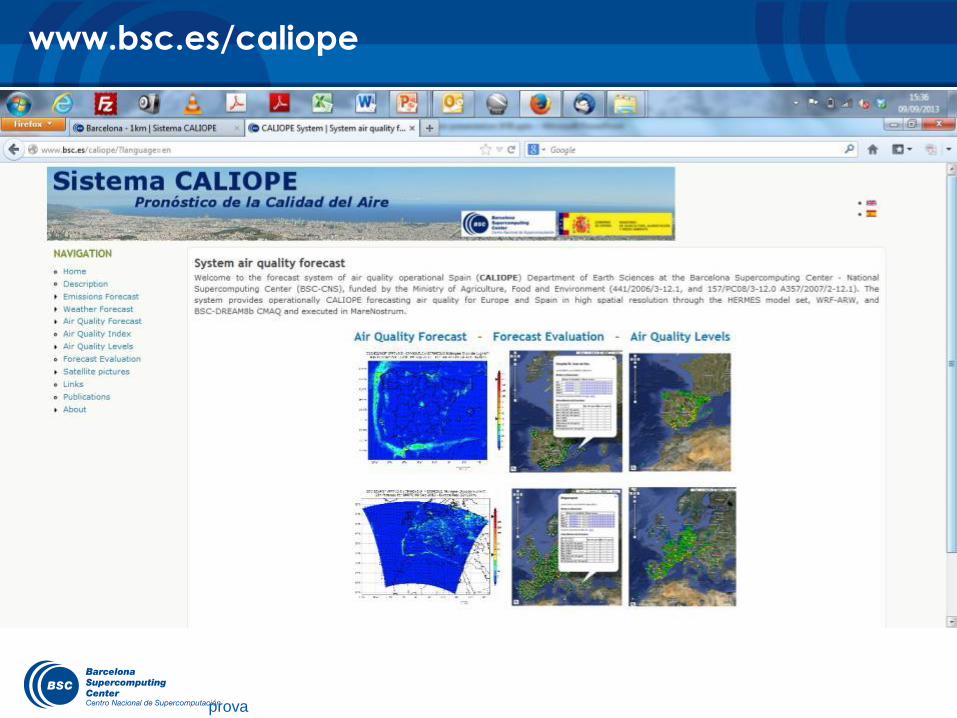
www.bsc.es/caliope
15
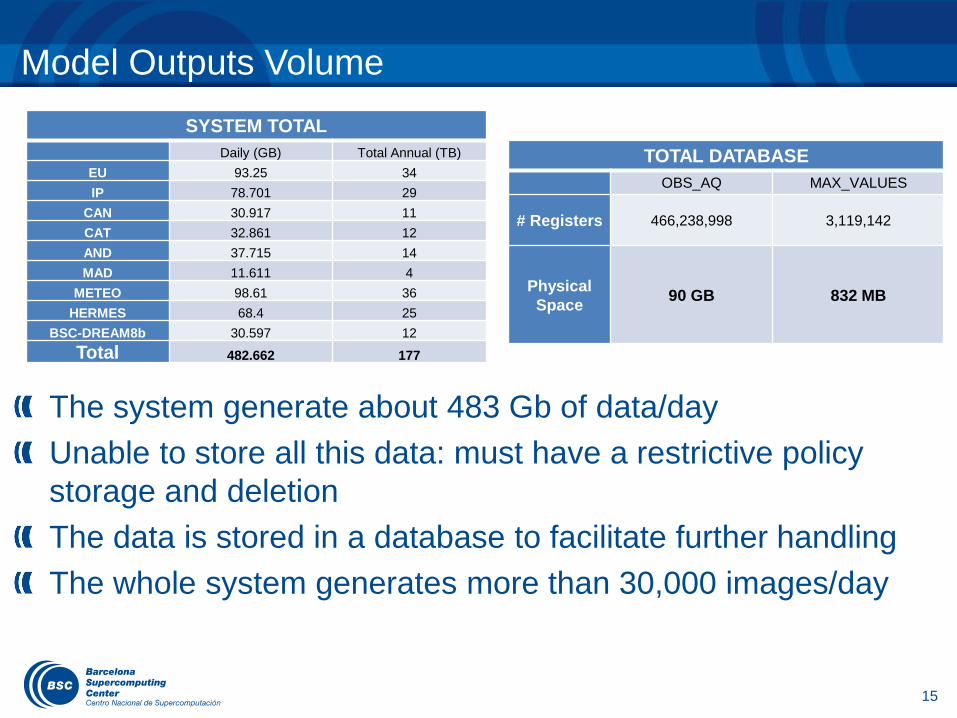
Model Outputs Volume
SYSTEM TOTAL
Daily (GB) Total Annual (TB)
EU 93.25 34
IP 78.701 29
CAN 30.917 11
CAT 32.861 12
AND 37.715 14
MAD 11.611 4
METEO 98.61 36
HERMES 68.4 25
BSC-DREAM8b 30.597 12
Total 482.662 177
TOTAL DATABASE
OBS_AQ MAX_VALUES
# Registers 466,238,998 3,119,142
Physical
Space 90 GB 832 MB
The system generate about 483 Gb of data/day
Unable to store all this data: must have a restrictive policy
storage and deletion
The data is stored in a database to facilitate further handling
The whole system generates more than 30,000 images/day
16
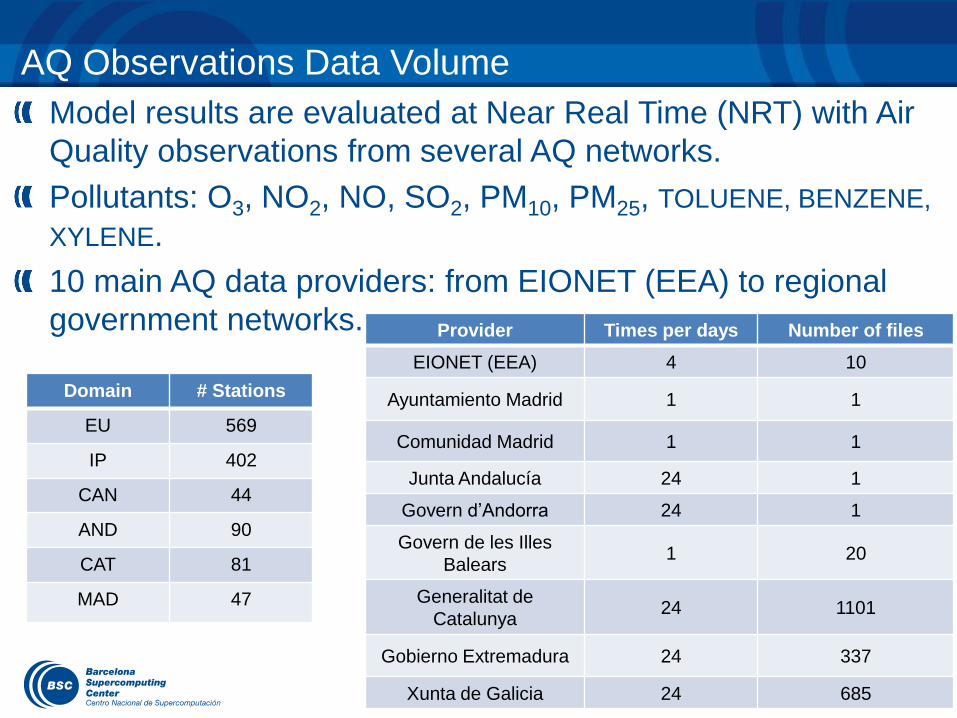
AQ Observations Data Volume
Model results are evaluated at Near Real Time (NRT) with Air
Quality observations from several AQ networks.
Pollutants: O3, NO2, NO, SO2, PM10, PM25, TOLUENE, BENZENE,
XYLENE.
10 main AQ data providers: from EIONET (EEA) to regional
government networks.
Domain # Stations
EU 569
IP 402
CAN 44
AND 90
CAT 81
MAD 47
Provider Times per days Number of files
EIONET (EEA) 4 10
Ayuntamiento Madrid 1 1
Comunidad Madrid 1 1
Junta Andalucía 24 1
Govern d’Andorra 24 1
Govern de les Illes
Balears 1 20
Generalitat de
Catalunya 24 1101
Gobierno Extremadura 24 337
Xunta de Galicia 24 685


21
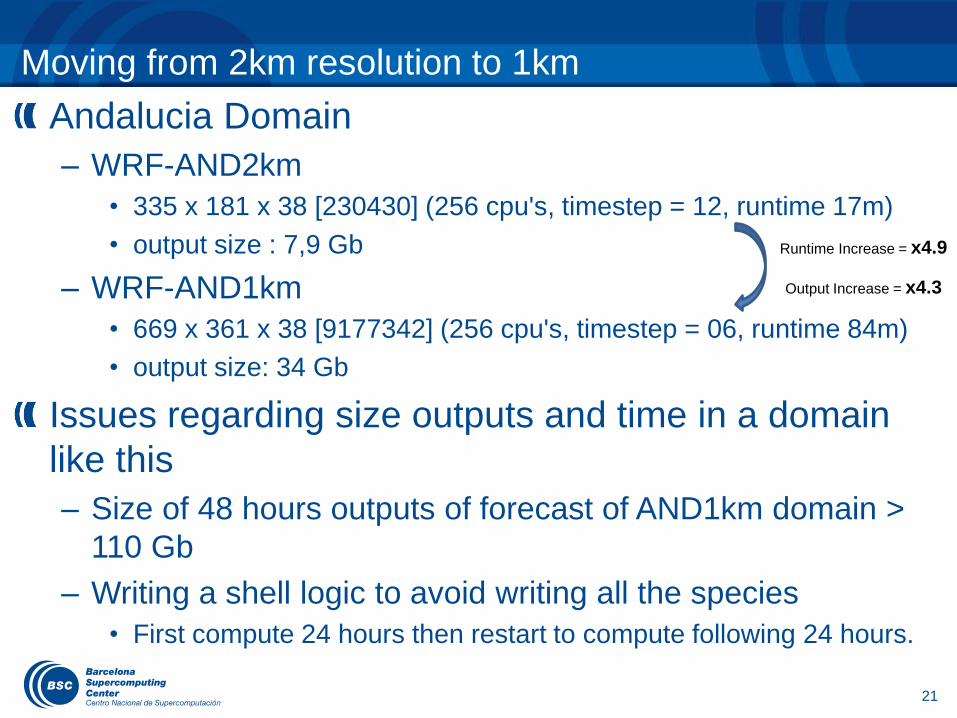
Moving from 2km resolution to 1km
Andalucia Domain
– WRF-AND2km
• 335 x 181 x 38 [230430] (256 cpu's, timestep = 12, runtime 17m)
• output size : 7,9 Gb
– WRF-AND1km
• 669 x 361 x 38 [9177342] (256 cpu's, timestep = 06, runtime 84m)
• output size: 34 Gb
Issues regarding size outputs and time in a domain
like this
– Size of 48 hours outputs of forecast of AND1km domain >
110 Gb
– Writing a shell logic to avoid writing all the species
• First compute 24 hours then restart to compute following 24 hours.
Runtime Increase = x4.9
Output Increase = x4.3
22
Visualization (I)
Wide range of products available to the user.
Displays need to be user friendly.
Hight data quality and presentation.
The products need to be well structured and organized.
Archive is large and well organized
Areas for improvement:
– Generating visual products is not sufficiently facing the user's demand.
– The large amount of products generated storage restrictive policies.
– The large number of pictures generated consume a lot of computing resources and requires monitoring of processes to check that everything is correctly created.
– A large number of tools used. System complexity and difficulty of installing all the necessary software.
– The 3D view is not sufficiently exploited.
23
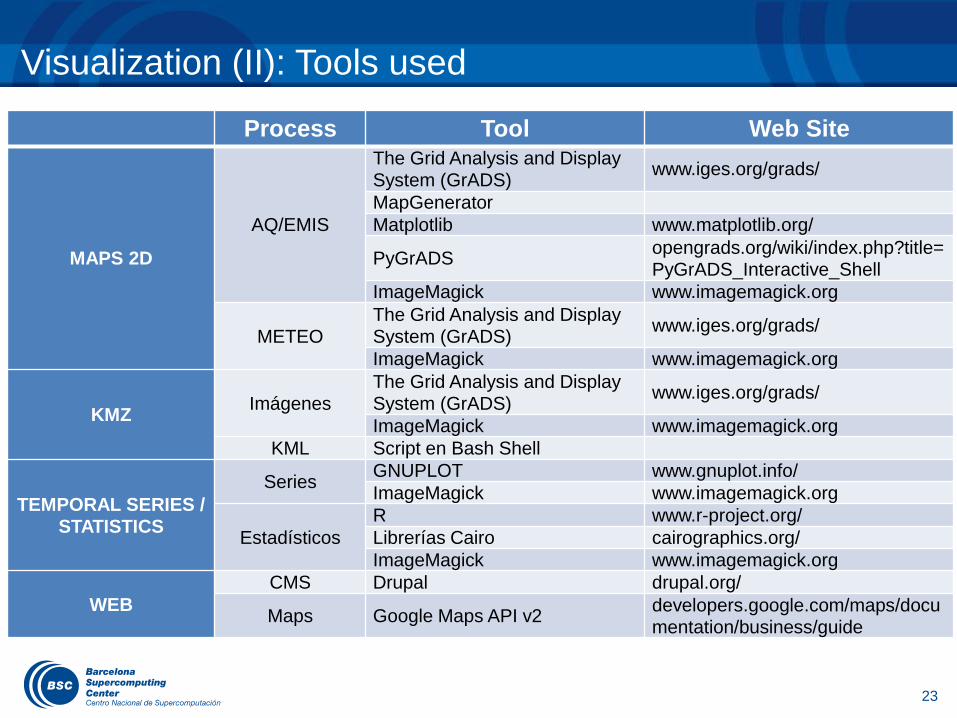
Visualization (II): Tools used
Process Tool Web Site
MAPS 2D
AQ/EMIS
The Grid Analysis and Display System (GrADS)
www.iges.org/grads/
MapGenerator Matplotlib www.matplotlib.org/
PyGrADS opengrads.org/wiki/index.php?title=PyGrADS_Interactive_Shell
ImageMagick www.imagemagick.org
METEO The Grid Analysis and Display System (GrADS)
www.iges.org/grads/
ImageMagick www.imagemagick.org
KMZ Imágenes
The Grid Analysis and Display System (GrADS)
www.iges.org/grads/
ImageMagick www.imagemagick.org KML Script en Bash Shell
TEMPORAL SERIES / STATISTICS
Series GNUPLOT www.gnuplot.info/ ImageMagick www.imagemagick.org
Estadísticos R www.r-project.org/ Librerías Cairo cairographics.org/ ImageMagick www.imagemagick.org
WEB CMS Drupal drupal.org/
Maps Google Maps API v2 developers.google.com/maps/documentation/business/guide
24
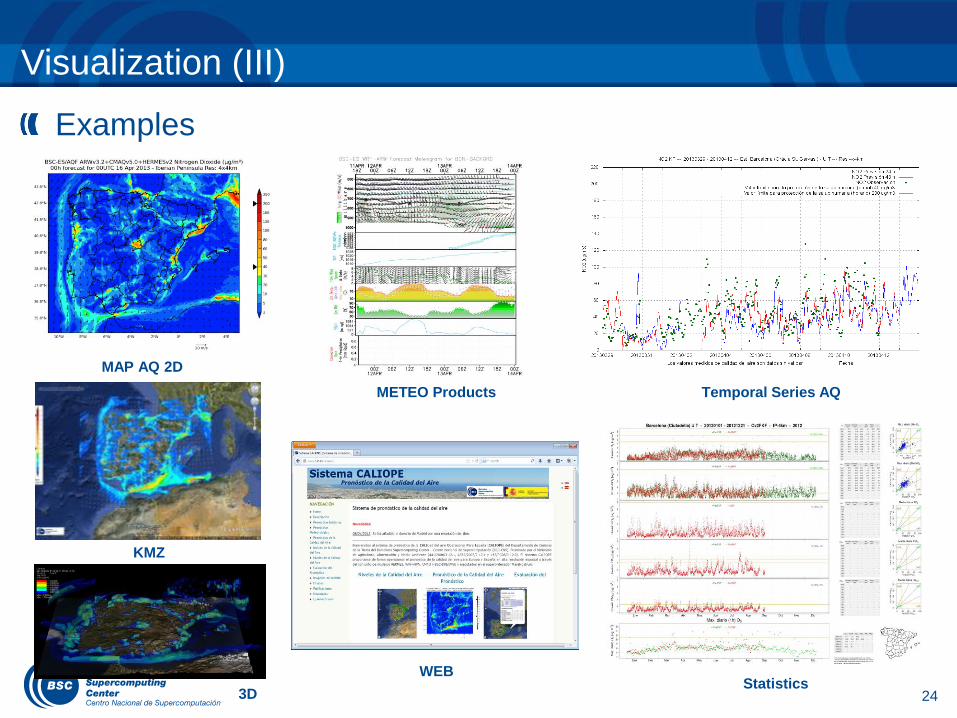
Visualization (III)
Examples
MAP AQ 2D
KMZ
METEO Products Temporal Series AQ
WEB Statistics
3D

26
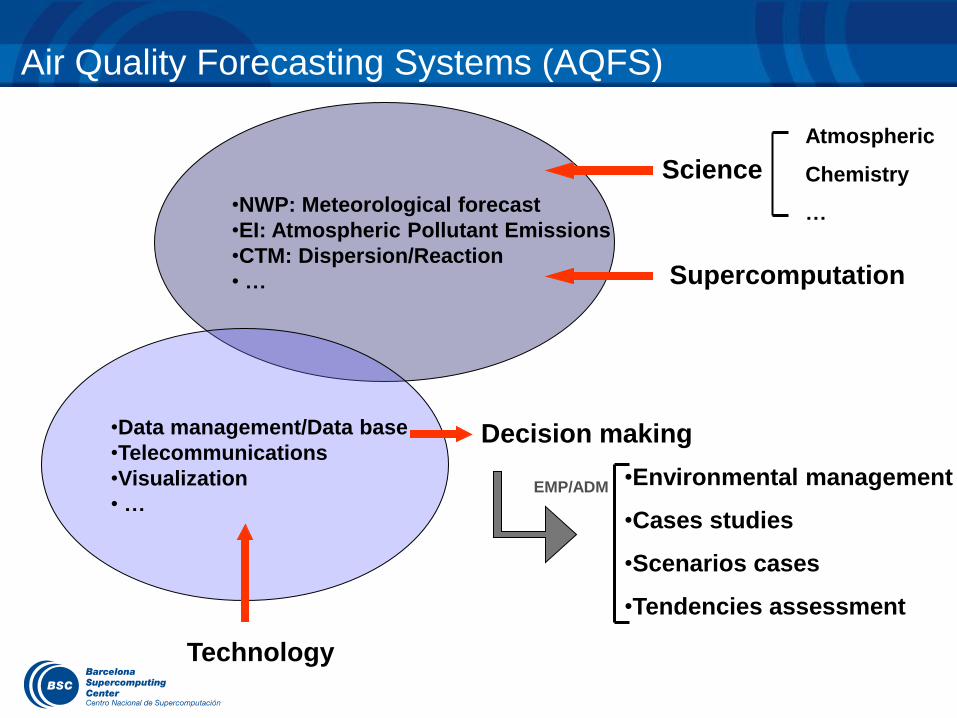
Air Quality Forecasting Systems (AQFS)
•NWP: Meteorological forecast
•EI: Atmospheric Pollutant Emissions
•CTM: Dispersion/Reaction
• …
•Data management/Data base
•Telecommunications
•Visualization
• …
Science
Atmospheric
Chemistry
…
Supercomputation
Technology
Decision making
•Environmental management
•Cases studies
•Scenarios cases
•Tendencies assessment
EMP/ADM

CALIOPE AQFS: Personas y Entidades
V. Sicardi
M. Castrillo
V. Valverde
P. Güereca
L. Gonzalez
…
29
Thank you for your attention
http://www.bsc.es/caliope
http://www.bsc.es/projects/earthscience
/BSC-DREAM/
http://www.bsc.es/projects/earthscience
/nmmbsc-dust-forecast
http://www.nrlmry.navy.mil/aerosol/icap.
1087.php
http://sds-was.aemet.es/


