29
January 23, 2017 Mark Contreras, CEO, Calkins Media OTT Summit
| Date post: | 21-Feb-2017 |
| Category: |
Documents |
| Upload: | mark-contreras |
| View: | 12 times |
| Download: | 0 times |
January 23, 2017
Mark Contreras, CEO, Calkins Media
OTT Summit

Strategy Signals Where are the eyeballs and dollars going?
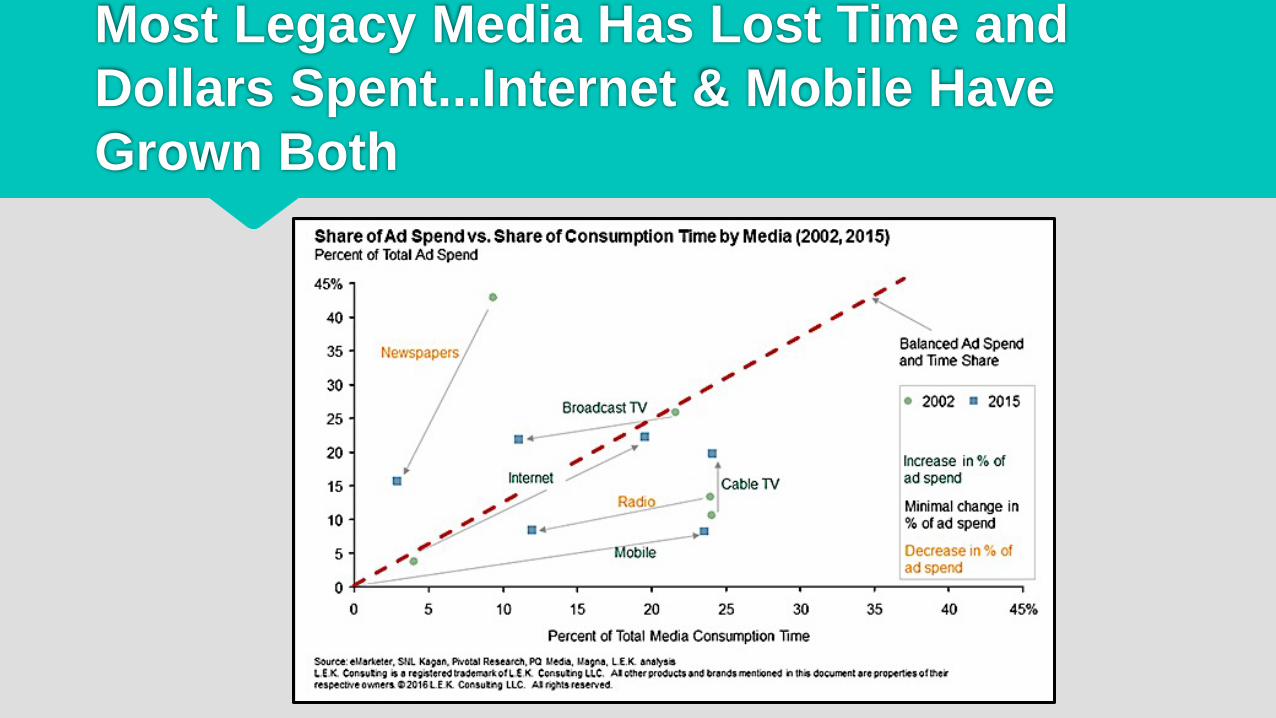
Most Legacy Media Has Lost Time and Dollars Spent...Internet & Mobile Have Grown Both
Source: Source: Nielsen, Media Dynamics, comScore, ZenithOptimedia forecasts eMarketer, The Diffusion Group
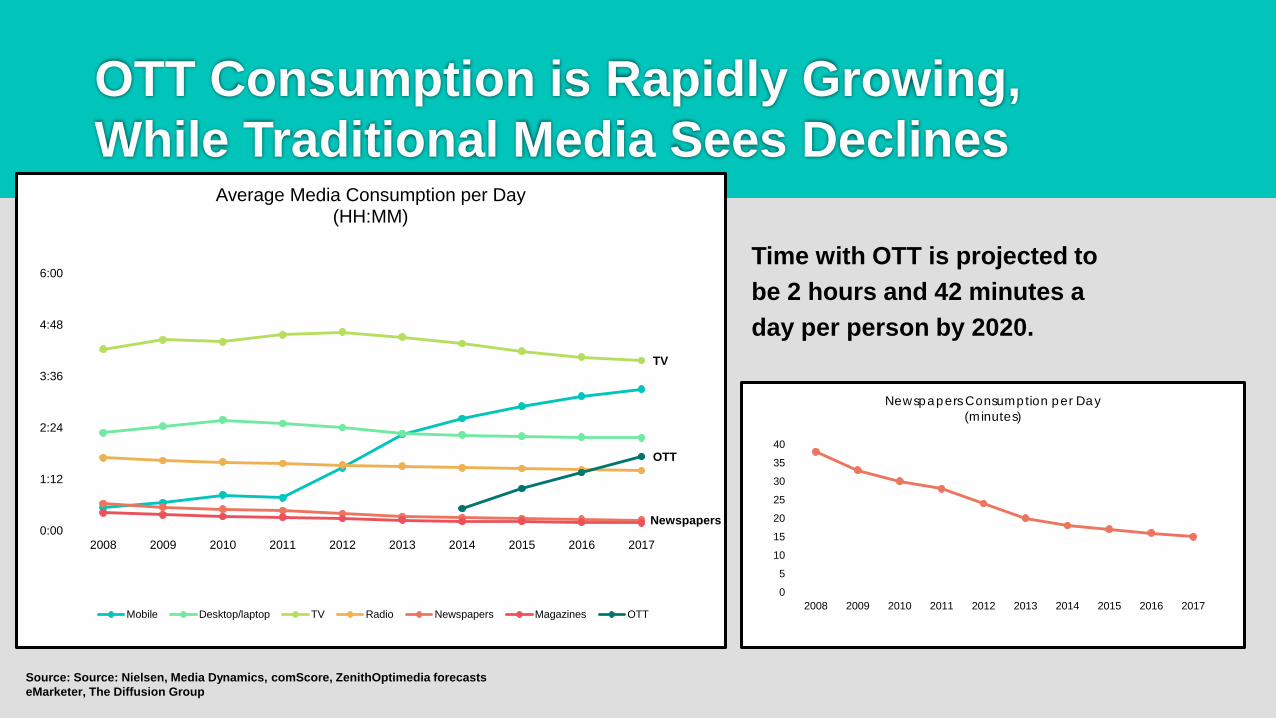
Time with OTT is projected to be 2 hours and 42 minutes a day per person by 2020.
OTT Consumption is Rapidly Growing, While Traditional Media Sees Declines
0
5
10
15
20
25
30
35
40
2008 2009 2010 2011 2012 2013 2014 2015 2016 2017
Newspapers Consumption per Day (minutes)
TV
Newspapers
OTT
0:00
1:12
2:24
3:36
4:48
6:00
2008 2009 2010 2011 2012 2013 2014 2015 2016 2017
Average Media Consumption per Day (HH:MM)
Mobile Desktop/laptop TV Radio Newspapers Magazines OTT
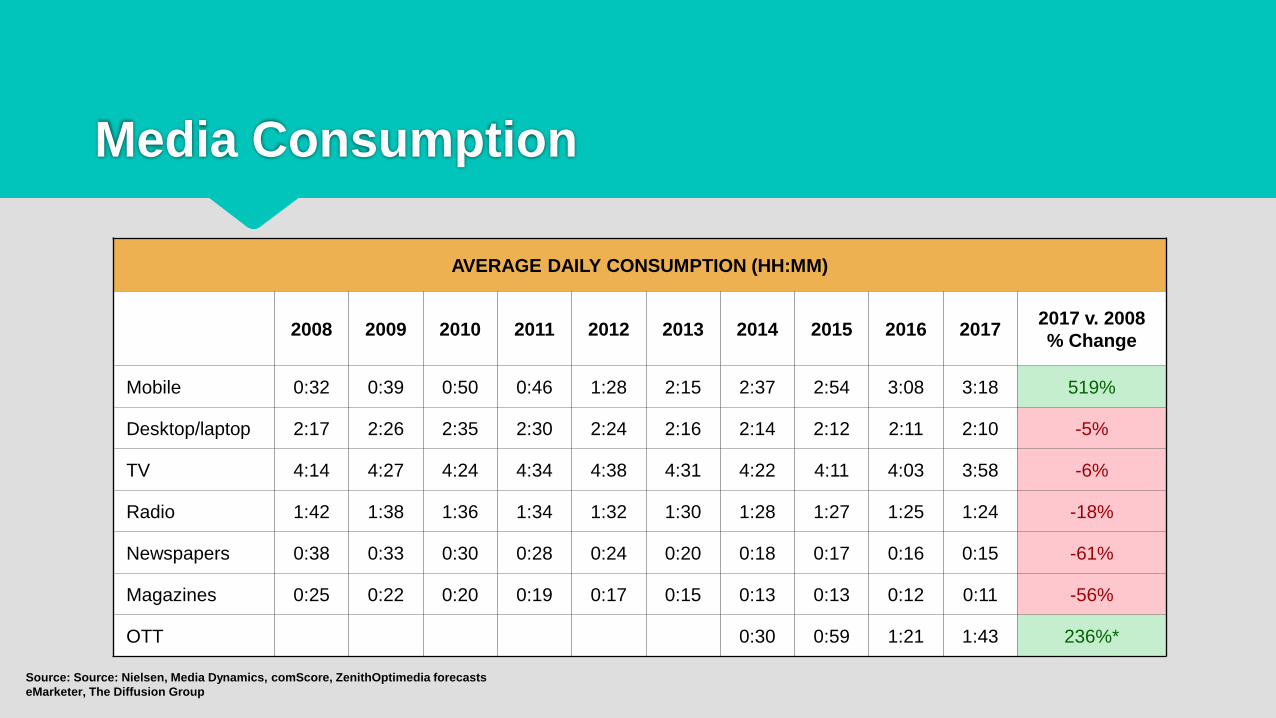
Media Consumption
AVERAGE DAILY CONSUMPTION (HH:MM)
2008 2009 2010 2011 2012 2013 2014 2015 2016 2017 2017 v. 2008 % Change
Mobile 0:32 0:39 0:50 0:46 1:28 2:15 2:37 2:54 3:08 3:18 519%
Desktop/laptop 2:17 2:26 2:35 2:30 2:24 2:16 2:14 2:12 2:11 2:10 -5%
TV 4:14 4:27 4:24 4:34 4:38 4:31 4:22 4:11 4:03 3:58 -6%
Radio 1:42 1:38 1:36 1:34 1:32 1:30 1:28 1:27 1:25 1:24 -18%
Newspapers 0:38 0:33 0:30 0:28 0:24 0:20 0:18 0:17 0:16 0:15 -61%
Magazines 0:25 0:22 0:20 0:19 0:17 0:15 0:13 0:13 0:12 0:11 -56%
OTT 0:30 0:59 1:21 1:43 236%*
Source: Source: Nielsen, Media Dynamics, comScore, ZenithOptimedia forecasts eMarketer, The Diffusion Group

The Audience HAS Shifted
By 2020, there will be 97.7
million US connected TV
households, up from 88.7
million in 2016.
73.8
88.7 92.5 94.9 96.3 97.7
60.7%
72.5% 75.1% 76.6% 77.3% 77.9%
0.0%
20.0%
40.0%
60.0%
80.0%
100.0%
120.0%
0
20
40
60
80
100
120
2015 2016 2017 2018 2019 2020
Connected TV households % of total householdsNote: Connected TVs are TV sets connected to the internet through built-in internet capability or through another device such as a Blu-ray player, game console or set-top box (e.g., Apple TV, Google Chromecast, Roku). Source: eMarketer, Oct 2016
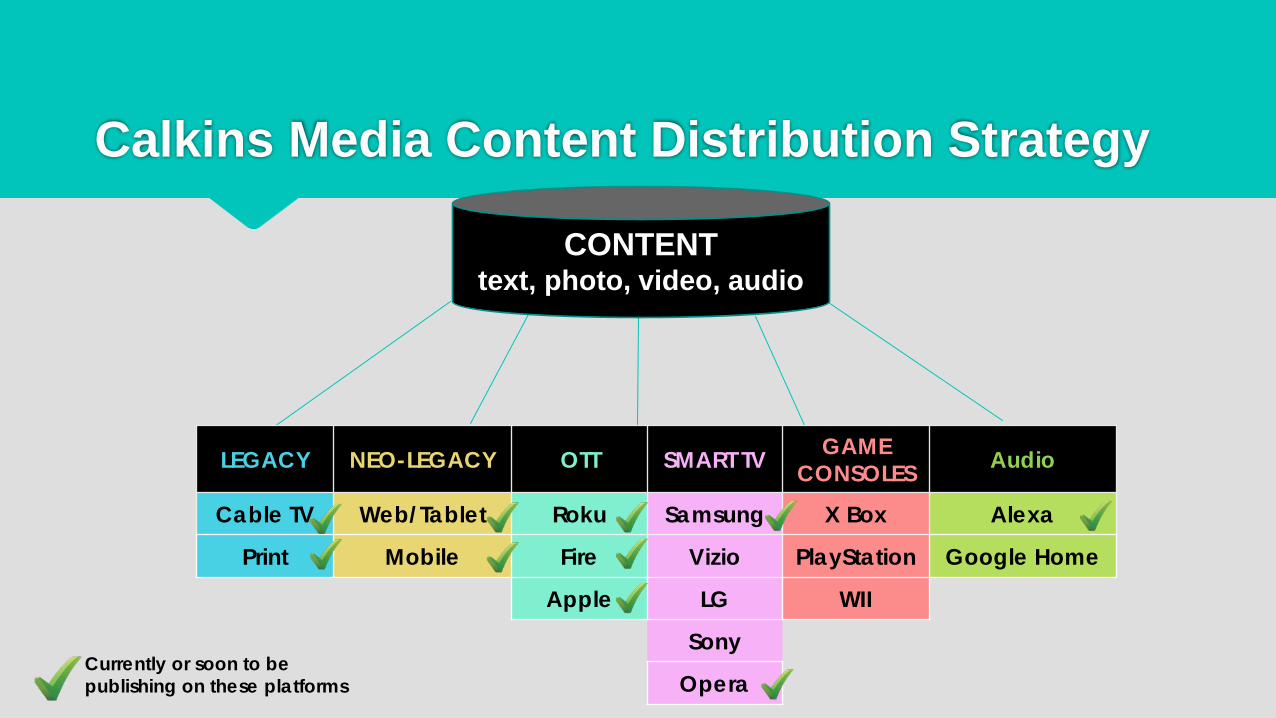
CONTENT text, photo, video, audio
LEGACY NEO-LEGACY OTT SMART TV GAME CONSOLES Audio
Cable TV Web/Tablet Roku Samsung X Box Alexa
Print Mobile Fire Vizio PlayStation Google Home
Apple LG WII
Sony
Opera
Calkins Media Content Distribution Strategy
Currently or soon to be publishing on these platforms
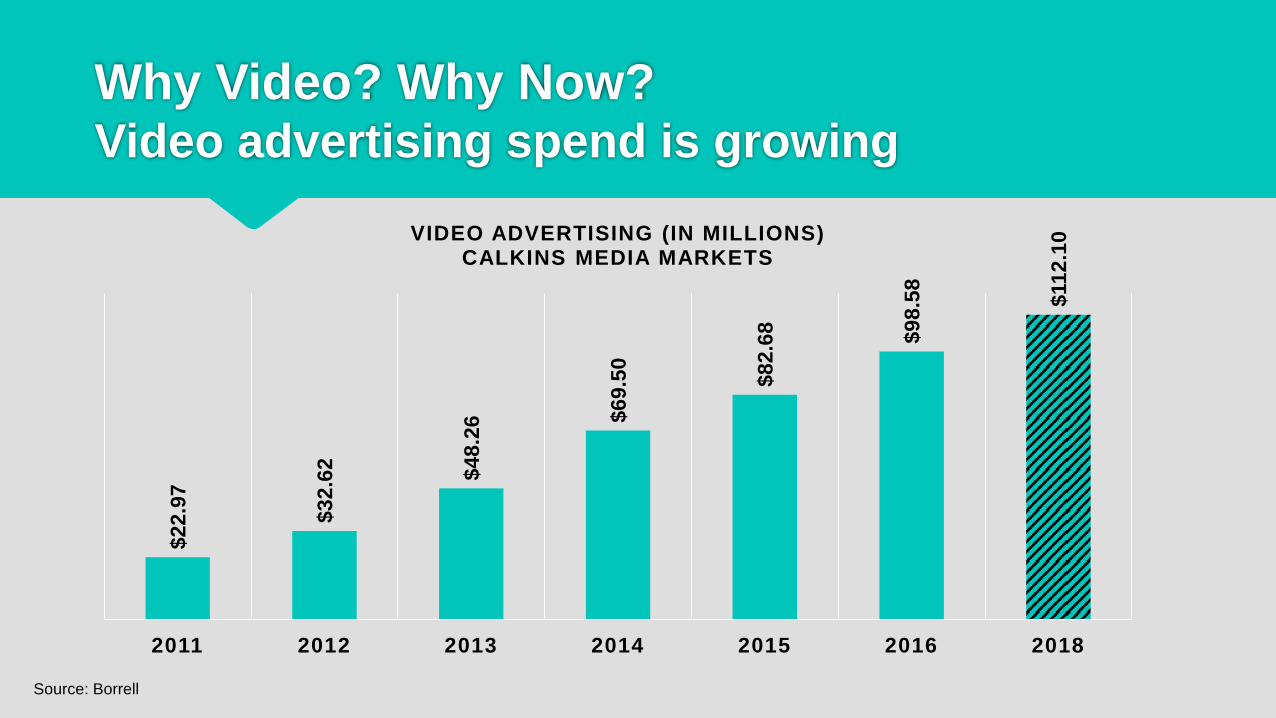
Why Video? Why Now? Video advertising spend is growing
Source: Borrell
$22.
97
$32.
62
$48.
26 $6
9.50
$82.
68
$98.
58
$112
.10
2011 2012 2013 2014 2015 2016 2018
VIDEO ADVERTISING (IN MILLIONS) CALKINS MEDIA MARKETS
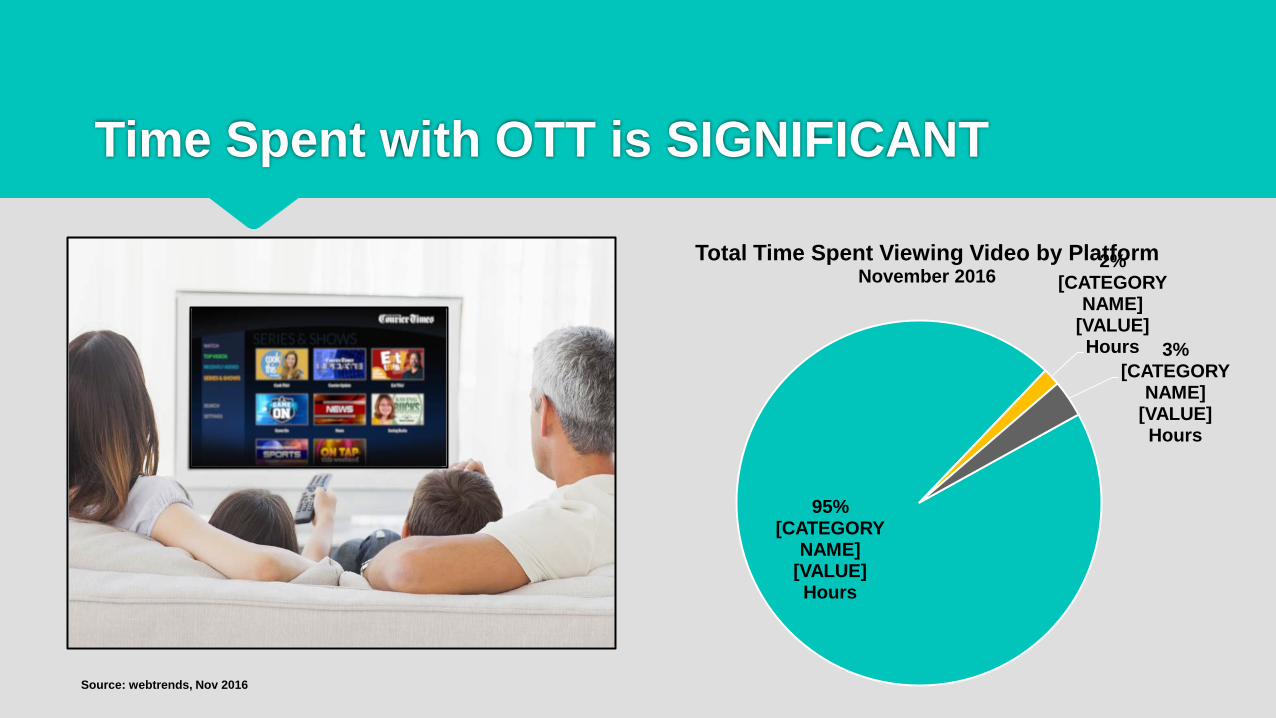
Source: webtrends, Nov 2016
Time Spent with OTT is SIGNIFICANT
95% [CATEGORY
NAME] [VALUE] Hours
2% [CATEGORY
NAME] [VALUE] Hours 3%
[CATEGORY NAME]
[VALUE] Hours
Total Time Spent Viewing Video by Platform November 2016
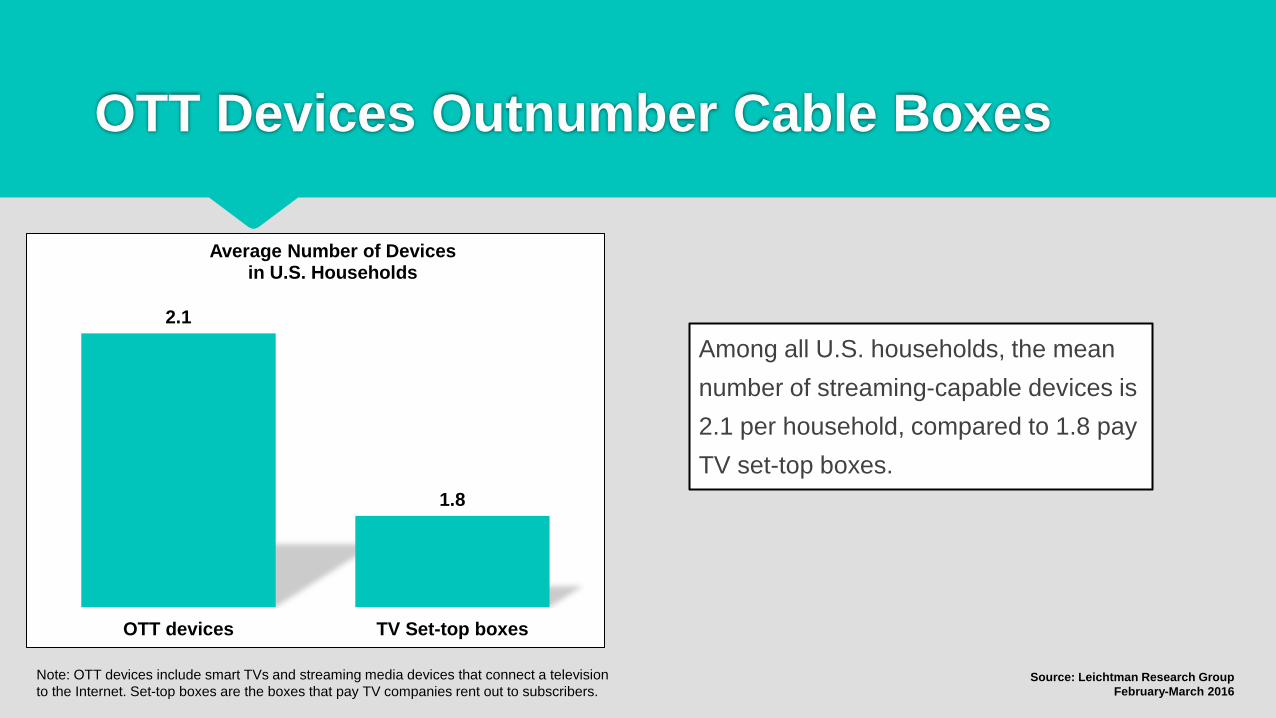
2.1
1.8
OTT devices TV Set-top boxes
Average Number of Devices in U.S. Households
Source: Leichtman Research Group February-March 2016
Note: OTT devices include smart TVs and streaming media devices that connect a television to the Internet. Set-top boxes are the boxes that pay TV companies rent out to subscribers.
Among all U.S. households, the mean number of streaming-capable devices is 2.1 per household, compared to 1.8 pay TV set-top boxes.
OTT Devices Outnumber Cable Boxes

56.5 57.2 57.6 56.2 55.1 54.8 54.5 53.9 53.2 52.4
18.0 21.7 27.0
41.2
56.0
73.8
88.7 92.5 94.9 96.3
2010 2011 2012 2013 2014 2015 2016 2017 2018 2019
Cable and Connected Households (in millions)
Cable TV households Connected TV households
Streaming Households Surpass the Number of US Cable Households
Source: eMarketer, Oct 2016 Note: Cable TV: households with a subscription to cable TV service Connected TV: households with at least one connected TV set, where at least one person of any age uses the internet through a connected TV at least once per month
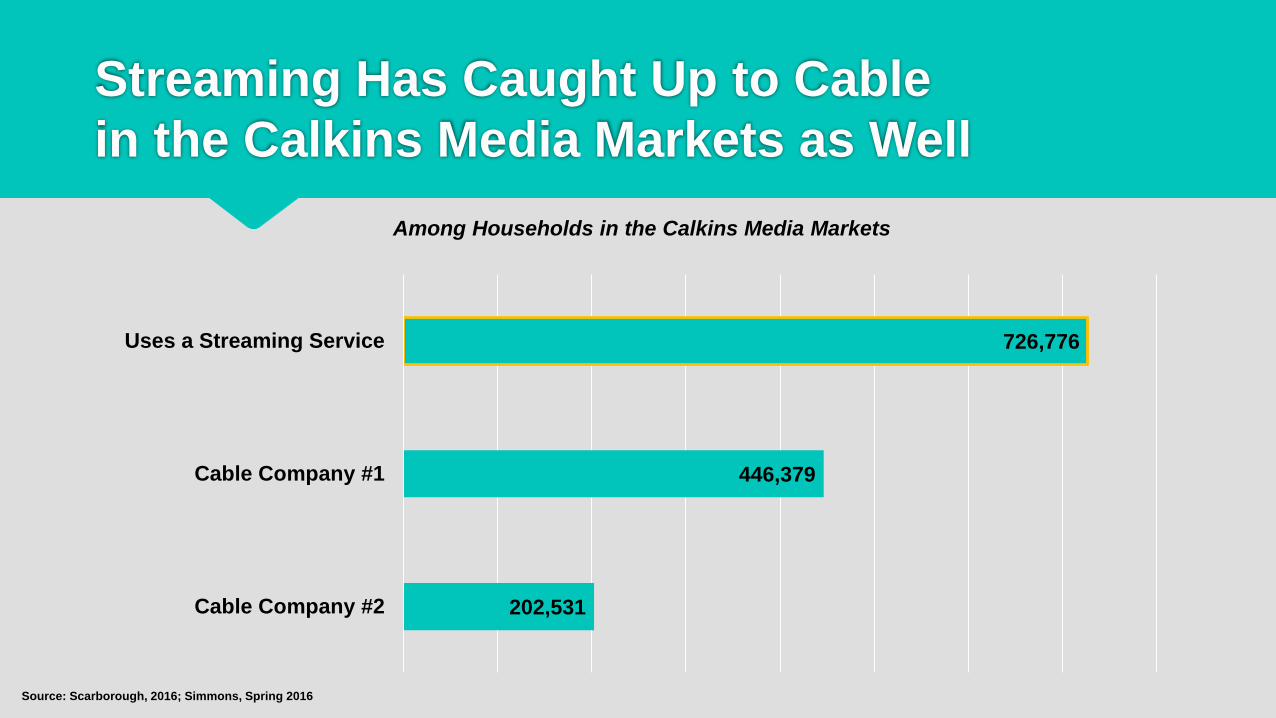
Among Households in the Calkins Media Markets
Source: Scarborough, 2016; Simmons, Spring 2016
Streaming Has Caught Up to Cable in the Calkins Media Markets as Well
202,531
446,379
726,776
Cable Company #2
Cable Company #1
Uses a Streaming Service

Content Strategy
BIG IDEA 1
To take a print-centered
newsroom and transform it into
a video-driven newsroom using
existing people and dollars.

Newsroom People Training & Development
Drew Berry & Associates, LLC 300 E. Lombard St. Suite 840 Baltimore, MD 21202 410-814-7555 [email protected]
Drew Berry A two-time Emmy Award-winning President of Drew Berry & Associates, LLC, which is a media consulting agency Berry has more than 25 years of experience in the television news industry in numerous markets including New York City, Philadelphia, Dallas, Atlanta and New Orleans. He won his Emmys in his role as news director for CBS in Philadelphia Berry's experience includes teaching and practicing journalism as well as major involvement on various boards and committees
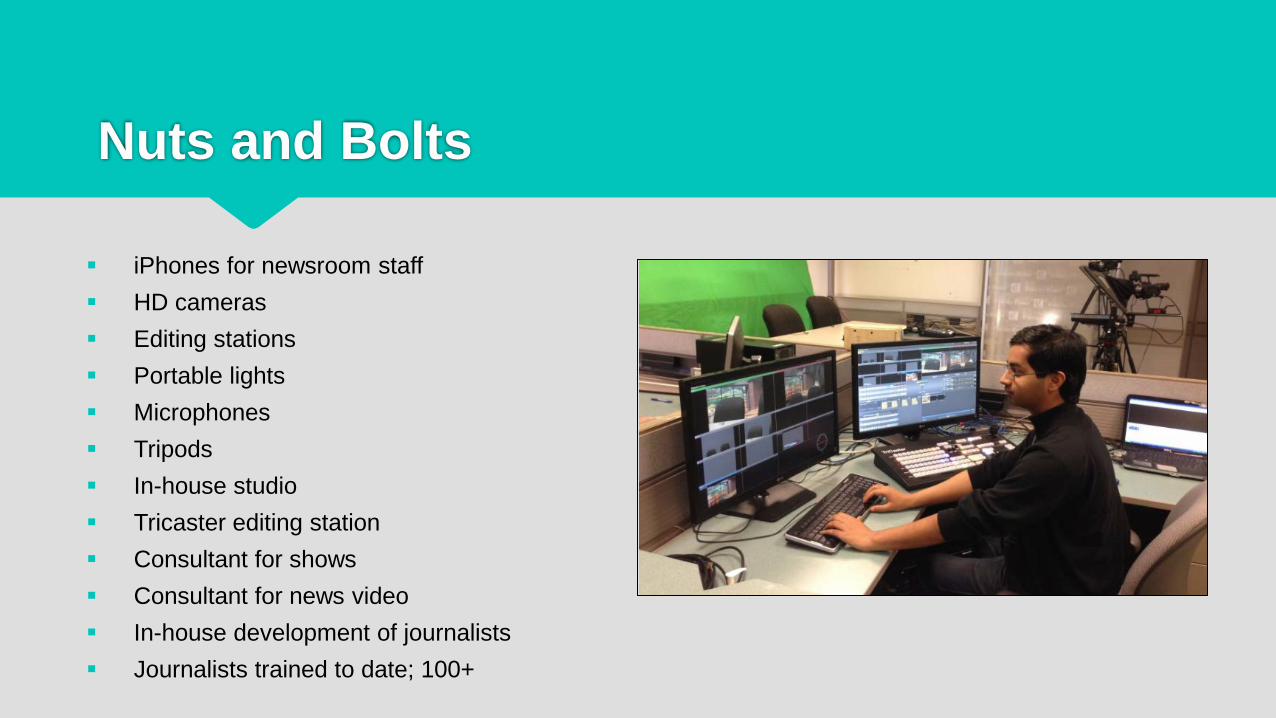
Nuts and Bolts
iPhones for newsroom staff HD cameras Editing stations Portable lights Microphones Tripods In-house studio Tricaster editing station Consultant for shows Consultant for news video In-house development of journalists Journalists trained to date; 100+

Show Development
James Andrew Miller Award-winning journalist who has worked in politics, media, and entertainment in a career spanning more than 30 years Executive VP of Original Programming for USA Network Producer with CBS News and Senior Executive Producer of both Anderson Cooper 360 & Paula Zahn Now Author of the recently released NYT best selling book Powerhouse, The Untold Story of Hollywood’s Creative Artists Agency, Those Guys Have All the Fun, Inside the World of ESPN, and Live From New York, An Uncensored History of Saturday Night Live, His first book, RUNNING IN PLACE: Inside the Senate, was also a bestseller.
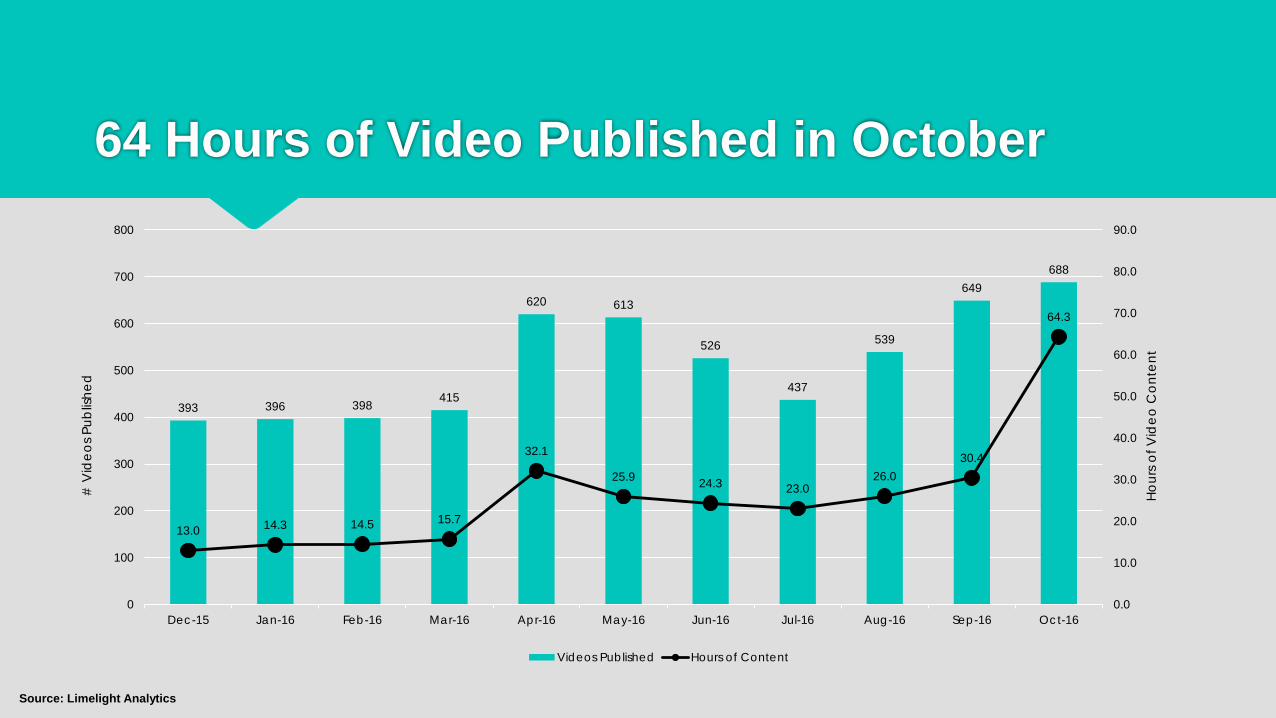
64 Hours of Video Published in October
Source: Limelight Analytics
393 396 398 415
620 613
526
437
539
649 688
13.0 14.3 14.5 15.7
32.1
25.9 24.3 23.0 26.0
30.4
64.3
0.0
10.0
20.0
30.0
40.0
50.0
60.0
70.0
80.0
90.0
0
100
200
300
400
500
600
700
800
Dec-15 Jan-16 Feb-16 Mar-16 Apr-16 May-16 Jun-16 Jul-16 Aug-16 Sep-16 Oct-16
Hou
rs o
f Vid
eo C
onte
nt
# V
ideo
s Pub
lishe
d
Videos Published Hours of Content
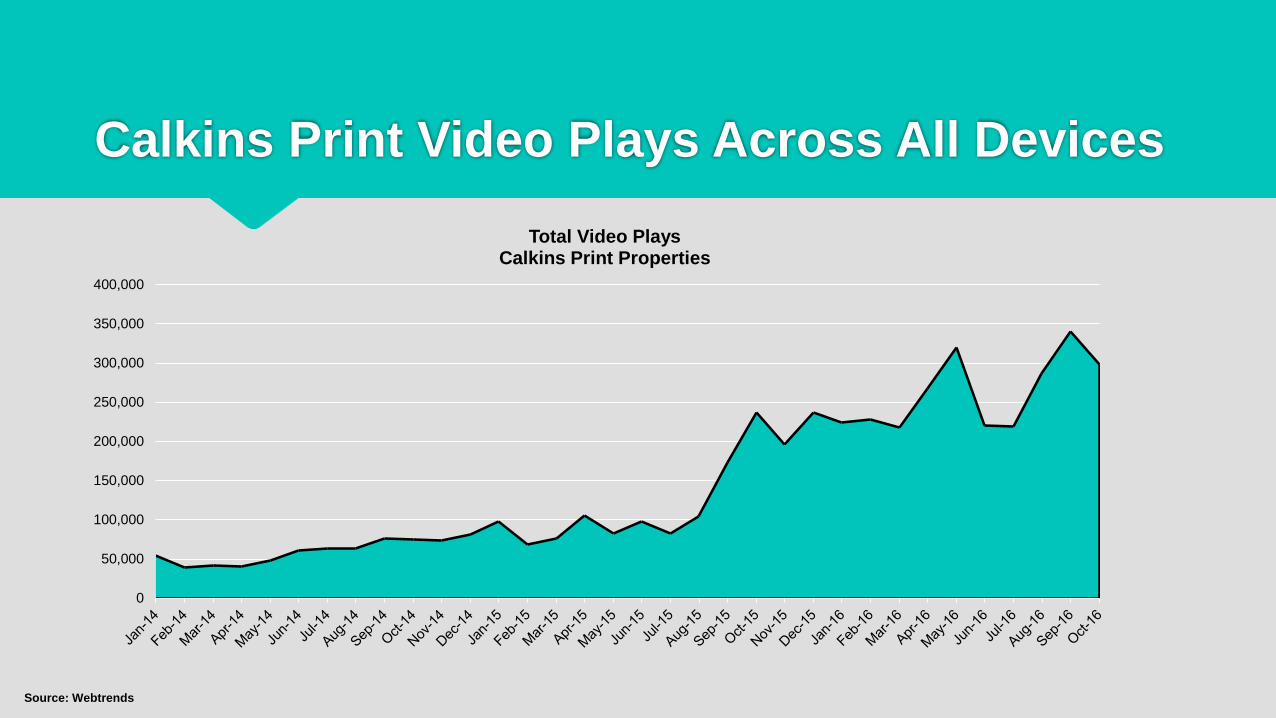
Calkins Print Video Plays Across All Devices
Source: Webtrends
0
50,000
100,000
150,000
200,000
250,000
300,000
350,000
400,000
Total Video Plays Calkins Print Properties
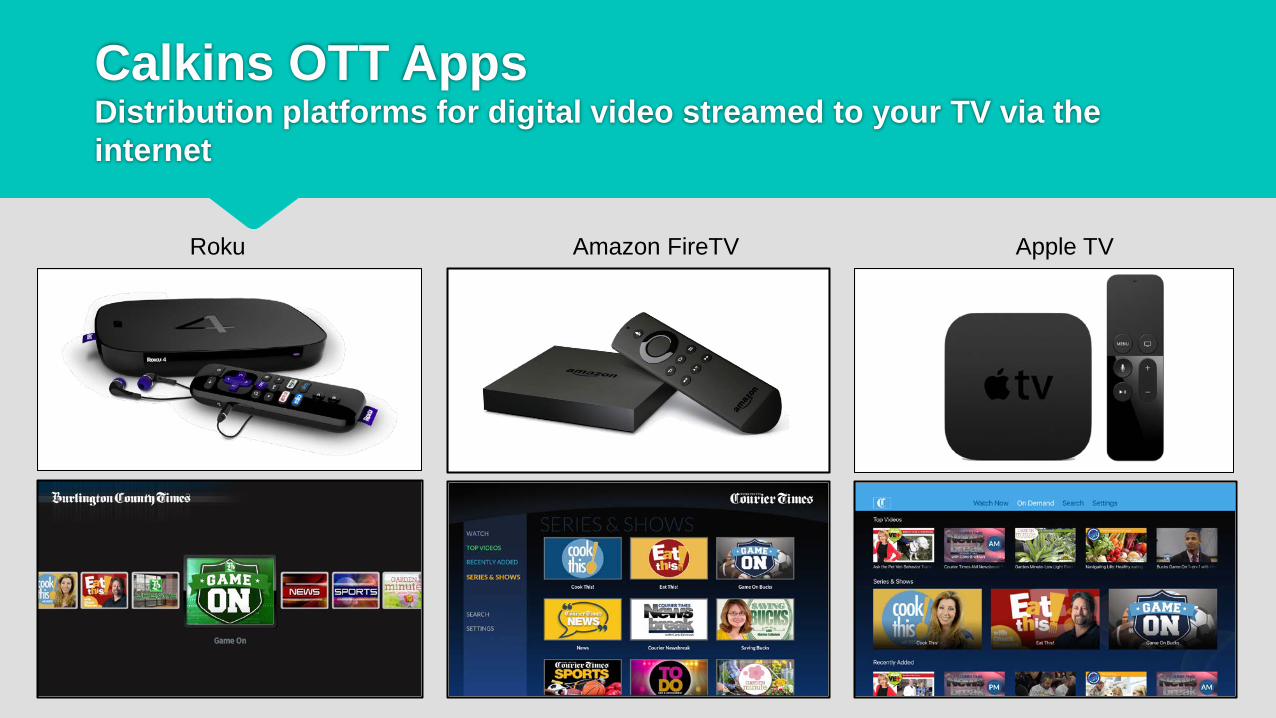
Calkins OTT Apps Distribution platforms for digital video streamed to your TV via the internet
Roku Amazon FireTV Apple TV
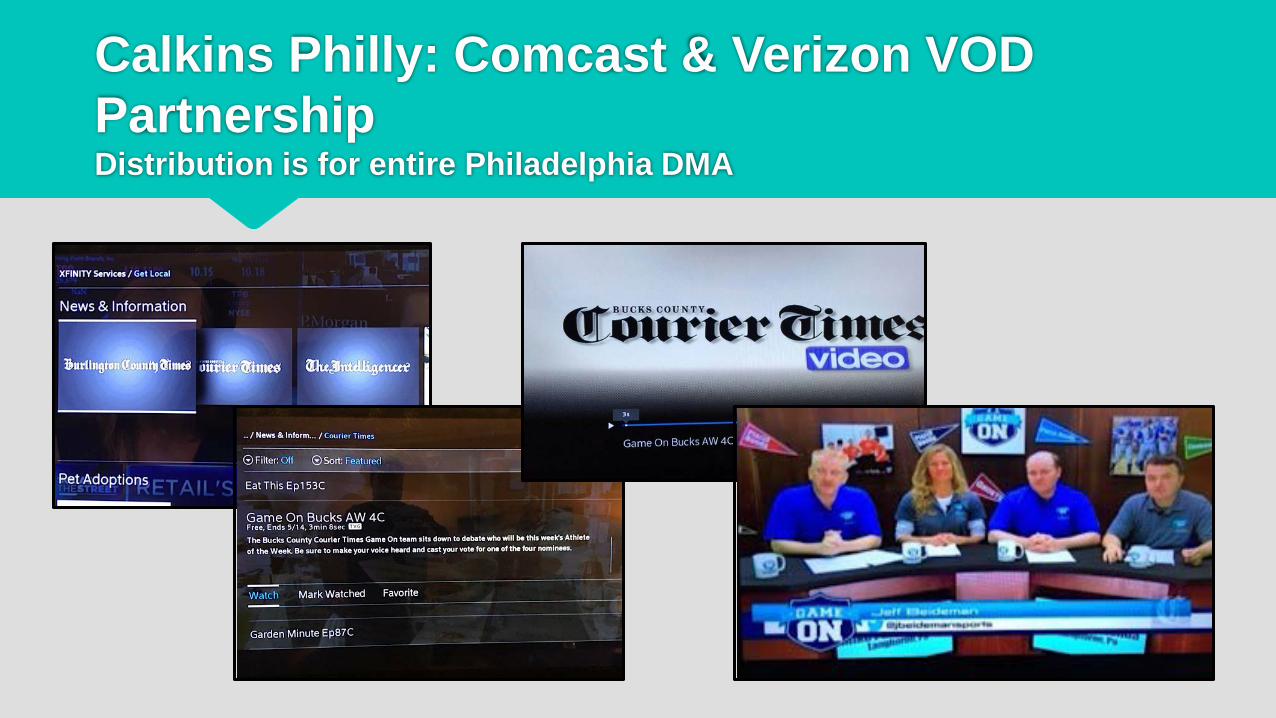
Calkins Philly: Comcast & Verizon VOD Partnership Distribution is for entire Philadelphia DMA

BIG IDEA 2
Creating an OTT linear stream at a
local broadcast TV station to
generate additional audience and
revenue using existing resources.
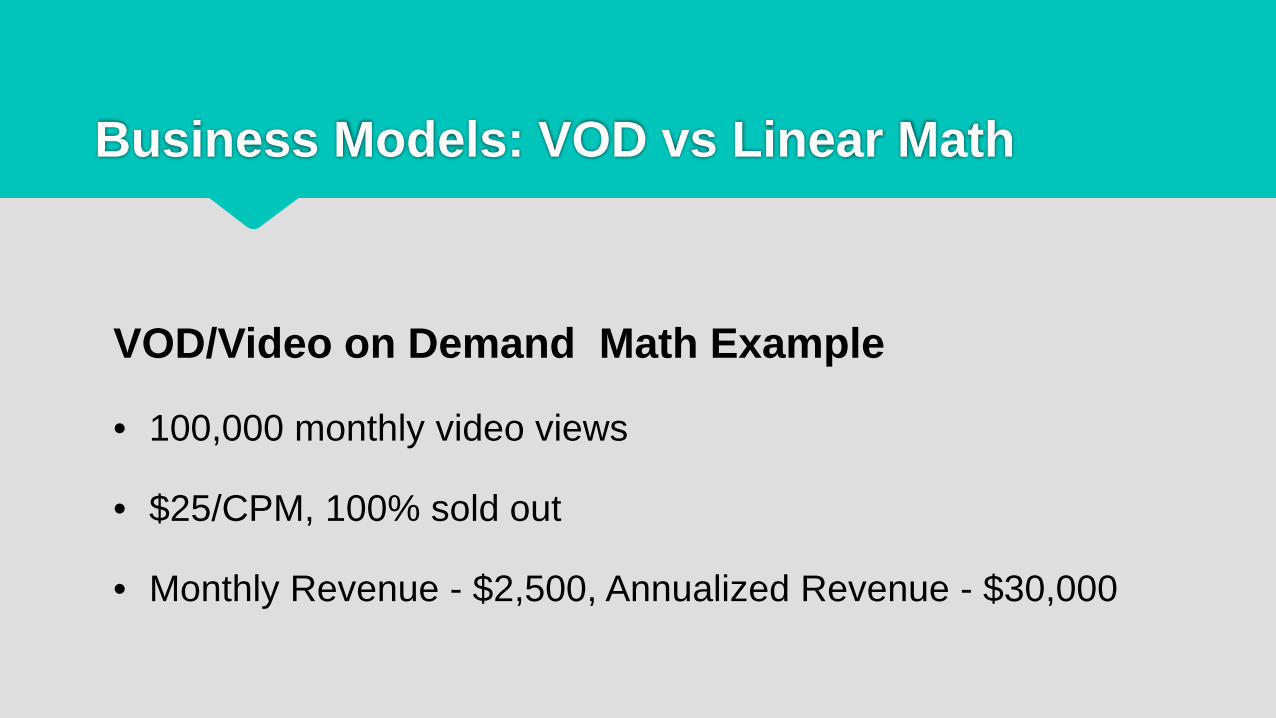
VOD/Video on Demand Math Example
• 100,000 monthly video views
• $25/CPM, 100% sold out
• Monthly Revenue - $2,500, Annualized Revenue - $30,000
Business Models: VOD vs Linear Math
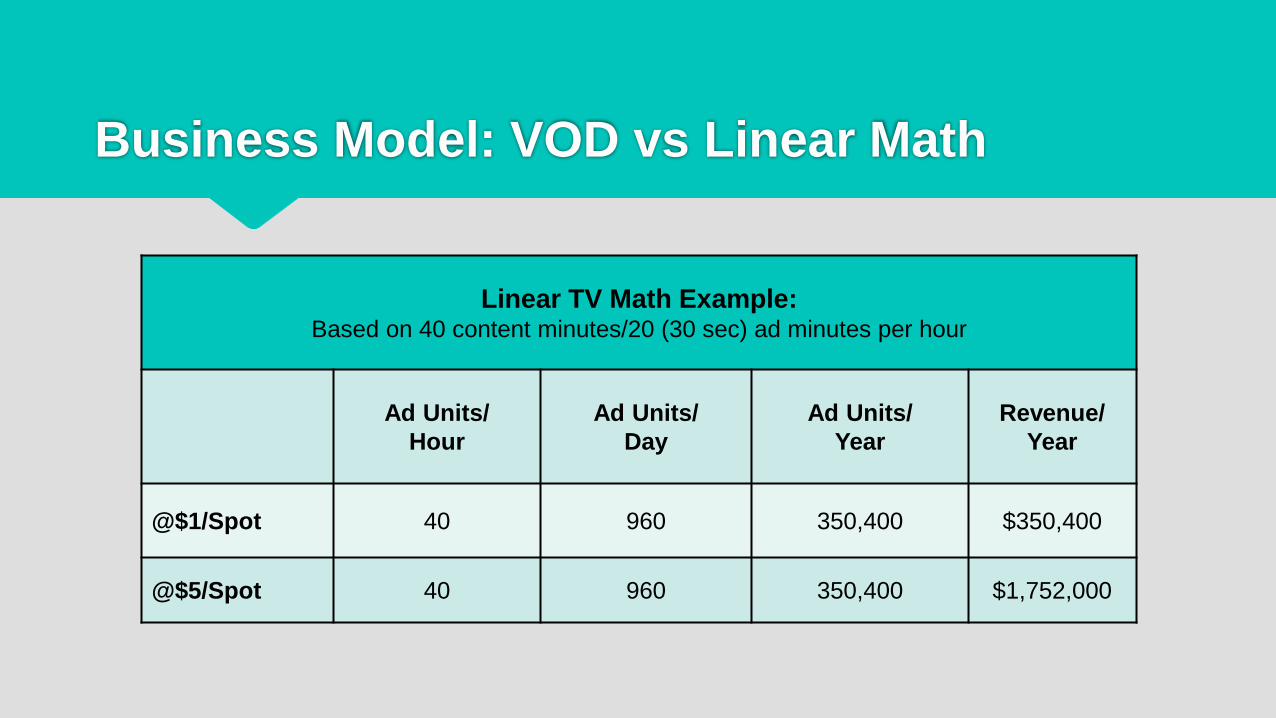
Linear TV Math Example: Based on 40 content minutes/20 (30 sec) ad minutes per hour
Ad Units/ Hour
Ad Units/ Day
Ad Units/ Year
Revenue/ Year
@$1/Spot 40 960 350,400 $350,400
@$5/Spot 40 960 350,400 $1,752,000
Business Model: VOD vs Linear Math
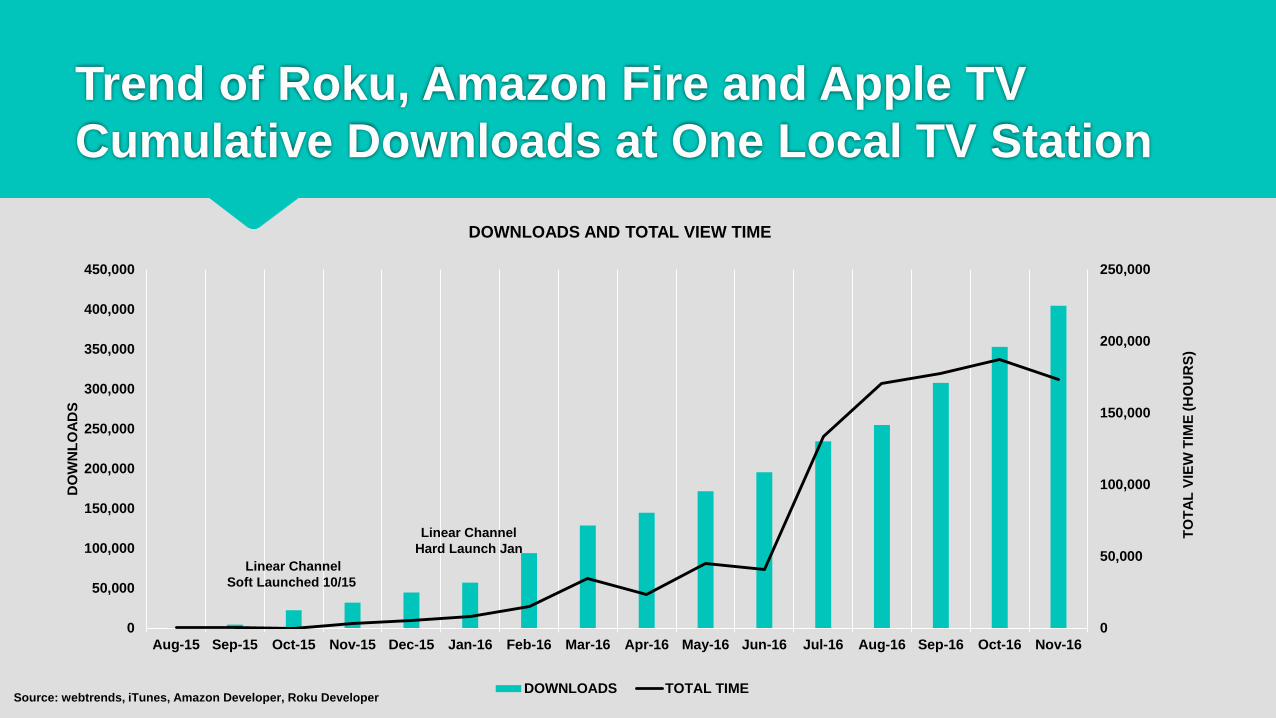
Trend of Roku, Amazon Fire and Apple TV Cumulative Downloads at One Local TV Station
Source: webtrends, iTunes, Amazon Developer, Roku Developer
0
50,000
100,000
150,000
200,000
250,000
0
50,000
100,000
150,000
200,000
250,000
300,000
350,000
400,000
450,000
Aug-15 Sep-15 Oct-15 Nov-15 Dec-15 Jan-16 Feb-16 Mar-16 Apr-16 May-16 Jun-16 Jul-16 Aug-16 Sep-16 Oct-16 Nov-16
TOTA
L VI
EW T
IME
(HO
UR
S)
DO
WN
LOAD
S
DOWNLOADS AND TOTAL VIEW TIME
DOWNLOADS TOTAL TIME
Linear Channel Soft Launched 10/15
Linear Channel Hard Launch Jan
Source: Webtrends, November 2016
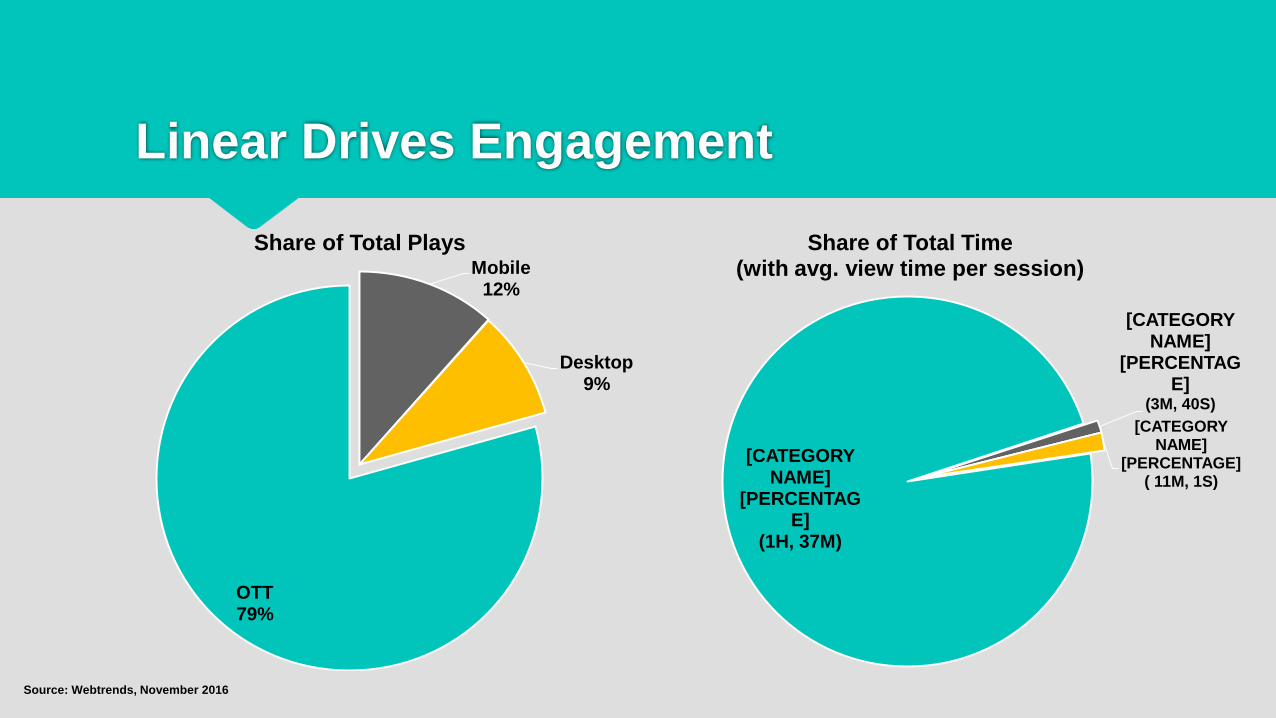
Mobile 12%
Desktop 9%
OTT 79%
Share of Total Plays
[CATEGORY NAME]
[PERCENTAGE]
(3M, 40S) [CATEGORY
NAME] [PERCENTAGE]
( 11M, 1S) [CATEGORY
NAME] [PERCENTAG
E] (1H, 37M)
Share of Total Time (with avg. view time per session)
Linear Drives Engagement
Source: Webtrends, November, 2016
0
500
1,000
1,500
2,000
2,500
3,000
0
2,000
4,000
6,000
8,000
10,000
12,000
14,000
16,000
12:0
0 A
M
1:00
AM
2:00
AM
3:00
AM
4:00
AM
5:00
AM
6:00
AM
7:00
AM
8:00
AM
9:00
AM
10:0
0 A
M
11:0
0 A
M
12:0
0 PM
1:00
PM
2:00
PM
3:00
PM
4:00
PM
5:00
PM
6:00
PM
7:00
PM
8:00
PM
9:00
PM
10:0
0 PM
11:0
0 PM
Web
site
Pla
ys
OTT
Pla
ys
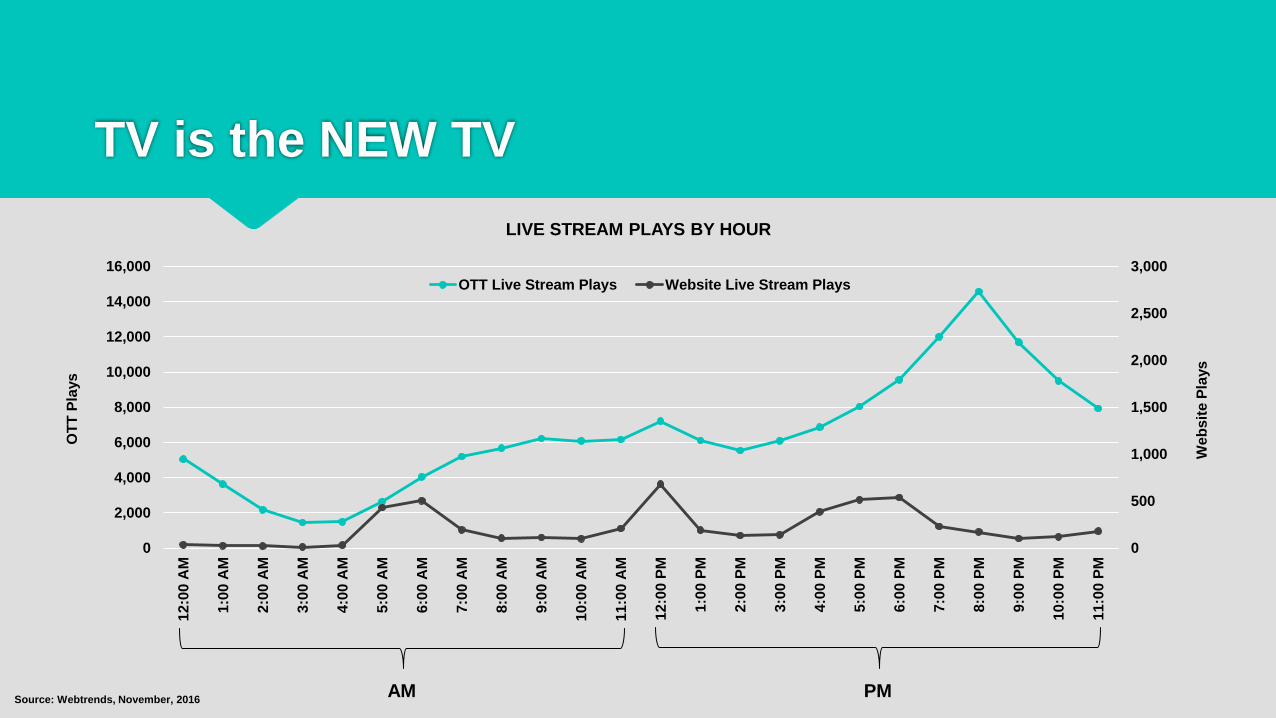
LIVE STREAM PLAYS BY HOUR
OTT Live Stream Plays Website Live Stream Plays
TV is the NEW TV
AM PM
Good News
• Gateway to cable carriage, low power OTA, virtual MVPDs
• Legacy TV sales reps can sell it
• Preserves legacy TV pricing model
Bad News
• Traditional TV syndicators don’t have rules yet
• It’s hard and requires a lot of planning
• There is a hard cost (bandwidth) associated with delivery that scales quickly
Linear OTT Facts

Questions?


