27
November 2015 Callidus Capital Corporation Investor Presentation
November 2015
Callidus Capital CorporationInvestor Presentation
2
Forward-Looking Information
This document contains “forward-looking information” within the meaning of applicableCanadian securities legislation. Such forward-looking information includes, forward-lookingstatements regarding Callidus and the industries in which it operates, including statementsabout, among other things, expectations, beliefs, plans, future loans and origination,business and acquisition strategies, opportunities, objectives, prospects, assumptions,including those related to trends and prospects and future events and performance.Sentences and phrases containing or modified by words such as “anticipate”, “plan”,“continue”, “estimate”, “intend”, “expect”, “may”, “will”, “project”, “predict”, “potential”,“targets”, “projects”, “is designed to”, “strategy”, “should”, “believe”, “contemplate” andsimilar expressions, and the negative of such expressions, are not historical facts and areintended to identify forward-looking statements. These statements involve known andunknown risks, uncertainties and other factors that may cause actual results or events todiffer materially from those anticipated in such forward-looking statements. Forward-lookingstatements should not be read as guarantees of future events, future performance orresults, and will not necessarily be accurate indicators of the times at, or by which, suchevents, performance or results will be achieved, if achieved at all. Forward-lookingstatements are based on information available at the time and/or management’sexpectations with respect to future events that involve a number of risks and uncertainties,any of which could cause actual results to differ materially from those expressed in orimplied by the forward-looking statements.
Specific forward-looking statements contained in this document include, among others,statements, management’s beliefs, expectations or intentions regarding the following:Callidus’ expected growth, including organic growth in the Canadian market; throughacquisitions; expansion of the ‘Callidus Lite’ loan product; through expansion into the UnitedStates; and the purchase of Loan Assets from the Catalyst Funds; the targeted GrossYields of the Callidus and ‘Callidus Lite’ loans; funding pursuant to the ParticipationAgreement and the relationships between Callidus, CCGI and the Catalyst Funds.
In making the forward-looking statements, the Corporation has made assumptionsregarding: general economic conditions, reliance on debt financing, funding pursuant to theParticipation Agreement, interest rates, continued lack of ABL regulation, continuedoperation of key systems, debt service, the expectation that the number of industrycompetitors in Callidus’ marketplace will continue to decline, bank lending to mid-marketcompanies will continue to be constrained for at least several years, future capital needs,retention of key employees, adequate management of conflicts of interests, continuedperformance of the Loan Portfolio and solvency of borrowers, limited loan prepayment,effective use of leverage, and such other risks or factors described in the final prospectus
and from time to time in public disclosure documents of Callidus that are filed with securitiesregulatory authorities.
Forward-looking statements involve significant risks and uncertainties, should not be readas guarantees of future events, performance or results, and will not necessarily be accurateindicators of whether such events, performance or results will be achieved. Forward-lookingstatements are based on information available at the time and/or management’sexpectations with respect to future events that involve a number of risks and uncertainties.Any forward-looking information concerning prospective results of operations, financialposition, expectations of cash flows and future cash flows is based upon assumptions aboutfuture results, economic conditions and courses of action and is presented for the purposeof providing prospective purchasers with a more complete perspective on Callidus’ presentand planned future operations. Such information may not be appropriate for other purposesand actual results may differ materially from those anticipated in such forward-lookingstatements.
To the extent any forward-looking information in this MD&A constitutes future-orientedfinancial information or financial outlooks within the meaning of Canadian securities laws,such information has been prepared by the Corporation to provide a reasonable estimate ofthe potential earnings of the current loan portfolio, subject to (among other things) theassumptions and risks discussed in this MD&A, and readers are cautioned that thisinformation should not be relied upon for any other purpose. Future-oriented financialinformation and financial outlooks are, without limitation, based on the assumptions andsubject to the risks set out herein.
The Corporation discloses a number of financial measures in this document that arecalculated and presented using methodologies other than in accordance with IFRS. TheCorporation utilizes these measures in managing the business, including performancemeasurement and valuation purposes, and believes that providing these performancemeasures on a supplemental basis to its IFRS results is helpful to investors in assessingthe overall performance of the business of the Corporation. These financial measuresshould not be considered as a substitute for similar financial measures calculated inaccordance with IFRS. The Corporation cautions readers that these non-IFRS financialmeasures may differ materially from the calculations disclosed by other businesses, and asa result, may not be comparable to similar measures presented by others. Reconciliationsof these non-IFRS financial measures to the most directly comparable financial measurescalculated and presented in accordance with IFRS are included within the company’s mostrecent MD&A. See also the sections entitled “Non-IFRS Measures” and ‘Outlook” in suchMD&A.
Disclaimers

3
What is Callidus?
Specialty Asset-Based Lender
Focus on Canadian and select U.S. companies
Target borrowers who are unable to obtain adequate financing from conventional lenders
Value-Based Lending
Top of the balance sheet
First lien
Senior secured
Fully collateralized
Actively monitor loans and collateral
Flexible & Innovative Loan Structuring
Tailored to borrowers’ needs
Dominion over cash (blocked accounts)
Frequent collateral monitoring
Demand loans
High Degree of Expertise
In-house team and proprietary systems
Ongoing, hands-on approach
Highly streamlined credit approval process
Strong relationship with Catalyst
Strong Track Record
Gross loans receivable of $1,193 million(1) up 82% Y/Y
Average loan portfolio outstanding of $1,102 million(2), up 19% Q/Q and 81% Y/Y
Loan pipeline of $600 million(3)
Expansion of loan product – continued success of Callidus Lite
Continued growth in Canada and the U.S.
1. September 30, 2015
2. Quarter ended September 30, 2015
3. November 5, 2015
4
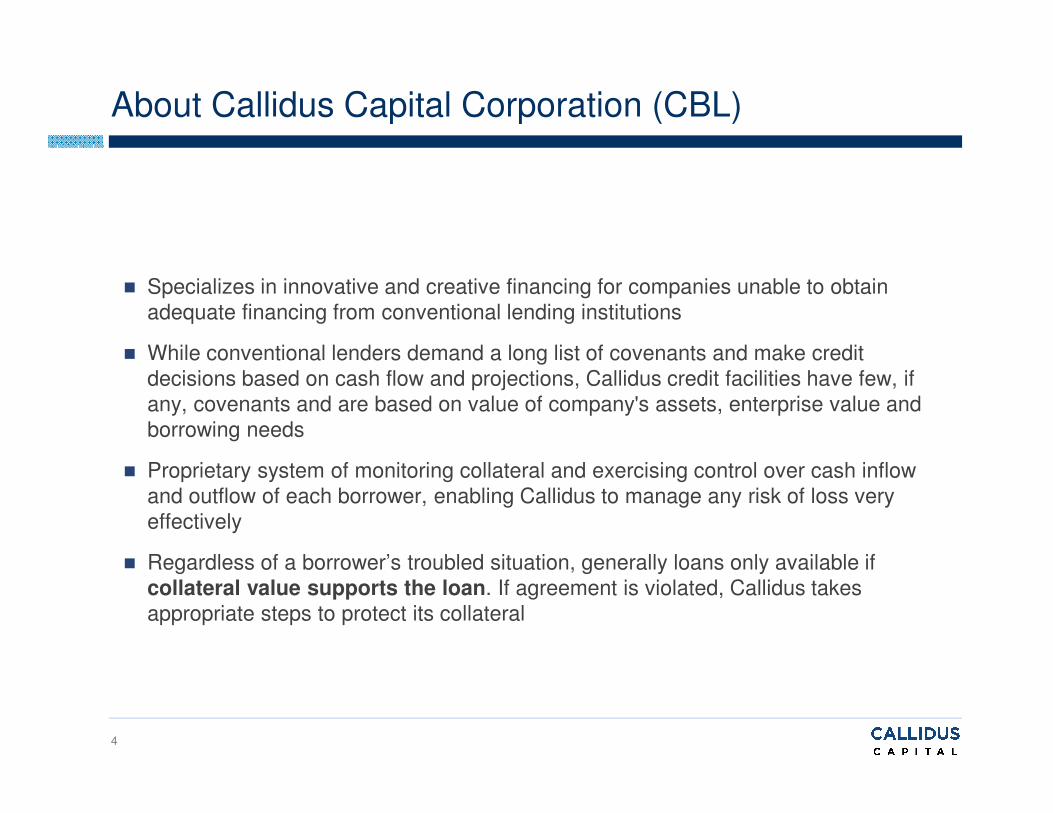
About Callidus Capital Corporation (CBL)
� Specializes in innovative and creative financing for companies unable to obtain adequate financing from conventional lending institutions
� While conventional lenders demand a long list of covenants and make credit decisions based on cash flow and projections, Callidus credit facilities have few, if any, covenants and are based on value of company's assets, enterprise value and borrowing needs
� Proprietary system of monitoring collateral and exercising control over cash inflow and outflow of each borrower, enabling Callidus to manage any risk of loss very effectively
� Regardless of a borrower’s troubled situation, generally loans only available if collateral value supports the loan. If agreement is violated, Callidus takes appropriate steps to protect its collateral
5
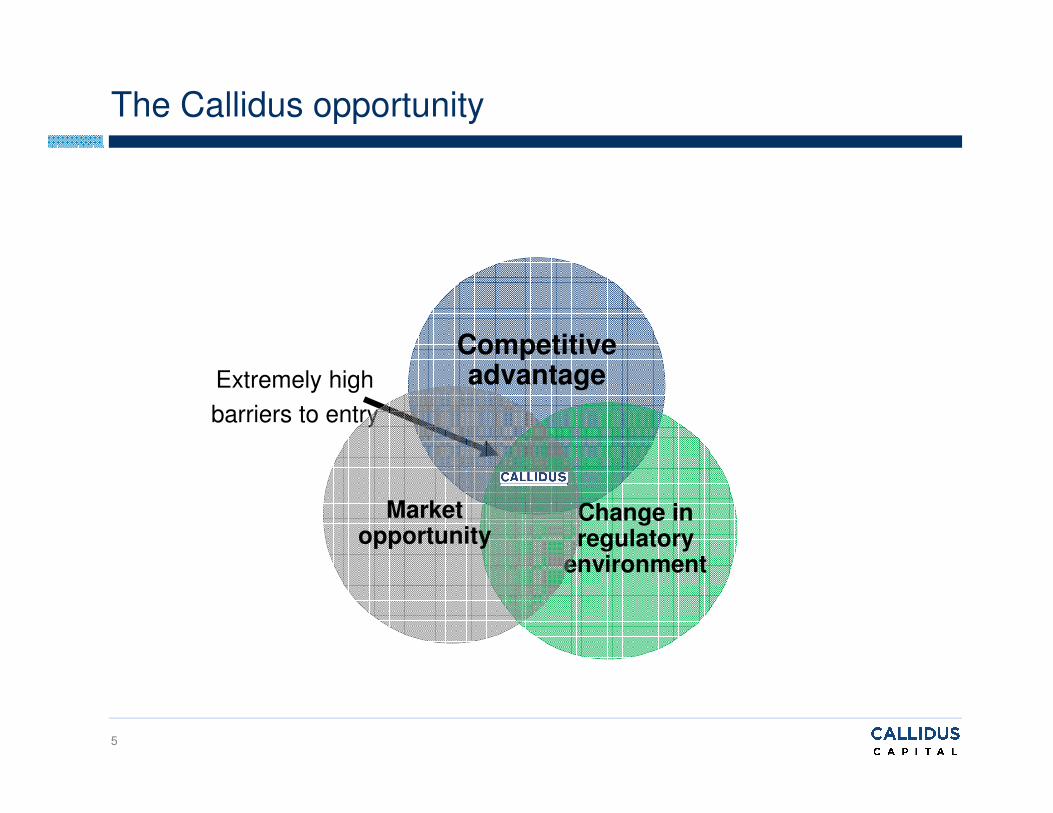
The Callidus opportunity
Extremely high
barriers to entry
Competitive advantage
Change in regulatory
environment
Market opportunity

6
Who is a Callidus Borrower?
� Callidus is a lender focused on companies that have lost access to conventional lending markets due to short term financial difficulties, industry focus or high growth/strategic changes
7
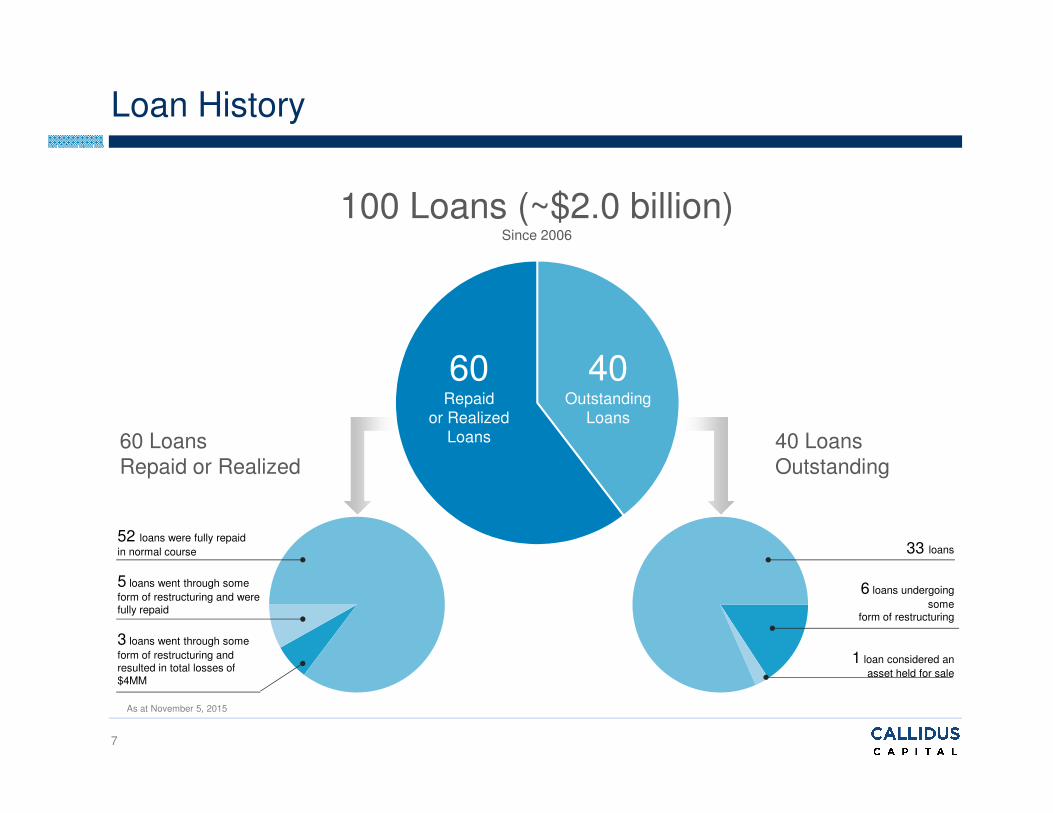
Loan History
40Outstanding
Loans
60Repaid
or RealizedLoans
100 Loans (~$2.0 billion)Since 2006
52 loans were fully repaid
in normal course
5 loans went through some
form of restructuring and were fully repaid
3 loans went through some
form of restructuring and resulted in total losses of $4MM
33 loans
6 loans undergoing
some form of restructuring
1 loan considered an
asset held for sale
60 Loans Repaid or Realized
40 Loans Outstanding
As at November 5, 2015

8
Differentiated Business Model – Lending Review
Comprehensive due diligence executed efficiently
Field Examinations
AppraisalCredit Committee
Loan Origination
� �
Evaluate suitability of prospective borrowers
Internal/external examiners review collateral & records of borrower and reliability of financial controls
Focus on
inventory,
accounts
receivable and
fixed operating
assets
3rd parties appraise value of inventory, fixed assets and real property
Focus on
liquidation
value
Create detailed analysis of borrowers and determine credit terms
Detailed credit memos are evaluated by Credit Committee
Unanimous
approval is
required
Loan Underwriters
LoanApproval
9
$90 ELIGIBLE
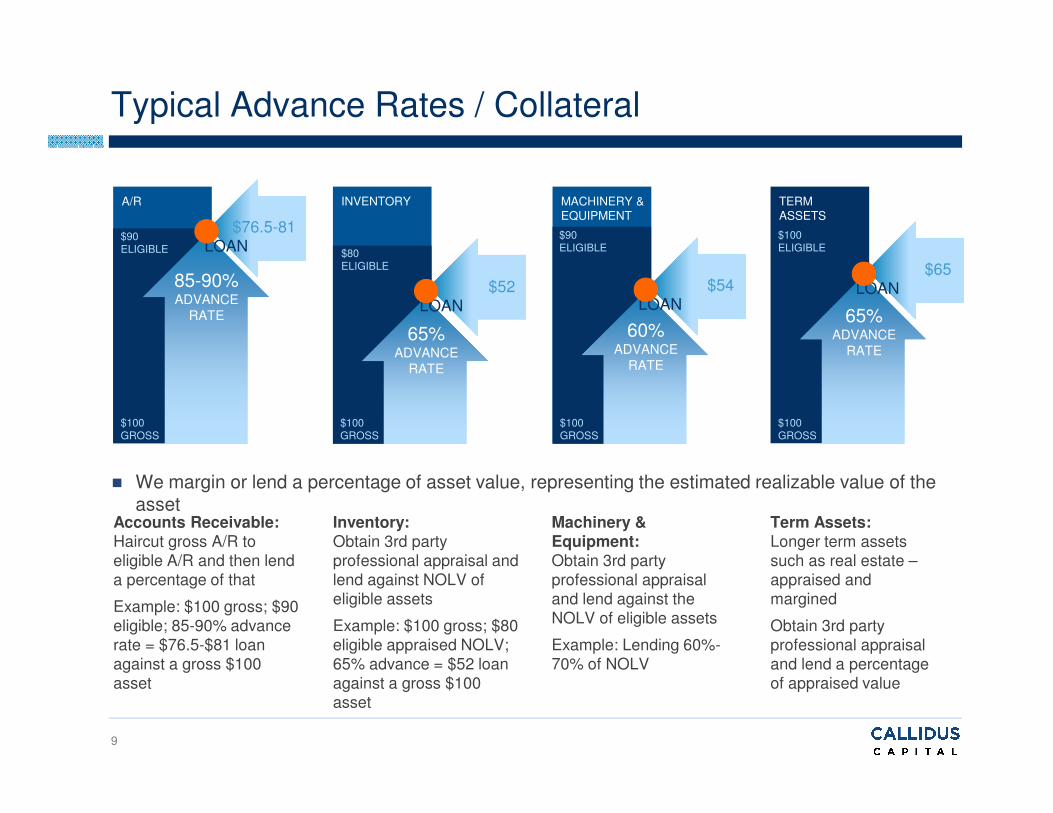
Typical Advance Rates / Collateral
$100 GROSS
85-90% ADVANCE
RATE
A/R
$76.5-81LOAN
Accounts Receivable:Haircut gross A/R to eligible A/R and then lend a percentage of that
Example: $100 gross; $90 eligible; 85-90% advance rate = $76.5-$81 loan against a gross $100 asset
Inventory:Obtain 3rd party professional appraisal and lend against NOLV of eligible assets
Example: $100 gross; $80 eligible appraised NOLV; 65% advance = $52 loan against a gross $100 asset
Term Assets:Longer term assets such as real estate –appraised and margined
Obtain 3rd party professional appraisal and lend a percentage of appraised value
Machinery & Equipment:Obtain 3rd party professional appraisal and lend against the NOLV of eligible assets
Example: Lending 60%-70% of NOLV
$100 GROSS
65% ADVANCE
RATE
INVENTORY
$52LOAN
$100 GROSS
60% ADVANCE
RATE
MACHINERY & EQUIPMENT
$54LOAN
$100 GROSS
65% ADVANCE
RATE
TERM ASSETS
$65LOAN
� We margin or lend a percentage of asset value, representing the estimated realizable value of the asset
$90 ELIGIBLE $80
ELIGIBLE
$100ELIGIBLE

10
Prudent Risk Management
� Continual Credit Committee involvement from prior to issuing a term sheet through to repayment
� Cash sweep mechanism (blocked accounts) gives Callidus dominion over borrowers’ cash
� Borrowers with a potentially deteriorating financial condition are placed on the Watch-List
� Monitored with enhanced scrutiny and supervision
� Established to allow Callidus to take a proactive approach to ensuring borrowers’ compliance with loan obligations
� A loan is placed on the Watch-List if (i) the loan has been demanded, (ii) Callidus has taken a specific provision, (iii) the borrower undergoes restructuring or (iv) if management believes there is any other reason for heightened monitoring
� Quarterly field audits
� Comparison of actual results to borrowers’ business plans
� Ongoing dialogue with management
� Borrowers with a deteriorating financial condition
� Allows for heightened monitoring and involvement in instances of deteriorating financial condition
� Early warning sign
� Ongoing monitoring to ensure appropriate collateral coverage
� Daily, weekly or monthly
� Includes 3rd party appraisals
� Borrower must submit daily cash flow
� “lock box”
� Allows for close performance monitoring
� Facilitates loan repayment and reduces fraud
Field Examination
s
Collateral Monitoring
Watch-ListControl of
Deposit Account
Management of risk through a stringent loan monitoring process

11
Organizational Structure
Credit Committee
Jim RileySecretary
Newton GlassmanExecutive Chairman
& CEODavid Reese
President & COO
Dan NohdomiCFO
� Supported by extensive in-house team and proprietary systems
� Experienced team of 33 professionals, including 4 originators, 4 loan underwriters and a team for collateral monitoring
� Hiring is done well in advance of planned growth to ensure proper training
� Current excess capacity of ~50% provides for prudent management of ~30 additional loans
Origination
4 Vice Presidents
Portfolio &Underwriting
4 Vice Presidents1 Associate VP3 Associates
CollateralMonitoring
1 VP1 Director
1 Senior Field Examiner1 Field Auditor/Analyst6 Collateral Analysts
Finance
1 Corporate Controller1 Financial Analyst
1 Accounting Manager1 Accountant
Technology
1 PhD Programmer
Augmented by external service
Administration
1 Executive Assistant1 Receptionist

12
Q3 2015 Highlights
� Earnings per share (diluted) of $0.40, up 11% from $0.36 last quarter and up 48% from $0.27 last year
� ROE was 16.1%, an increase from 15.2% in the previous quarter and from 13.6% last year
� Gross loans receivable before derecognition of $1,193 million at September 30, 2015, up 14% from previous quarter and up 82% from same quarter last year
� Gross yield for the quarter was 19.7%, an increase from 18.8% in the previous quarter
� Credit quality continues to be very strong as evidenced by an annualized provision rate of 1.5% year-to-date
� As at September 30, 2015, the estimated aggregate collateral value coverage on net loans receivable was approximately 138% with a range between 100% and 384% on an individual loan basis
� Watchlist loans had an estimated aggregate collateral value coverage of 107% and non-watchlist loans had an estimated aggregate collateral value coverage of 147%
� Instituted a new dividend policy
� Quarterly dividend of $0.175 ($0.70 per annum)
� Implementation of a dividend reinvestment plan (all Catalyst entities subscribed to DRIP)
� Normal course issuer bid initiated in May 2015
� Approximately 2.2 million shares (86% of the shares under the program) have been acquired
13
Q3 2015 Highlights
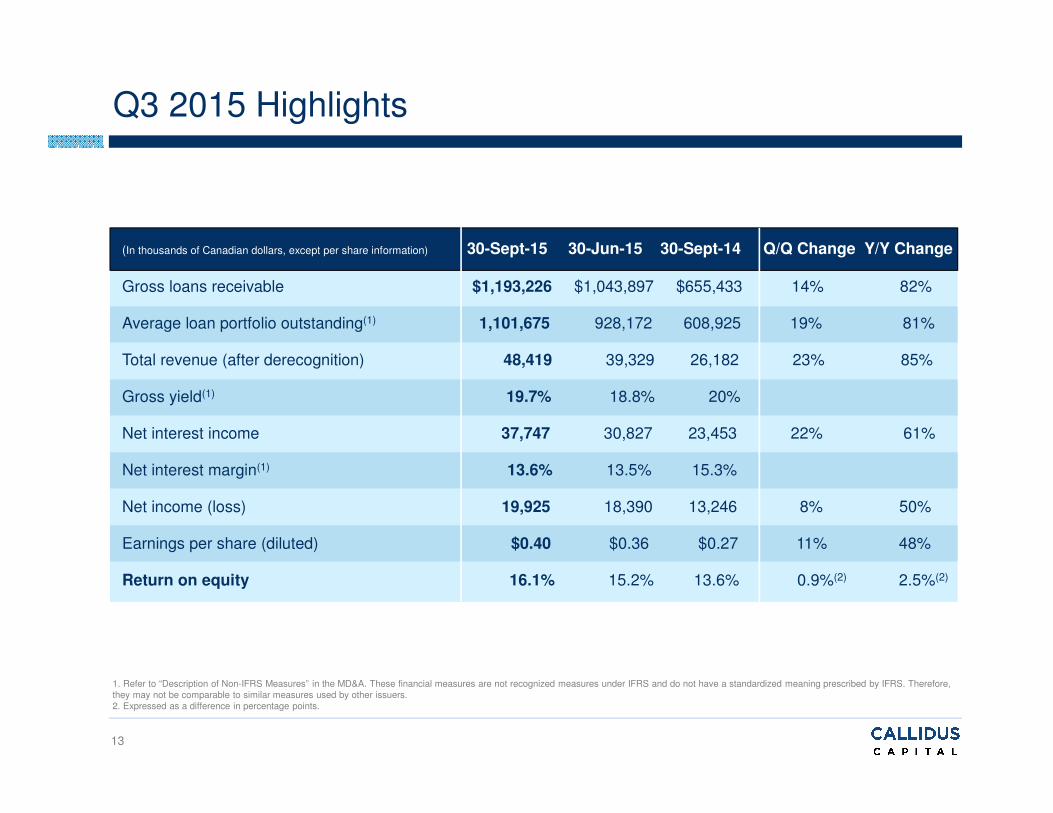
(In thousands of Canadian dollars, except per share information) 30-Sept-15 30-Jun-15 30-Sept-14 Q/Q Change Y/Y Change
Gross loans receivable $1,193,226 $1,043,897 $655,433 14% 82%
Average loan portfolio outstanding(1) 1,101,675 928,172 608,925 19% 81%
Total revenue (after derecognition) 48,419 39,329 26,182 23% 85%
Gross yield(1) 19.7% 18.8% 20%
Net interest income 37,747 30,827 23,453 22% 61%
Net interest margin(1) 13.6% 13.5% 15.3%
Net income (loss) 19,925 18,390 13,246 8% 50%
Earnings per share (diluted) $0.40 $0.36 $0.27 11% 48%
Return on equity 16.1% 15.2% 13.6% 0.9%(2) 2.5%(2)
1. Refer to “Description of Non-IFRS Measures” in the MD&A. These financial measures are not recognized measures under IFRS and do not have a standardized meaning prescribed by IFRS. Therefore, they may not be comparable to similar measures used by other issuers.2. Expressed as a difference in percentage points.

14
� Strong growth in portfolio while maintaining solid credit quality
� Signed-back term sheets of $300 million
� Pipeline of high quality loans stands at approximately $600 million
Strong Loan Growth
$417$537
$655
$831$906
$1,044
$1,193
$405$502
$609$719
$864$928
$1,102
Q1 2014 Q2 2014 Q3 2014 Q4 2014 Q1 2015 Q2 2015 Q3 2015
Gross Loans Receivable Average Loans Outstanding
Current(1) $600 $300
Q2 2015 $932 $400
Q1 2015 $1,100 $208
Q4 2014 $450 - $600 $199
Q3 2014 $500 - $600 $172
Q2 2014 $500 $175
Q1 2014 $420 $250
Loan PipelineSigned-Back Term
Sheets
Loan Assets
All figures in C$ millions unless otherwise noted.1. As at November 5, 2015
15
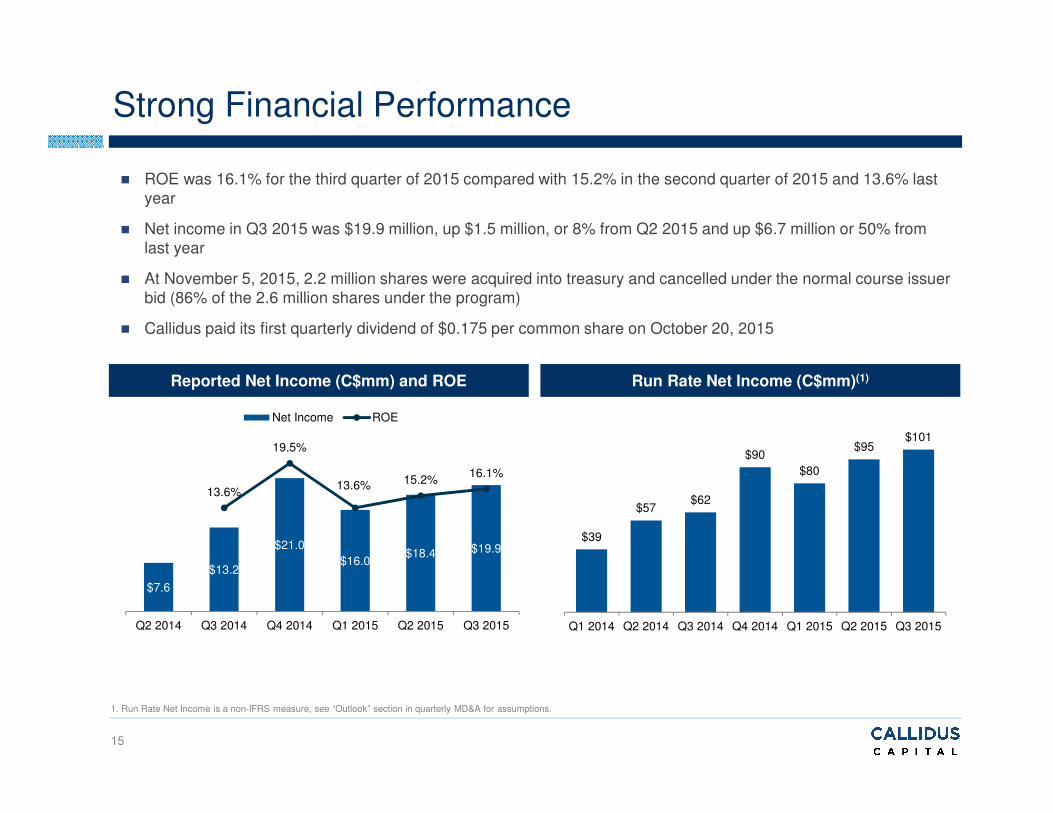
� ROE was 16.1% for the third quarter of 2015 compared with 15.2% in the second quarter of 2015 and 13.6% last year
� Net income in Q3 2015 was $19.9 million, up $1.5 million, or 8% from Q2 2015 and up $6.7 million or 50% from last year
� At November 5, 2015, 2.2 million shares were acquired into treasury and cancelled under the normal course issuer bid (86% of the 2.6 million shares under the program)
� Callidus paid its first quarterly dividend of $0.175 per common share on October 20, 2015
Strong Financial Performance
Reported Net Income (C$mm) and ROE Run Rate Net Income (C$mm)(1)
$7.6
$13.2
$21.0
$16.0 $18.4 $19.9
13.6%
19.5%
13.6% 15.2%16.1%
Q2 2014 Q3 2014 Q4 2014 Q1 2015 Q2 2015 Q3 2015
Net Income ROE
$39
$57$62
$90
$80
$95$101
Q1 2014 Q2 2014 Q3 2014 Q4 2014 Q1 2015 Q2 2015 Q3 2015
1. Run Rate Net Income is a non-IFRS measure, see “Outlook” section in quarterly MD&A for assumptions.

16
Attractive Growth Opportunities
Organic Growth in Canada
Expansion of “Callidus Lite”
Expansion in the United States
Acquisitions of Loan Portfolios
Purchase of Loan Assets from the Catalyst Funds
� Two new originators hired in 2014 to expand geographic reach and increase penetration in Quebec and Western Canada
� Targeted $50 - $150 mm of net new loan growth per year, per originator
� Expands addressable market by providing lower cost, longer duration loans to lower-risk borrowers while retaining improving credit quality borrowers
� Targets gross yields between 12% to 14% with lower credit risk
� Attractive ROE maintained through use of leverage by Callidus
� Focus on underserved U.S. markets
� Seattle-based originator hired in 2014 to cover U.S. Pacific Coast and Western Canada
� Originated 6 loans in the U.S. representing approximately $251 mm in commitments in 2014 and year-to-date through September 30, 2015, originated 3 loans representing approximately $81 mm in commitments
� North American financial regulations that introduced higher capital requirements for banks issuing loans present attractive opportunities for Callidus to acquire asset-backed loan portfolios from traditional lenders
� Transactions in Canada and U.S. reviewed on an opportunistic basis
� Exclusive right to acquire current and future Catalyst Funds’ loan participation interests at par
� Principal guarantee on all participation interests acquired from Catalyst Funds
Callidus’ pipeline of potential new loans is at $600 million as of November 5, 2015
17
Diversified Funding Strategy
� Net debt of $625 million, or 53% of gross loans receivable as at September 30, 2015
� Targeted leverage of 40% to 50% of loan portfolio, with the ability to increase leverage if required
� In September 2015, the company increased its revolving credit facility with Catalyst by US$50 million to US$250 million in aggregate
� Liquidity of $153 million as at September 30, 2015, consisting of $27 million of cash and cash equivalents and $126 million in available undrawn credit facilities
� Fund V achieved its “hard cap” of US$1.5 billion, of which $300 million can be used to acquire further loan participation interests
� The equity of new loans is funded approximately 75% by Fund V and 25% by the Company
� Engaged credit rating agency
• To help diversify sources of cost effective capital• Provide quicker access to debt capital markets• Examination of all our borrowers and processes expected to result in AAA / AA rating that
would provide added comfort to equity investors
All figures in C$ millions unless otherwise noted.As at November 5, 2015 unless otherwise noted.

18
Relationship with Catalyst
� Strong relationship with The Catalyst Capital Group Inc., one of the world’s leading private equity firms with a focus on distressed situations
� Catalyst is Canada’s second largest private equity firm
� Catalyst Fund V achieved its “hard cap” of US$1.5 billion
� Catalyst provides management services to Callidus pursuant to a Management Services Agreement
� Newton Glassman, Executive Chairman and CEO
� Jim Riley, Secretary
� Callidus benefits from a funding agreement with Catalyst via the Participation Agreement
� Catalyst Funds hold a right to fund equity participation interest in the current Active Portfolio(1)
based on a Funding Formula(2)
� Currently, participation interest is expected to range from approximately 60% to 75%
� Callidus has a right to purchase the participation interest at par when Catalyst chooses to sell
� Agreement provides Callidus with a warehoused source of future loan growth
� The loan equity participations acquired from Catalyst come with a guarantee
1. As defined in Callidus’s Annual Information Form.
2. As defined in Callidus’s Participation Agreement.
19
Relationship with Catalyst
� As previously noted, approximately 75% of incremental new Callidus loans
financed by Catalyst Fund V + 15% from other funds
� Catalyst bears disproportionate financial risk: Upon Callidus’ purchase of Fund V’s loan equity,
due to the guarantee mechanics Catalyst has approximately 90% of capital at risk, with only
60% of the economics on the amount transferred
� Catalyst bears strategic risk: poor credit quality would harm Fund V returns,
affect cash flows, reputation & franchise value
� Why accept these risks? Because Callidus is fundamental to Catalyst
strategy by mitigating J-curve (negative returns in early period of an
investment)
� Participation Agreement therefore gives biggest upside to public
investors, with second-biggest upside for investors in Catalyst funds
� Catalyst charges no fee or mark-up to Callidus

20
Relationship with Catalyst
In summary:
� Callidus is the only truly strategic asset of Catalyst funds
� Callidus gives investors access to one of the world’s top-performing distressed fund managers
� Because Callidus is so essential to Catalyst’s strategy, conflicts resolved in favour of the public investor
Catalyst update:
� Catalyst Fund V close announced
� Raised more than US$1.5 billion, exceeding both target and hard cap, in just six months of active marketing
� Demonstrates exceptional performance, investor confidence, strength of franchise
21
Catalyst Guarantee
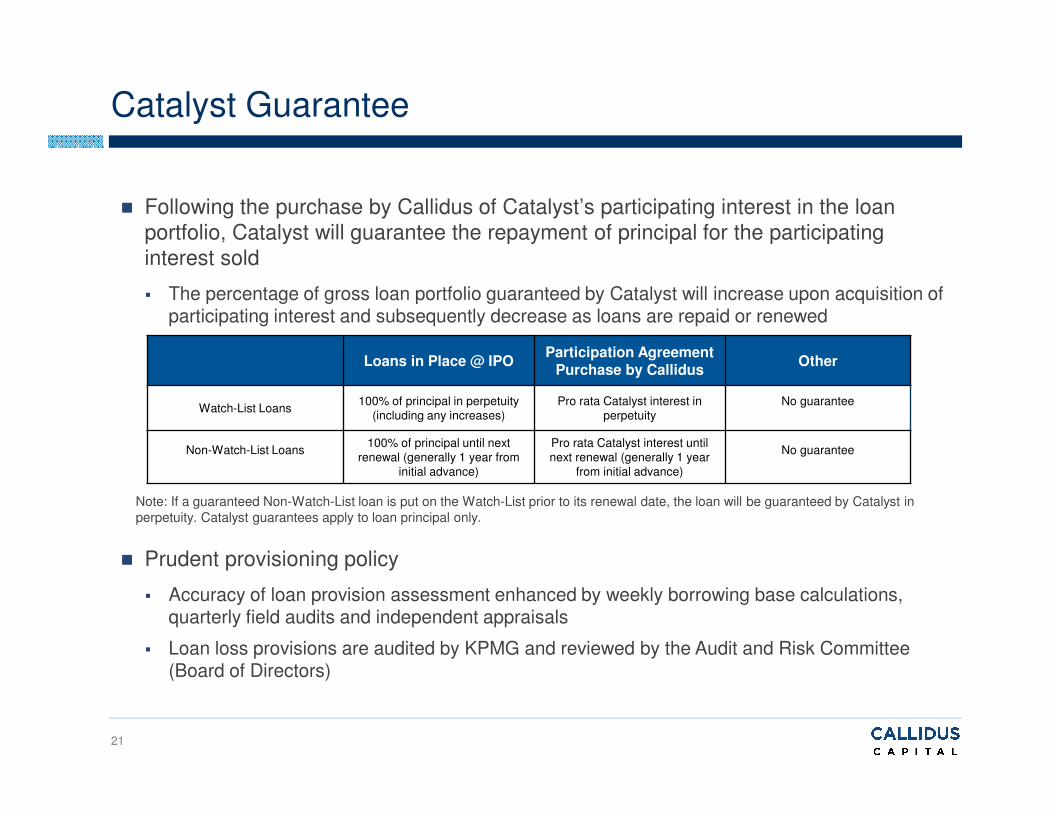
� Following the purchase by Callidus of Catalyst’s participating interest in the loan portfolio, Catalyst will guarantee the repayment of principal for the participating interest sold
� The percentage of gross loan portfolio guaranteed by Catalyst will increase upon acquisition of participating interest and subsequently decrease as loans are repaid or renewed
Loans in Place @ IPOParticipation Agreement
Purchase by CallidusOther
Watch-List Loans100% of principal in perpetuity
(including any increases)Pro rata Catalyst interest in
perpetuityNo guarantee
Non-Watch-List Loans100% of principal until next
renewal (generally 1 year from initial advance)
Pro rata Catalyst interest until next renewal (generally 1 year
from initial advance)
No guarantee
Note: If a guaranteed Non-Watch-List loan is put on the Watch-List prior to its renewal date, the loan will be guaranteed by Catalyst in perpetuity. Catalyst guarantees apply to loan principal only.
� Prudent provisioning policy
� Accuracy of loan provision assessment enhanced by weekly borrowing base calculations, quarterly field audits and independent appraisals
� Loan loss provisions are audited by KPMG and reviewed by the Audit and Risk Committee (Board of Directors)

22
Specialty finance: Comparable companies
FY1Payout Ratio
LFY-FY1 EPS
Growth
FY1-FY2 EPS
Growth
Canadian Specialty Finance
Element Financial Corp. $17.29 $6,676 16.9x 10.8x 1.44x 1.79x - 9.3% 28.2% 0.0% nmf 57.0%
Callidus Capital Corporation $11.31 $557 7.5x 6.2x 1.14x 1.14x 6.2% 15.4% (46.0%) 46.6% 44.5% 20.7%
Chesswood $10.50 $186 9.0x 8.5x 1.27x 3.26x 7.4% 15.9% (27.4%) 67.0% 18.8% 6.4%
Accord Financial $10.41 $86 n/a n/a 1.24x 1.42x 3.5% n/a 8.4% n/a n/a n/a
Crown Capital Partners $8.10 $77 nmf 10.3x 0.76x 0.76x - 5.2% (26.4%) 0.0% nmf 45.4%
RIFCO $2.29 $49 7.3x 7.2x 1.80x 1.80x - 23.5% (60.2%) 0.0% 12.1% 1.6%
Cdn. Specialty Finance Average 10.2x 8.6x 1.28x 1.70x 2.8% 13.9% (20.6%) 22.7% 25.1% 26.2%
Alternative Mortgage Lending
Home Capital Group $33.22 $2,331 8.0x 7.6x 1.49x 1.61x 2.6% 18.8% (34.4%) 21.3% (7.8%) 5.2%
First National $22.29 $1,337 9.6x 9.0x 4.30x 4.75x 7.0% 41.3% (4.2%) 66.9% 43.0% 7.0%
Equitable Group $57.11 $883 7.6x 7.2x 1.30x 1.30x 1.3% 18.3% (12.5%) 10.1% 13.5% 5.8%
MCAN Mortgage Corporation $13.01 $296 10.0x 9.6x 1.16x 1.16x 8.9% 11.8% (9.3%) 89.2% 5.7% 4.2%
Alternative Mortgage Lending Average 8.8x 8.4x 2.06x 2.21x 5.0% 22.6% (15.1%) 46.9% 13.6% 5.6%
P / E
FY1 FY2
SharePrice(1)
Market Cap($MM)
Company P / BV P / TBV1 Year Share Return
DividendYield
FY1ROE
1. As at November 6, 2015.

23
Investment Highlights
A disciplined lender that employs proprietary credit processes and systems to originate and monitor loans
Strong relationship with The Catalyst Capital Group Inc., one of the world’s leading private equity firms with a focus on distressed situations
An innovative specialty asset-backed lender with unique expertise and experience that is demonstrated by its success in an underserved loan market
Quarterly dividend of $0.175 per common share ($0.70 per annum)
The introduction of new Catalyst Funds provide a warehoused source of growth as well as a principal guarantee on loans repurchased by Callidus
Diversified loan portfolio with attractive growth opportunities
Excellent financial performance and a conservative capital structure

Appendix
25
Provision for Loan Losses
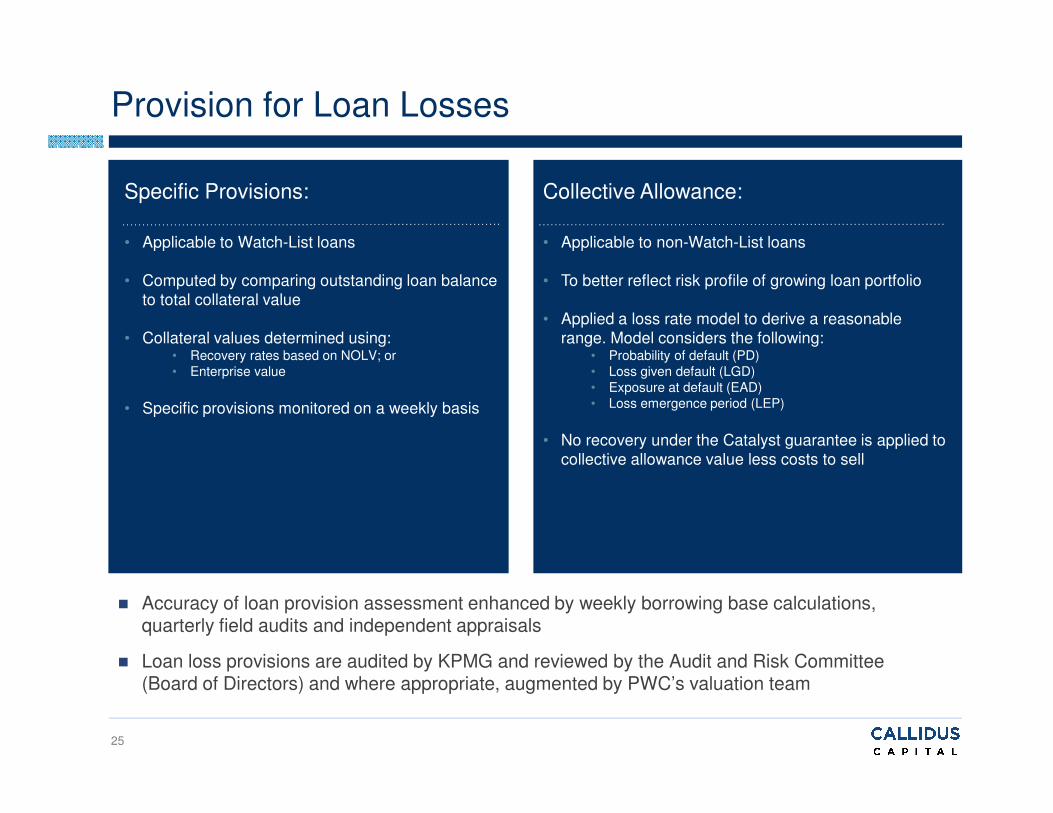
Specific Provisions:
• Applicable to Watch-List loans
• Computed by comparing outstanding loan balance to total collateral value
• Collateral values determined using:• Recovery rates based on NOLV; or• Enterprise value
• Specific provisions monitored on a weekly basis
Collective Allowance:
• Applicable to non-Watch-List loans
• To better reflect risk profile of growing loan portfolio
• Applied a loss rate model to derive a reasonable range. Model considers the following:
• Probability of default (PD)• Loss given default (LGD)• Exposure at default (EAD)• Loss emergence period (LEP)
• No recovery under the Catalyst guarantee is applied to collective allowance value less costs to sell
� Accuracy of loan provision assessment enhanced by weekly borrowing base calculations, quarterly field audits and independent appraisals
� Loan loss provisions are audited by KPMG and reviewed by the Audit and Risk Committee (Board of Directors) and where appropriate, augmented by PWC’s valuation team

26
Guarantee Coverage
At September 30, 2015 $000s %
Guarantee Coverage of Gross Loans Receivable
Portion of gross loans receivable covered by a guarantee:
Watch-List loans $ 214,291 18%
Non-Watch-List loans 208,108 17%
Portion of gross loans receivable not covered by a guarantee:
Watch-List loans 61,741 5%
Non-Watch-List loans 709,086 60%
Total gross loans receivable $ 1,193,226 100%
Guarantee Coverage of Provision for Loan Losses
Provision for loan losses covered by a guarantee:
Watch-List loans $ 20,443 66%
Non-Watch-List loans – 0%
Provision for loan losses not covered by a guarantee:
Watch-List loans 4,276 14%
Non-Watch-List loans 6,362 20%
Total provision for loan losses $ 31,081 100%
Callidus Capital Corporation


