21
Property Market Re ort Flat 4 5 Springfield Street WN1 2NA 15 Oct 2009 Statistical computations by Calnea Analytics
| Date post: | 30-May-2018 |
| Category: |
Documents |
| Upload: | mark-ianson |
| View: | 217 times |
| Download: | 0 times |

8/14/2019 Calnea Report North West Apartments
http://slidepdf.com/reader/full/calnea-report-north-west-apartments 1/21
Property
Market
Re ort
Flat 4
5Springfield StreetWN1 2NA
15 Oct 2009
Statistical computations byCalnea Analytics

8/14/2019 Calnea Report North West Apartments
http://slidepdf.com/reader/full/calnea-report-north-west-apartments 2/21
Valuation estimates
Reference: 359042 Sub-building name: Flat 4
Valuation Date: 15 Oct 2009 Building name:
Estimated current value: £113,113 Building number: 5
Forecast std. deviation: 44.00% Street: Springfield Street
Valuation range: £63,330 to £162,897 Postcode: WN1 2NA
Valuation estimate:
The Calnea Analytics automated valuation model predicts that the most probable current open market value for the property in
question is £113,113. This valuation estimate is based upon the information submitted.
Forecast Standard Deviation:
Our estimate of the accuracy of this valuation is expressed in terms of
forecast standard deviation. This is calculated from the strength of the
available supporting data and is used to determine the valuation
range. The sale price the property will achieve in an open market will
most probably lie within the valuation range. The width of the valuation
range depends upon our confidence in our prediction. A higher degree
of confidence will lead to a narrower valuation range. In statistical
terms the valuation range represents a movement of one standard
deviation either side of the mean. The graph to the right illustrates the
distribution curve of probable values.
Persons seeking to place reliance on these estimates for their own orthird party purposes do so at their own risk. No representation is made
as to the accuracy, completeness or reliability of these forecasts.£63,330 £162,897
Page 1 of 20

8/14/2019 Calnea Report North West Apartments
http://slidepdf.com/reader/full/calnea-report-north-west-apartments 3/21
Five year forecast
Estimate of Current Value: £113,113
Price Forecast Range - (68% confidence)
Forecast CAGR (%) Total Growth (%)
High £190k 10.9% 68%
Medium £156k 6.7% 38%
Low £123k 1.7% 9%
Price Forecast Range-
(95% confidence)
Forecast CAGR (%) Total Growth (%)
High £224k 14.6% 98%
Medium £156k 6.7% 38%
Low £89k -4.6% -21%
Valuation Forecasts:
The house price forecast model predicts that £156k is the most probable value of the property in five years time.
There are two sets of price forecast ranges shown above. The first forecast range (£123k - £190k) has a statistical confidence
measure of one standard deviation from the mean, while the second range (£89k - £224k) has a 95% confidence measure (1.96
standard deviations). The confidence measure represents our degree of certainty that the property’s value in five years time will be
within the given range. The Price Forecast Fan Chart is a graphical illustration of how these two ranges project over time.
CAGR stands for Compounded Annual Growth Rate. This is the annual equivalent percentage growth required to meet the forecas
valuation.
Important Notes
The forecast model assumes that the property undergoes no material home improvement or deterioration going forward. Al
changes are nominal and do not allow for inflation. For Leasehold properties, these forecasts assume that the length of lease is
sufficient for the property price to not be materially affected by a five year decrease in lease length. Persons seeking to place reliance
on these estimates for their own or third party purposes do so at their own risk. No representation is made as to the accuracy
completeness or reliability of these forecasts.
Page 2 of 20

8/14/2019 Calnea Report North West Apartments
http://slidepdf.com/reader/full/calnea-report-north-west-apartments 4/21
General street information
Springfield Street in Wigan WN1 comprises 57 properties. Out of these properties, the vast majority are residential (i.e. there are a
total of 55 homes in Springfield Street). The information provided below comes from Mouseprice.com, third parties and comments
submitted by the general public. Please take some time to explore the wealth of information that can be found throughout the
Mouseprice.com website, including the free valuations on every property.
The property sale that has been recorded in Springfield Street most recently was 1, which sold for £85,000 on 30/09/2005. The most
expensive recorded transaction in Springfield Street to date is 5, which sold for £335,000 on 29/06/2005. The least expensive
transaction that has been recorded in Springfield Street is 21. It sold for £25,500 on 03/11/2000. There is an area guide for Wigan
available on the Mouseprice.com website, where you can access more information on house price related trends, graphs and stats.
Of the 55 homes on Springf ield Street, 42 are flats (including apartments and maisonettes). Some of these properties are relatively
old, as at least 1 of them was built more than 100 years ago. Springfield Street has an average current value of £162,953, which
makes it one of the more expensive parts of WN1 Wigan, where the average house price is £122,436. This value is derived from the
free automated valuation estimates provided on the Mouseprice website. These are known as AVMs. There are 15 transactions
recorded in Springfield Street by HM Land Registry since 1/04/2000. This gives us reasonable AVM coverage for Wigan WN1.
At the moment, there are two properties for sale in Springfield Street that are listed on Mouseprice.com. If you want to look further
afield, there are many more properties for sale in Wigan WN1 that can be viewed on the website. The asking prices of these
properties range from £5,500 to £625,000 and their average asking price is £160,581. One of the most recent properties to be listed
as for sale in Wigan WN1 was on Roundhouse Avenue, WN1, and was put on the market for £109,950 on 07/10/2009.
Mouseprice.com enables people to share with others a price that might tempt them to sell their property. These are known as
property flirts. There are no property flirts in Springfield Street, but there are 5 property flirts in Wigan WN1. The flirt prices of these
properties range from £90,000 to £269,950 and their average flirt price is £159,990.
Mouseprice.com does not list any properties for rent in Wigan WN1 at the moment. You can, however, find many properties for rent
just outside of the Wigan WN1 area. All these properties, as well as many other properties in the rest of the country, can be viewed on
the Mouseprice.com website.
If you live on Springfield Street, your nearest primary school is Mab's Cross Primary School on Standishgate and your nearestsecondary school is The Deanery CofE High School on Frog Lane. If you are a regular user of the Post Office, Springfield Street woul
be a great place to live, as a branch is located nearby on Wigan Lane. For people who need to visit a bank fairly often, living on
Springfield Street is also very convenient, as HSBC bank is located a short walk away on Mesnes Road. As well as this, Springfield
Street is handy for people who use petrol stations - there is one located just around the corner. However, the biggest advantage is
that residents can quickly nip out to do their food shopping, as there is a Tesco supermarket just minutes away on Central Park.
Page 3 of 20

8/14/2019 Calnea Report North West Apartments
http://slidepdf.com/reader/full/calnea-report-north-west-apartments 5/21
Comparable Properties
The list below shows similarly valued homes in the vicinity of the property in question. “Last sale” refers to the price and date of the
last time the property was sold. Transaction details are obtained from HM Land Registry - all © Crown copyright material is
reproduced with the permission of Land Registry. The prices in the “Current value” column are an approximation of the current value
of each home. Where available, the table includes the year the properties were built and the number of bedrooms in each property.
The “Footprint” column refers to the footprint size of the building (expressed in square meters), where this information is available.
Where a property forms part of a block of flats or a larger structure, this number will usually indicate the footprint of the building to
which the flat belongs, rather than the flat itself.
Postcode Address Last sale Current value Year built Footprint Beds
WN1 2EP 17 Green Hayes Avenue
Property Type: Semi-D
£162,000
01-Jul-2009
£162,000 na 51 3
WN1 2BN 4 Lord Street
Property Type: Terrace
£60,000
30-Apr-2008
£54,000 1890 52 2
WN1 2EH 10 Holme Avenue
Property Type: Semi-D
£165,000
14-Dec-2007
£142,800 na 44 3
WN1 2EB 64 Swinley Lane
Property Type: Terrace
£134,000
23-Nov-2007
£116,500 na 49 3
WN1 2DX 32 Walkden Avenue East
Property Type: Detached
£139,950
16-Nov-2007
£115,700 na 47 na
WN1 2EB 60 Swinley Lane
Property Type: Terrace
£187,000
02-Nov-2007
£161,300 na 53 3
WN1 2BQ 9 Shaw Street
Property Type: Terrace
£110,000
02-Nov-2007
£95,900 na 50 2
WN1 2EW 24 Holme Avenue
Property Type: Terrace
£155,000
22-Aug-2007
£133,800 na 49 na
WN1 2EH 4 Holme Avenue
Property Type: Semi-D
£180,000
25- May -2007
£151,900 na 44 3
WN1 2EH 6 Holme Avenue
Property Type: Semi-D
£168,000
30- Mar -2007
£143,100 na 39 3
WN1 2ED 12 Swinley Street
Property Type: Terrace
£125,000
09- Mar -2007
£113,000 1900 50 2
WN1 2PH 11 Wordsworth Avenue
Property Type: Semi-D
£185,000
18-Aug-2006
£161,700 na 51 3
WN1 2EB 31 Swinley Lane
Property Type: Semi-D
£169,950
31-Jul-2006
£149,200 na 46 3
WN1 2LW 17 High Street
Property Type: Terrace
£119,950
03-Jul-2006
£114,200 1900 37 2
WN1 2EB 60 Swinley Lane
Property Type: Terrace
£177,000
30-Jan-2006
£161,300 na 53 3
WN1 2PH 29 Wordsworth Avenue
Property Type: Semi-D
£175,000
25- Oct -2005
£159,900 na 83 2
Page 4 of 20

8/14/2019 Calnea Report North West Apartments
http://slidepdf.com/reader/full/calnea-report-north-west-apartments 6/21
Ordnance Survey detailed mapping
The Ordnance Survey map above shows the area around your property.
Ordnance Survey and the OS symbol are registered trademarks of Ordnance Survey, the national mapping agency of Great Britain.
The representation of features as lines is no evidence of a property boundary.
Page 5 of 20
8/14/2019 Calnea Report North West Apartments
http://slidepdf.com/reader/full/calnea-report-north-west-apartments 7/21
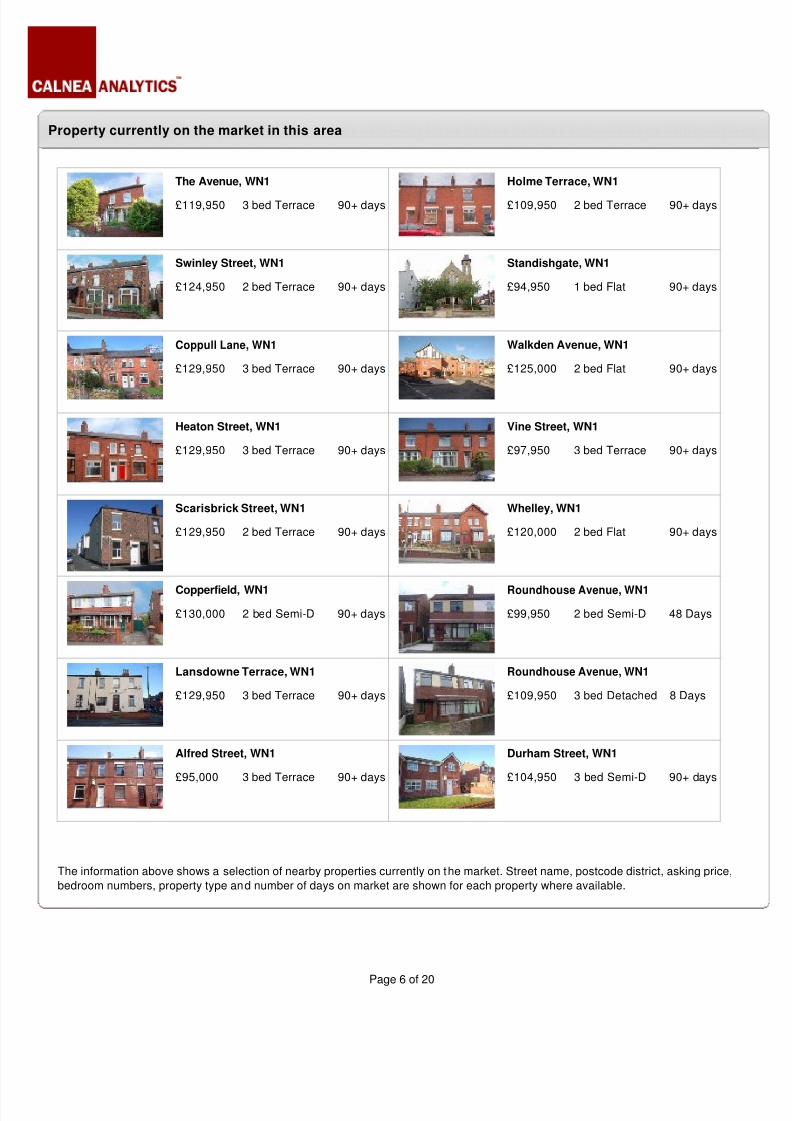
Property currently on the market in this area
The Avenue, WN1
£119,950 3 bedTerrace 90+ days
Holme Terrace, WN1
£109,950 2 bedTerrace 90+ days
Swinley Street, WN1
£124,950 2 bedTerrace 90+ days
Standishgate, WN1
£94,950 1 bedFlat 90+ days
Coppull Lane, WN1
£129,950 3 bedTerrace 90+ days
Walkden Avenue, WN1
£125,000 2 bedFlat 90+ days
Heaton Street, WN1
£129,950 3 bedTerrace 90+ days
Vine Street, WN1
£97,950 3 bedTerrace 90+ days
Scarisbrick Street, WN1
£129,950 2 bedTerrace 90+ days
Whelley, WN1
£120,000 2 bedFlat 90+ days
Copperfield, WN1
£130,000 2 bedSemi-D 90+ days
Roundhouse Avenue, WN1
£99,950 2 bedSemi-D 48 Days
Lansdowne Terrace, WN1
£129,950 3 bedTerrace 90+ days
Roundhouse Avenue, WN1
£109,950 3 bedDetached 8 Days
Alfred Street, WN1
£95,000 3 bedTerrace 90+ days
Durham Street, WN1
£104,950 3 bedSemi-D 90+ days
The information above shows a selection of nearby properties currently on the market. Street name, postcode district, asking price,
bedroom numbers, property type and number of days on market are shown for each property where available.
Page 6 of 20

8/14/2019 Calnea Report North West Apartments
http://slidepdf.com/reader/full/calnea-report-north-west-apartments 8/21
Recent sales
The list of property transactions below represents the most recent sales of properties in the same postcode district. The sales are
ordered by date, starting with the most recently available information.
Transaction details are obtained from HM Land Registry -all © Crown copyright material is reproduced with the permission of Land
Registry.
Postcode Address Beds Tenure Type Date Sale Price
WN1 2LE C8, Monument Mansions Leaseho ld Flat 10/08/09 £45,000
WN1 3XF 17, Rosemary Crescent 3 Freehold Semi-D 07/08/09 £59,500
WN1 3UX 44, Balcarres Avenue 3 Freehold Semi-D 07/08/09 £110,000
WN1 3NW 4, Windermere Street 2 Leasehold Terrace 05/08/09 £650,000
WN1 3UU 5, Balniel Walk 2 Freehold Semi-D 03/08/09 £105,000
WN1 3UL 5, Lyefield Avenue 3 Freehold Detached 31/07/09 £135,000
WN1 2DP 10, Ashland Avenue Leaseho ld Semi-D 31/07/09 £149,500
WN1 2SX 98, Chorley Road 3 Leaseho ld Semi-D 31/07/09 £162,500
WN1 3XL 5, Palewood Close Freehold Semi-D 31/07/09 £90,000
WN1 2LW 8a, High Street Leaseho ld Flat 31/07/09 £89,950
WN1 3HB 26, Moorings Close Freehold Semi-D 24/07/09 £109,950
WN1 3EY 51, Brookhouse Street 2 Freehold Terrace 24/07/09 £68,000
WN1 3XX 40, Moore Street Freehold Semi-D 24/07/09 £97,500
WN1 3PX 107, Whelley Leaseho ld Terrace 24/07/09 £100,000
WN1 2QS 14, Whitley Crescent Freehold Detached 24/07/09 £222,500
WN1 3PS 16, Westmorland Street 3 Leasehold Terrace 10/07/09 £67,000
WN1 2QR 65, Spencer Road 2 Leaseho ld Flat 06/07/09 £75,000
WN1 3PA 10, West Mount Freehold Terrace 03/07/09 £95,000
WN1 3YT 21, Trecastell Close 2 Freehold Semi-D 03/07/09 £95,000
WN1 2RF 6 Apartment, 247, Wigan Road 2 Leasehold Flat 03/07/09 £140,000
Page 7 of 20

8/14/2019 Calnea Report North West Apartments
http://slidepdf.com/reader/full/calnea-report-north-west-apartments 9/21
Average house prices
The table below shows the current average prices at which properties are selling, broken down according to Postcode District,
Postcode Area and Nationally. It explains how different numbers of bedrooms produce different average prices.
Average Current Values District -WN1 Area -WN National
1 Bedroom properties £70,700 £73,300 £135,600
2 Bedroom properties £91,400 £83,400 £149,000
3 Bedroom properties £126,300 £106,800 £168,200
4 Bedroom properties £211,200 £173,400 £277,500
5+ Bedroom properties £248,600 £178,000 £449,000
Price: Earning ratios
The price to earnings ratio is a basic affordability measure for housing in a given area. It is the ratio of current average property value
to average disposable income, expressed as years of earnings (i.e. a multiple of annual earnings). The lower the multiple the more
affordable properties are within a particular area in relation to the average earnings of inhabitants of that area.
Ratios which are different from the national average do not necessarily imply that properties within an area are under or over valued.
Factors unique to the specific location can cause such differences. Nevertheless, over the long run property prices tend to increase
with earnings.
WN1 WN National
Average Current Value £127,900 £119,800 £195,600
Average Earnings £21,680 £19,438 £24,478
Price / Earnings 5.90x 6.16x 7.99x
Page 8 of 20

8/14/2019 Calnea Report North West Apartments
http://slidepdf.com/reader/full/calnea-report-north-west-apartments 10/21
Housing stock & ownership
Housing stock
WN1 WN National
Total Detached 1,410 29,011 6,172,275
% Detached 14.0% 20.9% 22.9%
Semi-Detached 3,880 51,234 7,708,126
% Semi-Detached 38.5% 36.8% 28.6%
Terrace 3,959 53,419 8,585,061
% Terrace 39.3% 38.4% 31.8%
Flat 837 5,376 4,517,161
% Flat 8.3% 3.9% 16.7%
Temporary 6 73 93,795
% Temporary 0.1% 0.1% 0.4%
Home ownership
WN1 WN National
Owner
Occupied5,427 86,710 14,911,858
% Owner
Occupied
64.4% 62.4% 66.2%
Socially Rented 1,824 26,029 4,155,391
% Socially
Rented
21.6% 18.7% 18.4%
Postcode District (WN1)
The pie charts above illustrate the relative proportions of the differing types of property found within the respective area. Based on
information collected in the 2001 census, the pie charts also provide an indication of how common particular types of housing are
within the various areas. It is important to note that as homes are demolished and built these percentages will fluctuate accordingly.
The pie charts are intended to help the reader understand tenure patterns at postcode district level. Across the country the dominant
tenure is owner occupation, with the second largest tenure being the socially rented sector. Social housing is more prevalent inmetropolitan areas than non-metropolitan areas. The exact proportions vary between locations.
Page 9 of 20
8/14/2019 Calnea Report North West Apartments
http://slidepdf.com/reader/full/calnea-report-north-west-apartments 11/21
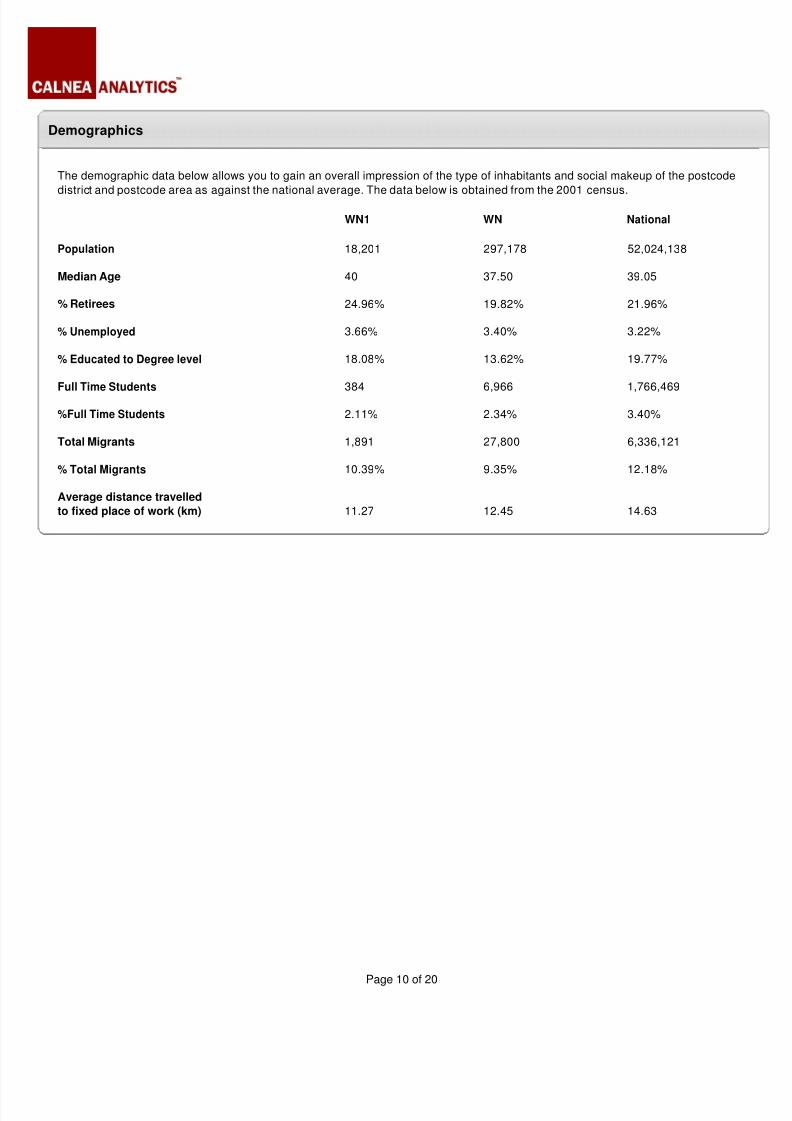
Demographics
The demographic data below allows you to gain an overall impression of the type of inhabitants and social makeup of the postcode
district and postcode area as against the national average. The data below is obtained from the 2001 census.
WN1 WN National
Population 18,201 297,178 52,024,138
Median Age 40 37.50 39.05
% Retirees 24.96% 19.82% 21.96%
% Unemployed 3.66% 3.40% 3.22%
% Educated to Degree level 18.08% 13.62% 19.77%
Full Time Students 384 6,966 1,766,469
%Full Time Students 2.11% 2.34% 3.40%
Total Migrants 1,891 27,800 6,336,121
% Total Migrants 10.39% 9.35% 12.18%
Average distance travelled
to fixed place of work (km) 11.27 12.45 14.63
Page 10 of 20

8/14/2019 Calnea Report North West Apartments
http://slidepdf.com/reader/full/calnea-report-north-west-apartments 12/21
House price trends
Growth rates WN1 WN National
5yr house price growth 9.87% 9.87% 4.85%
5yr house price CAGR 1.58% 1.58% 0.79%
Last 12 months house price growth -14.72% -14.72% -13.86%
Market characteristics
Market size Indicator: no. of transactions 4,989 75,309 15,421,702
Market size Indicator: total no. of properties 10,087 139,039 26,982,623
Market liquidity Indicator: transactions / properties 49.46% 54.16% 57.15%
Market growth indicator: new homes built 576 10,568 1,603,344
Market growth indicator: new builds / transactions 11.55% 14.03% 10.40%
5 year house price growth is a compounded measure of change in house prices over 5 years across the postcode district, postcode
area and nationally.
5 year CAGR is the rate that property values would have changed on an annual basis over the 5 year period.
Market Characteristics represent all the transaction notified to Land Registry since April 2000.
Page 11 of 20
8/14/2019 Calnea Report North West Apartments
http://slidepdf.com/reader/full/calnea-report-north-west-apartments 13/21
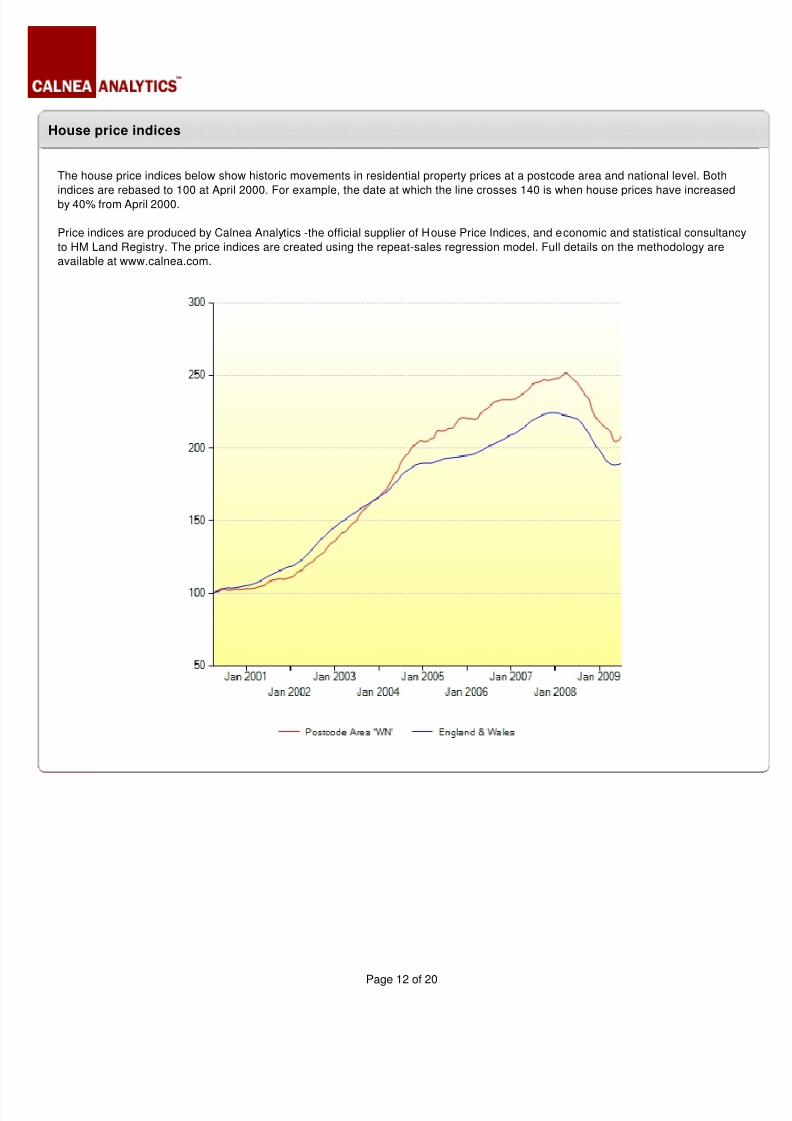
House price indices
The house price indices below show historic movements in residential property prices at a postcode area and national level. Both
indices are rebased to 100 at April 2000. For example, the date at which the line crosses 140 is when house prices have increased
by 40% from April 2000.
Price indices are produced by Calnea Analytics -the official supplier of House Price Indices, and economic and statistical consultancy
to HM Land Registry. The price indices are created using the repeat-sales regression model. Full details on the methodology are
available at www.calnea.com.
Page 12 of 20

8/14/2019 Calnea Report North West Apartments
http://slidepdf.com/reader/full/calnea-report-north-west-apartments 14/21
Street rankings – most expensive
Where available, the rankings below show the most expensive streets within the postcode district.
Average value is calculated by producing values for every property on each street as at today's date and averaging them out.
Transaction volume is the number of properties which have changed hands in the street since April 2000.
Residential Properties is the number of properties in the street which are in residential use, and % of residential is the proportion of
properties in the area which are solely for residential use.
Rank Street Average Value Transaction volume Residential properties % residential property
1 Wallgate £609,650 4 17 27
2 Deerwood Gardens £501,850 4 4 100
3 Woodlands Park Close £473,511 19 15 100
4 Kingsmede £405,733 3 7 100
5 Arley Lane £343,017 6 19 95
6 Bellingham Mount £313,960 5 6 100
7 Penbury Road £305,200 5 16 94
8 Thorn Hill Gardens £295,400 5 8 100
9 Rowton Rise £291,367 3 9 100
10 Kingsdown Crescent £287,600 3 16 100
11 Broomhey Avenue £279,267 3 13 100
12 Romney Way £262,200 5 17 100
13 Market Street £261,867 3 12 27
14 King Street £256,640 5 6 18
15 Tennyson Drive £256,340 5 9 100
16 Ashford Rise £254,900 4 14 100
17 St Clements Road £250,367 3 26 100
18 Oak Hill Close £249,333 6 7 100
19 Sittingbourne Road £248,900 5 23 96
20 Gardinar Close £248,456 8 11 100
21 Newenden Road £247,900 6 16 100
22 Brock Mill Lane £241,930 10 25 100
23 Elkwood Close £233,688 8 20 100
24 Elmfield Road £231,671 7 19 95
25 Havenwood Road £219,250 10 46 100
26 Chaucer Place £215,775 4 12 100
27 Hazelwood Road £212,180 5 22 100
28 Willow Tree Close £209,800 3 6 100
29 Milton Grove £209,770 10 31 97
30 Hall Lane £209,500 3 23 100
Page 13 of 20
8/14/2019 Calnea Report North West Apartments
http://slidepdf.com/reader/full/calnea-report-north-west-apartments 15/21
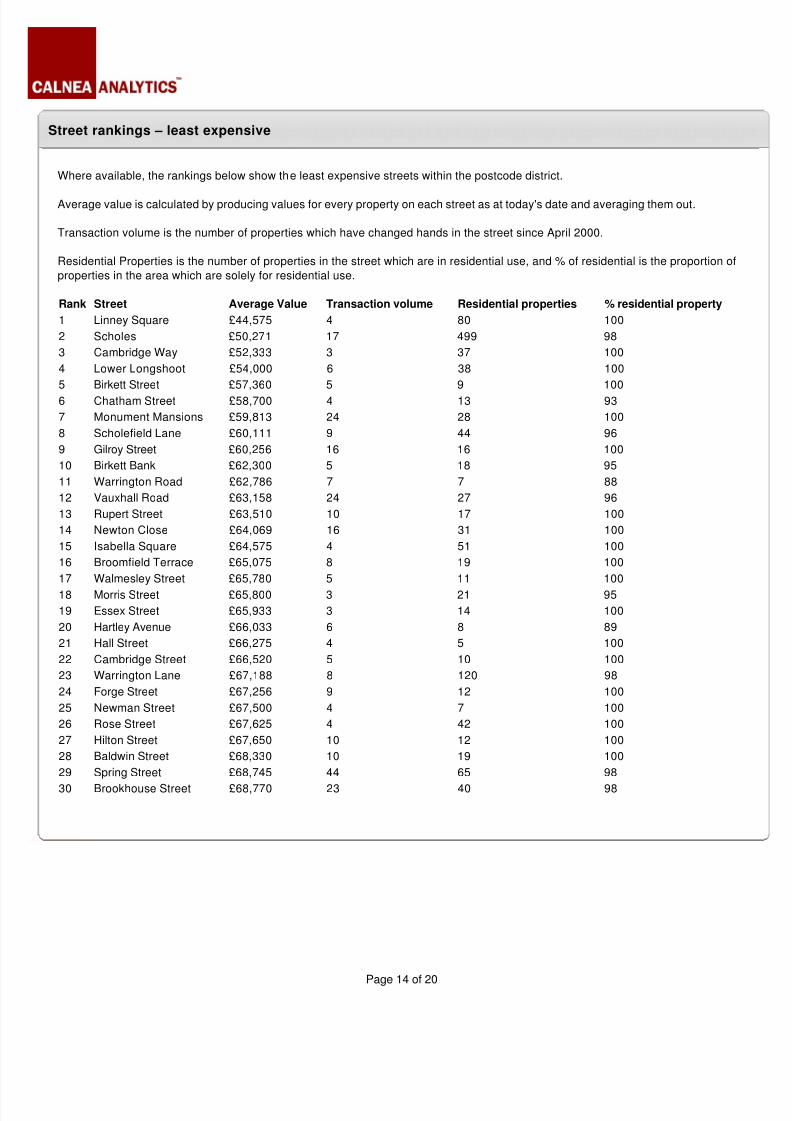
Street rankings – least expensive
Where available, the rankings below show the least expensive streets within the postcode district.
Average value is calculated by producing values for every property on each street as at today's date and averaging them out.
Transaction volume is the number of properties which have changed hands in the street since April 2000.
Residential Properties is the number of properties in the street which are in residential use, and % of residential is the proportion of
properties in the area which are solely for residential use.
Rank Street Average Value Transaction volume Residential properties % residential property
1 Linney Square £44,575 4 80 100
2 Scholes £50,271 17 499 98
3 Cambridge Way £52,333 3 37 100
4 Lower Longshoot £54,000 6 38 100
5 Birkett Street £57,360 5 9 100
6 Chatham Street £58,700 4 13 93
7 Monument Mansions £59,813 24 28 100
8 Scholefield Lane £60,111 9 44 96
9 Gilroy Street £60,256 16 16 100
10 Birkett Bank £62,300 5 18 95
11 Warrington Road £62,786 7 7 88
12 Vauxhall Road £63,158 24 27 96
13 Rupert Street £63,510 10 17 100
14 Newton Close £64,069 16 31 100
15 Isabella Square £64,575 4 51 100
16 Broomfield Terrace £65,075 8 19 100
17 Walmesley Street £65,780 5 11 100
18 Morris Street £65,800 3 21 95
19 Essex Street £65,933 3 14 100
20 Hartley Avenue £66,033 6 8 89
21 Hall Street £66,275 4 5 100
22 Cambridge Street £66,520 5 10 100
23 Warrington Lane £67,188 8 120 98
24 Forge Street £67,256 9 12 100
25 Newman Street £67,500 4 7 100
26 Rose Street £67,625 4 42 100
27 Hilton Street £67,650 10 12 100
28 Baldwin Street £68,330 10 19 100
29 Spring Street £68,745 44 65 98
30 Brookhouse Street £68,770 23 40 98
Page 14 of 20
8/14/2019 Calnea Report North West Apartments
http://slidepdf.com/reader/full/calnea-report-north-west-apartments 16/21
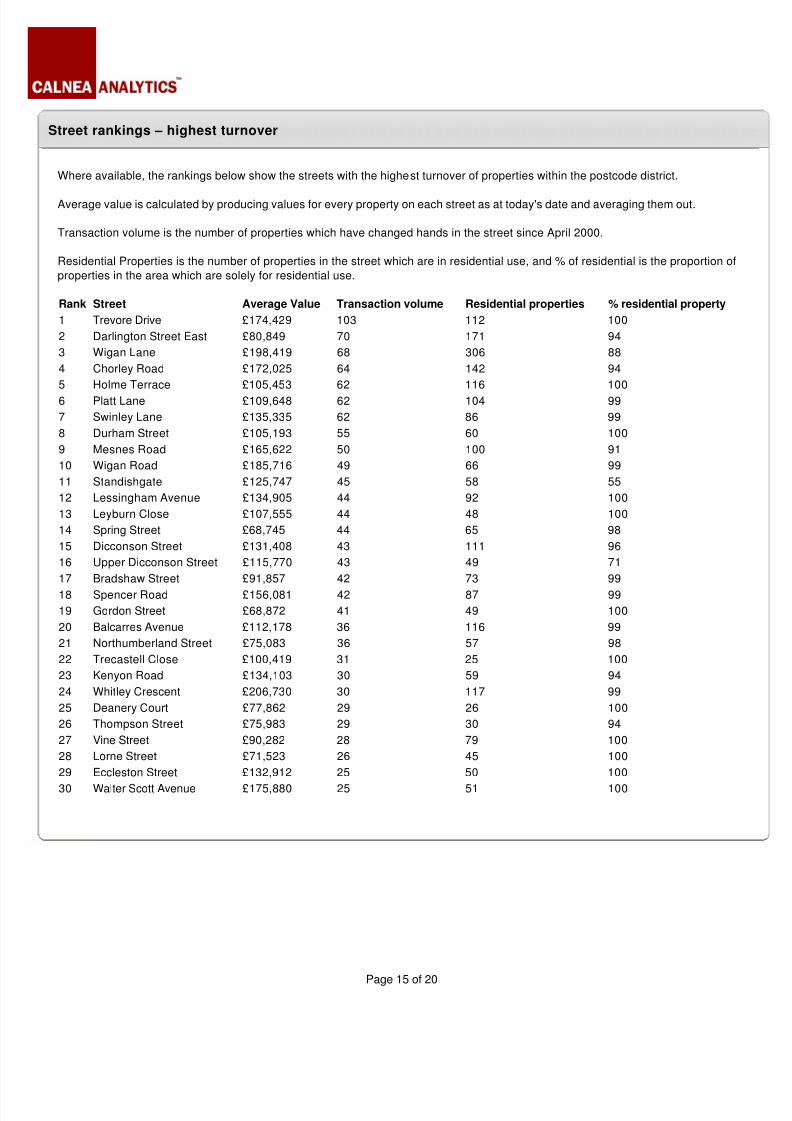
Street rankings – highest turnover
Where available, the rankings below show the streets with the highest turnover of properties within the postcode district.
Average value is calculated by producing values for every property on each street as at today's date and averaging them out.
Transaction volume is the number of properties which have changed hands in the street since April 2000.
Residential Properties is the number of properties in the street which are in residential use, and % of residential is the proportion of
properties in the area which are solely for residential use.
Rank Street Average Value Transaction volume Residential properties % residential property
1 Trevore Drive £174,429 103 112 100
2 Darlington Street East £80,849 70 171 94
3 Wigan Lane £198,419 68 306 88
4 Chorley Road £172,025 64 142 94
5 Holme Terrace £105,453 62 116 100
6 Platt Lane £109,648 62 104 99
7 Swinley Lane £135,335 62 86 99
8 Durham Street £105,193 55 60 100
9 Mesnes Road £165,622 50 100 91
10 Wigan Road £185,716 49 66 99
11 Standishgate £125,747 45 58 55
12 Lessingham Avenue £134,905 44 92 100
13 Leyburn Close £107,555 44 48 100
14 Spring Street £68,745 44 65 98
15 Dicconson Street £131,408 43 111 96
16 Upper Dicconson Street £115,770 43 49 71
17 Bradshaw Street £91,857 42 73 99
18 Spencer Road £156,081 42 87 99
19 Gordon Street £68,872 41 49 100
20 Balcarres Avenue £112,178 36 116 99
21 Northumberland Street £75,083 36 57 98
22 Trecastell Close £100,419 31 25 100
23 Kenyon Road £134,103 30 59 94
24 Whitley Crescent £206,730 30 117 99
25 Deanery Court £77,862 29 26 100
26 Thompson Street £75,983 29 30 94
27 Vine Street £90,282 28 79 100
28 Lorne Street £71,523 26 45 100
29 Eccleston Street £132,912 25 50 100
30 Walter Scott Avenue £175,880 25 51 100
Page 15 of 20
8/14/2019 Calnea Report North West Apartments
http://slidepdf.com/reader/full/calnea-report-north-west-apartments 17/21
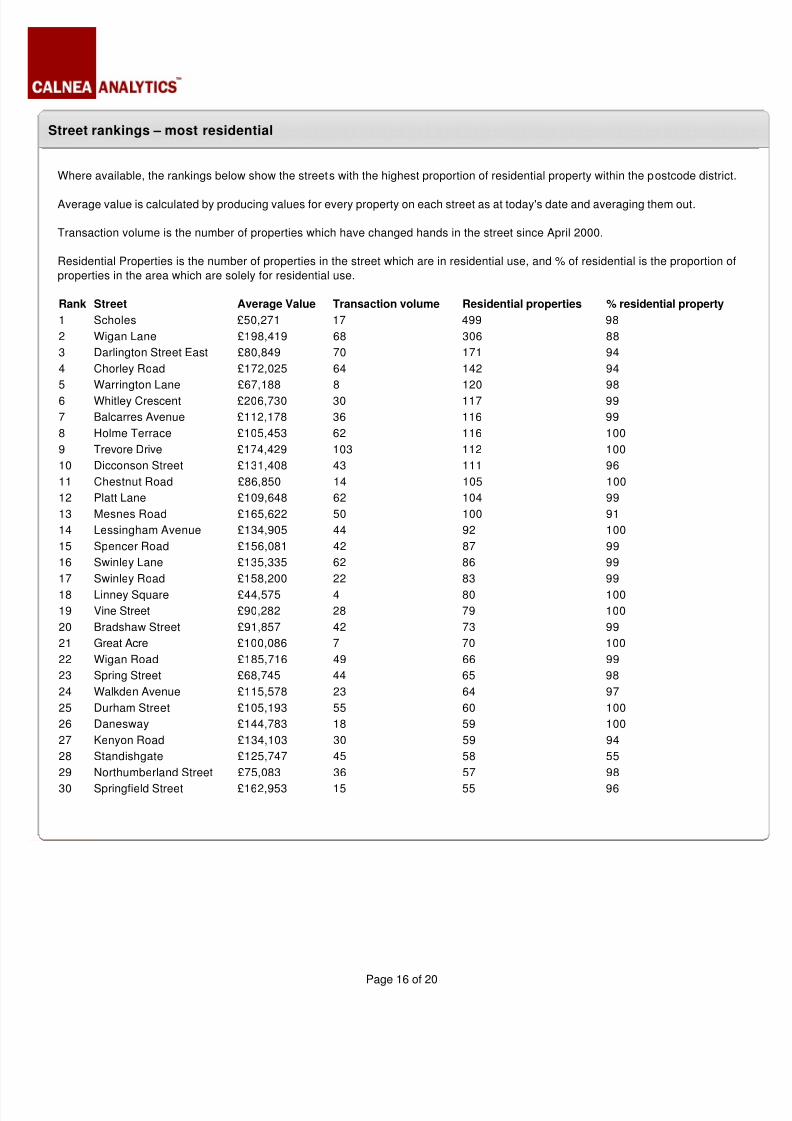
Street rankings – most residential
Where available, the rankings below show the streets with the highest proportion of residential property within the postcode district.
Average value is calculated by producing values for every property on each street as at today's date and averaging them out.
Transaction volume is the number of properties which have changed hands in the street since April 2000.
Residential Properties is the number of properties in the street which are in residential use, and % of residential is the proportion of
properties in the area which are solely for residential use.
Rank Street Average Value Transaction volume Residential properties % residential property
1 Scholes £50,271 17 499 98
2 Wigan Lane £198,419 68 306 88
3 Darlington Street East £80,849 70 171 94
4 Chorley Road £172,025 64 142 94
5 Warrington Lane £67,188 8 120 98
6 Whitley Crescent £206,730 30 117 99
7 Balcarres Avenue £112,178 36 116 99
8 Holme Terrace £105,453 62 116 100
9 Trevore Drive £174,429 103 112 100
10 Dicconson Street £131,408 43 111 96
11 Chestnut Road £86,850 14 105 100
12 Platt Lane £109,648 62 104 99
13 Mesnes Road £165,622 50 100 91
14 Lessingham Avenue £134,905 44 92 100
15 Spencer Road £156,081 42 87 99
16 Swinley Lane £135,335 62 86 99
17 Swinley Road £158,200 22 83 99
18 Linney Square £44,575 4 80 100
19 Vine Street £90,282 28 79 100
20 Bradshaw Street £91,857 42 73 99
21 Great Acre £100,086 7 70 100
22 Wigan Road £185,716 49 66 99
23 Spring Street £68,745 44 65 98
24 Walkden Avenue £115,578 23 64 97
25 Durham Street £105,193 55 60 100
26 Danesway £144,783 18 59 100
27 Kenyon Road £134,103 30 59 94
28 Standishgate £125,747 45 58 55
29 Northumberland Street £75,083 36 57 98
30 Springfield Street £162,953 15 55 96
Page 16 of 20

8/14/2019 Calnea Report North West Apartments
http://slidepdf.com/reader/full/calnea-report-north-west-apartments 18/21
Recent market activity - flips
Previous
sale price
Previous
sale date
Recent
sale price
Recent
sale date
Change
(%)
AER
(%)
Address
£158,500 Jan-08 £215,000 Dec-08 35.7 39.7 69 Walter Scott Avenue
£15,000 May-01 £192,000 Jun-09 1180.0 37.0 16 Brock Mill Lane
£42,000 Jun-01 £160,000 Apr-09 281.0 18.6 19 Clifton Street
£42,000 Jun-01 £120,000 Apr-09 185.7 14.3 19 Clifton Street
£41,000 Jan-00 £129,000 Nov-08 214.6 13.8 51 Lessingham Avenue
£65,000 Nov-01 £156,500 Feb-09 140.8 12.8 337 Wigan Lane
£58,500 Apr-03 £110,000 Dec-08 88.0 11.7 4 Acton Street
£67,500 Apr-02 £139,000 Dec-08 105.9 11.4 5 Lessingham Avenue
£65,000 Aug-02 £121,000 Dec-08 86.2 10.4 55 Walkden Avenue
£78,000 Jul-01 £160,000 May-09 105.1 9.6 22 Walkden Avenue East
This table shows the top ten recent transactions ordered by annualised price change. These represent repeat sales added to the
Land Registry database within the last month.
Page 17 of 20
8/14/2019 Calnea Report North West Apartments
http://slidepdf.com/reader/full/calnea-report-north-west-apartments 19/21
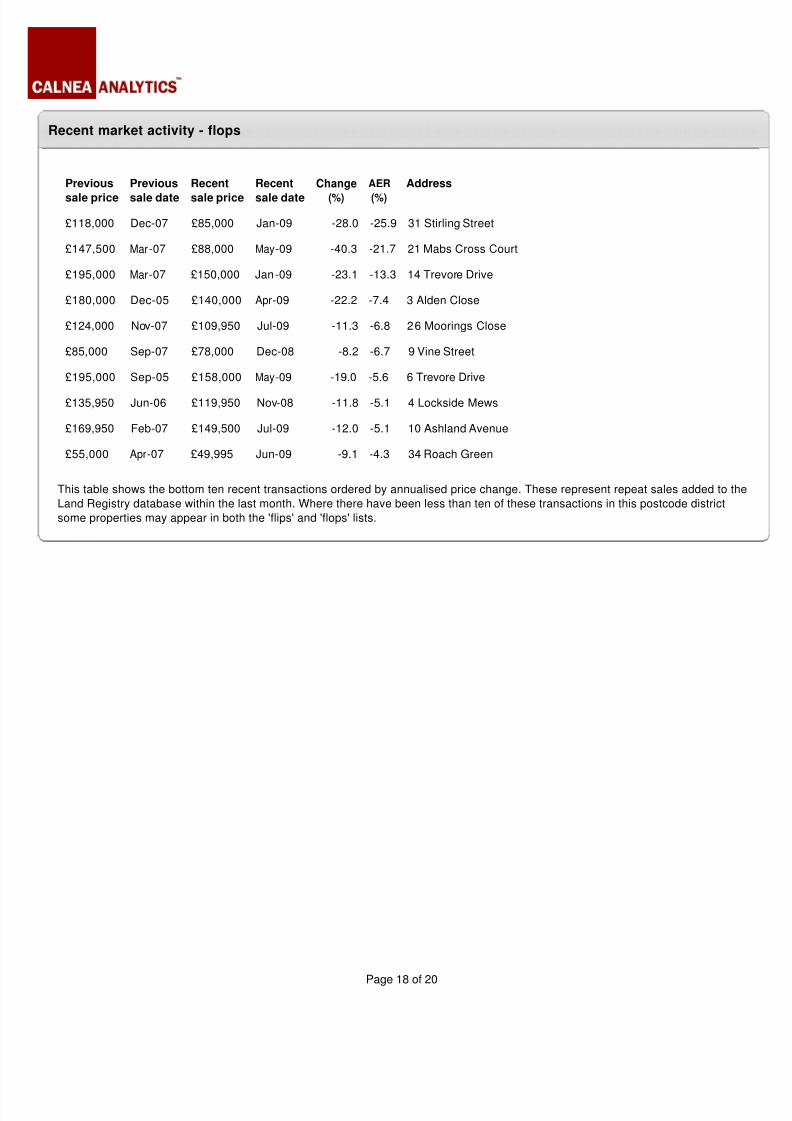
Recent market activity - flops
Previous
sale price
Previous
sale date
Recent
sale price
Recent
sale date
Change
(%)
AER
(%)
Address
£118,000 Dec-07 £85,000 Jan-09 -28.0 -25.9 31 Stirling Street
£147,500 Mar-07 £88,000 May-09 -40.3 -21.7 21 Mabs Cross Court
£195,000 Mar-07 £150,000 Jan-09 -23.1 -13.3 14 Trevore Drive
£180,000 Dec-05 £140,000 Apr-09 -22.2 -7.4 3 Alden Close
£124,000 Nov-07 £109,950 Jul-09 -11.3 -6.8 26 Moorings Close
£85,000 Sep-07 £78,000 Dec-08 -8.2 -6.7 9 Vine Street
£195,000 Sep-05 £158,000 May-09 -19.0 -5.6 6 Trevore Drive
£135,950 Jun-06 £119,950 Nov-08 -11.8 -5.1 4 Lockside Mews
£169,950 Feb-07 £149,500 Jul-09 -12.0 -5.1 10 Ashland Avenue
£55,000 Apr-07 £49,995 Jun-09 -9.1 -4.3 34 Roach Green
This table shows the bottom ten recent transactions ordered by annualised price change. These represent repeat sales added to the
Land Registry database within the last month. Where there have been less than ten of these transactions in this postcode district
some properties may appear in both the 'flips' and 'flops' lists.
Page 18 of 20

8/14/2019 Calnea Report North West Apartments
http://slidepdf.com/reader/full/calnea-report-north-west-apartments 20/21
Crime statistics
Based on police recorded crime reports (for the financial year 2006/7) Wigan ranks at 252 out of the 373 CDRPs (Crime and Disorde
Reduction Partnerships). The larger the rank number the worse the levels of crime.
Wigan Greater Manchester National
Violence 17.00 18.80 16.20
Sexual Offence 1.00 1.10 0.98
Robbery 1.00 2.50 0.99
Burglary 6.00 8.10 4.21
Theft of Motor 4.00 4.70 2.68
Theft from Motor 8.00 11.40 6.88
The numbers above refer to offences per 1,000 people. Local crime figures are reported by Crime and Disorder Reduction
Partnerships (CDRPs). These are local partnerships of police, local authorities and various other organisations.
Please refer to the relevant local area guide on Mouseprice for more information on this postcode district.
Page 19 of 20

8/14/2019 Calnea Report North West Apartments
http://slidepdf.com/reader/full/calnea-report-north-west-apartments 21/21
Notes
Use of Information
This report is provided for information purposes only. The report is prepared from information that is collated with care, however no
representation is made as to the report's accuracy, completeness or reliability. The user assumes total responsibility and risk for
subsequent use of any information contained within this report. Persons seeking to place reliance on the information contained
within this report for their own or third party purposes do so at their own risk. You are advised to seek independent advice when
buying or selling a property.
Crown copyright material is reproduced with the permission of Land Registry. (a)Permitted Use. Viewers of this Information are
granted permission to access this Crown copyright material and to download the Crown copyright material onto electronic, magnetic
optical or similar storage media provided that such activities are for private research, study or in-house use only. Any other use of the
material requires the formal written permission of Land Registry which can be requested from Land Registry at Lincoln’s Inn Fields,
London , WC2A 3PH. (b) Restricted Use. Viewers must not copy, d istribute, sell or publish any of the Crown copyright material. For
information on the Land Registry dataset please contact the Land Registry directly.


