17
Calorimetry for LENR ARPA-E LENR workshop October 21, 2121
Calorimetry for LENRARPA-E LENR workshopOctober 21, 2121

Objectives for calorimeter analysis● Prepare any claimed result for rigorous review
○ An error bar on every data point; quantified uncertainty on every claim○ Build multiple copies of your experiment. Recalibrate and run replicates as you go. ○ Share and archive all data and metadata for independent review.○ Calibrate the instrument over wider excursions in time and power than the
experiment.■ Earn your license to go excess heat hunting. This can take a year or more of preparation.
○ Deploy primary and backup sensors. ○ Model and explain all of the sensor data. ○ Include control experiments that rule out prosaic hypotheses○ Document the methods and the thread of reasoning from raw data to conclusion
2
Objectives for calorimeter analysis continued● During calibration, discover in the data what a human might miss
○ Avoid the human foible of observer bias■ What are all of the possible ways this could not be excess heat?
○ Learn the system behavior very well so that during experiments deviations from model predictions can be trusted as significant
● During experimentation○ Continue calibration and control runs throughout to control for apparatus drift○ If something looks interesting, seek independent laboratory replication
3

An error bar on every data pointExample: high pressure high temperature metal hydride● each experiment in quadruplicate● vertical lines 95% confidence about
average● 3 sigma detection limit shown
4
https://doi.org/10.1038/s41586-019-1256-6
5
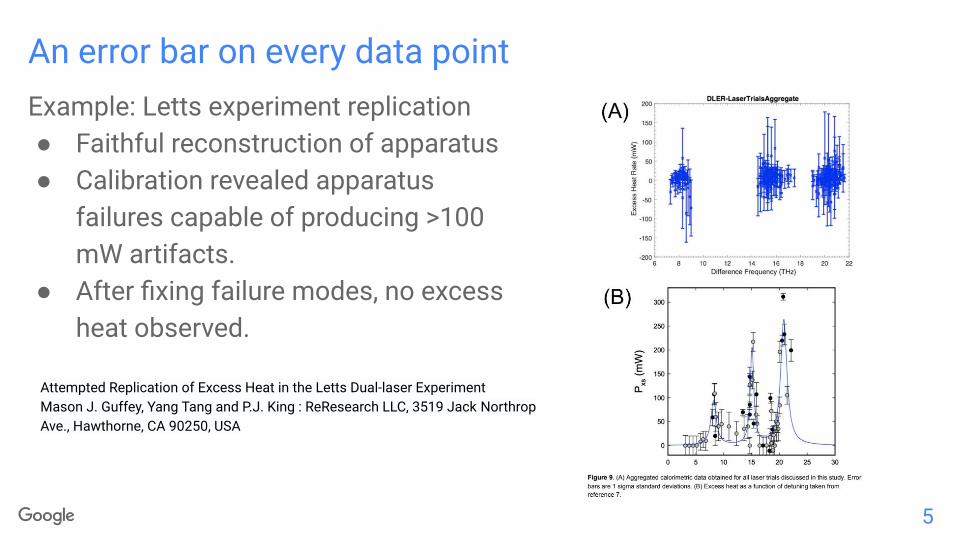
An error bar on every data pointExample: Letts experiment replication● Faithful reconstruction of apparatus● Calibration revealed apparatus
failures capable of producing >100 mW artifacts.
● After fixing failure modes, no excess heat observed.
Attempted Replication of Excess Heat in the Letts Dual-laser ExperimentMason J. Guffey, Yang Tang and P.J. King : ReResearch LLC, 3519 Jack Northrop Ave., Hawthorne, CA 90250, USA
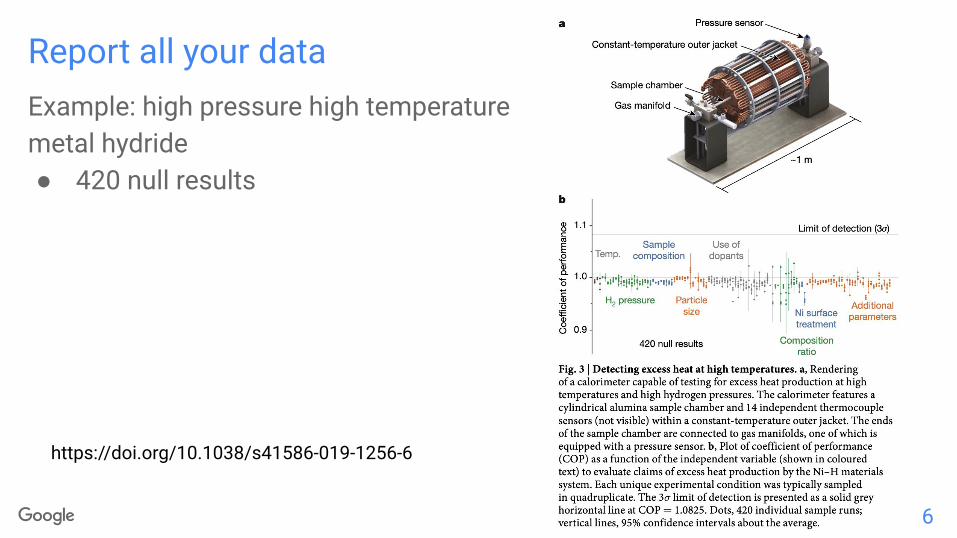
Report all your dataExample: high pressure high temperature metal hydride● 420 null results
6
https://doi.org/10.1038/s41586-019-1256-6

Archive all the data
DateStamp 13/04/2017TimeStamp 11:43:13.134Pressure_1 0.955631348Voltage_1 (V) 6.944Current_1 (A) 20.114Resistance_1 (Ω) 0.345230402Voltage_2 (V) 6.923175271Power_1 (W) 139.2606601Internal Top 180.8140906Internal Bot 158.843144Back Brick Top Mid 89.43193378Back Brick Bot Mid 70.63432485Back Brick Top L 72.11884765Back Brick Bot R 51.50715517Front Brick Top Mid 64.35528123Front Brick Bot Mid 67.73211302Surface Can Top L 16.73702861Surface Can Top R 16.66714854Surface Can Bot R 16.49421933Surface Can Bot L 16.56916057Back Face Plate 17.91205576Front Face Plate 19.18418332
One experiment4 instruments × 2 days ≈ 13,800,000 data points
All experiments100 HTC experiments ≈ 1.38 billion data points
× 7 instruments
One second of data
spreadsheets database
7

Archive all the data
8
Reanalysis may prove very important later on
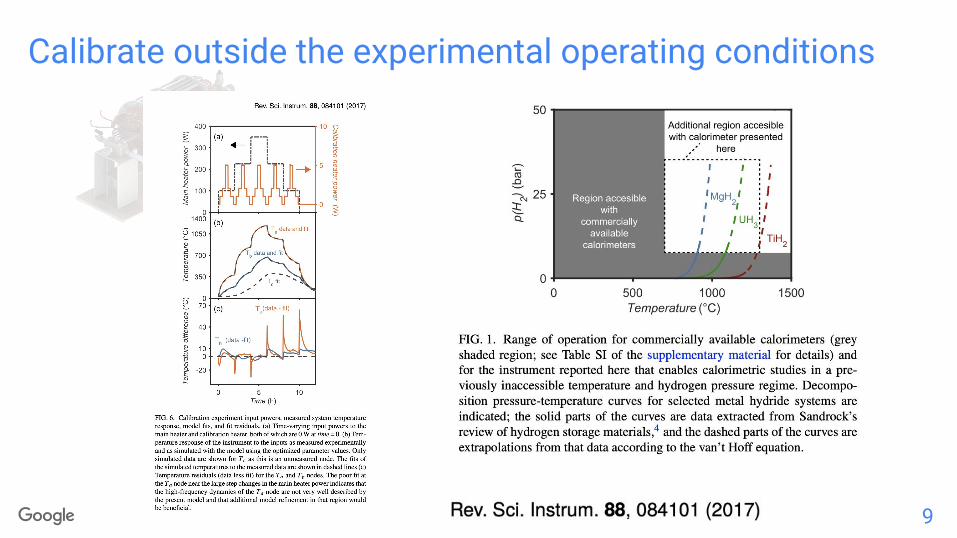
Calibrate outside the experimental operating conditions
9
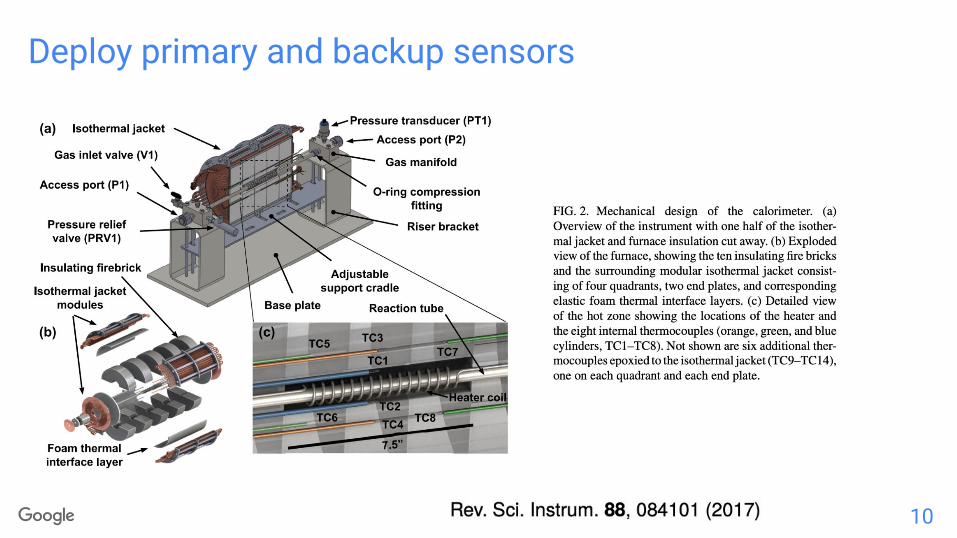
Deploy primary and backup sensors
10
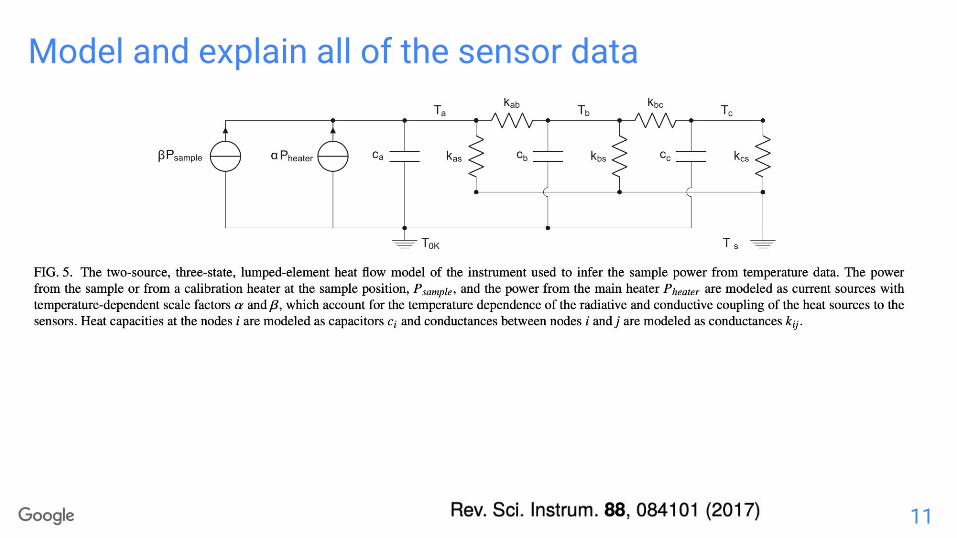
Model and explain all of the sensor data
11
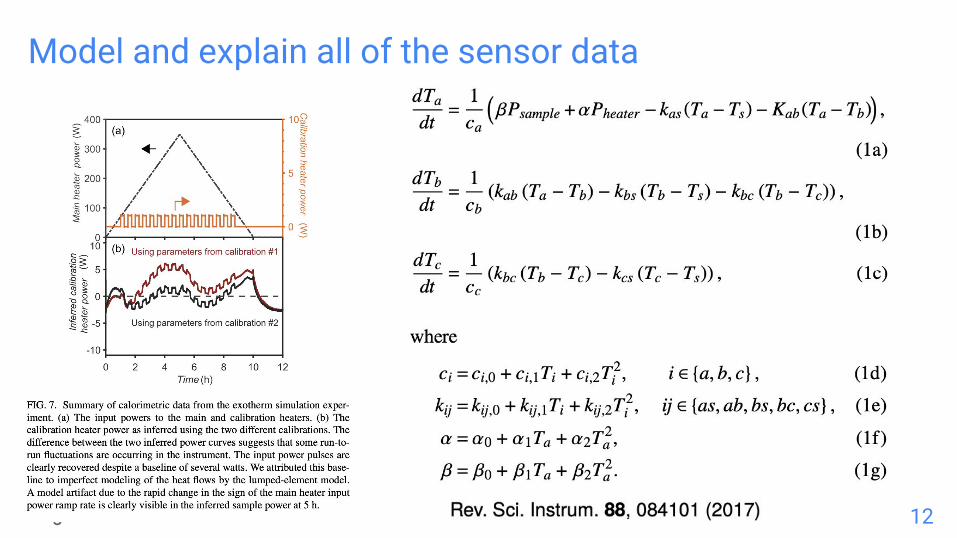
Model and explain all of the sensor data
12
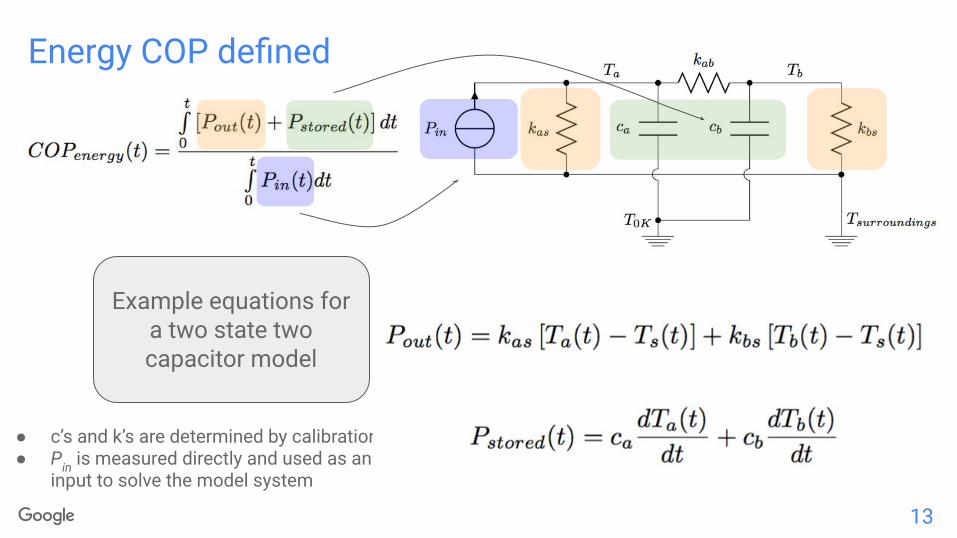
Energy COP defined
Example equations for a two state two capacitor model
● c’s and k’s are determined by calibration● Pin is measured directly and used as an
input to solve the model system
13
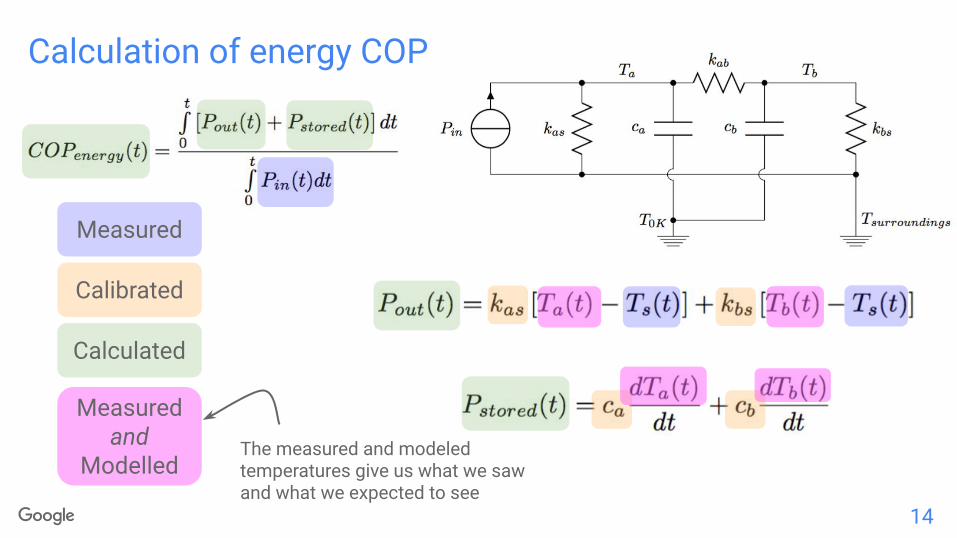
Calculation of energy COP
14
Measured
Calibrated
Calculated
Measured and
ModelledThe measured and modeled temperatures give us what we saw and what we expected to see
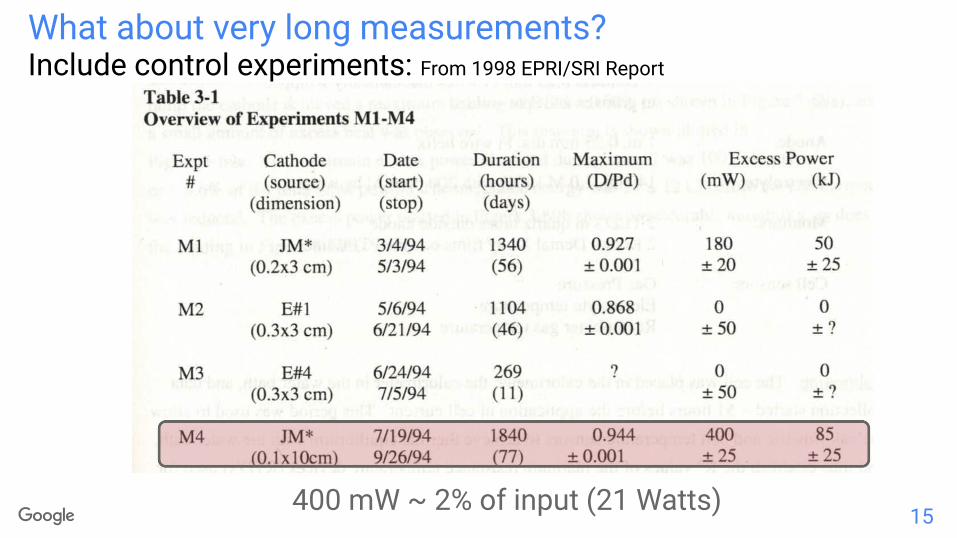
Include control experiments: From 1998 EPRI/SRI Report
400 mW ~ 2% of input (21 Watts) 15
What about very long measurements?

More on calorimetry
16
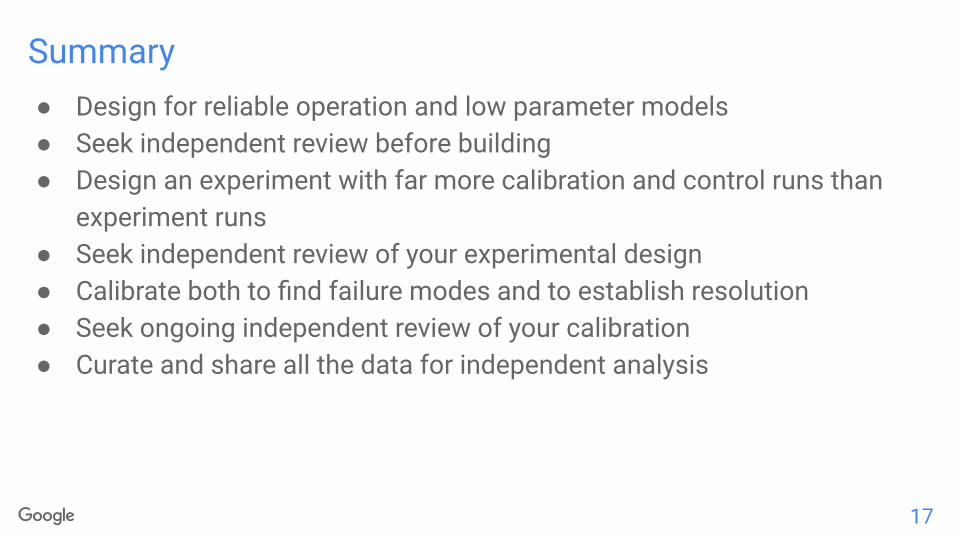
Summary
17
● Design for reliable operation and low parameter models● Seek independent review before building● Design an experiment with far more calibration and control runs than
experiment runs● Seek independent review of your experimental design● Calibrate both to find failure modes and to establish resolution● Seek ongoing independent review of your calibration● Curate and share all the data for independent analysis


