36
CalPERS for California 2011 Supporting Economic Opportunity in California

CalPERS for California 2011
Supporting Economic Opportunity in California

B | CalPERS for California Annual Report 2011
Alameda
Alpine
Amador
Butte
Calaveras
Colusa
ContraCosta
Del Norte
El Dorado
Fresno
Glenn
Humboldt
Imperial
Inyo
Kern
Kings
Lake
Lassen
Los Angeles
Madera
Marin
Mariposa
Mendocino
Merced
Modoc
Mono
Monterey
Napa
Nevada
Orange
Placer
Plumas
Riverside
Sacramento
San Benito
San Bernardino
San Diego
San Joaquin
San Luis Obispo
San Mateo
San Francisco
Santa Barbara
Santa Clara
Santa Cruz
Shasta
Sierra
Siskiyou
Solano
Sonoma
Stanislaus
Sutter
Tehama
Trinity
Tulare
Tuolumne
Ventura
Yolo
Yuba
CalPERS for CaliforniaThe California Public Employees Retirement
System (CalPERS) is one the largest investors in the
world, with more than $235 billion in assets as of
June 30, 2011.
Approximately $19 billion (8.2 percent) of these
funds are invested in California-based companies
and projects.
CalPERS for California highlights some of the
broad ancillary benefits of all CalPERS investments
in California.

Table of Contents
Executive Summary . . . . . . . . . . . . . . . . . . . . . . . . . 3
Introduction . . . . . . . . . . . . . . . . . . . . . . . . . 4
Public Markets . . . . . . . . . . . . . . . . . . . . . . . . . . . . 6
Public Equities . . . . . . . . . . . . . . . . . . . . . . . . . . . . 6
Fixed Income . . . . . . . . . . . . . . . . . . . . . . . . . . . . 8
Private Markets . . . . . . . . . . . . . . . . . . . . . . . . . 11
Private Equity . . . . . . . . . . . . . . . . . . . . . . . . . . . . 13
Real Estate . . . . . . . . . . . . . . . . . . . . . . . . . . . . . . 17
Infrastructure . . . . . . . . . . . . . . . . . . . . . . . . . . . . . 20
Conclusion . . . . . . . . . . . . . . . . . . . . . . . . . . . 22
Location of CalPERS Investments in California . . . . . . . . . . . . 23
Endnotes . . . . . . . . . . . . . . . . . . . . . . . . . . . . 28

2 | CalPERS for California Annual Report 2011

CalPERS for California Annual Report 2011 | 3
Executive Summary
The California Public Employees’ Retirement System
(CalPERS) plays a significant role in California’s economy,
providing retirement and health benefits to more than
1.6 million public employees, retirees, and their families,
and more than 3,000 employers.
As of June 30, 2011, CalPERS investment portfolio totaled
$237.5 billion. Of this amount, 8.2 percent, or $19.4 billion, is
invested in California, supporting 1.4 million local jobs. 1
CalPERS investments in California are a direct result
of the strength and diversity of California’s economy and
the quality of its companies, properties, and other invest-
ment opportunities. The ancillary benefits of CalPERS invest-
ments in California include jobs, infrastructure for commu-
nities and commerce, business expansion and related
economic activity.
This report documents the capital invested in
California by CalPERS and resulting ancillary benefits.
At June 30, 2011, CalPERS invested:
• $7.8 billion in 666 California-headquartered public
companies, which employ over 1,040,000 people
in California
• $3.7 billion of fixed income capital in California,
$615 million of which is invested in 46 California-head-
quartered corporate bond issuers employing 61,000
people in California2
• $4.2 billion in 1,536 California-headquartered private
companies, which employ 190,000 people in California
• $3.6 billion in 363 California-based real estate projects,
which employ 100,000 people in California
• $68 million in 6 California-based infrastructure
projects, which employ 2,200 people in California
Separate from this report, CalPERS has prepared a study
examining the economic impacts of its pension payments in
California. The report, The Economic Impacts of CalPERS
Pension Payments in 2010, is available on the CalPERS
website at www.calpers.ca.gov/index.jsp?bc=/about/press/
news/economic-engine/econ-impacts/home.xml.
CalPERS Investments in California by Asset Class: June 30, 2011
Total Portfolio Value (in billions)
Dollars Invested in California (in billions)
Percentage of Dollars Invested in California Jobs in California3
Public Equities $123.3 $7.8 6.3% 1,040,000
Private Equity $33.6 $4.2 12.5% 190,000
Real Estate $18.6 $3.6 19.4% 100,000
Infrastructure1 $0.7 $0.1 10.0% 2,200
Fixed Income $50.2 $3.7 7.4% 61,000
Other 2 $11.1 — — —
All CalPERS Total $237.5 $19.4 8.2% 1,393,200
1 The values for the infrastructure portfolio have been rounded for this chart. The actual values are $681 million and $68.1 million respectively.
2 CalPERS total portfolio value was $237.5 billion at 6/30/2011. The 5 asset classes above do not comprise the entire portfolio. “Other” consists primarily of non-infrastructure inflation linked securities, cash, and cash-equivalents.
3For methodologies calculating the number of jobs in California please refer to individual asset class sections within the report.

4 | CalPERS for California Annual Report 2011
Introduction
CalPERS has invested $19 billion in companies, properties
and projects located in California across five key asset
classes including public equities, private equities, fixed
income, real estate, and infrastructure. The companies, prop-
erties and projects in which CalPERS invests employ an
estimated 1,393,200 workers in California, representing over
10 percent of the state workforce.3
The primary objective of CalPERS investments in
California is to achieve appropriate risk adjusted returns on
investment. Investment in California by CalPERS and its
third-party investment managers is a consequence of the
strength and diversity of California’s economy and the
quality of its companies, properties, and other investment
opportunities.4
Specifically:
• At $1.9 trillion,5 California represents 13 percent of U.S.
Gross Domestic Product (GDP) and ranks as the world’s
tenth largest economy.6
• California is home to 53 Fortune 500 companies and
15 of the largest 500 corporations in the world.7
• California has received $126 billion of $1 trillion in
private equity investments made from 2000-10 in
the U.S..8
• California exported $143 billion of goods in 2010,
representing 19.2 percent of the U.S. total.9
CalPERS invests like other large institutions, diversifying
its portfolio among categories of investments, called “asset
classes,” to reduce its exposure to any one market risk and
maximize its return on investment.
Asset classes in this report include:
• Public markets
– Public equities: investments in public companies
domestically and internationally, for example
through the New York Stock Exchange
– Fixed income: investments in loans provided to
governments, companies, and other borrowers
• Private markets
– Private equities: investments in private companies
that are not publicly traded
– Real estate: investments in commercial, residential
and industrial property
– Infrastructure: investments in real assets including
bridges, toll roads, utilities, and airports
California is home to investment opportunities in each
asset class, to which CalPERS deploys capital directly, using
an in-house team of investment professionals, or by employ-
ing the services of qualified third-party investment manage-
ment companies.
California’s large and vibrant economy will continue to
attract a proportion of CalPERS total investments and will
benefit from the impacts that this capital brings to the state.
This report describes the breadth of the System’s
exposure to companies, properties and projects in Califor-
nia, highlighting the number of jobs that these investments
support. The geographic characteristics of investments are
used to document the deployment of capital by CalPERS to
communities of interest like low- to moderate-income areas.

CalPERS for California Annual Report 2011 | 5
CalPERS Investments by Asset Class in California
6 | CalPERS for California Annual Report 2011
Public Markets
CalPERS invests the largest volume of its assets in total, and
in California, in the public equity and fixed income markets.
The analysis below includes estimates of the number of
workers employed in California by the companies in which
CalPERS invests. These jobs are not created or sustained
only by CalPERS investments. CalPERS owns approximately
0.2 percent of the largest California-headquartered compa-
nies in its portfolio. Nonetheless, CalPERS provides an
important source of capital for use in all the activities of the
public companies and fixed income opportunities in which
it invests.
This research focuses on California-headquartered
companies because it is readily apparent that the impacts
these firms have on California are more significant than
those headquartered elsewhere. Companies headquartered
in California have 21 percent of their facilities located
in-state compared to companies with headquarters
outside of California, which have three percent of their
facilities based locally.
PuBlIC EquITIES
Public Equities
Total Market Value $123.3 billion
Value in CA $7.8 billion
Percentage in CA 6.3%
CalPERS invests in public companies primarily as a long-
term investor, without betting on market fluctuations. The
largest proportion of its public equity portfolio is passively
managed by an in-house team of investment professionals.
CalPERS maintains some active equity management, where
there is potential to add value, using both in-house exper-
tise, and by engaging the services of qualified third-party
investment management companies.
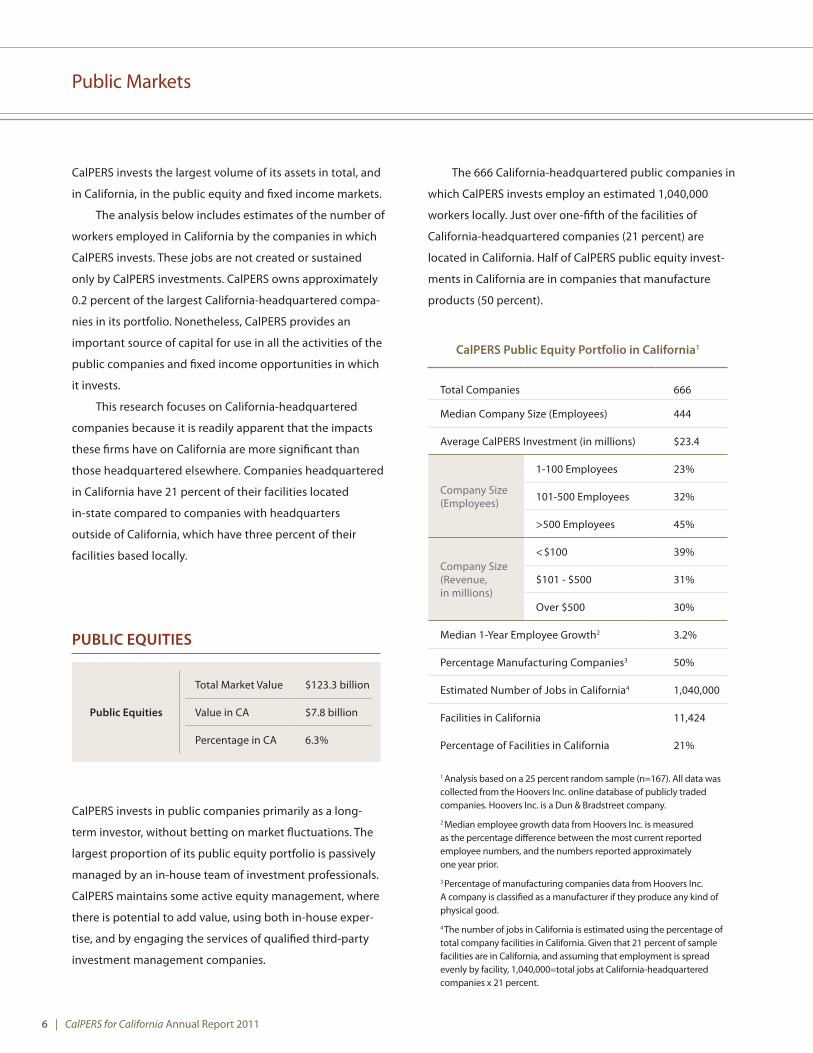
The 666 California-headquartered public companies in
which CalPERS invests employ an estimated 1,040,000
workers locally. Just over one-fifth of the facilities of
California-headquartered companies (21 percent) are
located in California. Half of CalPERS public equity invest-
ments in California are in companies that manufacture
products (50 percent).
CalPERS Public Equity Portfolio in California1
Total Companies 666
Median Company Size (Employees) 444
Average CalPERS Investment (in millions) $23.4
Company Size (Employees)
1-100 Employees 23%
101-500 Employees 32%
>500 Employees 45%
Company Size (Revenue, in millions)
< $100 39%
$101 - $500 31%
Over $500 30%
Median 1-Year Employee Growth2 3.2%
Percentage Manufacturing Companies3 50%
Estimated Number of Jobs in California4 1,040,000
Facilities in California 11,424
Percentage of Facilities in California 21%
1 Analysis based on a 25 percent random sample (n=167). All data was collected from the Hoovers Inc. online database of publicly traded companies. Hoovers Inc. is a Dun & Bradstreet company.
2 Median employee growth data from Hoovers Inc. is measured as the percentage difference between the most current reported employee numbers, and the numbers reported approximately one year prior.
3 Percentage of manufacturing companies data from Hoovers Inc. A company is classified as a manufacturer if they produce any kind of physical good.
4 The number of jobs in California is estimated using the percentage of total company facilities in California. Given that 21 percent of sample facilities are in California, and assuming that employment is spread evenly by facility, 1,040,000=total jobs at California-headquartered companies x 21 percent.

CalPERS for California Annual Report 2011 | 7
CalPERS makes investments of more than $100 million
in 15 separate companies headquartered in California.
These companies account for 60 percent of CalPERS public
equity investments in California and 20 percent of the
California workers employed at public companies in
CalPERS portfolio.
CalPERS +$100 Million Public Equity Investments in California
Company Name
CalPERS Investment
(in millions)1
Total Market Capitalization
(in millions)2CalPERS % of Market Value
Company Facilities in California3
Apple Inc $856.6 $342,913 0.25% 17%
Chevron Corp $587.8 $190,505 0.31% 27%
Oracle Corp $426.8 $150,570 0.28% 12%
Wells Fargo & Co $426.3 $126,195 0.34% 16%
Google Inc $322.5 $148,480 0.22% 18%
Intel Corp $303.7 $118,338 0.26% 17%
Occidental Petroleum Corp $278.7 $74,384 0.37% 18%
QUALCOMM Inc $259.7 $91,580 0.28% 21%
Hewlett-Packard Co $246.2 $52,953 0.47% 11%
Cisco Systems Inc $242.6 $96,891 0.25% 15%
The Walt Disney Co $204.0 $63,141 0.32% 26%
Amgen Inc $152.7 $48,184 0.32% 14%
DirecTV $128.0 $32,704 0.39% 29%
Visa $118.3 $47,569 0.25% 34%
eBay $111.4 $37,480 0.30% 15%
1 CalPERS investment is market value at 6/30/2011.
2 Total market capitalization at 6/30/2011. Data from smartmoney.com Stock Quote key stats.
3 The percent of facilities in California is determined using Hoovers, Inc. data and includes all company facilities with a California address.

8 | CalPERS for California Annual Report 2011
CalPERS invests in approximately 9,000 companies that
are not headquartered in California. California operations
comprise three percent of the total number of facilities
globally for these companies.10 While companies headquar-
tered elsewhere likely employ millions of Californians, as evi-
denced by the approximately 40,000 facilities they operate
in California compared to 11,000 for the 666 California-
headquartered companies that employ 1,040,000 local
workers, a precise jobs estimate was unable to be deter-
mined with available data.
Impacts of Global Equity Companies not Headquartered in California
on the California Economy1
Total Companies 9,084
Approximate Number of Facilities 1,520,000
Percentage of Facilities in CA 3%
1 Analysis based on a 3 percent random sample (n=273) of companies not headquartered in California in the CalPERS Global Equity portfolio.
Case Study: CalPERS Investments in Innovative Global Companies
At a time when technological and industrial
innovation provides an important path to
prosperity and job creation, CalPERS invests
$1.2 billion in 16 of Forbes’ 20 most innovative
global companies.11 Two of these companies,
Apple Inc. and Google Inc., are headquartered in
California; nine are located in the United States.
These 16 companies have an average of 19 percent
of their facilities located in California and employ
an estimated 115,000 workers in the state.12
Moreover, during a period of modest job creation,
eight companies experienced double-digit
employee growth and only one lost jobs.
The median one year employee growth rate at the
16 companies was 9.5 percent. Taking California-
headquartered companies as an example, Apple
recorded 28 percent employee growth in the past
year, while Google reported 23 percent. Innovators
on the Forbes list have contributed to the
California economy by creating robotic-assisted
medical procedures that lower costs and reduce
medical errors, have supported business
development efforts for underprivileged rural
women, have transformed commerce with cloud
computing, and superior customer relationship
management systems.

CalPERS for California Annual Report 2011 | 9
FIxEd InCoME 13
Fixed Income
Total Market Value $50.2 billion
Value in CA $3.7 billion
Percentage in CA 7.4%
CalPERS has fixed income investments in California,
managed both internally and externally, in three
primary vehicles:
• Corporate bonds: Corporate bonds are debt
securities issued by private and public corporations.
Companies issue corporate bonds to raise money for
a variety of purposes, such as building new plants or
purchasing equipment.14
• Credit enhancements: Credit enhancements for
companies or government entities effectively substitute
the credit rating and liquidity of the credit enhancement
provider for that of the borrower. Credit enhancement
thereby lowers the cost of capital for the borrower.
• Structured securities: Structured securities are
investments in a diverse group of loans and provide
risk and return characteristics contingent on a range
of underlying indices, interest rates or cash flows.15
CalPERS Fixed Income Key Investment Classes in California
Dollars invested (in millions)
Percentage of dollars invested
CA Corporate Bonds $615 17%
Structured Securities $2,705 73%
Whole Loans $15 1%
Credit Enhancement $325 9%
Total $3,660 100%
CalPERS investments include loans to 46 companies
headquartered in California. CalPERS invests $549 million
directly in 11 of these companies, without the assistance of
external third-party investment managers. The 11 compa-
nies in which CalPERS invests directly are larger than compa-
nies invested in by other asset classes, with a median size of
approximately 16,000 employees. These companies employ
approximately 60,500 workers in California and operate
4,000 local facilities.

10 | CalPERS for California Annual Report 2011
CalPERS Fixed Income Portfolio – Corporate Bonds in California1
Total Companies 11
Median Company Size (Employees) 16,200
Average CalPERS Investment (in millions) $32.3
Company Size (Employees)
1-100 Employees 0%
101-500 Employees 0%
>500 Employees 100%
Company Size (Revenue, in millions)
< $100 9%
$101 - $500 9%
Over $500 82%
Median 1-Year Employee Growth2 0.0%
Percentage Manufacturing Companies3 18%
Estimated Number of Jobs in California4 60,547
Facilities in California 4,037
Percentage of Facilities in California 11%
1 Data from corporate bond recipients with headquarters in California, as listed in the Hoovers Inc. database. This includes 11 companies and $550 million of investments. This table does not include California corporate bond recipients receiving investment through external managers. There are 40 California corporate bond recipients receiving a total of $66.4 million in investment from third-party investment managers with an average investment of $0.9 million. Five of these 40 corporate bond recipients receiving investment from third-party investment managers also receive direct investment from CalPERS.
2 Median employee growth data from Hoovers Inc. is measured as the percentage difference between the most current reported employee numbers, and the numbers reported approximately one year prior.
3 Percentage of manufacturing companies data from Hoovers Inc. A company is classified as a manufacturer if they produce any kind of physical good.
4 California jobs estimated by multiplying total number of employees by the percentage of facilities in California.
CalPERS also invests in approximately 360 corporate
bond issuers that are not headquartered in California, of
which 66 percent have facilities in-state and employ local
workers. In-state operations comprise 4 percent of the total
number of facilities globally for these companies.16 While
companies headquartered elsewhere likely employ
hundreds of thousands of Californians as evidenced by the
approximately 11,000 facilities they operate in California
compared to 4,000 for the 11 California-headquartered
companies that employ 60,500 local workers, a precise jobs
estimate was unable to be determined with available data.
Impacts of Fixed Income Corporate Bond Recipients not Headquartered in California1
on the California Economy
Total Companies 363
Approximate Number of Facilities 28,000
Percentage of Facilities in CA 4%
1 Analysis based on a 10 percent random sample (n=35) of companies not headquartered in California in the CalPERS Fixed Income portfolio.

CalPERS for California Annual Report 2011 | 11
Case Study: Supporting the California General obligation Bond Program
The Credit Enhancement Program, approved by
the CalPERS Board in February 2003, is designed
to assist municipalities nationwide in accessing
the bond market more efficiently. In 2008,
CalPERS doubled the capacity of the program
following significant turmoil in the municipal
bond market, which increased demand for
credit enhancement facilities and led to an
increase in the cost of credit. As of June 30, 2011,
the Credit Enhancement Program provided
credit enhancement for three bond issues in
California totaling $325 million.
One of these issuers is the State of California,
through the Variable Rate General Obligation
Bond program, to which CalPERS provides a
letter of credit. CalPERS credit enhancement
allows the State to access short term credit
markets and pay a lower interest rate than they
would ordinarily need to, even in longer term
credit markets. By reducing the interest cost of
the State’s debt, the credit enhancement
program assists the State in reducing expendi-
tures on debt service and increasing available
funds for other public services and capital
projects that benefit California.

12 | CalPERS for California Annual Report 2011
Private Markets
CalPERS invests approximately 22 percent of its total assets
in private markets inside and outside of California, including
in private equity, real estate and infrastructure. Within
California, the proportion of CalPERS assets in private
market strategies is much greater, at 41 percent. Private
market strategies encompass investments in companies,
properties, and projects that cannot be accessed publicly.
The job creation and other ancillary benefits of private
companies, properties and projects that receive investments
directly from CalPERS, or through contracted third-party
investment managers, can be more directly attributed to the
System than investments in public markets.
CalPERS is typically a larger investor among a more
targeted group of institutions in any given deal, fund or
partnership. Moreover, in the case of private equity, the
investment managers supported by CalPERS (called “General
Partners”) often join the boards of directors of the companies
in which they invest and provide strategic advice, improved
operating guidance, and access to broad networks that
directly enhance the probability of business success.
At times, the investment managers that CalPERS enlists
to support its efforts in private markets have also raised
additional capital as a result of CalPERS anchor partnership
commitment in their funds. While not all of these “co-invest-
ments” in private California-based companies, properties,
and projects can be attributed to CalPERS, the opportunity
to partner with CalPERS and its investment managers has
proven to be attractive to other providers of capital.
The private markets section of CalPERS for California
highlights four areas in which capital is especially socially
beneficial.17 This includes:
• Low- to Moderate-Income (LMI) Areas18
• High Unemployment Areas19
• High Minority Areas20
• Rural Areas21
Access to capital is an important factor in business and
productivity growth, job and wealth creation, innovation,
and sustainable community and economic development.
The benefits of access to capital accrue to the direct
recipients of investments, and to the areas in which they
are located.
The proportion of CalPERS investments in LMI, High
Unemployment, High Minority, and Rural Areas reflects the
demands for capital in the asset classes in which CalPERS
invests, for example from companies and properties
located primarily in central business districts and other
economic hubs, which tend to be ethnically and economi-
cally diverse. As with all the System’s investments, the
decision of CalPERS and its third-party investment manag-
ers to support a California-based company, property or
project is made solely on the basis of the financial merits of
the particular opportunity.

CalPERS for California Annual Report 2011 | 13
locating Investments in California
The analysis in this section uses the demographic and
income characteristics of ZIP codes. If the ZIP code in
which an investment is located is determined to be
an LMI, High Unemployment, High Minority, or Rural
Area, the investment – and the dollars associated
with the investment – are considered to be in the
defined community.
In the case of High Unemployment, Rural, and High
Minority Areas, the calculations are relatively straight-
forward. The data used to determine the appropriate
status of relevant populations is available by ZIP code
and uses 2000 U.S. Census and 2010 California
Employment Development Department data.
Calculating the LMI status of a ZIP code is more
complex. The following method is applied using U.S.
Census Bureau 2006-10 American Community Survey
data for every tract in the United States:
1. The population in a census tract is assumed to be
evenly distributed across the entire census tract.
This includes the LMI population.
2. The number of census tracts and percentage of
each census tract located in every ZIP code is
determined using geographic information
systems (GIS) data.
3. The percentage of the total population and
LMI population from each census tract is
attributed to the ZIP code in which it is
located.
4. A total population number, and LMI
population number, is calculated for every
ZIP code by combining partial census tracts.
5. The ZIP code is considered to be LMI if the
percentage of LMI population in a ZIP code
is greater than 50 percent of the total.
In the United States 38 percent of all ZIP codes
are classified as LMI using this analysis. In
California, 49 percent of all ZIP codes are
classified as LMI, including 85 percent in the
“urban core” comprising the Central Business
Districts of San Francisco, Oakland, Los Angeles
and San Diego.22

14 | CalPERS for California Annual Report 2011
PRIvATE EquITy
Private Equity
Total Market Value $33.6 billion
Value in CA $4.2 billion23
Percentage in CA 12.5%
CalPERS is a significant investor in privately held California-
based companies in a wide range of industries. Private
companies are generally smaller than public companies and
use capital to support rapid growth, whether by commercial-
izing new technologies, expanding operations, or by realizing
efficiencies in readiness for an acquisition or public listing.
CalPERS invests in private companies primarily
through Limited Partnerships, or funds. These investments
are often structured as ten year agreements with a profes-
sional investment manager. The manager, known as
the General Partner, is the intermediary between investors
with capital and businesses seeking capital.
CalPERS Private Equity Portfolio in California
Total Companies 1,536
CalPERS Investments (in millions) $4,175
Other Co-Invested Dollars (in millions)1 $32,805
Estimated Jobs in CA2 190,000
1 Includes all other capital invested alongside CalPERS in the same companies in the same private equity fund, not the total market value of the company. Other co-invested dollars are determined only from $2.9 billion in investments for which information was available.
2 Estimated jobs in California was determined by applying the total number of California jobs supported by the California Initiative to the entire California AIM portfolio.
The companies in CalPERS private equity portfolio that
are headquartered in California are estimated to employ
190,000 workers in the state. More than $32 billion has been
co-invested alongside CalPERS in the same California-based
companies by other institutional Limited Partners.
Of 253 third-party funds investing CalPERS assets
in California-headquartered companies, the majority
(58 percent) are managed by General Partners based
in California.
CalPERS private equity investments provide a unique
ancillary benefit by deploying capital to areas that have
traditionally had limited access to institutional private
equity assets. Private equity investment has historically
been clustered within geographic regions such as Silicon
Valley. Specifically, more than 90 percent of private equity
capital has been invested in just ten percent of ZIP codes in
California. In addition to investing in these traditional
private equity markets, CalPERS and its third-party invest-
ment advisors seek profitable investment opportunities in
companies that may have been overlooked because of their
location. As of June 30, 2011, 35 percent of the value of
CalPERS private equity investments in California are directed
to ZIP codes outside of the areas receiving the vast majority
of investments from all sources of institutional private
equity capital.
CalPERS for California Annual Report 2011 | 15
Approximately two-thirds of the value of CalPERS
private equity investments in California are in High Minority
Areas. CalPERS also makes private equity investments in
High Unemployment, LMI, and Rural Areas.
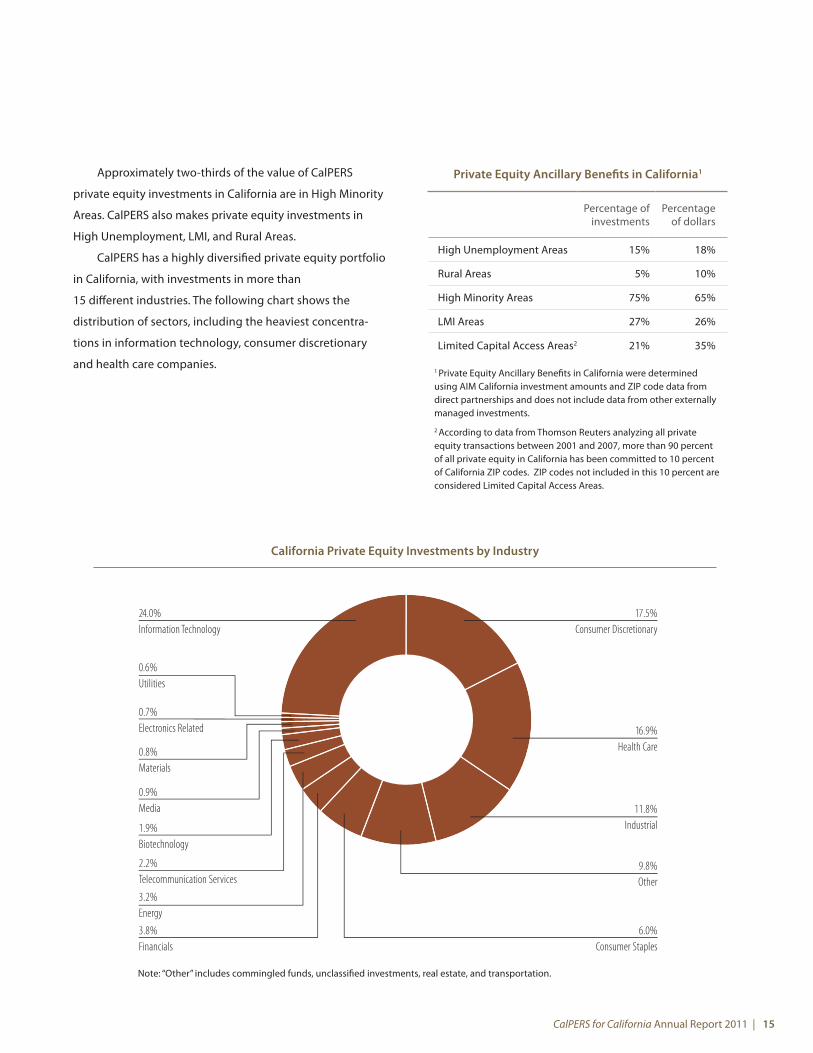
CalPERS has a highly diversified private equity portfolio
in California, with investments in more than
15 different industries. The following chart shows the
distribution of sectors, including the heaviest concentra-
tions in information technology, consumer discretionary
and health care companies.
Private Equity Ancillary Benefits in California1
Percentage of investments
Percentage of dollars
High Unemployment Areas 15% 18%
Rural Areas 5% 10%
High Minority Areas 75% 65%
LMI Areas 27% 26%
Limited Capital Access Areas2 21% 35%
1 Private Equity Ancillary Benefits in California were determined using AIM California investment amounts and ZIP code data from direct partnerships and does not include data from other externally managed investments.
2 According to data from Thomson Reuters analyzing all private equity transactions between 2001 and 2007, more than 90 percent of all private equity in California has been committed to 10 percent of California ZIP codes. ZIP codes not included in this 10 percent are considered Limited Capital Access Areas.
24.0%Information Technology
17.5%Consumer Discretionary
11.8%Industrial
9.8%Other
6.0%Consumer Staples
0.9%Media
0.8%Materials
0.6%Utilities
3.8%Financials
3.2%Energy
2.2%Telecommunication Services
1.9%Biotechnology
0.7%Electronics Related 16.9%
Health Care
California Private Equity Investments by Industry
Note: “Other” includes commingled funds, unclassified investments, real estate, and transportation.

16 | CalPERS for California Annual Report 2011
The CalPERS California Initiative (Initiative) is a private
equity investment strategy providing capital to companies
primarily in California with the goal of generating financial
returns that meet or exceed industry benchmarks. As an
ancillary objective, the Initiative invests in traditionally
underserved areas where opportunities may have been
bypassed, aiming to impact the economic infrastructure of
the state. The Initiative was established in 2001 and has
invested $1 billion since inception, with $374 million
currently invested in 166 active companies reporting data
in 2011.
The 2010 CalPERS for California report included detailed
findings on the ancillary benefits of the Initiative. In 2011,
the 7th annual examination of the ancillary benefits of the
Initiative is available in a separate report on CalPERS website
at http://www.calpers.ca.gov/eip-docs/about/press/news/
economic-engine/ca-initiative.pdf.
Highlights include:
• 12,669 new jobs at 166 companies reporting data, for
employment growth of 18 percent since investment
• Investment in areas that have not historically received
institutional equity capital, with 46 percent of portfolio
companies located in these underserved markets
• Employment opportunities for economically disadvan-
taged workers, with 51 percent of all reporting company
employees classified as low- to moderate-income.
Ancillary benefits for the Initiative are summarized
in the following tables:
Since Inception California Initiative Results Job Support and Job Creation
Ancillary Benefits1
Overall California Initiative
The California Initiative
within California
Percentage within
California
Total Jobs/ Employees Supported
126,579 27,471 22%
Total Jobs Created Since Investment
11,879 3,542 30%
Percentage Job Growth Since Investment 2
10% 15% n/a
1Ancillary benefits are derived from data from all companies ever receiving investment under the California Initiative and includes both active and fully realized investments that have reported data. These ancillary benefits capture the entirety of the Initiative’s Job Support and Job Creation ancillary benefits since inception.
2From 2001-11 the U.S. private sector experienced job growth of negative one percent and the California private sector experienced job growth of negative four percent.
Case Study: CalPERS California Initiative

CalPERS for California Annual Report 2011 | 17
California Initiative Ancillary Benefits: June 30, 20111
Overall California Initiative The California Initiative within California2
Total Companies 166 130
Total Dollars Invested $374,000,000 $272,000,000
Total Jobs / Employees Supported 83,680 20,892
Total Jobs Created Since Investment 12,669 2,915
Percentage Job Growth Since Investment 18% 16%
Percentage of Employees Classified as Low- to Moderate-Income 51% 55%
Percentage of Companies Located in Areas Underserved by Institutional Equity Capital 46% 41%
Percentage of Dollars Invested in Companies with at least one Female Officer 45% 38%
Percentage of Dollars Invested in Companies with at least one Minority Officer 31% 32%
1Ancillary benefits are derived from data from active companies reporting as of June 30, 2011. These ancillary benefits capture the Initiative’s ancillary benefits for companies currently within the California Initiative portfolio.
2The California Initiative invests in companies with operations and employees in and outside of California. This column examines the Initiative’s ancillary benefits solely in California.

18 | CalPERS for California Annual Report 2011
REAl ESTATE
Real Estate
Total Market Value $18.6 billion
Value in CA $3.6 billion
Percentage in CA 19.4%
CalPERS invests in real estate primarily through the funds
and partnerships of third-party investment managers.
CalPERS has a “core” portfolio of real estate diversified by
property type and geography, emphasizing high occupancy
income. The portfolio also includes single family housing,
senior housing, urban real estate, international investments
and natural resources (timber and agriculture).
The real estate asset class is more heavily weighted to
California than any other asset class. The portfolio in
California includes a diverse group of assets that provide
ancillary benefits in the areas in which they are located,
including the creation of construction jobs and economic
activity connected to construction, the accommodation of
new retail, industrial and commercial employers and the
anchoring of communities with real assets. The following
chart shows the distribution of CalPERS California real estate
investments, including the heaviest concentrations in
apartment, office, housing, and retail properties.
California Real Estate Investments by Property Type
26.8%Apartment
18.4%O�ce
11.3%Retail
9.4%Land
6.5%Hotel
0.4%Senior Housing
4.0%Mixed Use
3.0%Other
2.3%Industrial
1.2%Health Care Facilities
16.8%Housing

CalPERS for California Annual Report 2011 | 19
An additional $2.9 billion in capital from other institutions is
co-invested alongside CalPERS in California real estate. CalPERS
real estate investments support 100,000 jobs statewide.24
CalPERS California real estate projects in the develop-
ment and construction phase support a total of 20,000 jobs.
The construction of CalPERS California real estate projects not
only supports workers within the construction industry, but
also indirectly supports workers throughout the state.25
Additionally, CalPERS California real estate investment
portfolio includes income-generating properties with high
occupancy levels such as neighborhood retail centers and
office buildings. These properties provide critical infrastruc-
ture and operating space to retail and professional service
providers supporting a total of 80,000 jobs. CalPERS properties
with high occupancy levels also support workers within
property management and other related industries.26
CalPERS Real Estate Portfolio in California
CalPERS CA Portfolio Value (in millions) $3,640
Other Co-Invested Dollars (in millions)1 $2,965
Number of Investments 363
Estimated Jobs in California2 100,000
1Value includes all other capital invested alongside CalPERS in the same real estate and infrastructure investments in the same third- party funds, partnerships and real estate investment trusts.
2See endnotes for estimated jobs in California methodology.
Forty percent of CalPERS California real estate invest-
ments are located in LMI areas. Real estate investments are
often in Central Business Districts and concentrated urban
areas, where property investments of all types are more
readily available. These urban districts typically include a
larger proportion of LMI, High Unemployment, and High
Minority Areas.
Real Estate Ancillary Benefits in California1
Percentage of investments
Percentage of dollars
High Unemployment Areas 37% 39%
Rural Areas 18% 9%
High Minority Areas 70% 68%
LMI Areas 50% 46%
1 Ancillary benefits are based on the 284 California real estate investments for which valid ZIP code data was available.

20 | CalPERS for California Annual Report 2011
Case Study: CalPERS Real Estate Hollywood & Highland
Hollywood & Highland is a retail, hotel, and entertainment complex in the heart of historic Hollywood,
Los Angeles County, known by billions of people as the cinematic capital of the world and home to the
Hollywood & Highland Center Theater and Academy Awards.
Hollywood & Highland was purchased by CIM Group in 2004 for $200 million, including $127 million from
CalPERS. The property was targeted in part because of its location in an underserved community and its
favorable price-to-replacement value. After purchasing Hollywood & Highland, and leveraging significant
public sector initiatives to revitalize the neighborhood, CIM redesigned the landscape and signage, made
tenant improvements, added additional vertical transportation options, upgraded the onsite Renaissance
Hotel, and retrofitted the Hollywood & Highland Center Theater after attracting Cirque du Soleil for a 10-year
commitment of performances.
Since CIM’s purchase of this asset, sales and rents have increased significantly and Hollywood & Highland
has become a destination for the local community, tourism, charitable activities, and events including music
festivals and a farmers’ market.
In connection with a loan provided to CIM by the US Department of Housing and Urban Development,
Hollywood & Highland committed to creating 858 new jobs across all areas of the project, of which 51 percent
have been made available to low- and moderate-income persons. In order to accomplish its job creation goals,
Hollywood & Highland is working directly with the WorkSource Center, administered by the City of
Los Angeles Community Development Department.

CalPERS for California Annual Report 2011 | 21
InFRASTRuCTuRE
Infrastructure
Total Market Value $680 million
Value in CA $68.1 million
Percentage in CA 10.0%
CalPERS searches for infrastructure opportunities in sectors
including transportation, energy, natural resources, utilities,
water, communications and certain social infrastructure
projects, investing both directly, and in partnership with
third-party investment managers. CalPERS considers
infrastructure investments, by definition, to benefit society
as a whole.
CalPERS invests $68.1 million in infrastructure assets in
California. More than 92 percent ($62.9 million) of these
investments are in projects providing reliable water supplies
to drought-prone areas.
Other institutions co-invested $112.2 million alongside
CalPERS in California infrastructure projects. CalPERS
infrastructure investments support 2,200 jobs statewide.27
CalPERS Infrastructure Portfolio in California
CalPERS CA Portfolio Value (in millions) $68.1
Other Co-Invested Dollars (in millions)1 $112.2
Number of Investments 6
Estimated Jobs in California 2 2,200
1 Value includes all other capital invested alongside CalPERS in the same infrastructure projects.
2See endnotes for estimated jobs in California methology.

22 | CalPERS for California Annual Report 2011
The development of CalPERS Infrastructure Program in California
On September 12, 2011, the CalPERS Board of Administration approved the allocation of up to $800 million
of infrastructure investments in California over the next three years. CalPERS recognizes that focusing on
California’s infrastructure will not only add value to the investment portfolio but will also stimulate
economic growth within the state. According to CalPERS Board President, Rob Feckner, the investments
will first and foremost have the goal of investment return, with a secondary priority to support “essential
community services that are crucial to continued economic development, a safe environment, and healthy
schools and communities.” 28
CalPERS will lead an outreach effort with two goals: first, to engage with key stakeholders and market
participants to broaden understanding of public policies and investment opportunities pertaining to
California infrastructure; and second, to communicate with vital state and local agencies to determine
key opportunities for investment in strategic areas in California. The effort is intended in part to build
relationships with key California agencies for the allocation of investments.
CalPERS will invest up to $5 billion of its total fund in infrastructure opportunities. Of that portion, up to
$4 billion will be directed to U.S. investments, of which up to 20 percent is proposed for investment in
California, equivalent to a maximum of $800 million. CalPERS strategy in infrastructure targets investments
of over $150 million in primarily “defensive” assets with minimal competition, healthy returns, little risk and
strong credit. The three year time horizon table illustrates both the target and highest infrastructure
investment amounts in California.
Infrastructure Portfolio: 3-year Time Horizon1
Portfolio Target Portfolio Maximum
Total U.S. Investments (in millions) $3,000 $4,000
Total California Investment2 (in millions) $600 $800
Number of California Transactions3 2-4 2-5
1 CalPERS Investment Committee Meeting, September 12, 20112 California at 20 percent of U.S. Portfolio Target and Maximum 3 Assumes average transaction size of $150-300 million, consistent with Strategic Plan
CalPERS will invest in both private and public infrastructure in areas including transportation, energy,
natural resources, and water.

CalPERS for California Annual Report 2011 | 23
Conclusion
Institutional investors like CalPERS play an important role
in sustaining and growing all economies, providing the
capital that companies and other investment recipients
need to survive and thrive. CalPERS provides significant
ancillary benefits to California as a result of the breadth
and scale of its investments in the state.
CalPERS invests $19 billion (8.2 percent) of its
$237.5 billion in assets in California, including in
companies, properties and projects located in the state’s
underserved communities. The capital provided by
CalPERS is an essential support in all the areas in which
the fund invests.
CalPERS will continue to pursue California-based
investment opportunities grounded in the historic strength
of the state economy, seeking attractive risk-adjusted
financial returns and the ancillary benefits they provide. The
CalPERS for California report demonstrates CalPERS ongoing
commitment to rigorously track and report the results of
these investments.

24 | CalPERS for California Annual Report 2011
CalPERS Public Equity Investments in California
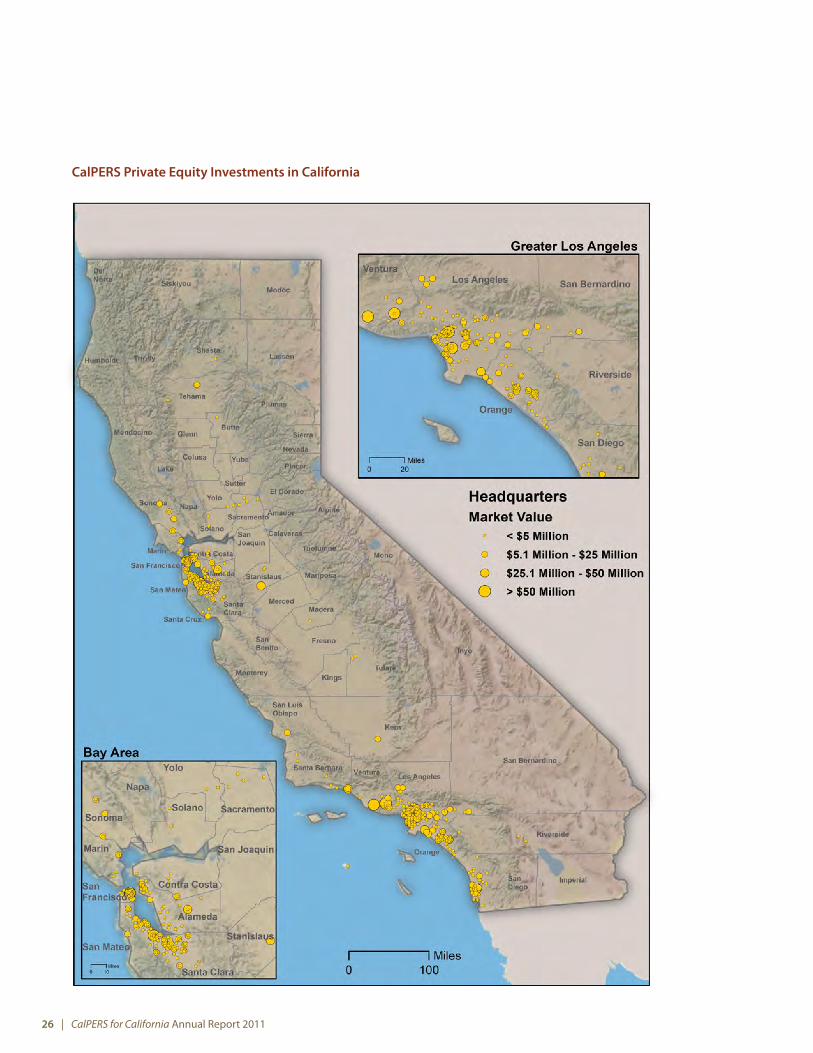
Location of CalPERS Investments in California*
* These maps only contain information on CalPERS investments headquartered in California.

CalPERS for California Annual Report 2011 | 25
CalPERS Fixed Income Investments in California
26 | CalPERS for California Annual Report 2011
CalPERS Private Equity Investments in California

CalPERS for California Annual Report 2011 | 27
CalPERS Real Estate Investments in California

28 | CalPERS for California Annual Report 2011
Endnotes
1 CalPERS Facts At A Glance, available at www.calpers.ca.gov/eip-docs/about/facts/investme.pdf.
2 CalPERS has made corporate bond investments in 46 Califor-nia-headquartered companies. Of the 46 companies, 11 have received direct investments from CalPERS and 40 have received investment indirectly through CalPERS external managers, with 5 companies receiving investments both directly and indirectly. The jobs estimate for fixed income is based only on the 11 companies receiving direct investments from CalPERS. The average size of these investments is $32 million. The average size of external manager corporate bond investments in California companies is $0.9 million.
Six of the 11 companies that received direct corporate bond investment from CalPERS are also part of CalPERS Public Equity portfolio. Job estimates cannot be combined as this would constitute double counting of six large companies.
3 Bureau of Labor Statistics. As of June 30, 2011, California’s workforce included 14.1 million workers.
4 The capital that CalPERS invests in California is usually not explicitly directed to the state, but is the consequence of a typical institutional investment process weighing the financial merits of particular companies, properties and projects, regardless of location. The size and dynamism of California’s economy are the primary drivers of CalPERS significant exposure to local communities and the related benefits that this brings, like job creation.
The research methods in this report are fully documented in footnotes. The difficulty of directly attributing ancillary benefits to CalPERS is especially notable and explains why public market and private market investments are discussed separately in CalPERS for California.
The data in this report offers a snapshot of CalPERS investments and has been analyzed by Pacific Community Ventures (PCV), a third-party research organization.
5 U.S. Bureau of Economic Analysis, Regional Economic Accounts, available at www.bea.gov/regional/index.htm.
6 The World Factbook available at www.cia.gov/library/publications/the-world-factbook/index.html.
7 CNNMoney, Fortune 500 and Fortune 500 Global, available at http://money.cnn.com/magazines/fortune/fortune500/2011.
8 Private Equity Growth Council, ‘Private equity-backed compa-nies employ more than six million Americans, PEC report finds’, May 4, 2010, available at www.pegcc.org.
9 U.S. Census Bureau, available at www.census.gov/foreign-trade/statistics/state/data/ca.html.
10 The analysis is based on a three percent sample of all non-California headquartered companies (n=273). Assumptions about the entire portfolio should therefore be considered illustrative, but not conclusive. The employment assumption for California-headquartered public companies (that employees are spread evenly at all facilities) likely underestimates the actual number of California employees, since more employees are typically located in facilities at, or closer to, a company’s headquarters. The same analysis would likely significantly overestimate the number of California employees of companies headquartered elsewhere – a problem compounded by the smaller sample size and larger number of companies.
11 Forbes’ most innovative global companies list can be found at http://www.forbes.com/special-features/innovative-companies.html. Forbes uses the Innovation Premium to compile the lists of the World’s Most Innovative Companies. It is calculated first by projecting a company’s income (cash flows, in this case) from existing businesses, plus anticipated growth from those businesses, and looks at the net present value (NPV) of those cash flows. The NPV of cash flows from existing businesses is compared with a current market capitalization: Companies with a current market cap above the NPV of cash flows have an innovation premium built into their stock. A more detailed explanation of this work around innovative companies and leaders can be found in the book, “The Innovator’s DNA” (Harvard Business Press, 2011), written with Harvard Business School professor Clayton Christensen.
12 CalPERS is invested in 16 of the 20 most innovative compa-nies. The 16 companies are: Apple, Google, Amazon.com, Celgene, FMC Technologies, Hidustan Unilever, Infosys, Keyence, Monsanto, Natura Cosmeticos, Nidec, Nintendo, Pernod Ricard, Reckitt Benckiser, Starbucks and Terumo.
13 The fixed-income asset class includes 5 distinct investment programs. Only publicly available data was used to conduct analysis for this asset class, which was available only for companies that issued corporate bonds. According to the state of domicile obtained from Hoovers Inc., 16 corporate bond issuers (and $810 million in investments) are considered California companies.

CalPERS for California Annual Report 2011 | 29
14 CalPERS has made corporate bond investments in 46 California-headquartered companies. Of the 46 companies, 11 have received direct investments from CalPERS and 40 have received investment indirectly through CalPERS external managers, with five companies receiving investments both directly and indirectly. The jobs estimate for fixed income is based only on the 11 companies receiving direct investments from CalPERS. The average size of these investments is $32 million. The average size of external manager corporate bond investments in California companies is $0.9 million.
Six of the 11 companies that received direct corporate bond investment from CalPERS are also part of CalPERS Public Equity portfolio. Job estimates cannot be combined as this would constitute double counting of six large companies.
15 The classification of a California-based structured security investment was derived using security composition data from Bloomberg. The total structured security market value for each of CalPERS investments was multiplied by the percentage composition of the structured security based in California.
16 The analysis is based on a 10 percent sample of all non-Cali-fornia headquartered companies (n=35). Assumptions about the entire portfolio should therefore be considered illustrative, but not conclusive. The employment assumption for California-headquartered public companies (that employees are spread evenly at all facilities) likely underestimates the actual number of California employees, since more employees are typically located in facilities at, or closer to, a company’s headquarters. The same analysis would likely significantly overestimate the number of California employees of companies headquartered elsewhere – a problem compounded by the smaller sample size and larger number of companies.
17 To determine the dollar amounts invested in these areas, the market value of each investment is attributed to the ZIP code provided for a given company, property or project. Dollars invested in all ZIP codes that match the given criteria are summed and reported as a percentage of the total market value for each asset class invested in California.
18 Low- to Moderate-Income (LMI) Areas are predominantly (50 percent or more) composed of LMI residents (38 percent of U.S. ZIP codes fall into this category). A census tract is determined to be LMI based on the following criteria:
• Median income of the tract is at or below 80 percent of the metropolitan statistical area median or below 80 percent of the statewide, non-metropolitan area median income.
• At least 20 percent of the population lives in poverty.
• The unemployment rate is at least 1.5 times the national average (based on US Census Bureau 2006-10 American Community Survey data, consistent with research on the California Initiative; 1.5 times the 2006-10 national average of 6.8 percent is 10.2 percent).
See the Milken Institute Center for Capital Access and Job Formation for extensive literature on the lack of access to capital in LMI communities, at www.milken institute.org.
19 High unemployment areas are defined by the State of California Employment Training Panel as being 15 percent higher than the California average. At June 30, 2011, the California average unemployment rate was 12.1 percent; therefore any ZIP code with an unemployment rate above 13.9 percent is considered a High Unemployment Area.
20 High Minority Areas are defined as ZIP codes in which the percentage of the minority population is higher than the median percentage of the minority population in all California ZIP codes (above 25 percent). See ‘MBDA Study Finds Capital Access Remains Major Barrier to Success for Minority-Owned Firms’ for more information on access to capital in minority communities. US Department of Commerce Minority Business Development Agency, January 29, 2010, available at www.mbda.gov/pressroom/press-releases/mbda-study-finds-capital-access-remains-major-barrier-success-minority-owne. Accord-ing to the MBDA study, minority-owned firms receive fewer loans and smaller equity investments than non-minority owned firms, even when controlling for firm size.
21 Rural areas are defined as ZIP codes in which the percentage of the rural population is higher than the median percentage of the rural population in all California ZIP codes (above 6 percent). See ‘Advancing Rural America’, U.S. Small Business Administra-tion Office of Advocacy, available at www.sba.gov/advo/research/rural_sb.html for more information on access to capital in rural areas. According to the SBA, ‘rural businesses’ access to capital has historically been limited and may be constrained further as bank mergers replace community banks with larger entities that are less interested in non-credit card small-sized loans’.
22 The boundaries of the Central Business Districts (CBD) of Los Angeles, Oakland, San Diego and San Francisco were determined using GIS technology. All ZIP codes that overlapped the CBD were included in this analysis. There are a total of 20 ZIP codes that overlap the 4 CBDs. 17 (85 percent) of those ZIP codes are predominantly comprised of LMI census tracts.

30 | CalPERS for California Annual Report 2011
23 This includes CalPERS private equity direct investments, California Emerging Ventures and partnership investments in California. This number may differ from total portfolio numbers in other CalPERS reports due to varying standards for defining a California company.
24 Estimated jobs supported by CalPERS real estate investments in California are determined using the IMPLAN Version 3.0 economic multiplier model software package. IMPLAN is used by hundreds of government agencies, colleges and universities, non-profit organizations, corporations, and business development and community planning organizations for analyzing economic impacts (for more information visit www.implan.com).
To determine jobs supported by CalPERS California real estate investments the IMPLAN model examines the State of California as the geographic area of study, capturing and accounting for economic benefits resulting from CalPERS real estate invest-ments statewide. Methodologies specific to property type and development phase were used in determining the input values for the IMPLAN model to best capture the economic impacts resulting from the construction/operation of various property types. The methodologies are described below.
Construction of Residential and Non-Residential PropertiesTotal net asset values for residential and non-residential properties including apartments, single-family housing, senior housing, hotel, office, and retail under the predevelopment, development, and redevelopment categories were uploaded directly into the IMPLAN model for analysis where they are matched with construction activities.
Sales of Goods and Services at Non-Residential Properties with Current OccupantsProperty square footage data for retail properties with current occupants is multiplied by industry data on retail sales. Property square footage data for other non-residential properties with current occupants including in the office and industrial sectors are multiplied by property-specific industry data on rental income. Total rental income amounts are subsequently divided by a rent-to-revenue ratio to derive total sales of goods/services for each tenant property. Total sales of goods and services at tenant properties are then uploaded into the IMPLAN model for analysis where they match industry activities.
Rental/Leasing of Non-Residential Properties with Current OccupantsProperty square footage data for non-residential properties with current occupants including office, industrial, and retail are multiplied by industry data on property-specific rental income. The total rental income amounts are uploaded directly into the IMPLAN model for analysis where they match with rental, leasing, and property management activities.
As with other asset classes, this analysis does not imply that the jobs created and sustained by CalPERS investments in real estate are directly attributable to the System. Rather, it is an estimate of employment directly related to the properties in question, for which CalPERS investments play an important enabling role.
Estimated California Jobs from CalPERS California Real Estate Investments
Construction of Residential and Non-Residential Properties 19,000
Sales of Goods and Services at Non-Residential Properties with Current Occupants 78,000
Rental/Leasing of Non-Residential Properties with Current Occupants 3,000
Total Estimated Jobs in California 100,000

CalPERS for California Annual Report 2011 | 31
The following table outlines rental income per square foot, retail sales per square foot, rent-to-revenue ratios, and IMPLAN industry codes used in this analysis.
Industry Rental Income per
Square Foot
Retail Sales per Square
Foot
Rent-to-Revenue
Ratio
IMPlAn Industry Codes and descriptions
Retail $28.64 $386.43 — 34: Construction of new nonresidential commercial and health care structures 360: Real estate establishments 329: Retail Stores - General merchandise
Office $23.14 — 3.77% 34: Construction of new nonresidential commercial and health care structures 360: Real estate establishments 367-380: Various professional services (legal, accounting, architectural, technical, scientific, etc)
Apt, Housing — — — 37: Construction of new residential permanent site single - and multi-family structures
Hotel — — — 34: Construction of new nonresidential commercial and health care structures
Industrial $6.27 — 2.10% 360: Real estate establishments 319: Wholesale trade business
Sources: Cassidy Turley BT Commercial Research, IBIS World, and ICSC
25 CalPERS California real estate projects in the development and construction phase indirectly support workers across the state through the purchase of goods and services needed for construction of these projects and through the personal consumption by construction workers tasked to these particular projects.
26 CalPERS California investments in income-generating real estate properties directly support tenant businesses through the provision of critical infrastructure and operating space. Additionally, tenant businesses indirectly support workers across the state through the purchase of goods and services needed for day-to-day business operations and through the personal consumption by workers at their businesses of household purchases.
27 California infrastructure supports an estimated 2,200 jobs statewide. This estimate is derived from the IMPLAN Version 3.0 economic multiplier model software package. For California infrastructure projects stage of development, land acquisition costs, and develop-ment costs were examined. For each project net asset values less land development costs were inputted directly into the IMPLAN model using IMPLAN Industry Code 36: Construction of other new non-residential structures.
28 CalPERS Press Release, CalPERS Targets $800 Million for Investment in California Infrastructure, September 12, 2011, available at http://www.calpers.ca.gov/index.jsp?bc=/about/press/pr-2011/sept/ca-infrastructure.xml


CalPERS Profile
The California Public Employees’ Retirement System (CalPERS) is the nation’s largest public pension fund
with assets of approximately $236 billion.
Headquartered in Sacramento, CalPERS provides retirement and health benefit services to more than
1.6 million members and more than 3,000 school and public employers. The System also operates 8
Regional Offices located in Fresno, Glendale, Orange, Sacramento, San Diego, San Bernardino, San Jose,
and Walnut Creek. Led by a 13-member Board of Administration, consisting of member-elected, appoint-
ed, and ex officio members, CalPERS membership consists of approximately 1.1 million active and inactive
members and more than 500,000 retirees, beneficiaries, and survivors from State, school and public
agencies.
Established by legislation in 1931, the System became operational in 1932 for the purpose of providing a
secure retirement to State employees who dedicate their careers to public service. In 1939, new legislation
allowed public agency and classified school employees to join the System for retirement benefits. CalPERS
began administering health benefits for State employees in 1962, and 5 years later, public agencies joined the
Health Program on a contract basis.
A defined benefit retirement plan, CalPERS provides benefits based on a member’s years of service,
age, and highest compensation. In addition, benefits are provided for disability and death.
Today CalPERS offers additional programs, including a deferred compensation retirement savings plan,
member education services, and an employer trust for post-retirement benefits. Learn more at our website
at www.calpers.ca.gov.

California Public Employees’ Retirement System
400 Q Street | Sacramento, CA 95811
www.calpers.ca.gov
For more information, please contact:
Pacific Community Ventures | www.pacificcommunityventures.org
May 2012 5.1


