CALIFORNIA STATE TEACHERS’ RETIREMENT SYSTEM SEMIANNUAL NEWSLETTER FOR CalSTRS BENEFIT RECIPIENTS Also inside: INSIDE 2 Under the Dome 3 Pay Dates for 2014 4 Understanding Your 1099-R 5 Stay Connected With CalSTRS on Social Media 6 Short-Term Returns Not Enough to Cure Underfunding 7 myCalSTRS Is Your CalSTRS 2013 Summary Report to Members continued on page 8 CalSTRS Benefit Payments Boost California’s Economy By Dana Dillon, Teachers’ Retirement Board Chair Retired members and their beneficiaries rely on income from their CalSTRS pensions, but they’re not the only ones. Communities throughout the state also realize an economic benefit from the state’s 230,000 retired educators. A new economic impact study finds that CalSTRS retirement benefit payments generate $11 billion in economic activity, support more than 92,800 jobs and create about $1.2 billion in tax payments to state and local governments through income, sales and corporate profit taxes. To put these findings in perspective, the total economic impact of CalSTRS retirement benefits is equivalent to California’s wine growing and production industry. The study was commissioned by CalSTRS and prepared by the Business Forecasting Center of the University of the Pacific Eberhardt School of Business. It measures the impact that CalSTRS benefit payments have on California’s labor income, employment, economic output and tax revenue generation. The study’s findings are based on $9.2 billion in WINTER 2014 The total economic impact of CalSTRS retirement benefits is equivalent to California’s wine growing and production industry.
Transcript
C a l i f o r n i a s tat e t e a C h e r s ’ r e t i r e m e n t s y s t e m
S e m i A n n u A l n e w S l e t t e r f o r C a l S t r S b e n e f i t r e C i p i e n t S
also inside:
i n s i D e
2 Under the Dome
3 Pay Dates for 2014
4 Understanding Your 1099-R
5 Stay Connected With CalSTRS on Social Media
6 Short-Term Returns Not Enough to Cure Underfunding
Retired members and their beneficiaries rely on income from their CalSTRS pensions, but they’re not the only ones. Communities throughout the state also realize an economic benefit from the state’s 230,000 retired educators.
A new economic impact study finds that CalSTRS retirement benefit payments generate $11 billion in economic activity, support more than 92,800 jobs and create about $1.2 billion in tax payments to state and local governments through income, sales and corporate profit taxes.
To put these findings in perspective, the total economic impact of CalSTRS retirement benefits is equivalent to California’s wine growing and production industry.
The study was commissioned by CalSTRS and prepared by the Business Forecasting Center of the University of the Pacific Eberhardt School of Business. It measures the impact that CalSTRS benefit payments have on California’s labor income, employment, economic output and tax revenue generation. The study’s findings are based on $9.2 billion in
w i n t e r 2 0 1 4
The total economic impact of CalSTRS retirement benefits is equivalent to California’s wine growing and production industry.
CalSTRS Mission: Securing the financial future and sustaining the trust of California’s educators
Teachers’ Retirement Board Dana Dillon, Chair Harry Keiley, Vice Chair Michael Cohen John Chiang Sharon Hendricks Michael A.Lawson Bill LockyerPaul Rosenstiel Tom Torlakson Thomas Unterman
Jack Ehnes Chief Executive Officer
Christopher J. Ailman Chief Investment Officer
David Lindgren Editor
Ngan Bui Designer
Statements in this publication are general and the Teachers’ Retirement Law is complex and specific. If a conflict arises between information contained in this publication and the law, any decisions will be based on the law.
CalSTRS Retired Educator is published twice a year for retired members and benefit recipients of the California State Teachers’ Retirement System. Send your comments or suggestions to: Editor, Communications CalSTRS P.O. Box 15275 MS 34 Sacramento, CA 95851
2 • CalSTRS Retired Educator • Winter 2014
printed on recycled paper
Among the bills signed by the Governor last year was legislation to clarify existing laws, including the California Public Employees’ Pension Reform Act of 2013. Recent changes include:
Annualized Pay for Postretirement EmploymentThis change clarifies that the rate of pay for retired member and retired participant activities is annualized to ensure that it equals the annualized rate of pay of other active employees performing comparable duties. Assembly Bill 1381, Chapter 559, Statutes of 2013.
Postretirement Compensation Limits Apply to Tax-Deferred Employer Contributions but Not Reimbursable ExpensesCompensation limits for retired member and retired participant activities now apply to employer contributions to
tax-sheltered annuities, tax-deferred retirement plans, insurance plans and other tax-favored products. Additionally, certain reimbursable expenses are now excluded from the application of the post-retirement compensation limits. Assembly Bill 1381, Chapter 559, Statutes of 2013.
Retirement Incentive Program Notification Prior to Postretirement EmploymentEmployers are now required to advise retirees who received additional service credit from the Retirement Incentive Program that they will lose the additional service credit if they return to work within five years of retirement with the employer that provided the incentive. Assembly Bill 1379, Chapter 558, Statutes of 2013.
For more information about these bills and others, visit CalSTRS.com/legislation.
Under the Dome: 2013 Legislation
403bCompare.comMake more of your money count. Compare fees charged by different mutual funds and insurance products at 403bCompare.com.
Pay Dates for 2014The charts below show the pay dates for CalSTRS benefits checks in 2014. Payments are made in arrears, so the payment you receive each month is the payment for the prior month’s benefit. The State Controller's Office issues the payments and determines the check mailing and direct deposit dates.
Check Mailing Date
Benefit Month Southern California and Out of State*
Northern California** Direct Deposit Date
January 1/30/2014 1/31/2014 1/31/2014
February 2/27/2014 2/28/2014 2/28/2014
March 3/28/2014 3/28/2014 4/1/2014
April 4/29/2014 4/30/2014 5/1/2014
May 5/29/2014 5/30/2014 5/30/2014
June 6/27/2014 6/30/2014 7/1/2014
July 7/30/2014 7/31/2014 8/1/2014
August 8/28/2014 8/29/2014 8/29/2014
September 9/29/2014 9/30/2014 10/1/2014
October 10/30/2014 10/31/2014 10/31/2014
November 11/26/2014 11/26/2014 12/1/2014
December 12/29/2014 12/30/2014 1/2/2015
Check Mailing Date
Benefit Month Southern California and Out of State*
Northern California** Direct Deposit Date
March 3/28/2014 3/28/2014 4/1/2014
June 6/27/2014 6/30/2014 7/1/2014
September 9/29/2014 9/30/2014 10/1/2014
December 12/29/2014 12/30/2014 1/2/2015
2014 Pay Dates
2014 Supplemental Pay Dates
Is Your Payment Late?
Paper ChecksIf your retirement check is mailed to you and you have not received it by the fifth business day of the month, contact CalSTRS at 800-228-5453.
Direct DepositIf you have direct deposit, your financial institution has until the close of the direct deposit date to place the funds in your account. Please contact your financial institution to find out what time it places your funds into your account.
*ZIP codes beginning with 900-930
**ZIP codes beginning with 931-961
4 • CalSTRS Retired Educator • Winter 2014
You should receive your IRS Form 1099-R for tax year 2013 in the mail by early February. The following questions and answers will help you read and understand your form.
What payments are included on my 1099-R?Your 1099-R lists the total amounts CalSTRS paid you in 2013—payments issued from January 1, 2013, through December 31, 2013.
Why do I have more than one 1099-R?If you received more than one type of payment from CalSTRS in 2013, such as your monthly benefit and a lump-sum payment, you received a 1099-R for each.
A small number of retired members also receive W2 forms for the portion of their CalSTRS benefit that exceeds the annual limit set by Internal Revenue Code section 415(b). In addition, you may receive 1099-Rs for your other retirement income, including IRAs.
What if I repaid an overpayment?Members occasionally receive an overpayment of their monthly CalSTRS benefit that they must pay back. When the overpayment and repayment occurred determines how your income gets reported.
Repaying funds reported as income in a previous tax year may mean you can recover taxes you paid on that income. If you repay previous years’ over-payments, CalSTRS normally sends you a letter acknowledging the repayment, in addition to your 1099-R. For example, if you received an overpayment in 2012 and repaid us in 2013, you will receive a letter acknowledging the repayment. Keep this letter for your 2013 tax return. Consult a professional tax adviser for additional information.
If you received an overpayment in 2013 and repaid it in 2013, the Gross Distribution box on your 1099-R showing the total amount you received in 2013 will be adjusted accordingly, so you will not receive a letter from us.
For more information, see IRS Publication 525, Taxable and Nontaxable Income, at irs.gov.
What if I did not receive my 1099-R?Your 1099-R was mailed by the end of January to the mailing address on file with CalSTRS as of December 24, 2013. You can print a duplicate 1099-R from your myCalSTRS account at myCalSTRS.com. You also can call, fax or email us to request a copy.
What if I do not understand my 1099-R?To start, you will find descriptions for all of the boxes on the back of your 1099-R. You can check out the FAQs available at CalSTRS.com/tax-information. You also can contact the California Franchise Tax Board and IRS. To reach the FTB directly, go to ftb.ca.gov or call 800-852-5711. If you have questions for the IRS, visit irs.gov or call 800-829-1040.
Why did the code in box 7 change from prior years?Previously, the code in box 7 defaulted to 7 for most benefit types. This year, the code for members under age 59½ was corrected to 2, and the code for surviving beneficiaries is now 4, per IRS requirements.
For more information, visit CalSTRS.com/ tax-information and select Form 1099-R.
Understanding Your 1099-R
C A L I F O R N I A S TAT E T E A C H E R S ’ R E T I R E M E N T S Y S T E M
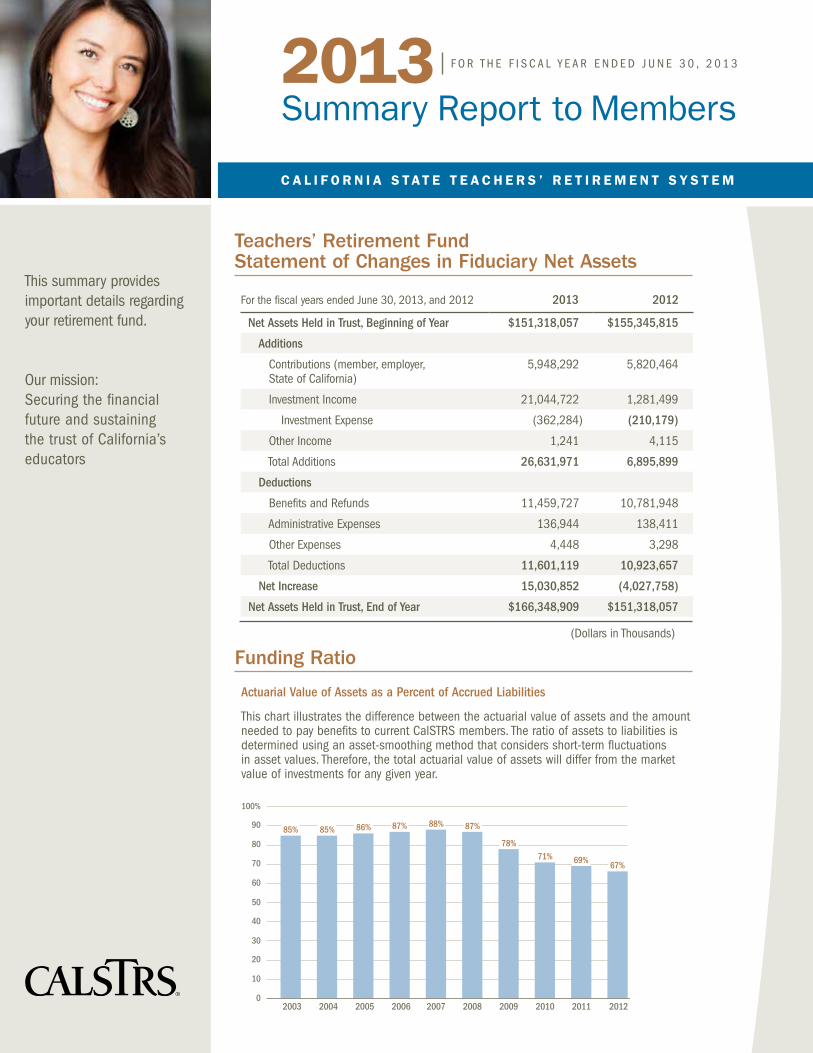
This summary provides important details regarding your retirement fund.
Our mission:Securing the financial future and sustaining the trust of California’s educators
2013 Summary Report to Members
F O R T H E F I S C A L Y E A R E N D E D J U N E 3 0 , 2 0 1 3
(Dollars in Thousands)
Teachers’ Retirement Fund Statement of Changes in Fiduciary Net Assets
2009 2010 20112003 2004 2005 2006 2007 2008
100%
90
80
70
60
50
40
30
20
10
0
85% 85% 86% 88%
78%71% 69%
87%87%
2012
67%
Actuarial Value of Assets as a Percent of Accrued Liabilities
This chart illustrates the difference between the actuarial value of assets and the amount needed to pay benefits to current CalSTRS members. The ratio of assets to liabilities is determined using an asset-smoothing method that considers short-term fluctuations in asset values. Therefore, the total actuarial value of assets will differ from the market value of investments for any given year.
Funding Ratio
For the fiscal years ended June 30, 2013, and 2012 2013 2012
Net Assets Held in Trust, Beginning of Year $151,318,057 $155,345,815
Additions
Contributions (member, employer, State of California)
5,948,292 5,820,464
Investment Income 21,044,722 1,281,499
Investment Expense (362,284) (210,179)
Other Income 1,241 4,115
Total Additions 26,631,971 6,895,899
Deductions
Benefits and Refunds 11,459,727 10,781,948
Administrative Expenses 136,944 138,411
Other Expenses 4,448 3,298
Total Deductions 11,601,119 10,923,657
Net Increase 15,030,852 (4,027,758)
Net Assets Held in Trust, End of Year $166,348,909 $151,318,057
Get to know us on social media. It’s a great way to keep up on the latest news and share ideas. Check us out on Facebook, Twitter, Google+, YouTube, LinkedIn and Pinterest.
Start at CalSTRS.com/stay-connected or
Like our page and join the conversation. facebook.com/CalSTRS
Follow the official Twitter feed of CalSTRS.#CorpGov #ESG #Pension #Teacher #JackEhneshttps://twitter.com/CalSTRS
Connect and share with us. CalSTRS.com/stay-connected
Follow CalSTRS for corporate news. linkedin.com/company/CalSTRS
Watch the myCalSTRS channel. youtube.com/user/myCalSTRS
Find your pinspiration. pinterest.com/CalSTRS
Winter 2014 • CalSTRS Retired Educator • 5
Good to Hear From YouIn the last issue of Retired Educator, we put out a call for real teachers to photograph and feature in our member publications. Our thanks to all of you who responded. Teachers are the heart of CalSTRS, and we look forward to seeing more of you in our publications.
We are now working on logistics and will follow up with an email to everyone we heard from.
If you have questions, feel free to email Veronica Espinoza at [email protected].
Short-Term Returns Not Enough to Cure UnderfundingBy Jack Ehnes, CalSTRS CEO
The CalSTRS Defined Benefit Program is sustainable when funding is secured through suffi-cient state, employer and employee contributions, investment earnings are realized, and contributions can be adjusted appropriately. That last part is very important.
Historically, contributions to CalSTRS set in state law have not been adjusted to address funding deficiencies, which has, in part, led to the current $71 billion funding shortfall. Employee contribution rates have not been adjusted since 1972, employer rates have not changed since 1990, and the state’s rates are less than they were in 1997. Because the Teachers’ Retirement Board does not have the authority to adjust contributions, CalSTRS must rely on the Legislature and Governor to take action.
We are confident the long-term health of the fund can be restored with the appropriate action. Without it, the costs and risks to the state General Fund increase exponentially. We estimate that for
In the last three years, the CalSTRS Investment Portfolio has experienced significant market volatility. In the 2010–11 fiscal year, the Teachers’ Retirement Fund catapulted to a 23.1 percent investment return. The following year, investment returns plummeted to 1.8 percent and then rebounded up to 13.8 percent this year. It’s good news that we’ve significantly exceeded our 7.5 percent invest-ment assumption over three years, but that still doesn’t change current projections of depleting our assets in roughly 30 years.
Great returns that weather the turbulence of the market validate a team of professionals who are dedicated to their fiduciary responsibility. However, investment returns, whether weak or strong, lack the isolated muscle to recover from a decade of meager market conditions. Our estimates show that without contribution increases, CalSTRS would need to achieve 10 percent returns annually for the next 30 years to pay down our unfunded liability.
Winter 2014 • CalSTRS Retired Educator • 7
myCalSTRS Is Your CalSTRSIf you haven’t activated your myCalSTRS account yet, you are missing out on a convenient way to access and manage your account information. With myCalSTRS, you can:
View your:
• 1099-R statements
• Monthly benefit statements
Update your:
• Tax withholding information
• Bank account for direct deposit
• One-Time Death Benefit recipient
• Address and contact information
• Delivery preference for publications
Register TodayStart using myCalSTRS today at myCalSTRS.com. View the self-paced, interactive registration guide. Registration is easy and provides immediate and secure access.
every day that goes by without a plan to close the funding gap, the costs soar by $22 million.
Since 2006, CalSTRS has been calling for a review of contribution rates. We have been working with state policy makers and our stakeholders to develop a funding plan. The solution is a gradual and predictable increase in contribution rates.
In response to Senate Concurrent Resolution 105, we submitted a report titled Sustaining Retirement Security for Future Generations: Funding the California State Teachers’ Retirement System, which identifies several funding options, including one that is strongly recommended by the Legislative Analyst’s Office. To read the report, visit CalSTRS.com/funding.
WRITE CalStrSP .O. Box 15275Sacramento, CA 95851-0275
VISIT member Services100 Waterfront PlaceWest Sacramento, CA 95605
Find your nearest CalStrS office at CalStrS.com/localoffices
FAX 916-414-5040
CalSTRS Resources
STAY CONNECTED
CalSTRS Benefit Payments Boost California’s Economy continued from page 1
ongoing monthly and quarterly benefit payments CalSTRS issued during the 2011–12 fiscal year.
The study points out that most of the benefit dollars are spent in the communities where retired educators live, offering a direct boost to local supermarkets, restaurants, department stores, automotive services and real estate. California’s rural regions benefit the most relative to the total regional economy. In addition, the study notes that for each dollar the state contributes to CalSTRS, the state government receives 50 cents in return via taxes.
You can find the full report at CalSTRS.com/economic-impact-study.
C A L I F O R N I A S TAT E T E A C H E R S ’ R E T I R E M E N T S Y S T E M
This summary provides important details regarding your retirement fund.
Our mission:Securing the financial future and sustaining the trust of California’s educators
2013 Summary Report to Members
F O R T H E F I S C A L Y E A R E N D E D J U N E 3 0 , 2 0 1 3
(Dollars in Thousands)
Teachers’ Retirement Fund Statement of Changes in Fiduciary Net Assets
2009 2010 20112003 2004 2005 2006 2007 2008
100%
90
80
70
60
50
40
30
20
10
0
85% 85% 86% 88%
78%71% 69%
87%87%
2012
67%
Actuarial Value of Assets as a Percent of Accrued Liabilities
This chart illustrates the difference between the actuarial value of assets and the amount needed to pay benefits to current CalSTRS members. The ratio of assets to liabilities is determined using an asset-smoothing method that considers short-term fluctuations in asset values. Therefore, the total actuarial value of assets will differ from the market value of investments for any given year.
Funding Ratio
For the fiscal years ended June 30, 2013, and 2012 2013 2012
Net Assets Held in Trust, Beginning of Year $151,318,057 $155,345,815
Additions
Contributions (member, employer, State of California)
5,948,292 5,820,464
Investment Income 21,044,722 1,281,499
Investment Expense (362,284) (210,179)
Other Income 1,241 4,115
Total Additions 26,631,971 6,895,899
Deductions
Benefits and Refunds 11,459,727 10,781,948
Administrative Expenses 136,944 138,411
Other Expenses 4,448 3,298
Total Deductions 11,601,119 10,923,657
Net Increase 15,030,852 (4,027,758)
Net Assets Held in Trust, End of Year $166,348,909 $151,318,057
2 CalSTRS Summary Report 2013
Membership in 2013Fiscal Year 2013 2012
Active Members 416,643 421,499
Inactive Members 182,576 178,655
Total 599,219 600,154
Service Retirements 236,487 230,278
Disability Benefits 9,374 9,036
Survivors Benefits 23,413 22,724
Total 269,274 262,038
Total Member and Beneficiaries
868,493 862,192
Total Benefit Payments $11.46 billion $10.79 billion
Members Retiring in 2013Fiscal Year 2013 2012
Number Retiring 11,645 13,619
Median Age 62.2 62.0
Median Years of Service 24.9 24.4
Average Member-Only Benefit $3,980 $3,936
Average Active Member Age and Years of Service
Fiscal Year 2013 2012
Average Age 45.6 45.5
Average Years of Service 12.2 11.9
Average Annual Salary $65,571 $64,743
Global Equity53.6%
Fixed Income16.8%
Real Estate13.8%
PrivateEquity13.2%
Overlay0.6%
In�ationSensitive
0.4%Cash1.6%
Global Equity53.0%
Fixed Income17.6%
Real Estate12.1%
PrivateEquity14.8%
Absolute Return1.8%
Liquidity0.7%
30-35 Years2,150
35-40 Years1,522
20-25 Years1,760
25-30 Years1,817
5-10 Years1,017
15-20 Years1,678
10-15 Years1,298
0-5 Years132271
Years of Service at Retirement in 2013
Your reward—a secure retirement. Our reward—getting you there.
13.8% 13.4% 12.6% 12.7% 3.7% 5.1% 7.5% 7.5%
CalSTRS Benchmarks
0
3
6
9
12
15
1 Year 3 Years 5 Years 10 Years
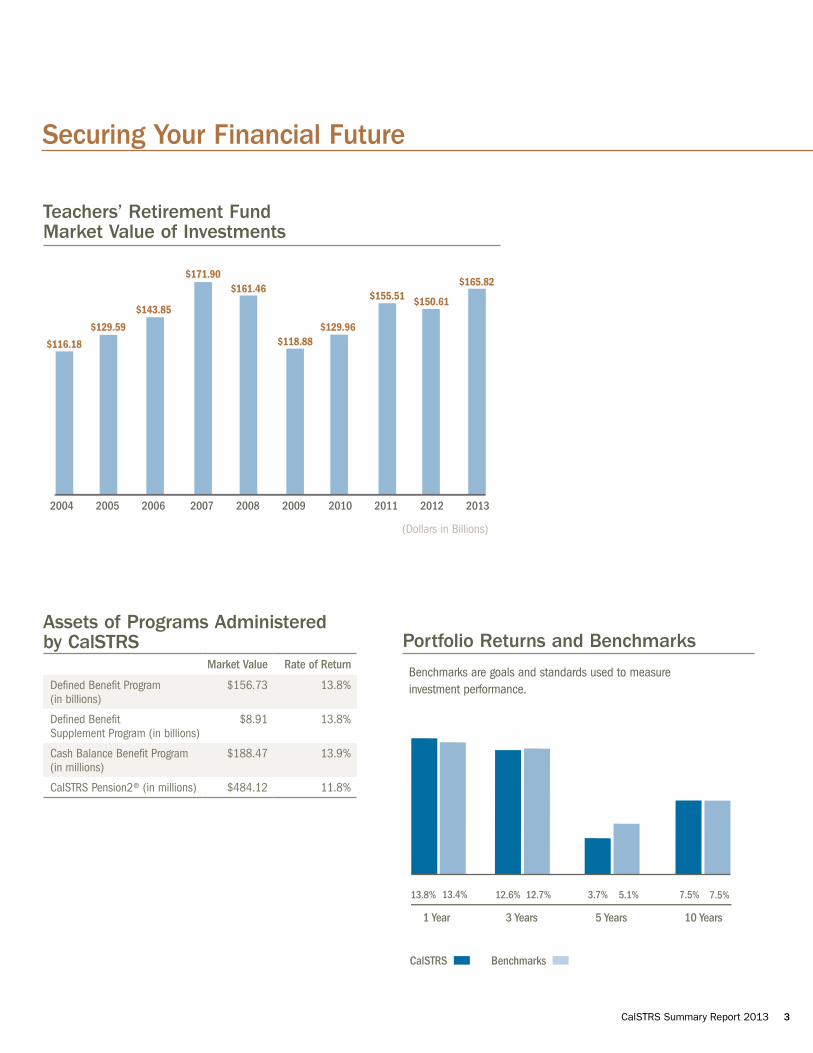
Portfolio Returns and Benchmarks
Benchmarks are goals and standards used to measure investment performance.
Securing Your Financial Future
CalSTRS Summary Report 2013 3
Assets of Programs Administered by CalSTRS
Market Value Rate of Return
Defined Benefit Program (in billions)
$156.73 13.8%
Defined Benefit Supplement Program (in billions)
$8.91 13.8%
Cash Balance Benefit Program (in millions)
$188.47 13.9%
CalSTRS Pension2® (in millions) $484.12 11.8%
(Dollars in Billions)
2004 2005 2006 2007 2008 2009 2010 2011 2012 2013
$129.96
$155.51 $150.61
$116.18
$129.59
$143.85
$171.90$161.46
$118.88
$165.82
Teachers’ Retirement Fund Market Value of Investments
Securing Your Financial Future continued
4 CalSTRS Summary Report 2013
CalSTRS Resources
CalSTRS.comClick Contact Us to email
myCalSTRS.com
403bCompare.com
Pension2.com
800-228-5453 7 a.m. to 6 p.m.Monday through Friday888-394-2060CalSTRS Pension2® Personal Wealth Plan855-844-2468 (toll free) Pension Abuse Reporting Hotline
CalSTRSP.O. Box 15275Sacramento, CA 95851-0275
Member Services 100 Waterfront Place West Sacramento, CA 95605
Find your nearest CalSTRS office at CalSTRS.com/localoffices
916-414-5040
STAY CONNECTED
Teachers’ Retirement Fund Asset Allocation
0 5 10 15 20 25 30 35
13.9
%
18.0
%
2.2%
19.2
%
19.1
%
2.0%
0.9%
14.
1%
10.5
%
0.3%
TotalCashOverlayIn�ationSensitive
PrivateEquity
RealEstate
FixedIncome
GlobalEquity
CalSTRS Benchmarks (the goals and standards used to measure investment performance)