21
Camosun College Parking & Transportation Demand Management Three Year Plan: 2013 - 2016 7/30/2013
Camosun College Parking &
Transportation Demand
Management Three Year
Plan: 2013 - 2016
7/30/2013
Transportation & Parking, Ancillary Services Page 1
Parking & Transportation Demand Management
Three Year Plan: 2013 – 2016
Contents Purpose ................................................................................................................................................................................ 2
Background .......................................................................................................................................................................... 2
Goals and Objectives ........................................................................................................................................................ 2
Current Situation ............................................................................................................................................................... 3
Research Results ........................................................................................................................................................... 3
Getting Here Survey, 2011..................................................................................................................................... 3
Mode Share Count, 2012 ....................................................................................................................................... 5
Rationale for Parking and TDM ................................................................................................................................. 6
What’s changed from the 2010-13 to the 2013-16 Plan? ........................................................................................ 7
Goals, Objectives, Targets and Work Plan ................................................................................................................. 8
Accountability ................................................................................................................................................................... 12
Information, Reporting & Evaluation 2013 - 2016 ................................................................................................... 12
Program Evaluation ..................................................................................................................................................... 13
Performance Indicators ......................................................................................................................................... 13
Transportation & Parking, Ancillary Services Page 2
Purpose
To provide a framework and action plan to address the expectation and demand for transportation to
and parking at Camosun College. This plan will help meet Camosun’s transportation needs for the
future by exploring, developing and implementing new options, new programs, and new ways of doing
things.
Background
The role of the Transportation and Parking department within Ancillary Services is to:
1. Provide parking management of spaces for students, employees and guests at both Camosun
College campus locations.
2. Manage demand for parking spaces for environmental and smart growth objectives.
3. Maximize revenue from parking spaces to support both the implementation of this plan and
other College priorities.
4. Promote and support alternative transportation choices for commuters to Camosun as well as
campus-to-campus travel.
This is the second three year working plan that supports the 2009 Transportation and Parking
Management Plan (see www.camosun.ca/about/transportation). The first plan ran from 2010 to 2013, the
results of which are listed in the final Transportation and Parking Implementation Project report1. This
plan will build on that work.
Camosun’s transportation and parking options must respond to changing needs and help achieve true
sustainability. Due to economic, social, and environmental shifts, our community of students and
employees are expected to rely less on automobile travel and more on alternative modes. As well,
demand for efficient alternatives is expected to increase. This is an opportunity to reshape campus
behaviours in preparation – and in support – of these shifts. This will require innovative ideas, creative
solutions and a willingness to try new approaches.
Goals and Objectives
An overarching goal of Camosun’s transportation and parking planning is to provide convenient,
environmentally responsible and affordable access to the College’s campuses. To help achieve this, and
to accommodate for future college growth, it has been recommended that parking demand and per
capita peak period trips be reduced by at least 20% (from 2009 figures)2.
The following goals are defined to guide specific actions and strategies:
1. Reduce parking demand and the total number of motor vehicles – especially SOVs – driven to
campus.
2. Increase use of alternative transportation modes to the college.
3. Provide funding for parking maintenance, alternative transportation, and other college programs.
1 http://camosun.ca/about/transportation/documents.html 2Littman, Todd. Camosun College Transportation and Parking Management Plan. 2009.
Transportation & Parking, Ancillary Services Page 3
4. Accommodate additional campus development, minimize impervious surfaces and preserve
green space3.
5. Support regional and provincial goals towards transportation demand management and
reduction of GHG emissions (help achieve BC greenhouse gas (GHG) emission reduction
targets4).
Current Situation Camosun currently has approximately 10,000 FTE students
and 1,200 staff. About 51% of these students attend
Lansdowne campus, 38% attend Interurban, and 11% attend
both campuses. Modest growth of these numbers is
expected. Interurban campus will face some particular
parking and transportation challenges brought about by a
number of developments. A new Centre of Trades Education
and Innovation is scheduled to begin construction in January
2014. As well, Student housing is planned at the Interurban
campus in the next five years. The Health and Human
Services program is planning to relocate from Lansdowne to
the Interurban campus.
Regional and global trends that will affect Camosun
transportation and parking demand include changing
demographics, rising fuel prices, shifting consumer
preferences, increasing health concerns and local/regional
efforts to improve alternative modes. As a small community
unto itself, Camosun has a role to implement policies and
programs to help support this. As stated in the College’s
2011-14 Strategic Plan, Camosun will be a leader in
environmentally sustainable practices. A comprehensive
TPM Plan will support this.
Research Results
Getting Here Survey, 2011
The Transportation and Parking (T&P) Survey obtained
information from 2,241 staff and students in October 2011.
This survey was a follow up on the first such survey
3 Ibid 4 By 2020 and for each subsequent year, the Province of BC has said that BC GHG emissions will be at least 33%
less than in 2007. By 2050 and for each subsequent year, GHG emissions will be at least 80% less than in 2007 (BC
Government Greenhouse Gas Emission Plan).
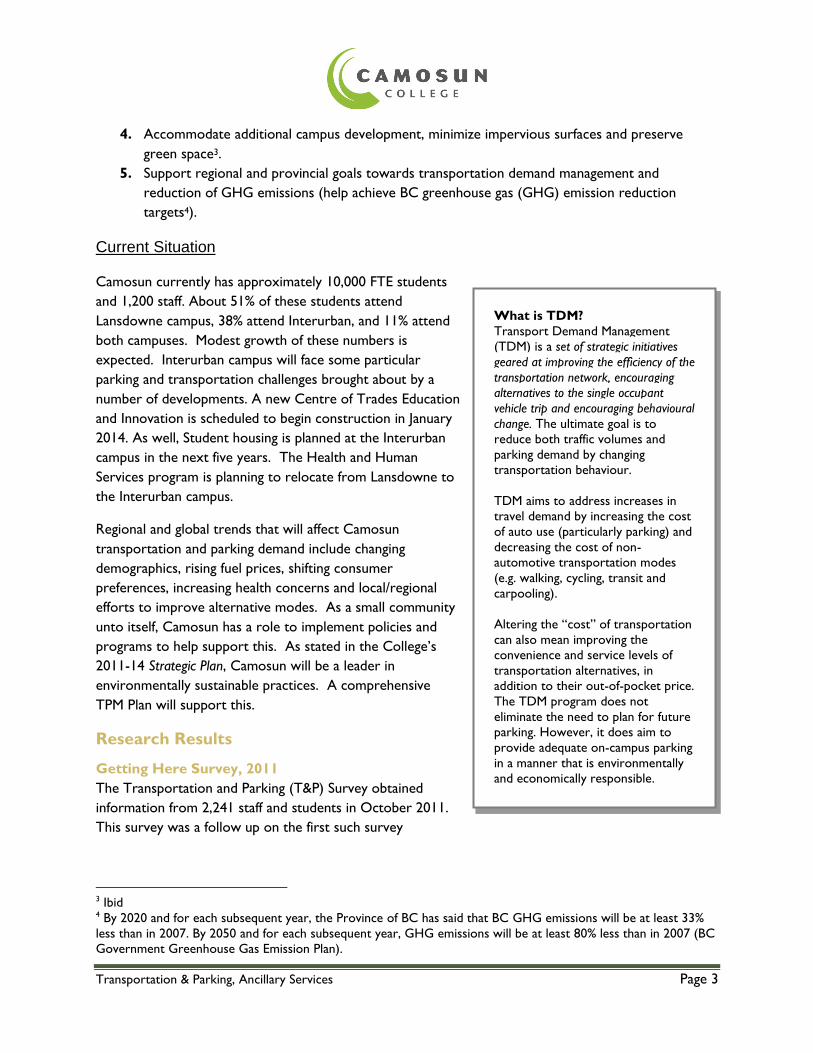
What is TDM?
Transport Demand Management
(TDM) is a set of strategic initiatives
geared at improving the efficiency of the
transportation network, encouraging
alternatives to the single occupant
vehicle trip and encouraging behavioural
change. The ultimate goal is to
reduce both traffic volumes and
parking demand by changing
transportation behaviour.
TDM aims to address increases in
travel demand by increasing the cost
of auto use (particularly parking) and
decreasing the cost of non-
automotive transportation modes
(e.g. walking, cycling, transit and
carpooling).
Altering the “cost” of transportation
can also mean improving the
convenience and service levels of
transportation alternatives, in
addition to their out-of-pocket price.
The TDM program does not
eliminate the need to plan for future
parking. However, it does aim to
provide adequate on-campus parking
in a manner that is environmentally
and economically responsible.
Transportation & Parking, Ancillary Services Page 4
conducted in 2008. Results are summarized in Getting Here: Results of the Fall 2011 Transportation and
Parking Survey, posted on the Camosun Parking & Transportation website at
www.camosun.bc.ca/about/transportation
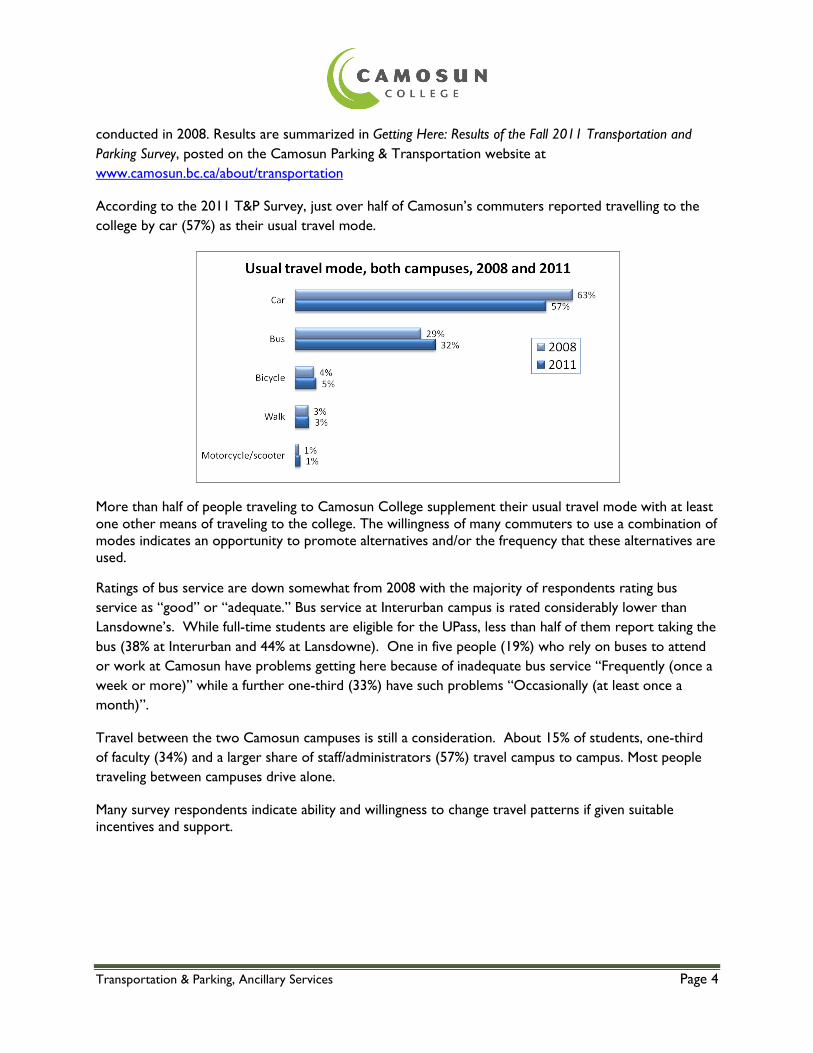
According to the 2011 T&P Survey, just over half of Camosun’s commuters reported travelling to the
college by car (57%) as their usual travel mode.
More than half of people traveling to Camosun College supplement their usual travel mode with at least
one other means of traveling to the college. The willingness of many commuters to use a combination of
modes indicates an opportunity to promote alternatives and/or the frequency that these alternatives are
used.
Ratings of bus service are down somewhat from 2008 with the majority of respondents rating bus
service as “good” or “adequate.” Bus service at Interurban campus is rated considerably lower than
Lansdowne’s. While full-time students are eligible for the UPass, less than half of them report taking the
bus (38% at Interurban and 44% at Lansdowne). One in five people (19%) who rely on buses to attend
or work at Camosun have problems getting here because of inadequate bus service “Frequently (once a
week or more)” while a further one-third (33%) have such problems “Occasionally (at least once a
month)”.
Travel between the two Camosun campuses is still a consideration. About 15% of students, one-third
of faculty (34%) and a larger share of staff/administrators (57%) travel campus to campus. Most people
traveling between campuses drive alone.
Many survey respondents indicate ability and willingness to change travel patterns if given suitable
incentives and support.
Transportation & Parking, Ancillary Services Page 5
The most commonly selected improvement that would motivate respondents to take transit more is
“More frequent transit service”, followed by “Less crowded or more comfortable buses”, “Improved
cycling paths” and “Rideshare matching service” (to help you find a carpool).
Mode Share Count, 2012
In addition to the 2011 Survey, Camosun conducted its biannual Mode Split Count in October 20125.
Both Interurban and Lansdowne campuses were included. A total of 16,113 modes were counted. The
numbers break down as follows:
SOV Car 2+ Transit Pedestrians Bike Other6
6193 1744 4987 2324 591 274
38.4% 38. 10.8% 31% 14.4% 3.7% 1.7%
Significant differences emerged between the two campuses. Interurban has a higher use of single
occupancy vehicles (SOVs), slightly higher carpooling and almost no pedestrian traffic. In contrast,
Lansdowne reflects a much more even split across mode share with a significant volume of pedestrians.
When compared to the 2010 mode count, the trends are encouraging. Most significantly, both
Interurban and Lansdowne showed a decrease in SOV traffic (down 3.8% and 5.4% respectively). Other
positive trends point to more transit users and pedestrians.
5 See http://camosun.ca/documents/about/transportation/modal-split-camosun-2012.pdf for full report. 6 Other consists of motorcycles, scooters, drivers and passengers of delivery and construction vehicles,
skateboarders, rollerbladers, and other modes.
Transportation & Parking, Ancillary Services Page 6
On another positive front, Camosun mode share splits are comparable with the University of Victoria –
a considerable achievement given that Camosun does not have nearly the same transit service or
alternative travel incentives that UVic does.
To achieve the goal of a 20% reduction in SOV vehicles on campus by 2020, an overall annual reduction
of 5% is required. In the two-year period between the 2010 and 2012 modal surveys, a 6.5% reduction
in motorized vehicles was recorded. While very positive, this falls short of the goal of 10% over 2 years.
At Camosun’s current rate of mode split shifts, it will not achieve the reductions required by 2020 (just
seven years from now).
For comparison, UVic took 12 years (1996 - 2008) to reduce the number of SOVs coming to campus by
20%7. UBC took 14 years (1997-2011) to decrease the number of SOVs coming to campus by 14%8.
Both UVic and UBC charge for staff parking.
A significant factor to shifting the mode split away from SOVs and towards alternatives will be a solution
to free staff parking. Currently, Camosun employees have little incentive to choose alternatives; priority
parking spaces are provided at no charge and campus-to-campus travel is often necessary throughout
the week. With subsidized parking in place, transportation alternatives like cycling and transit actually
cost the employee more money than driving9!
Rationale for Parking and TDM
Transportation is recognized as a major contributor (over 26%) to gas emissions, representing a
significant opportunity and obligation to review and revise our practices.
New developments and changes (such as Pacific Institute for Sport Excellence, Student Housing,
Centre for Trades Education & Innovation, and potential movement of programs) are – or are
expected to – impact current parking and transportation demands. We want to address these
in a proactive, sustainable manner.
The current use of land for parking (the status quo) is not sustainable.
Other local and public institutions have also identified the need to address these issues; we are
not the first, so there is opportunity to learn from others and incorporate best practices. In
addition, other neighboring organizations share Camosun’s transportation and parking
challenges. There is an opportunity to leverage common interests through collaboration.
The alternative to TDM is providing additional parking and road capacity to cater to user
demand. One problem with this approach is its impact on the environment and the surrounding
community. Encouraging car use through inexpensive and abundant parking puts more cars on
the road, thus increasing emissions, traffic congestion and storm water run-off. Another
problem is the cost to provide more parking. Based on 2009 figures, the parking price per
surface stall is $6,000. To create a 200 space lot would cost the college $1.2 million. This does
7 Source: UVic Progress Report on the Sustainability Action Plan, 2009-2014. 8Source: UBC Transportation Status Reports, 1997-2011. 9 For example, an annual ProPass Transit pass costs $875 versus the taxable benefit of parking being only $183 -
$288 annually (depending on salary). For those who cycle, a locker, towel service, and secure bike parking could
cost up to $180 annually with the added price of $6 to park on days that require driving.
Transportation & Parking, Ancillary Services Page 7
not account for opportunity cost of other uses of this space, nor does it take into account
environmental costs (e.g. loss of trees, habitat, storm water management, etc.)
The benefits of active transportation are becoming increasingly well known. Health,
environmental quality, social equity and community safety all improve when people choose
active transportation over driving. 10
Reducing campus-to-campus travel without compromising the ability to do college work will
save departmental expenses for the college.
What’s changed from the 2010-13 to the 2013-16 Plan?
Firstly, while the goals in this plan echo the earlier plan, the goal statements are now directly linked to
the actions/targets, and the plan itself is much more condensed. To see how this aligns with the 2010-
13 Plan, please see Appendix A. Secondly, in comparison with the 2010 – 2013 Plan, the 2013 – 2016
Plan has a greater emphasis on creating policies/procedures with a look to ongoing programs to support
Transportation and Parking Management. Evaluation and reporting mechanisms are again considered as
integral to the program, and builds on the significant volume of work accomplished in the last five years.
The title has changed, shifting from the TPM (Transportation & Parking Management) acronym to the
use of Parking and Transportation Demand Management (or TDM) to more accurately reflect
terminology of the field.
In addition, when looking at the actions under Goal 2 (Alternative Transportation), it should be noted
that this goal and objectives will be supported by the Alternative Transportation Campaign (ATC), a new
initiative for the college launched in 2012. The ATC plan further details actions, communication and
outreach that will:
1. Develop and organize interactive events and ongoing communications campaigns to promote
alternative transportation (e.g. car pool speed dating, bus driver appreciation, ride share week,
videos, etc.)
2. Social marketing about the benefits of alternative transportation (money, health, time, etc.)
3. Liaison with the International department to encourage students to live and recreate near the
campuses.
10 The Links Between Public Health and Active Transportation and The Social Implications of Sustainable and Active
Transportation.
Transportation & Parking, Ancillary Services Page 8
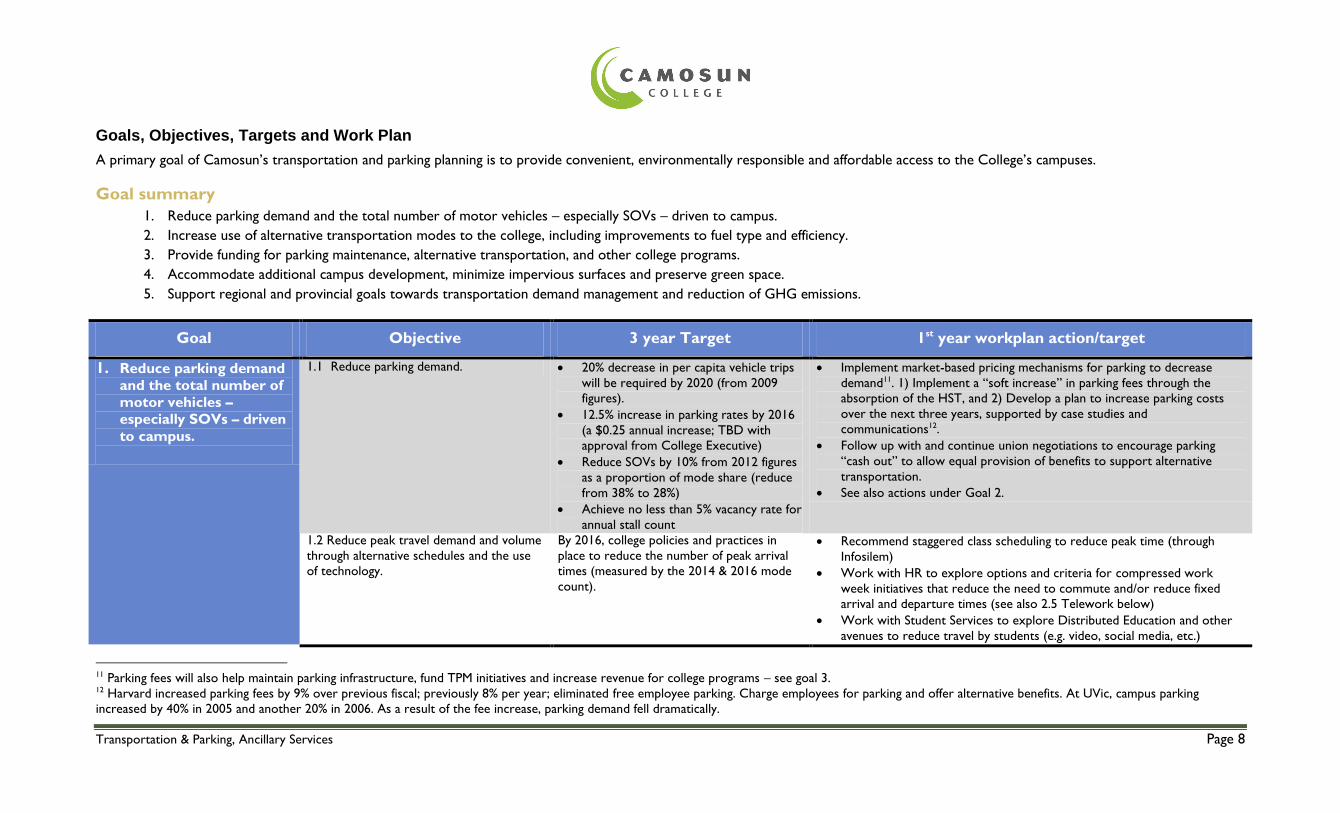
Goals, Objectives, Targets and Work Plan
A primary goal of Camosun’s transportation and parking planning is to provide convenient, environmentally responsible and affordable access to the College’s campuses.
Goal summary
1. Reduce parking demand and the total number of motor vehicles – especially SOVs – driven to campus.
2. Increase use of alternative transportation modes to the college, including improvements to fuel type and efficiency.
3. Provide funding for parking maintenance, alternative transportation, and other college programs.
4. Accommodate additional campus development, minimize impervious surfaces and preserve green space.
5. Support regional and provincial goals towards transportation demand management and reduction of GHG emissions.
Goal Objective 3 year Target 1st year workplan action/target
1. Reduce parking demand
and the total number of
motor vehicles –
especially SOVs – driven
to campus.
1.1 Reduce parking demand. 20% decrease in per capita vehicle trips
will be required by 2020 (from 2009
figures).
12.5% increase in parking rates by 2016
(a $0.25 annual increase; TBD with
approval from College Executive)
Reduce SOVs by 10% from 2012 figures
as a proportion of mode share (reduce
from 38% to 28%)
Achieve no less than 5% vacancy rate for
annual stall count
Implement market-based pricing mechanisms for parking to decrease
demand11. 1) Implement a “soft increase” in parking fees through the
absorption of the HST, and 2) Develop a plan to increase parking costs
over the next three years, supported by case studies and
communications12.
Follow up with and continue union negotiations to encourage parking
“cash out” to allow equal provision of benefits to support alternative
transportation.
See also actions under Goal 2.
1.2 Reduce peak travel demand and volume
through alternative schedules and the use
of technology.
By 2016, college policies and practices in
place to reduce the number of peak arrival
times (measured by the 2014 & 2016 mode
count).
Recommend staggered class scheduling to reduce peak time (through
Infosilem)
Work with HR to explore options and criteria for compressed work
week initiatives that reduce the need to commute and/or reduce fixed
arrival and departure times (see also 2.5 Telework below)
Work with Student Services to explore Distributed Education and other
avenues to reduce travel by students (e.g. video, social media, etc.)
11 Parking fees will also help maintain parking infrastructure, fund TPM initiatives and increase revenue for college programs – see goal 3. 12 Harvard increased parking fees by 9% over previous fiscal; previously 8% per year; eliminated free employee parking. Charge employees for parking and offer alternative benefits. At UVic, campus parking
increased by 40% in 2005 and another 20% in 2006. As a result of the fee increase, parking demand fell dramatically.
Transportation & Parking, Ancillary Services Page 9
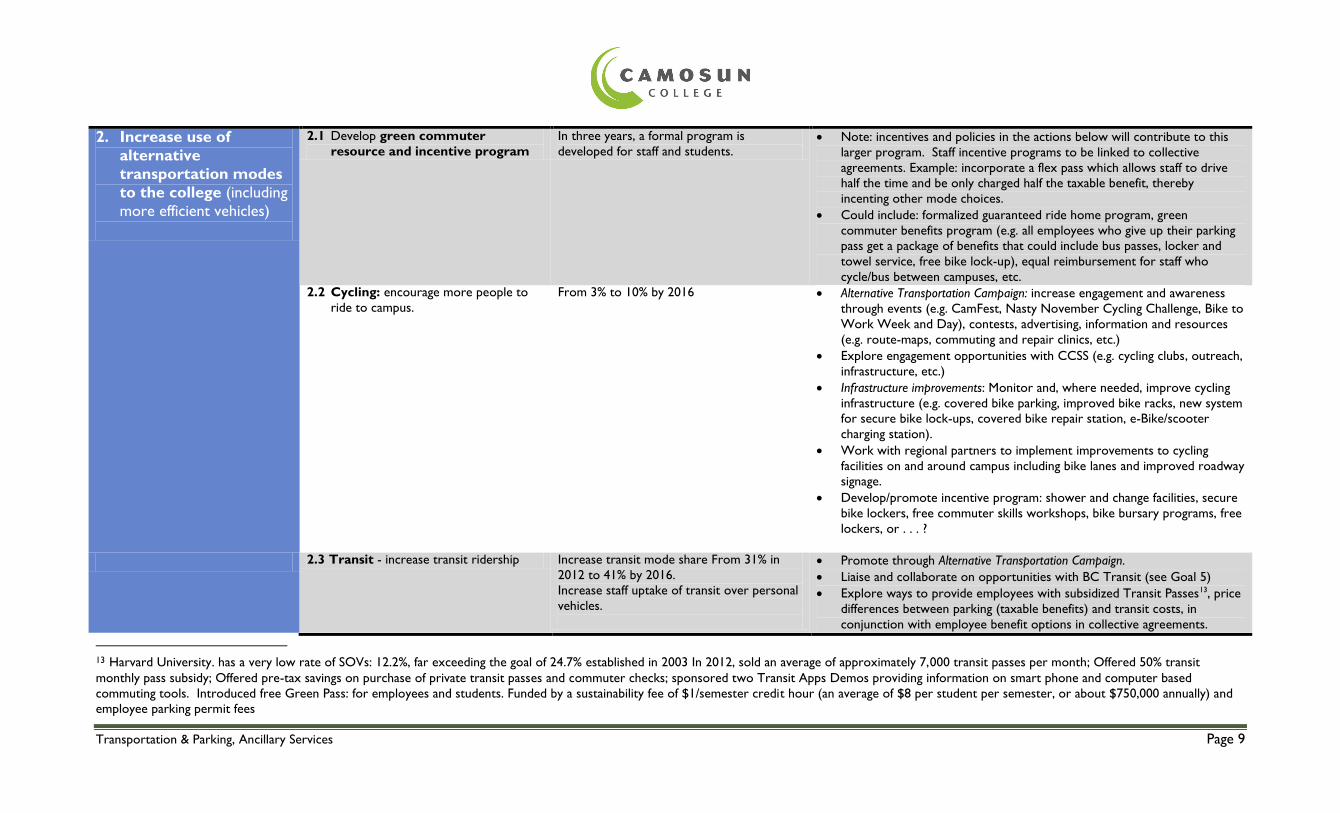
2. Increase use of
alternative
transportation modes
to the college (including
more efficient vehicles)
2.1 Develop green commuter
resource and incentive program
In three years, a formal program is
developed for staff and students. Note: incentives and policies in the actions below will contribute to this
larger program. Staff incentive programs to be linked to collective
agreements. Example: incorporate a flex pass which allows staff to drive
half the time and be only charged half the taxable benefit, thereby
incenting other mode choices.
Could include: formalized guaranteed ride home program, green
commuter benefits program (e.g. all employees who give up their parking
pass get a package of benefits that could include bus passes, locker and
towel service, free bike lock-up), equal reimbursement for staff who
cycle/bus between campuses, etc.
2.2 Cycling: encourage more people to
ride to campus.
From 3% to 10% by 2016
Alternative Transportation Campaign: increase engagement and awareness
through events (e.g. CamFest, Nasty November Cycling Challenge, Bike to
Work Week and Day), contests, advertising, information and resources
(e.g. route-maps, commuting and repair clinics, etc.)
Explore engagement opportunities with CCSS (e.g. cycling clubs, outreach,
infrastructure, etc.)
Infrastructure improvements: Monitor and, where needed, improve cycling
infrastructure (e.g. covered bike parking, improved bike racks, new system
for secure bike lock-ups, covered bike repair station, e-Bike/scooter
charging station).
Work with regional partners to implement improvements to cycling
facilities on and around campus including bike lanes and improved roadway
signage.
Develop/promote incentive program: shower and change facilities, secure
bike lockers, free commuter skills workshops, bike bursary programs, free
lockers, or . . . ?
2.3 Transit - increase transit ridership Increase transit mode share From 31% in
2012 to 41% by 2016.
Increase staff uptake of transit over personal
vehicles.
Promote through Alternative Transportation Campaign.
Liaise and collaborate on opportunities with BC Transit (see Goal 5)
Explore ways to provide employees with subsidized Transit Passes13, price
differences between parking (taxable benefits) and transit costs, in
conjunction with employee benefit options in collective agreements.
13 Harvard University. has a very low rate of SOVs: 12.2%, far exceeding the goal of 24.7% established in 2003 In 2012, sold an average of approximately 7,000 transit passes per month; Offered 50% transit
monthly pass subsidy; Offered pre-tax savings on purchase of private transit passes and commuter checks; sponsored two Transit Apps Demos providing information on smart phone and computer based
commuting tools. Introduced free Green Pass: for employees and students. Funded by a sustainability fee of $1/semester credit hour (an average of $8 per student per semester, or about $750,000 annually) and
employee parking permit fees
Transportation & Parking, Ancillary Services Page 10
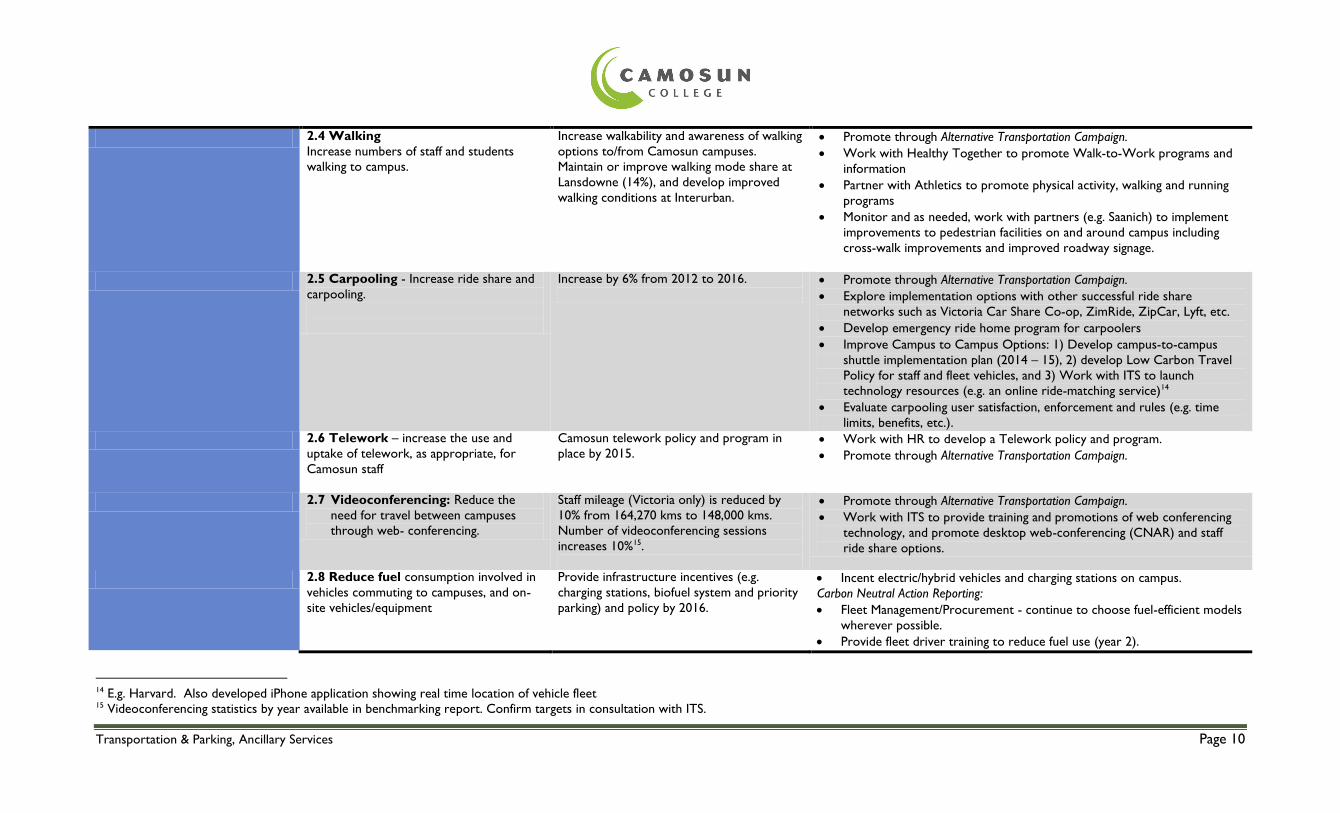
2.4 Walking
Increase numbers of staff and students
walking to campus.
Increase walkability and awareness of walking
options to/from Camosun campuses.
Maintain or improve walking mode share at
Lansdowne (14%), and develop improved
walking conditions at Interurban.
Promote through Alternative Transportation Campaign.
Work with Healthy Together to promote Walk-to-Work programs and
information
Partner with Athletics to promote physical activity, walking and running
programs
Monitor and as needed, work with partners (e.g. Saanich) to implement
improvements to pedestrian facilities on and around campus including
cross-walk improvements and improved roadway signage.
2.5 Carpooling - Increase ride share and
carpooling.
Increase by 6% from 2012 to 2016.
Promote through Alternative Transportation Campaign.
Explore implementation options with other successful ride share
networks such as Victoria Car Share Co-op, ZimRide, ZipCar, Lyft, etc.
Develop emergency ride home program for carpoolers
Improve Campus to Campus Options: 1) Develop campus-to-campus
shuttle implementation plan (2014 – 15), 2) develop Low Carbon Travel
Policy for staff and fleet vehicles, and 3) Work with ITS to launch
technology resources (e.g. an online ride-matching service)14 Evaluate carpooling user satisfaction, enforcement and rules (e.g. time
limits, benefits, etc.).
2.6 Telework – increase the use and
uptake of telework, as appropriate, for
Camosun staff
Camosun telework policy and program in
place by 2015. Work with HR to develop a Telework policy and program.
Promote through Alternative Transportation Campaign.
2.7 Videoconferencing: Reduce the
need for travel between campuses
through web- conferencing.
Staff mileage (Victoria only) is reduced by
10% from 164,270 kms to 148,000 kms.
Number of videoconferencing sessions
increases 10%15.
Promote through Alternative Transportation Campaign.
Work with ITS to provide training and promotions of web conferencing
technology, and promote desktop web-conferencing (CNAR) and staff
ride share options.
2.8 Reduce fuel consumption involved in
vehicles commuting to campuses, and on-
site vehicles/equipment
Provide infrastructure incentives (e.g.
charging stations, biofuel system and priority
parking) and policy by 2016.
Incent electric/hybrid vehicles and charging stations on campus.
Carbon Neutral Action Reporting:
Fleet Management/Procurement - continue to choose fuel-efficient models
wherever possible.
Provide fleet driver training to reduce fuel use (year 2).
14 E.g. Harvard. Also developed iPhone application showing real time location of vehicle fleet 15 Videoconferencing statistics by year available in benchmarking report. Confirm targets in consultation with ITS.
Transportation & Parking, Ancillary Services Page 11
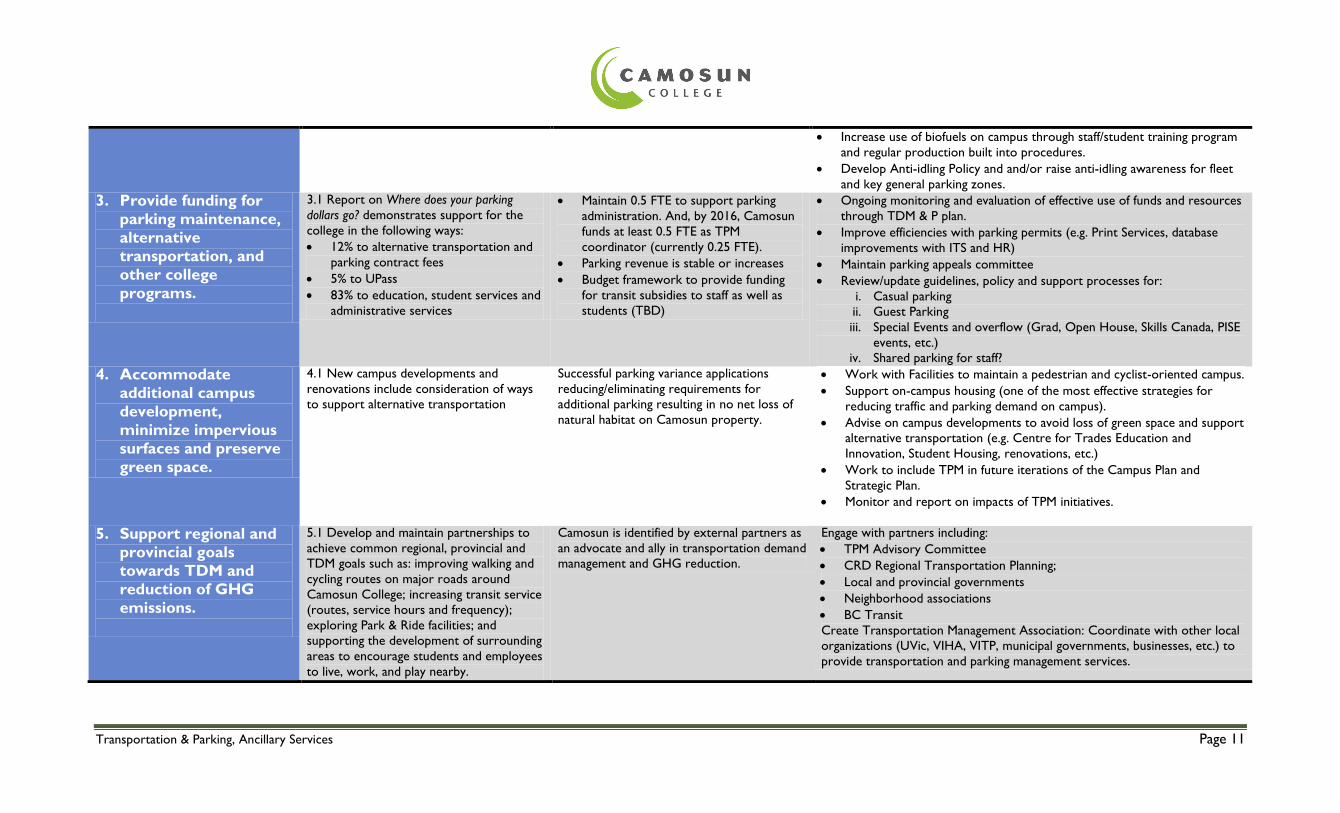
Increase use of biofuels on campus through staff/student training program
and regular production built into procedures.
Develop Anti-idling Policy and and/or raise anti-idling awareness for fleet
and key general parking zones.
3. Provide funding for
parking maintenance,
alternative
transportation, and
other college
programs.
3.1 Report on Where does your parking
dollars go? demonstrates support for the
college in the following ways:
12% to alternative transportation and
parking contract fees
5% to UPass
83% to education, student services and
administrative services
Maintain 0.5 FTE to support parking
administration. And, by 2016, Camosun
funds at least 0.5 FTE as TPM
coordinator (currently 0.25 FTE).
Parking revenue is stable or increases
Budget framework to provide funding
for transit subsidies to staff as well as
students (TBD)
Ongoing monitoring and evaluation of effective use of funds and resources
through TDM & P plan.
Improve efficiencies with parking permits (e.g. Print Services, database
improvements with ITS and HR)
Maintain parking appeals committee
Review/update guidelines, policy and support processes for:
i. Casual parking
ii. Guest Parking
iii. Special Events and overflow (Grad, Open House, Skills Canada, PISE
events, etc.)
iv. Shared parking for staff?
4. Accommodate
additional campus
development,
minimize impervious
surfaces and preserve
green space.
4.1 New campus developments and
renovations include consideration of ways
to support alternative transportation
Successful parking variance applications
reducing/eliminating requirements for
additional parking resulting in no net loss of
natural habitat on Camosun property.
Work with Facilities to maintain a pedestrian and cyclist-oriented campus.
Support on-campus housing (one of the most effective strategies for
reducing traffic and parking demand on campus).
Advise on campus developments to avoid loss of green space and support
alternative transportation (e.g. Centre for Trades Education and
Innovation, Student Housing, renovations, etc.)
Work to include TPM in future iterations of the Campus Plan and
Strategic Plan.
Monitor and report on impacts of TPM initiatives.
5. Support regional and
provincial goals
towards TDM and
reduction of GHG
emissions.
5.1 Develop and maintain partnerships to
achieve common regional, provincial and
TDM goals such as: improving walking and
cycling routes on major roads around
Camosun College; increasing transit service
(routes, service hours and frequency);
exploring Park & Ride facilities; and
supporting the development of surrounding
areas to encourage students and employees
to live, work, and play nearby.
Camosun is identified by external partners as
an advocate and ally in transportation demand
management and GHG reduction.
Engage with partners including:
TPM Advisory Committee
CRD Regional Transportation Planning;
Local and provincial governments
Neighborhood associations
BC Transit
Create Transportation Management Association: Coordinate with other local
organizations (UVic, VIHA, VITP, municipal governments, businesses, etc.) to
provide transportation and parking management services.
Transportation & Parking, Ancillary Services Page 12
Accountability
The Lead of Camosun’s Transportation and Parking Management program is the Director of Ancillary Services.
The Manager of Environmental Sustainability will be responsible for the implementation of this plan.
The Transportation and Parking Management Advisory Committee will to provide strategic counsel and advice that will assist and support in the success of Camosun’s Transportation
and Parking Management Program with a particular focus on this Three Year Plan. The Advisory Committee will focus on:
o Programs, policy and education that support Camosun’s three-year plan, with evaluation and reporting mechanisms
o Promoting and improving transportation options to Camosun, with evaluation and reporting mechanisms.
o Advise Camosun on broader regional transportation issues, trends and activities which it should be involved in/have awareness of
o Opportunities for advisory committee members to share ideas/concerns and build stronger working relationships amongst each other for broader transportation related issues
Information, Reporting & Evaluation 2013 - 2016
1. Mode Split Survey (Biannual - October 2014 & 2016)
2. Getting Here Survey (Biannual – October 2013 & 2015)
3. Benchmarking Reports (Annual)
4. Parking Stall & Vacancy Count (Annual)
5. Report on violation statistics and types (Annual)
6. TPM Advisory engagement (Quarterly)
7. Campus Communications (via CamNews, website, social media, RSS feeds, college-wide emails, Nexus articles, etc.) - ongoing
8. Financial reporting for annual % spent on TDM initiatives
Transportation & Parking, Ancillary Services Page 13
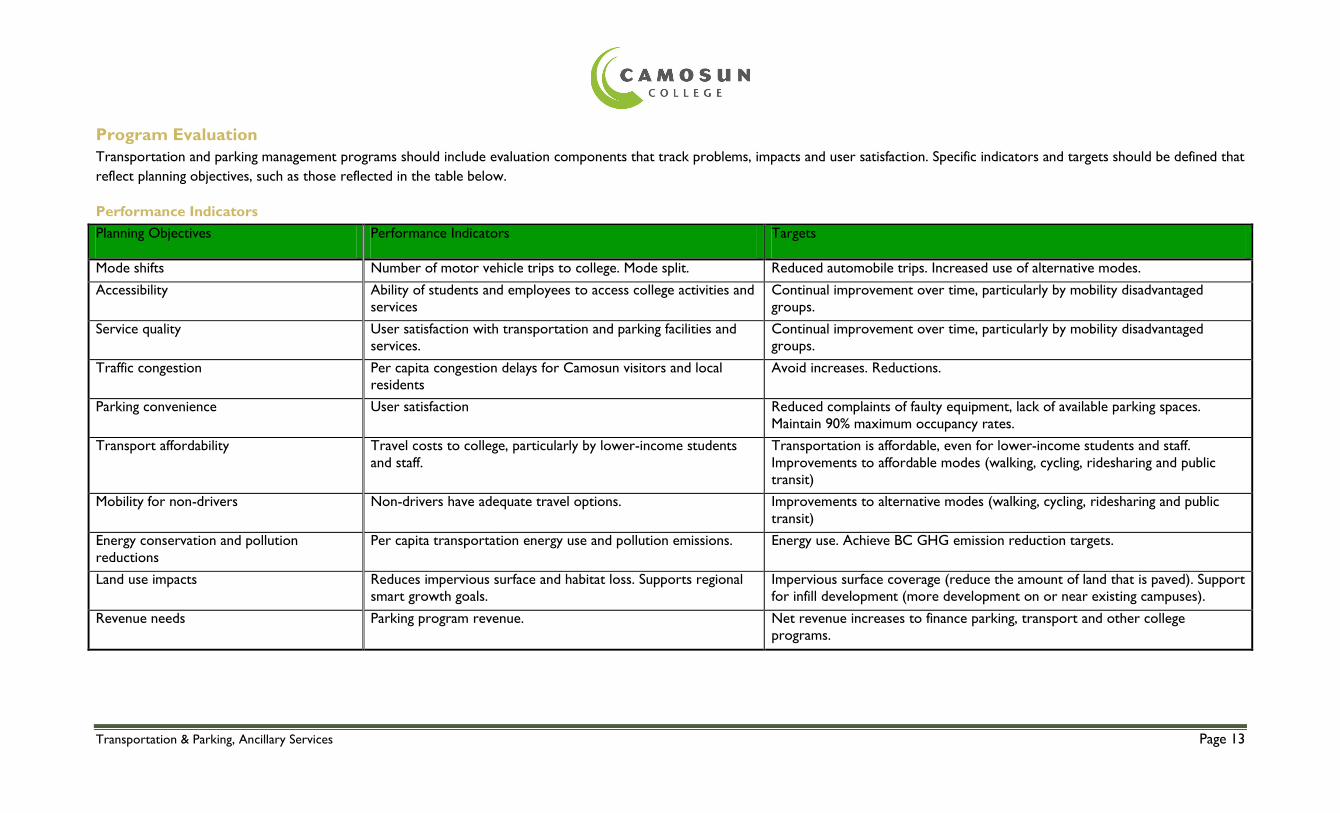
Program Evaluation
Transportation and parking management programs should include evaluation components that track problems, impacts and user satisfaction. Specific indicators and targets should be defined that
reflect planning objectives, such as those reflected in the table below.
Performance Indicators
Planning Objectives Performance Indicators Targets
Mode shifts Number of motor vehicle trips to college. Mode split. Reduced automobile trips. Increased use of alternative modes.
Accessibility Ability of students and employees to access college activities and
services
Continual improvement over time, particularly by mobility disadvantaged
groups.
Service quality User satisfaction with transportation and parking facilities and
services.
Continual improvement over time, particularly by mobility disadvantaged
groups.
Traffic congestion Per capita congestion delays for Camosun visitors and local
residents
Avoid increases. Reductions.
Parking convenience User satisfaction Reduced complaints of faulty equipment, lack of available parking spaces.
Maintain 90% maximum occupancy rates.
Transport affordability Travel costs to college, particularly by lower-income students
and staff.
Transportation is affordable, even for lower-income students and staff.
Improvements to affordable modes (walking, cycling, ridesharing and public
transit)
Mobility for non-drivers Non-drivers have adequate travel options. Improvements to alternative modes (walking, cycling, ridesharing and public
transit)
Energy conservation and pollution
reductions
Per capita transportation energy use and pollution emissions. Energy use. Achieve BC GHG emission reduction targets.
Land use impacts Reduces impervious surface and habitat loss. Supports regional
smart growth goals.
Impervious surface coverage (reduce the amount of land that is paved). Support
for infill development (more development on or near existing campuses).
Revenue needs Parking program revenue. Net revenue increases to finance parking, transport and other college
programs.
Transportation & Parking, Ancillary Services Page 14
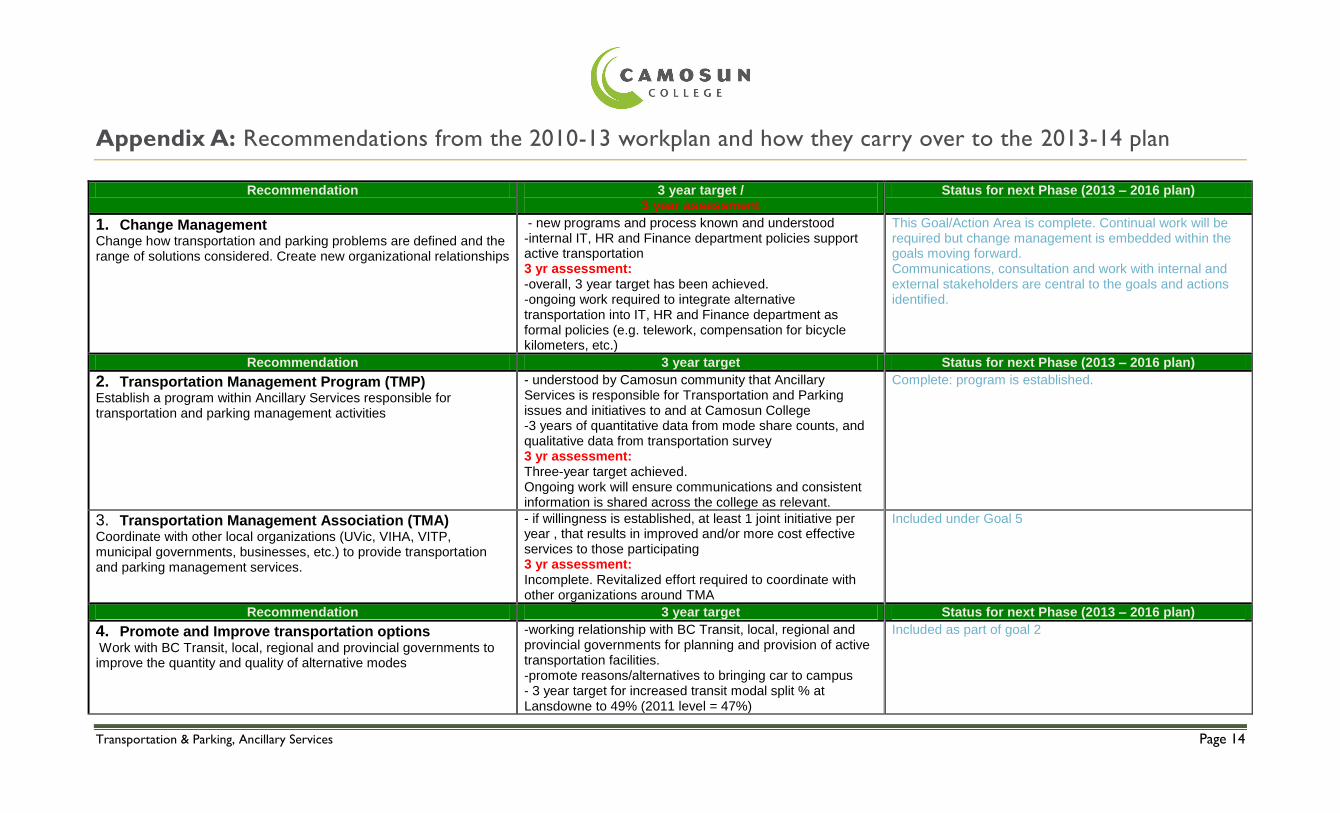
Appendix A: Recommendations from the 2010-13 workplan and how they carry over to the 2013-14 plan
Recommendation 3 year target / 3 year assessment
Status for next Phase (2013 – 2016 plan)
1. Change Management Change how transportation and parking problems are defined and the range of solutions considered. Create new organizational relationships
- new programs and process known and understood -internal IT, HR and Finance department policies support active transportation 3 yr assessment: -overall, 3 year target has been achieved. -ongoing work required to integrate alternative transportation into IT, HR and Finance department as formal policies (e.g. telework, compensation for bicycle kilometers, etc.)
This Goal/Action Area is complete. Continual work will be required but change management is embedded within the goals moving forward. Communications, consultation and work with internal and external stakeholders are central to the goals and actions identified.
Recommendation 3 year target Status for next Phase (2013 – 2016 plan)
2. Transportation Management Program (TMP) Establish a program within Ancillary Services responsible for transportation and parking management activities
- understood by Camosun community that Ancillary Services is responsible for Transportation and Parking issues and initiatives to and at Camosun College -3 years of quantitative data from mode share counts, and qualitative data from transportation survey 3 yr assessment: Three-year target achieved. Ongoing work will ensure communications and consistent information is shared across the college as relevant.
Complete: program is established.
3. Transportation Management Association (TMA) Coordinate with other local organizations (UVic, VIHA, VITP, municipal governments, businesses, etc.) to provide transportation and parking management services.
- if willingness is established, at least 1 joint initiative per year , that results in improved and/or more cost effective services to those participating 3 yr assessment: Incomplete. Revitalized effort required to coordinate with other organizations around TMA
Included under Goal 5
Recommendation 3 year target Status for next Phase (2013 – 2016 plan)
4. Promote and Improve transportation options Work with BC Transit, local, regional and provincial governments to improve the quantity and quality of alternative modes
-working relationship with BC Transit, local, regional and provincial governments for planning and provision of active transportation facilities. -promote reasons/alternatives to bringing car to campus - 3 year target for increased transit modal split % at Lansdowne to 49% (2011 level = 47%)
Included as part of goal 2
Transportation & Parking, Ancillary Services Page 15
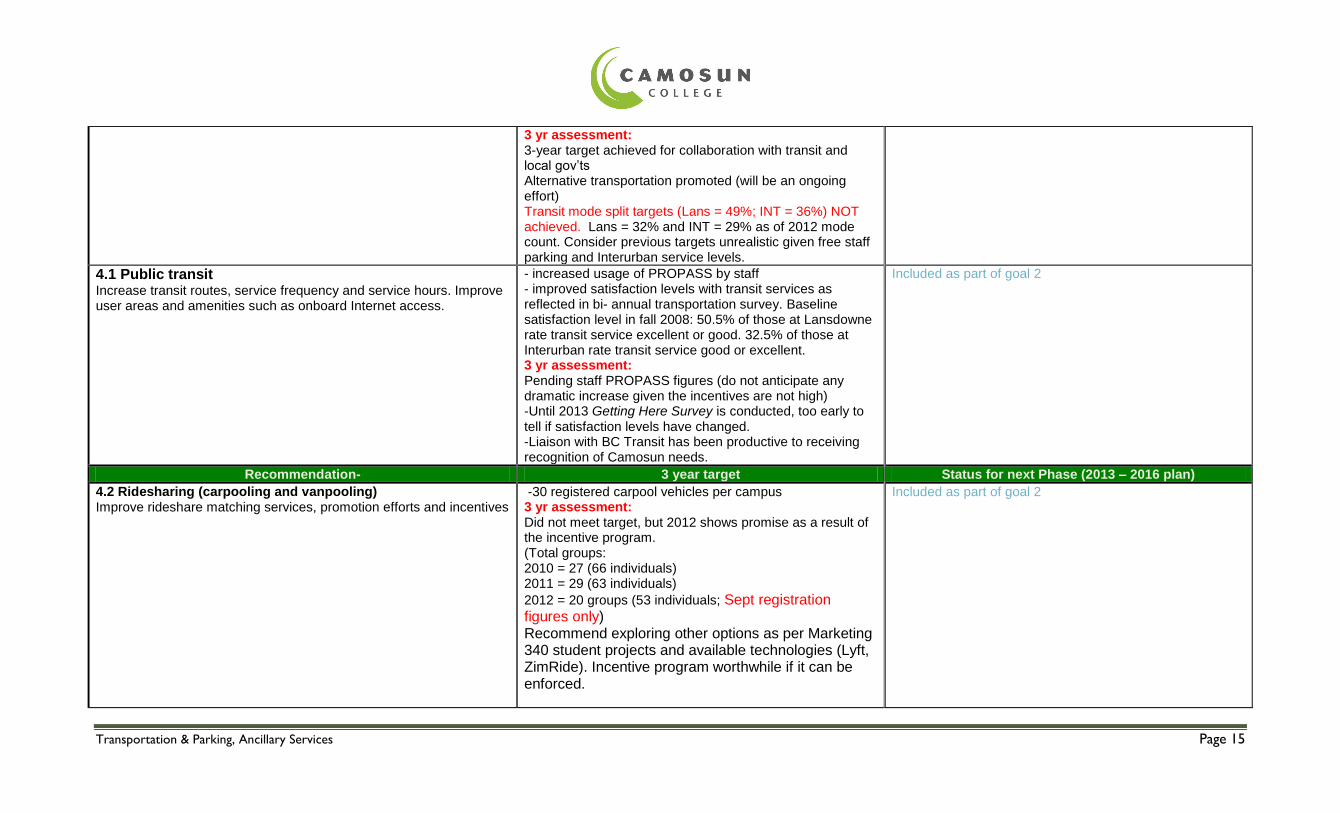
3 yr assessment: 3-year target achieved for collaboration with transit and local gov’ts Alternative transportation promoted (will be an ongoing effort) Transit mode split targets (Lans = 49%; INT = 36%) NOT achieved. Lans = 32% and INT = 29% as of 2012 mode count. Consider previous targets unrealistic given free staff parking and Interurban service levels.
4.1 Public transit Increase transit routes, service frequency and service hours. Improve user areas and amenities such as onboard Internet access.
- increased usage of PROPASS by staff - improved satisfaction levels with transit services as reflected in bi- annual transportation survey. Baseline satisfaction level in fall 2008: 50.5% of those at Lansdowne rate transit service excellent or good. 32.5% of those at Interurban rate transit service good or excellent. 3 yr assessment: Pending staff PROPASS figures (do not anticipate any dramatic increase given the incentives are not high) -Until 2013 Getting Here Survey is conducted, too early to tell if satisfaction levels have changed. -Liaison with BC Transit has been productive to receiving recognition of Camosun needs.
Included as part of goal 2
Recommendation- 3 year target Status for next Phase (2013 – 2016 plan)
4.2 Ridesharing (carpooling and vanpooling) Improve rideshare matching services, promotion efforts and incentives
-30 registered carpool vehicles per campus 3 yr assessment: Did not meet target, but 2012 shows promise as a result of the incentive program. (Total groups: 2010 = 27 (66 individuals) 2011 = 29 (63 individuals)
2012 = 20 groups (53 individuals; Sept registration figures only) Recommend exploring other options as per Marketing 340 student projects and available technologies (Lyft, ZimRide). Incentive program worthwhile if it can be enforced.
Included as part of goal 2
Transportation & Parking, Ancillary Services Page 16
Recommendation 3 year target Status for next Phase (2013 – 2016 plan)
4.3 Walking conditions Improve walking conditions on and around the campus. Insure universal design (facilities that accommodate all users).
-good working relationship with PRD -increased numbers of people walking to Camosun, from modal split counts 3 yr assessment: 2012 Mode split survey shows 24% pedestrian mode split share (and only 2% for Lansdowne) Continue to build connection with HR on Healthy Together type challenges.
Included as part of goal 2
4.4 Cycling conditions Improve cycling conditions on and around campus, including paths, lanes, parking and support services.
- students and staff report improved cycling routes around and between campuses - increased number of people cycling to Camosun, from Modal Split Report -support Saanich cycling facilities grant application (federal or provincial) 3 yr assessment: High level of engagement within Camosun’s cycling community (BTWW, Nasty November, etc.) No increase in cycling numbers reflected in 2012 mode split report. Room for improvement!
Included as part of goal 2
Recommendation 3 year target Status for next Phase (2013 – 2016 plan)
4.5 Car sharing and taxi services Ensure that car sharing and taxi services are conveniently available on campuses.
-car sharing and taxi services are conveniently available on campuses -Guaranteed/ Emergency Ride Home services are available to users of active transportation 3 yr assessment: Taxi services are available, but car sharing target not met. Carry-forward to next plan.
Included as part of goal 2
4.6 Telework Establish telework policies and support services.
Establish telework policies and support services. 3 yr assessment: Preliminary steps taken. Need to continue this work.
Included as part of goal 2
4.7 Alternative schedules Encourage alternative class and work schedules that reduce travel peaks.
20% increase in evening and weekend classes; 3 yr assessment: Unknown
Included as part of goal 2
4.8 Intercampus transport Ideal intercampus transport is identified, financially Included as part of goal 2
Transportation & Parking, Ancillary Services Page 17
subsidized group transport rather than single auto transport between campuses
supported and promoted 3 yr assessment: Assessment complete. Implementation is a high priority for next phase. In 12/13 fiscal, Camosun paid ~$74,000.00 for travel in Victoria (164,269.51 km), equivalent to 43.37 tonnes of GHGs, nearly 16% more than last year. Intercampus transport would also negate the need to exempt employees from taxable benefits.
NEW: Participate in early adopter of Electric Charging station for both campuses (Government grant)
Installation complete. Complete
Recommendation 3 year target Status for next Phase (2013 – 2016 plan)
5. Parking management - Implement various parking
management strategies.
- 10% reduction in the number of vehicles counted in modal split report. Baseline in 2010 is Interurban= 3592 and Lansdowne= 2744. - 10% availability rate for parking on each campus (5-10% reduction in occupancy at Interurban from 2008 levels) Littman. Baseline from 2008 (as used in TPM plan) is 1% availability, at Interurban. - to prevent current parking conditions worsening, and to accommodate 2% annual growth in students; a 20% decrease in per capita vehicle trips will be required. 3 yr assessment: 3 year target not met, but trend is in right direction 1) Between 2010 and 2012 modal surveys, a 6.5%
reduction in vehicles was recorded (SOVs plus Car 2+,
(55.8%, or 6279 out of 11,255 in 2010; 49.3%, or 7937
out of 16,113 in 2012) 2) SOV mode split, 2012 = 48% at INT (3728 cars); 32%
at LANS (2915 cars); reflecting reductions of 4% and
5% respectively in mode share proportion but an actual
increase in overall vehicle numbers).
Vacancy counts are relatively constant, and show slight improvement from 2008 baseline (3.5% for INT (min) and 20% for Lans (min)) Free staff parking and Interurban bus service tends to be two major barriers to influencing change.
Included in goal 1.
Transportation & Parking, Ancillary Services Page 18
*note re: realism of Camosun’s 3 yr goals: UVic took 12 years (1996 - 2008) to reduce the number of SOVs coming to campus by 20%.16 UBC took 14 years (1997-2011) to decrease the number of SOVs coming to campus by 14%
Recommendation 3 year target Status for next Phase (2013 – 2016 plan)
5.1 Shared parking - Share parking facilities among users and buildings,
-create shared parking options for student housing -maximize shared parking options on both campuses 3 yr assessment: Not fully addressed. Year 2: Interurban; evening PISE parking, some area neighbours renting driveway space to students, VITP offered use of north lot for busy day overflow parking
No designated staff/guest parking; benefit of free parking isn’t so explicit in the collective agreement (i.e. includes other transportation options as well)
5.2 Staff parking pricing and cash out - Eliminate or cash out free employee parking. Charge employees for parking and offer alternative benefits.
- phased plan to charge employees for parking, or offer cash out -achieve 10% reduction in staff vehicle parking/ Baseline in 2008 Getting Here Survey shows that 78.4% of staff respondents and 77.8% of faculty respondents used their vehicle to come to campus. 3 yr assessment: Not met. Free staff parking a major barrier/disincentive for alternative travel choices. Do not know actual numbers until 2013 survey is conducted. However, mode split counts reflect some encouraging trends. Most significantly, both Interurban and Lansdowne showed a decrease in SOV traffic from 2010 to 2012 (down 3.8% and 5.4% respectively). Other positive trends point to more transit users and pedestrians
17.
Included in Goal 1; target at least 10% to cash out.
Recommendation 3 year target Status for next Phase (2013 – 2016 plan)
5.3 Parking price targets - Establish targets to increase parking fees, particularly during peak periods, to reduce problems and generate revenues for transportation programs.
- increased parking rates used to cover costs of TPM project -increased/changed parking rates affect demand (fewer people bringing cars to campus) 3 yr assessment: Target complete.
Included in Goal 1.
16 Source: UVic Progress Report on the Sustainability Action Plan, 2009-2014. 17 For comparison, UVic took 12 years (1996 - 2008) to reduce the number of SOVs coming to campus by 20%. UBC took 14 years (1997-2011) to decrease the number of SOVs coming to campus by 14%. Both
UVic and UBC charge for staff parking
Transportation & Parking, Ancillary Services Page 19
5.4 Overflow parking plans -Establish overflow parking plans for special events.
-Have overflow parking agreement in place with 2 other local institutions 3 yr assessment: Partially addressed - VITP north lot confirmed; Church of JC-LDS on Wilkinson & Wilkinson correctional facility not interested
Included in Goal 3
5.5 Improve parking user information and enforcement Provide better user information on parking and transportation options. Improve enforcement on campus, and of nearby spillover parking.
-Current. consistent parking and active modes of transportation information available online, in print and on campus signage -Parking and transportation presence at campus events -improved user satisfaction The 2008 T&P Survey indicated significant user dissatisfaction with current parking management and enforcement. Only a third (33%) rate the availability of parking as either excellent (7.7%) or good (25%), and only 16.5% considered parking to provide either excellent (5.9%) or good (10.6%) value for money 3 yr assessment: Complete, except for improving user satisfaction rates (too early to tell as survey has not been completed)
Complete. Parking information and enforcement is integrated into the business functions and procedures of the office.
Recommendation 3 year target Status for next Phase (2013 – 2016 plan)
5.6 Parking pass rules and audits - Establish clearer rules concerning the allocation of free parking passes. Provide alternatives, such as free transit passes.
- “rules” and procedures known and understood by the Camosun Community - “rules” are applied consistently - Reduced staff time in administering guest permits and special requests -guest parking permit and employee permit system online 3 yr assessment: 3 year target met. Improvements could be made to reducing the number of guest parking permits (reminders, cultural change) and to provide greater clarity about parking benefits to staff, casual employees, and contractors (pending policy and guidelines).
Complete, Ongoing. Partially included in Goal 1.
Recommendation 3 year target Status for next Phase (2013 – 2016 plan)
6. Smart growth development policies Build compact development, particularly affordable housing, within or near existing campuses, including on existing parking lots.
Established policies of transportation expectations for students living on campus, with reduced impact of number of vehicles coming to campus daily - to prevent current parking conditions to worsen, and to
Included in Goal 1 and 4.
Transportation & Parking, Ancillary Services Page 20
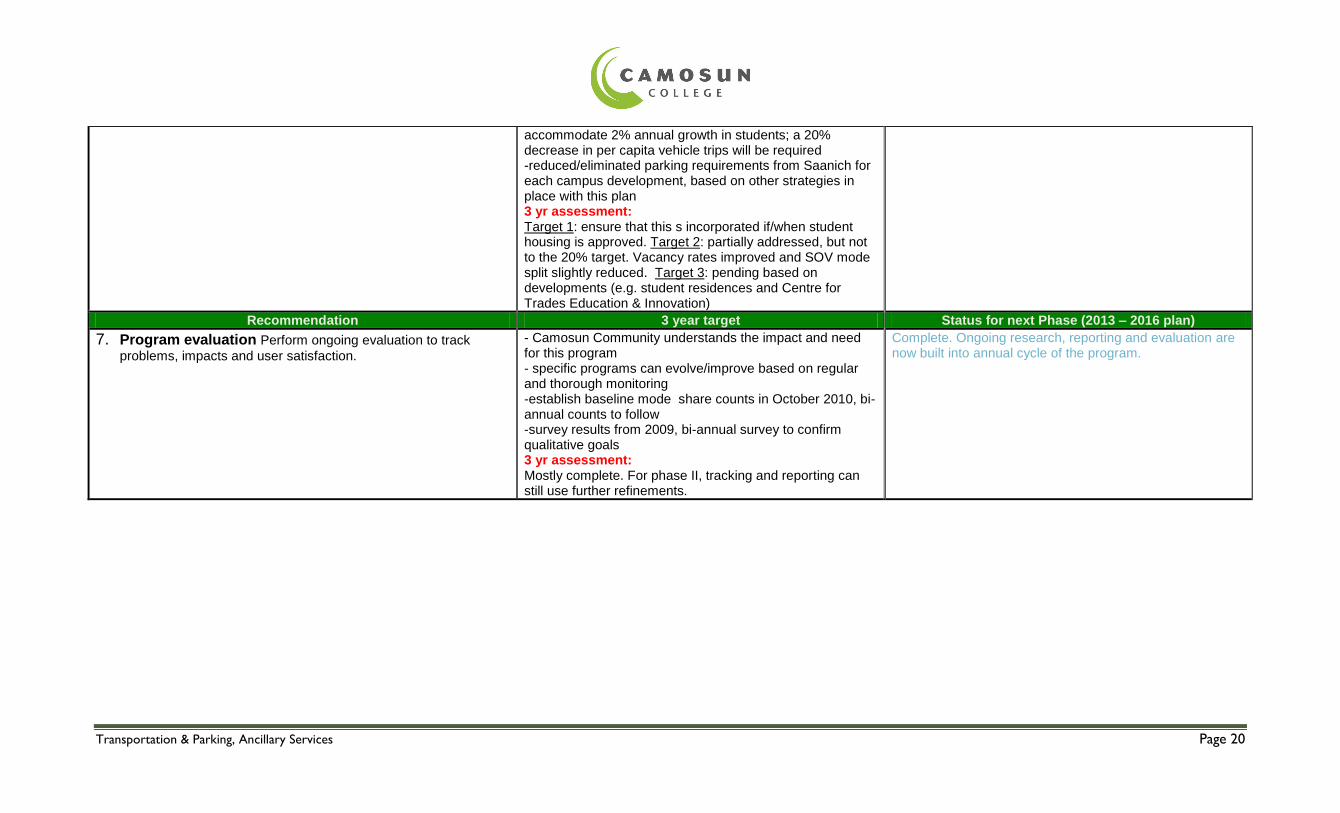
accommodate 2% annual growth in students; a 20% decrease in per capita vehicle trips will be required -reduced/eliminated parking requirements from Saanich for each campus development, based on other strategies in place with this plan 3 yr assessment: Target 1: ensure that this s incorporated if/when student housing is approved. Target 2: partially addressed, but not to the 20% target. Vacancy rates improved and SOV mode split slightly reduced. Target 3: pending based on developments (e.g. student residences and Centre for Trades Education & Innovation)
Recommendation 3 year target Status for next Phase (2013 – 2016 plan)
7. Program evaluation Perform ongoing evaluation to track
problems, impacts and user satisfaction.
- Camosun Community understands the impact and need for this program - specific programs can evolve/improve based on regular and thorough monitoring -establish baseline mode share counts in October 2010, bi-annual counts to follow -survey results from 2009, bi-annual survey to confirm qualitative goals 3 yr assessment: Mostly complete. For phase II, tracking and reporting can still use further refinements.
Complete. Ongoing research, reporting and evaluation are now built into annual cycle of the program.


