Campbell Field Feasibility Study What We Heard Report March 2021 Kootenay River ocan River Highway 3a & 6 Highway 3a ail Trail Slocan Valley Rail Trail Playmor Junction Campbell Field 8.6 acres (3.5 hectares) Campbell Field Brent Kennedy Elementary Mount Sentinel Secondary School rdck.ca
When the Regional District of Central Kootenay (RDCK) acquired Campbell Field from the South Slocan Sports Association,acommitmentwasmadetocarryonthelegacyofthesiteasavaluedandutilizedcommunityrecreationhub.LocatedwithinAreaHoftheRDCK,localdecisionmakerssetoutwithablankcanvastoexplorethefuturepotentialofthesiteasarecreationhubforbothAreaHresidentsaswellasothersinthebroadermarketarea.
es�mate• Partnership models• Ownership model• Opera�ng model
Anoutcomeoftheaforementionedconversationwastoproceedwithadditionalstudyforthispotentialdevelopment. The RDCK commissioned a Feasibility Study fortheCampbellFieldsite.ThisFeasibilityStudyconfirmstheneedforfordifferentamenitiesatCampbellField.Thisis completed through a program of research that includes:
The Feasibility Study is available under a separate cover. ThisdocumentistheWhatWeHeardreportwhichpresentsthefindingsofthecommunityengagement.The program of engagement included a coded access householdsurvey,anopenaccesshouseholdsurvey,acommunitygroupsurvey,andastudentsurvey.
Householdsinthisareaweresentapostcard1promotingthestudyandthesurveyandinvitingtheirparticipation.Aswellthepostcardsincludedanaccesscode,uniquetoeach household that enabled access to the online survey. Theaccesscodehelpedpreventmultipleresponsesfroma single household.2ThesurveywasaccessibleontheRegionalDistrictofCentralKootenaywebsite;theURLwashostedonaspecificprojectpageontheRDCKwebsite.Tofurtherpromoteparticipationinthesurvey,theRDCKleverageditscommunicationchannels;aswellashort(~1-2minute)videowasproduced.Periodicreminderswerealsocommunicatedduringthefieldingwindow.Participantsinthesurveywereadditionallyabletoentertheirnamesinadrawfora$100Visagiftcard.
1 Refer to the Appendix to see the postcard.2 In total 17,818 postcards were delivered to households
using neighbourhood mail. They were unaddressed and sent to all mailboxes in the region.
ThesurveywasfieldedfrommidOctoberthroughtolateNovember(October13,2020toNovember30,2020).Refertotheappendixtoviewthequestionnaire.Intotal732responsesweregatheredwhichrepresentsanoverallmarginoferrorof+3.6%19timesoutof20andaresponserateof4.1%.Thefindingsofthecodedaccesssurveyareconsideredrepresentativeofhouseholdsinthemarketarea.Thefindingsfromthecodedaccesssurveyarepresentedbelow.Additionallythesefindingsareexaminedaccordingtotraveltimes;thesubsegmentfindingsareincludedastablesbelowtheoverallfindings.3 TablespresentingthefindingsaccordingtoElectoralAreaare included in the Appendix.
While the delivery of the postcard provided an access codetoallhomesinthestudyarea,therewasarecognitionthatsomehomesmaynothavehadtheiraccess code available as they tried to provide their feedback.Assuchasurveywasavailablethatmirroredthecodedaccesssurveybutwithouttherequirementfora code. This survey gathered responses from late October (October28,2020)throughtoearlyDecember(December3,2020).Intotal358responsesweregathered.Thesefindingshavenotbeencombinedwiththefindingsfromthecodedaccesssurvey–therewerenocontrolsinplacetoensurethathouseholdsdidnotparticipateinbothsurveysorthatmultipleentriesweremadebyanyonerespondentinthisopenaccesssurvey.Thesefindingsarepresented alongside those from the open access survey.
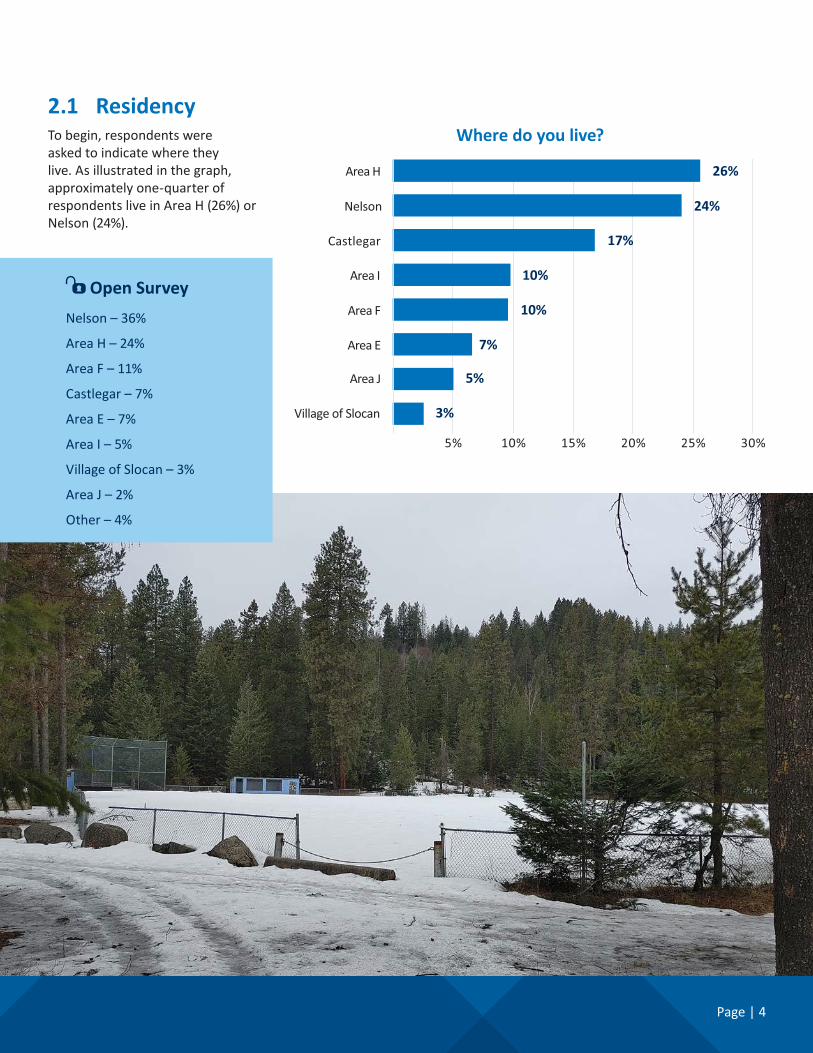
2 1 ResidencyTobegin,respondentswereaskedtoindicatewheretheylive.Asillustratedinthegraph,approximately one-quarter of respondents live in Area H (26%) or Nelson (24%).
Where do you live?
3%
5%
7%
10%
10%
17%
24%
26%
5% 10% 15% 20% 25% 30%
Village of Slocan
Area J
Area E
Area F
Area I
Castlegar
Nelson
Area H
Open SurveyNelson – 36%
Area H – 24%
Area F – 11%
Castlegar – 7%
Area E – 7%
Area I – 5%
VillageofSlocan–3%
AreaJ–2%
Other – 4%
Page | 5
Where in Area E?MountainStation/SouthSheppard 3%Bealby/HoricksPoints 5%GolfLinks/Silverking/Knox 5%Taghum 11%Blewett 76%
Where in Area F?7 to 10 mile 4%JohnstoneRd.toNasookinRd. 12%Taghum/SprouleCreek 14%Beasley 17%5 and 6 mile 23%Bonnington 29%
Where in Area HRuralSlocan/Brandon 2%Appledale/LemonCreek 6%PlaymorJunction 8%CrescentValley 11%South Slocan 12%Passmore/Vallican 13%Slocan Park 14%Winlaw 15%Krestova 19%
Where in Area I?PlaymorJunctionWest 2%Brilliant 3%Thrums 12%Pass Creek 12%VoykinSubdivision 12%Tarrys 12%Glade (Glade & Glade Central) 24%Shoreacres(Upper&Lower) 27%
Where in Area J?Hugh Keenleyside Dam 6%Raspberry 11%Robson 29%Ootischenia 54%
2 2 Travel TimeTraveltimesfromseverallocationstothe Campbell Field site at the Playmor Junctionwereprovided.Theintentofthisinformationwastoallowrespondentstobetterunderstandtheapproximatetimeitwouldtaketotravel(oneway)fromtheirhometothe site.
Over three-quarters (83%) of respondentslivewithinatwentyminutedrive(oneway)withlessthanone-third(29%)livingwithintenminutes.
Travel Time One Way(Home to Campbell Field)
29%
54%
11%6% 1%
10%0%
20%30%40%50%60%
Up to 10minutes
(e.g. Bonnington,Tarrys,
Slocan Park,Shore Acres)
11-20 minutes (e.g. Thrums,
Vallican, Blewe�,Robson,Nelson,
Castlegar)
21-30 minutes (e.g. Mountain
Sta�on /South Sheppard,
Pass Creek,Johnstone Rd.,
Oo�chenia)
31-40 minutes (e.g. Villageof Slocan,
9 mile,Syringa)
More than40 minutes.
Open Survey<10 min – 30%
11-20 min – 51%
21-30 min – 11%
31-40 min – 5%
>40 min – 3%
Page | 7
Are you willing to travel to Campbell Field to participate in these OUTDOOR activities?
12%
20%
21%
24%
28%
28%
29%
29%
34%
35%
35%
48%
48%
50%
51%
54%
59%
60%
64%
78%
40%
40%
30%
46%
43%
32%
27%
30%
27%
26%
25%
24%
24%
27%
21%
20%
23%
18%
16%
7%
4%
6%
6%
11%
11%
9%
8%
6%
10%
8%
8%
6%
8%
8%
11%
8%
6%
10%
7%
10%
44%
35%
43%
19%
18%
32%
36%
36%
29%
31%
33%
22%
20%
15%
18%
18%
11%
12%
13%
5%
10% 20% 30% 40% 50% 60% 70% 80% 90% 100%
Motocross
Golf
BMX biking
Gardening
Camping
Hard court ac�vi�es (e.g. basketball, ball hockey)
Ball diamond sports (e.g. so�ball, baseball)
Inline ska�ng / skateboarding
Tennis / pickleball
Field sports (e.g. soccer / football)
Frisbee / disc golf
Dog walking / play
Ska�ng
Swimming
Bird watching / nature apprecia�on
Cycling / mountain biking
Walking Jogging
Family gatherings (e.g. picnic, BBQ)
Cross country skiing / snowshoeing
A�end a performanceYes No Unsure No one does that
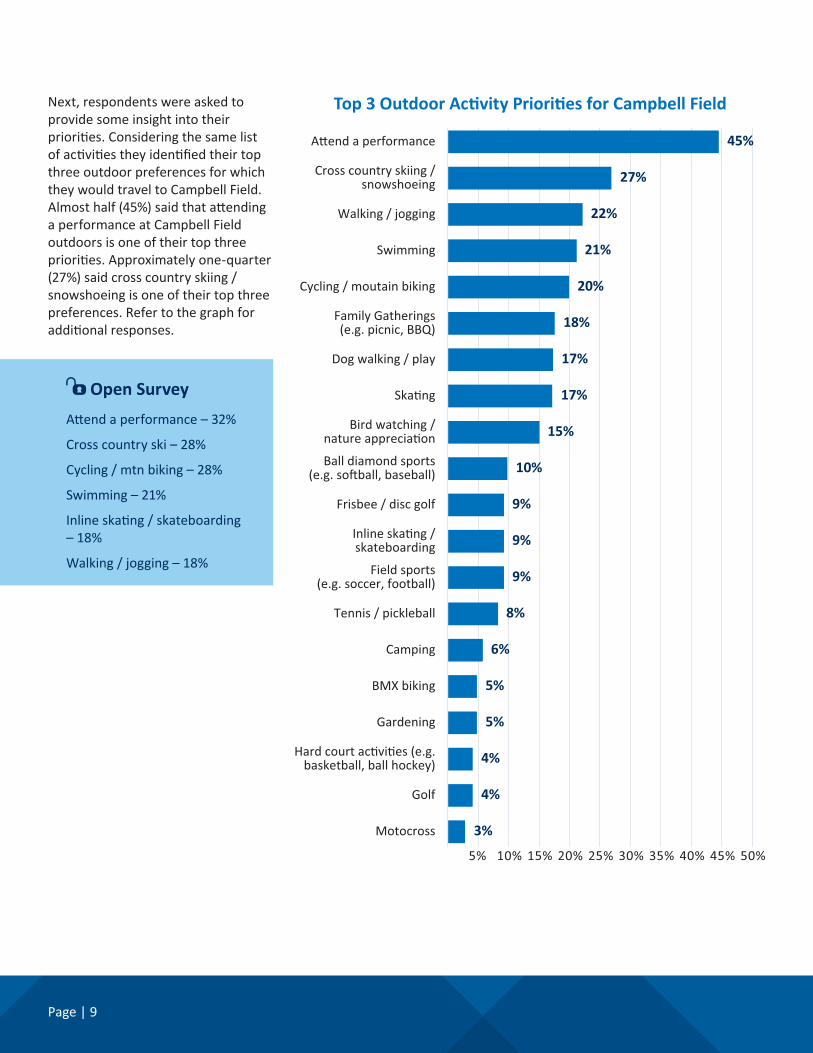
Open SurveyAttendaperformance–70%
Cross country ski – 70%
Cycling/mtnbiking–69%
Family gatherings – 53%
Swimming–53%
Walking/jogging–50%
Givenalistofactivities,respondentswereaskediftheywouldtraveltoCampbellFieldtoparticipateineach.Theywereaskedtoconsiderthetraveltimefromtheirhometothesite as they provided their responses. Activitieswereseparatedintooutdoorandindooractivities.
Outdoor Activities Approximately three-quarters (78%) ofrespondentssaidtheywouldtraveltoCampbellFieldtoattendanoutdoor performance. Approximately two-thirdsofrespondentsarewillingtotraveltothesitetoparticipateincrosscountryskiing/snowshoeing(64%) and family gatherings (60%). Seethegraphforadditionalresults.
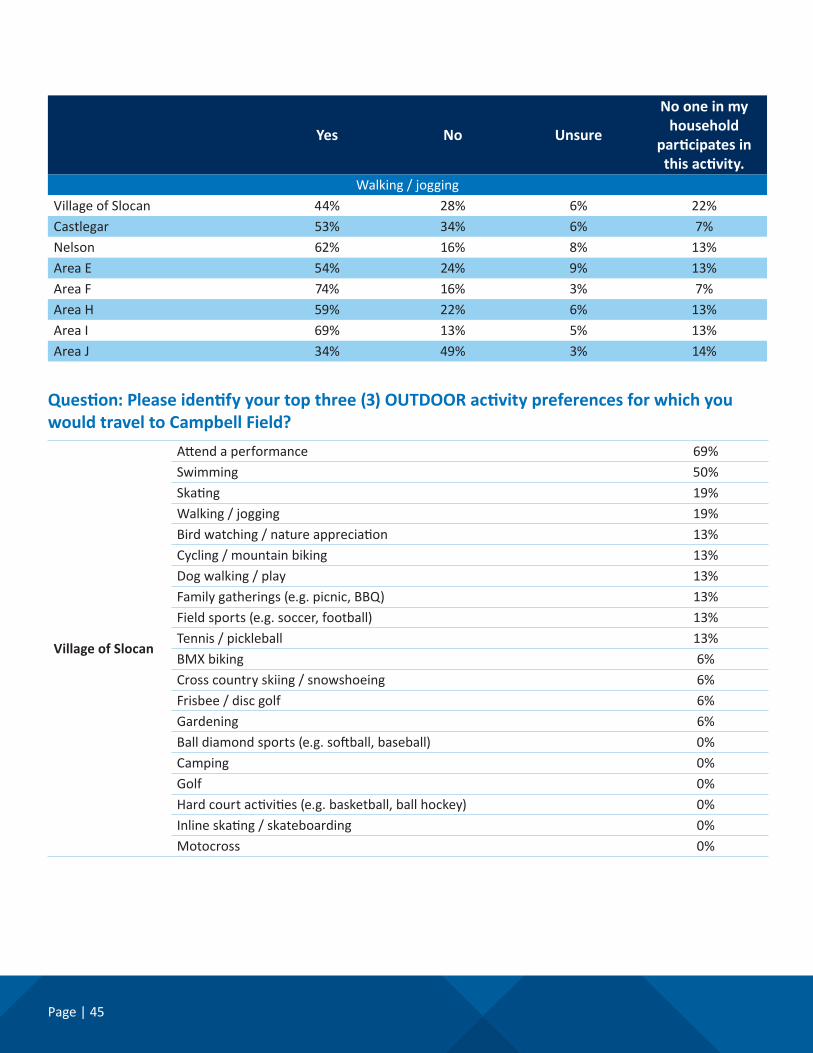
Next,respondentswereaskedtoprovide some insight into their priorities.ConsideringthesamelistofactivitiestheyidentifiedtheirtopthreeoutdoorpreferencesforwhichtheywouldtraveltoCampbellField.Almosthalf(45%)saidthatattendinga performance at Campbell Field outdoors is one of their top three priorities.Approximatelyone-quarter(27%)saidcrosscountryskiing/snowshoeingisoneoftheirtopthreepreferences. Refer to the graph for additionalresponses.
Top 3 Outdoor Activity Priorities for Campbell Field
3%
4%
4%
5%
5%
6%
8%
9%
9%
9%
10%
15%
17%
17%
18%
20%
21%
22%
27%
45%
5% 10% 15% 20% 25% 30% 35% 40% 45% 50%
Motocross
Golf
Hard court ac�vi�es (e.g. basketball, ball hockey)
Consideringonlythosepeoplewhosaid they would support an increase in annual property taxesifitmeantnewrecreationamenitiesweretobedevelopedatCampbellField,thetopoutdooractivitiesare:
• Attendaperformance(42%)
• Swimming(29%)
• Crosscountryskiing/snowshoeing(28%)
• Skating(25%)
• Cycling/mountainbiking(23%)
Page | 11
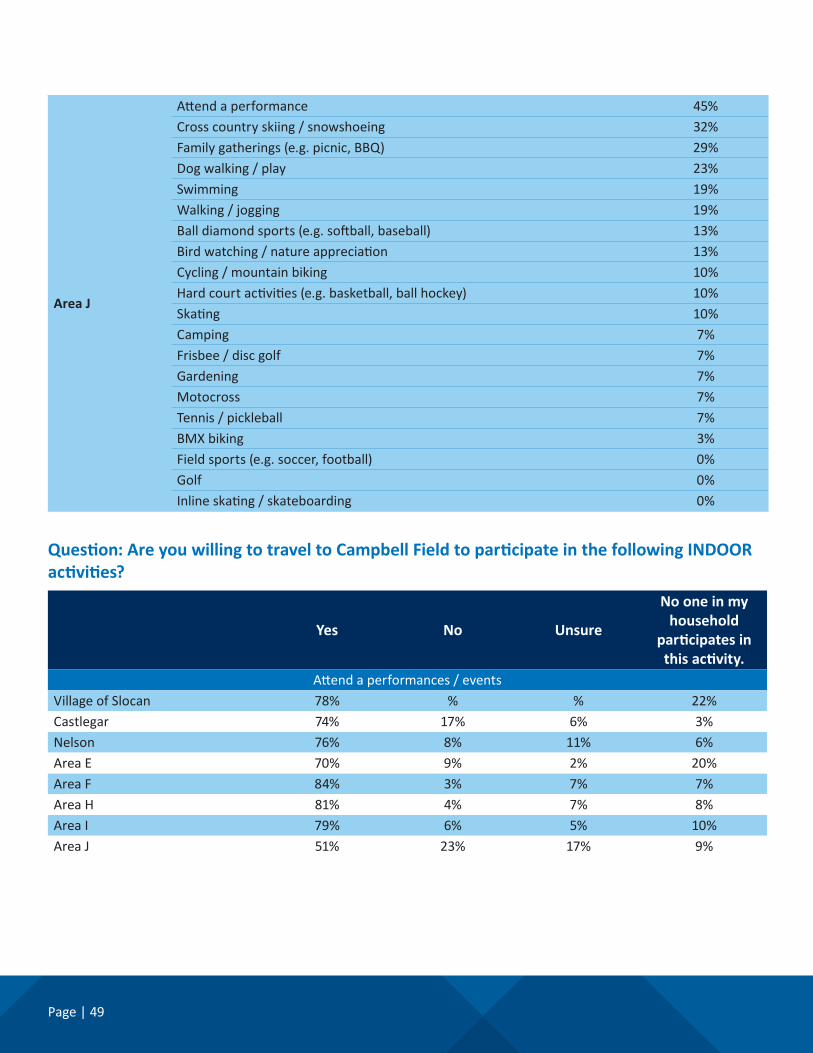
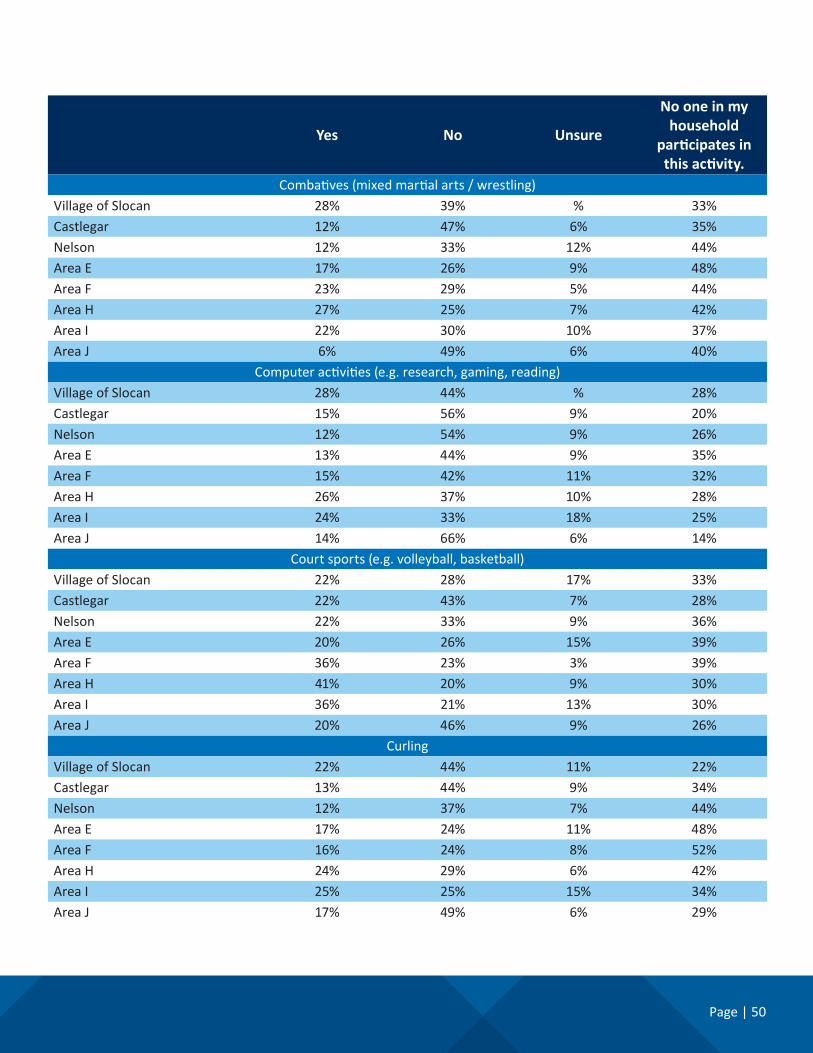
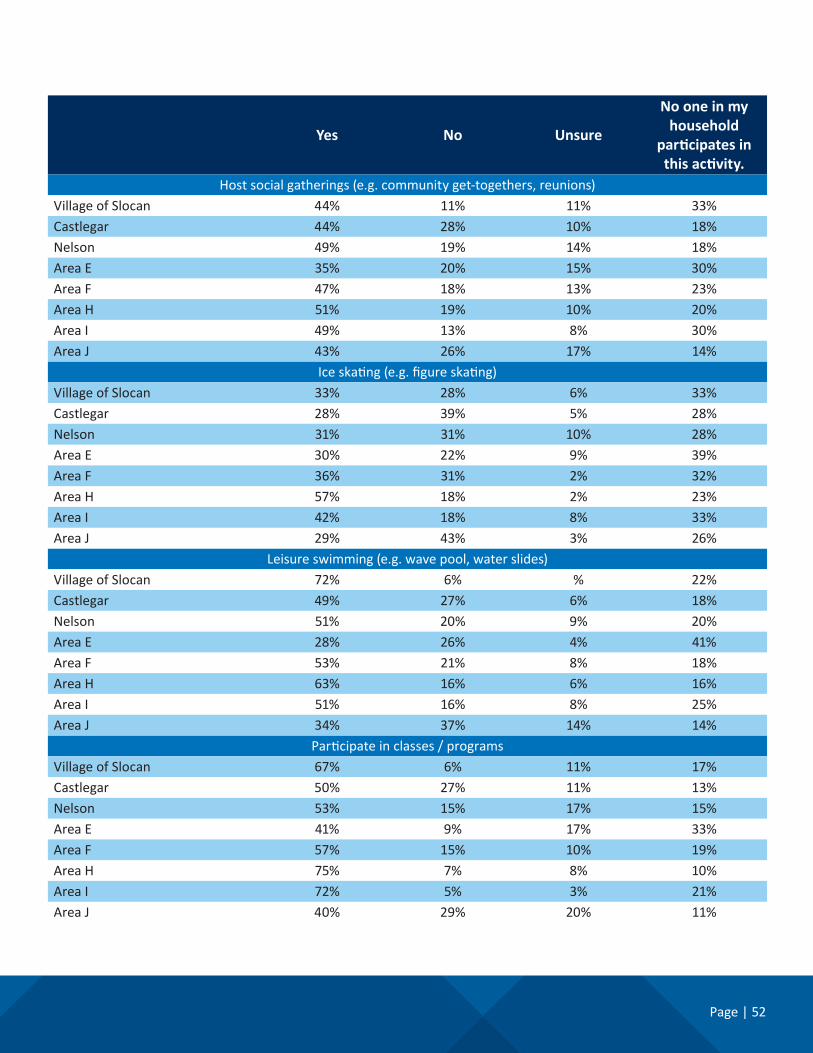
Indoor ActivitiesConsidering the list of indoor activities,approximatelythree-quarters(76%)ofrespondentswouldtraveltoCampbellFieldtoattendaperformance or event indoors. Over halfwouldtraveltoparticipateinclasses/programs(59%)orleisureswimming(53%).
Are you willing to travel to Campbell Field to participate in these INDOOR activities?
Next,respondentswereaskedtoprovide some insight into their priorities.Consideringthesamelistofactivitiestheyidentifiedtheirtop three indoor preferences for whichtheywouldtraveltoCampbellField. Approximately half (53%) said attendingperformances/eventsisatop priority. Approximately one-third identifiedleisureswimming(32%)andfitness/yoga(32%)asatopthreepriority. Refer to the graph for other responses.
Top 3 Indoor Activity Priorities for Campbell Field
Almost half (47%) of respondents wouldsupportanincreaseintheirannual property taxes if it meant thatnewrecreationamenitieswereto be developed at Campbell Field. Approximately one-quarter (26%) wouldnotsupportanincreasewhileasimilarproportion(27%)areunsure.
Would You Support an Increase in Annual Property Taxes?
Yes47%
No26%
Unsure27%
2 4 Willingness to Pay
Open SurveyYes – 55%
No – 17%
Unsure–28%
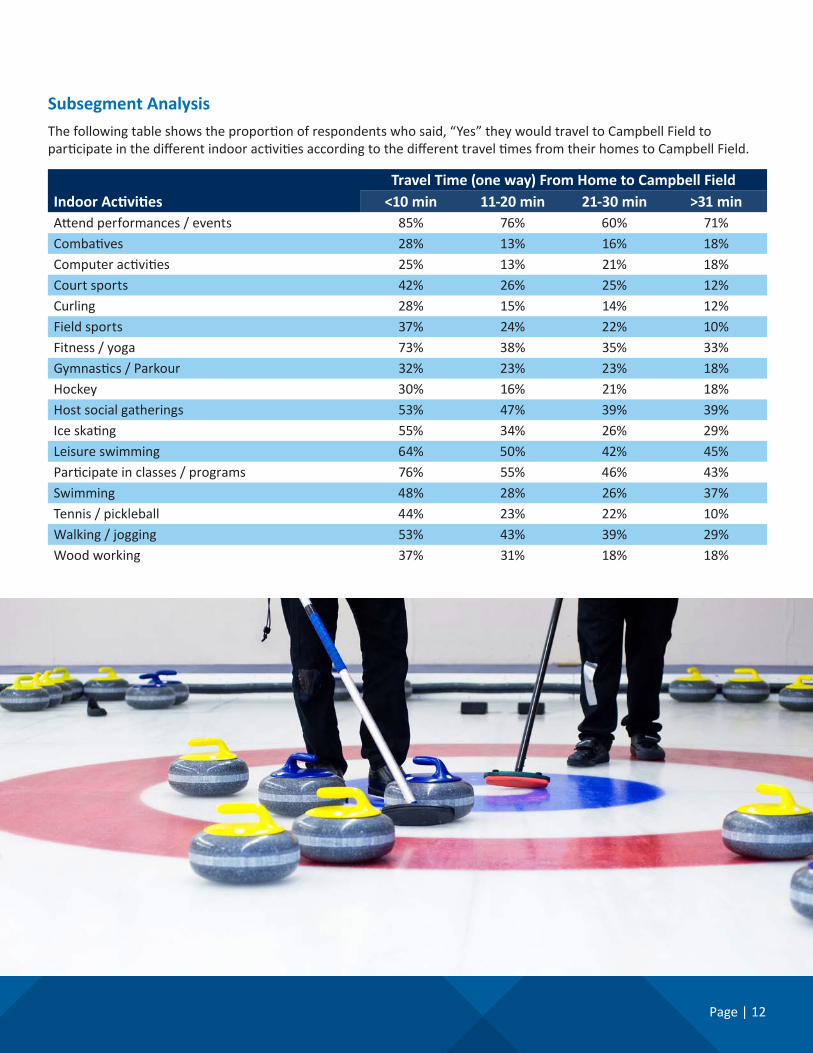
Subsegment AnalysisThefollowingtableshowsthelevelsofsupportforannualpropertytaxincreasesaccordingtotraveltime(oneway)fromtheir homes to Campbell Field.
Travel Time (one way) From Home to Campbell Field<10 min 11-20 min 21-30 min >31 min
2 5 Other CommentsRespondentswereabletoprovideanyothercommentsabout the development at Campbell Field. Comments made byatminimumfifteenrespondentsarenotedbelow.
• Supportdevelopment.Interestinproceedingwiththedevelopmentofrecreationamenitieswasaffirmedbyalarge number of respondents. (96 comments)
• Againstdevelopment.ManydonotwanttoseethedevelopmentcitingexistingfacilitiesinCastlegarandNelson. Others referenced denied enhancements to the Castlegar Complex. (37)
• Support a small tax increase. Some reinforced their supportofataxincreasetosupportnewrecreationfacilitiesdependingupontheamenities,thecosttoaccess,andthebenefitsaccruedtolocalbusiness.(15)
Page | 17
2.6 Respondent ProfileHave long have you lived in the area?
< 1 year 2%1-5 years 17%6-10 years 11%Morethan10years 70%
Community groups delivering services to residents in thestudyareawereinvitedtoparticipateinasurveytogathertheirthoughtsaboutthepotentialdevelopmentatCampbellField.AnemailinvitationwassentoutbytheRDCKtoalistofcommunityorganizationrepresentativesoperatinginthearea.Theinvitationprovidedanoverviewofthestudyandthesurvey;italsorequestedthatasingle response be provided to the survey on behalf theorganization.Alinktotheonlinequestionnairewasincluded in the email and a hard copy version of the questionnairewasattachedforreferenceorforgroupstocompleteandreturn.Seethequestionnaireintheappendix.Severalremindernoticesandmessagesofencouragementweresenttogroupsduringthefieldingwindow.ResponsesweregatheredfromearlyOctober(October6,2020)throughtolateNovember(November20,2020).Intotalthirty-fourorganizationsprovidedaresponse.Thisincludedcommunitysocieties,indoorandoutdoorsportgroups,recreationorganizations,andothers. Please refer to the appendix for a complete list of respondentorganizations.
Page | 19
Age Groups of Primary Participants / Members
10%
20%
30%
40%
50%
60%
70%
80%
59%
Children (0-5 yrs)
68%
Youth (6-12 yrs)
71%
Teens (13-18 yrs)
59%
Adult (19-39 yrs)
56%
Adult (40-64 yrs)
35%
Seniors (65 yrs and older)
Thereisarangeoforganizationsthatparticipatedinthesurveyasevidenced by the list included in the appendix. They include youth focusedsportandrecreationgroups(e.g.NelsonMinorHockey),groupsthat require indoor spaces (e.g. SelkirkChallengersGymnasticsClub)andthoseutilizingoutdoorspaces(e.g. West Kootenay Football Club). Some are structured (e.g. Nelson AirCadets)whileothersaremoreinterestinginunstructuredactivities(e.g. South Slocan Skateboard Club). Respondentsincludecommunity/neighbourhood groups (e.g. Slocan Park Community Hall Society) as wellasmoreformalorganizations(e.g. South Slocan Commission of Management).Respondentsincludeorganizationsthatprovideservicestoallages,asillustratedintheaccompanying graph.
3.1 About Your Organization
Theorganizationsarelargeandsmallwithparticipant/membernumbersranging from near single digits to over a thousand. Some groups represent an interest and so do not have formal numbers. Approximately three-quarters (73%) of respondent groupshavelessthantwohundredmembers.
How many participants belong to your organization?
5%10%15%20%25%30%35%40%45% 41%
<100
32%
100-199
3%
200-299
24%
300 and more
Page | 20
Thetrendoverthelastfewyearsis generally expected to hold for therespondentswithamajorityexperiencinggrowthwithasizeablegroup remaining stable. Those expectingtoexperiencegrowth(74%)overthenextfewyearsislargerthanthenumberwhohavebeenexperiencinggrowth(65%).
While there is variability in terms oftheresidencyofparticipants/membersforgrouprespondents,thegreatestparticipationacrosstherespondentscomesfromNelson,Castlegar,andAreaH.
Participation Trends
10%20%30%40%50%60%70%80%
6% 3%
Declining
29%24%
Remaining Stable
65%74%
Growing
Past Few Years Next Few Years
Page | 21
3 2 Facility & Space AssessmentSatisfaction with Recreation Facilities in the Region
5%10%15%20%25%30%35%
6%
Very Dissa�sfied
34%
SomewhatDissa�sfied
19%
Neither Sa�sfiedor Dissa�sfied
28%
SomewhatSa�sfied
13%
Very Sa�sfied
Thereisalmostanevensplitbetweentheproportionofgroupsdissatisfied(40%)andsatisfied(41%)withtheabilityofrecreationfacilitiesintheregion to meet the groups’ needs for programsandactivities.
• Groups are able to deliver their programs in the spaces currently available to them. In some instances they are usingcommunityspaces,whileinotherinstancestheyareusingprivatefacilitiesoreventheirown.
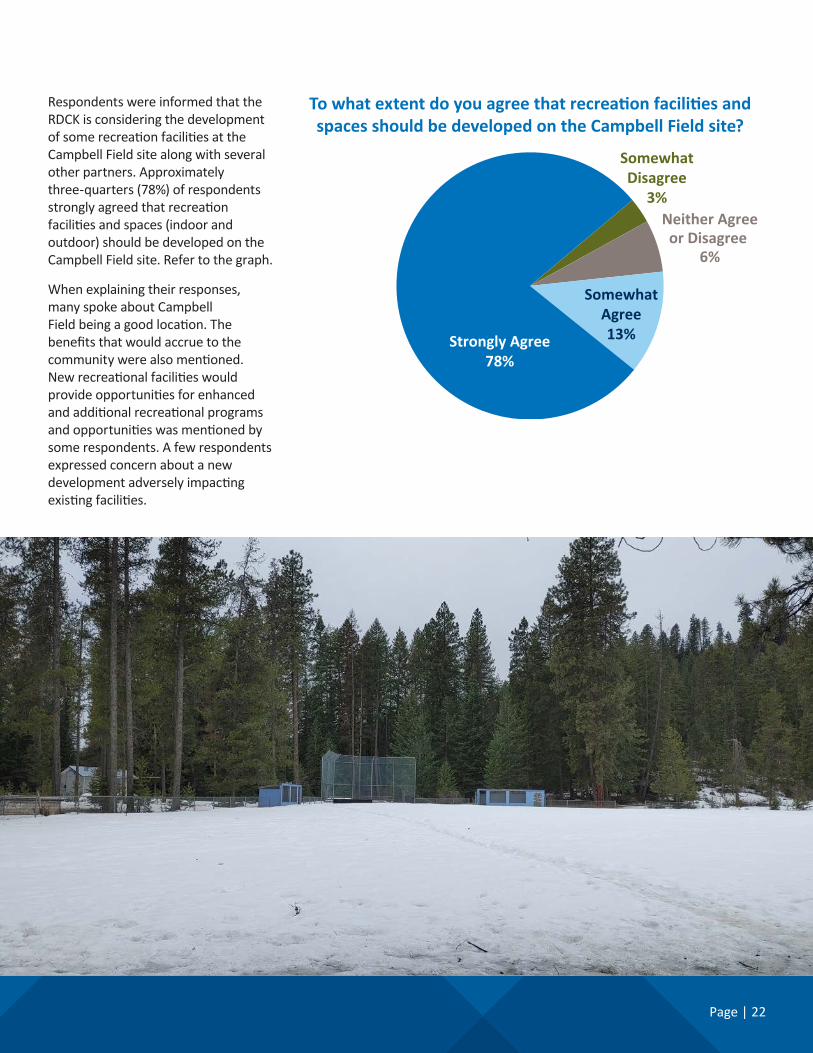
RespondentswereinformedthattheRDCK is considering the development ofsomerecreationfacilitiesattheCampbellFieldsitealongwithseveralother partners. Approximately three-quarters (78%) of respondents stronglyagreedthatrecreationfacilitiesandspaces(indoorandoutdoor) should be developed on the Campbell Field site. Refer to the graph.
Whenexplainingtheirresponses,many spoke about Campbell Fieldbeingagoodlocation.Thebenefitsthatwouldaccruetothecommunitywerealsomentioned.Newrecreationalfacilitieswouldprovideopportunitiesforenhancedandadditionalrecreationalprogramsandopportunitieswasmentionedbysomerespondents.Afewrespondentsexpressedconcernaboutanewdevelopmentadverselyimpactingexistingfacilities.
To what extent do you agree that recreation facilities and spaces should be developed on the Campbell Field site?
SomewhatDisagree
3%Neither Agreeor Disagree
6%
SomewhatAgree13%Strongly Agree
78%
Page | 23
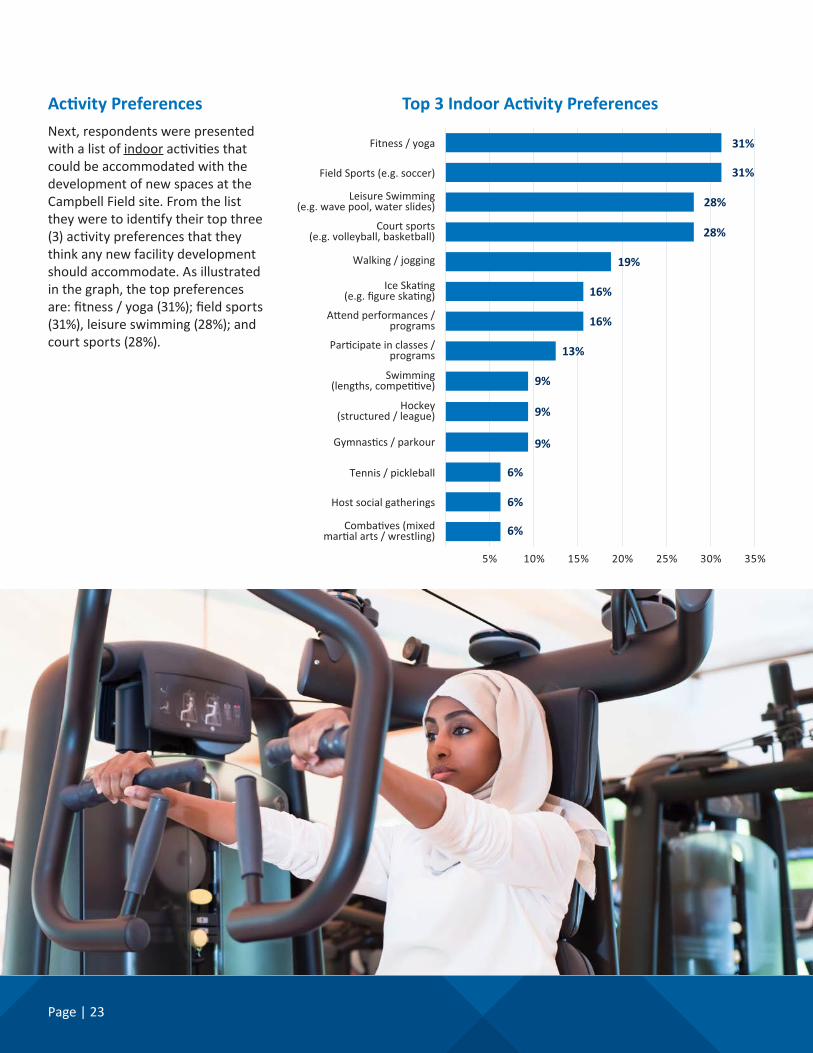
Activity PreferencesNext,respondentswerepresentedwithalistofindooractivitiesthatcouldbeaccommodatedwiththedevelopmentofnewspacesattheCampbell Field site. From the list theyweretoidentifytheirtopthree(3)activitypreferencesthattheythinkanynewfacilitydevelopmentshould accommodate. As illustrated inthegraph,thetoppreferencesare:fitness/yoga(31%);fieldsports(31%),leisureswimming(28%);andcourt sports (28%).
Top 3 Indoor Activity Preferences
6%
6%
6%
9%
9%
9%
13%
16%
16%
19%
28%
28%
31%
31%
5% 10% 15% 20% 25% 30% 35%
Comba�ves (mixed mar�al arts / wrestling)
Host social gatherings
Tennis / pickleball
Gymnas�cs / parkour
Hockey (structured / league)
Swimming (lengths, compe��ve)
Par�cipate in classes / programs
A�end performances / programs
Ice Ska�ng (e.g. figure ska�ng)
Walking / jogging
Court sports (e.g. volleyball, basketball)
Leisure Swimming (e.g. wave pool, water slides)
Field Sports (e.g. soccer)
Fitness / yoga
Page | 24
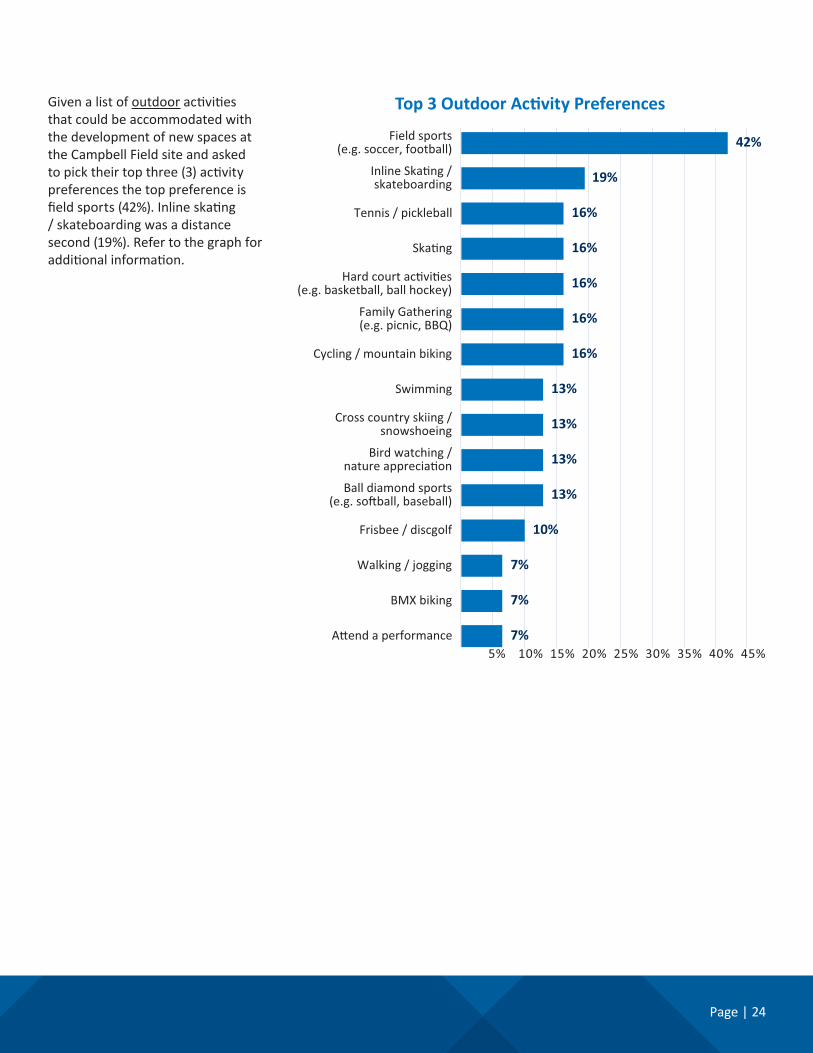
Given a list of outdooractivitiesthatcouldbeaccommodatedwiththedevelopmentofnewspacesatthe Campbell Field site and asked topicktheirtopthree(3)activitypreferences the top preference is fieldsports(42%).Inlineskating/skateboardingwasadistancesecond (19%). Refer to the graph for additionalinformation.
Hard court ac�vi�es (e.g. basketball, ball hockey)
Ska�ng
Tennis / pickleball
Inline Ska�ng / skateboarding
Field sports (e.g. soccer, football)
Page | 25
Approximately three-quarters of respondentssaidtheywouldsupportan increase in facility user fees or rental fees beyond the current rates ifitmeantthatnewrecreationamenitiesweretobedevelopedatCampbell Field. Refer to the graph.
Would you support an increase in user fees or rental fees to develop new recreation amenities in Campbell Field?
3 3 Willingness to Pay
No6%
Unsure22%
Yes72%
3 4 Other CommentsFinally,respondentswereabletoshareanythoughtstheyhadaboutthepotentialdevelopmentatCampbellField.Manygroupsreiteratedtheneed for the potential developmentatCampbellField,particularlyindoorspacesthatcansupportamultitudeofactivitiesandthatcanofferspacesthatarenotavailableatallinthearea.Concernwasexpressedbyonerespondentaboutnotduplicatingthehallspacethatisavailablethroughouttheareahowever.Somegroupsexpressedinterestinbeingfurther involved as the planning and development for afacilityunfolds.AffordabilitytouseanewfacilitywasmentionedasanimportantconsiderationaswastherecognitionoftheIndigenouscultureinthearea.
Page | 26
4 Student Survey
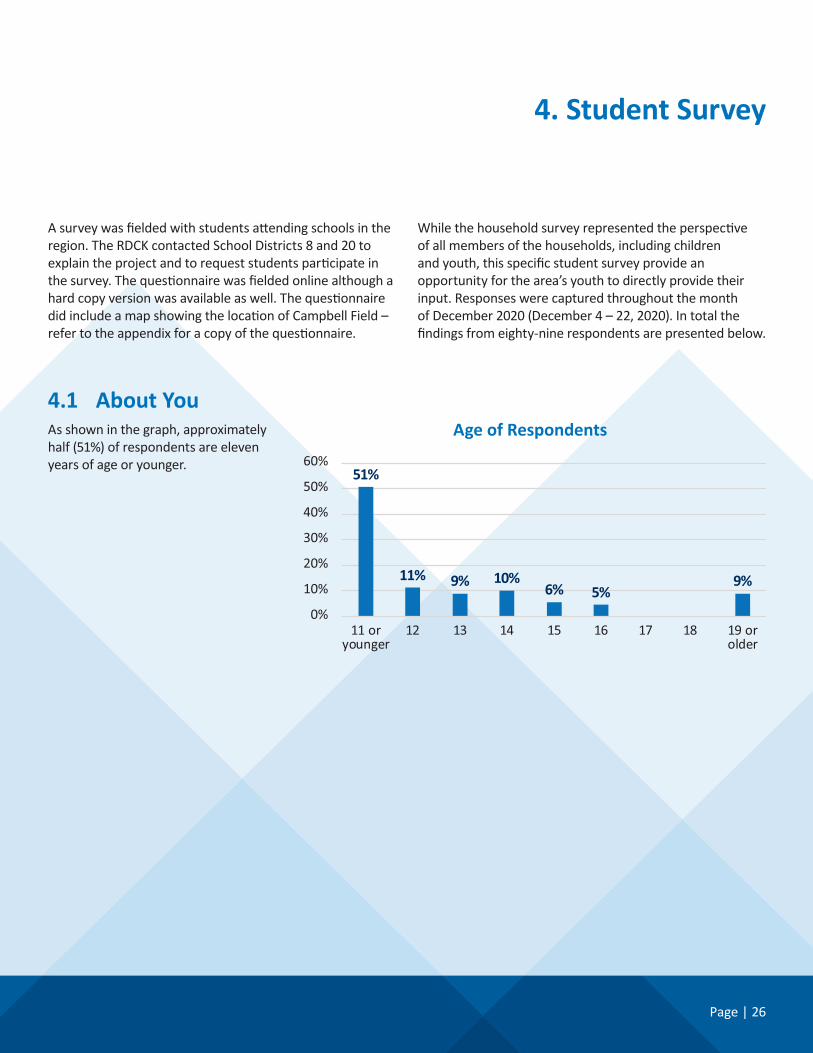
Asurveywasfieldedwithstudentsattendingschoolsintheregion. The RDCK contacted School Districts 8 and 20 to explaintheprojectandtorequeststudentsparticipateinthesurvey.Thequestionnairewasfieldedonlinealthoughahardcopyversionwasavailableaswell.ThequestionnairedidincludeamapshowingthelocationofCampbellField–refertotheappendixforacopyofthequestionnaire.
Whilethehouseholdsurveyrepresentedtheperspectiveofallmembersofthehouseholds,includingchildrenandyouth,thisspecificstudentsurveyprovideanopportunity for the area’s youth to directly provide their input.ResponseswerecapturedthroughoutthemonthofDecember2020(December4–22,2020).Intotalthefindingsfromeighty-ninerespondentsarepresentedbelow.
4 1 About YouAsshowninthegraph,approximatelyhalf (51%) of respondents are eleven years of age or younger.
Age of Respondents
51%
11% 9% 10%6% 5%
9%
0%
10%
20%
30%
40%
50%
60%
11 oryounger
12 13 14 15 16 17 18 19 orolder
Page | 27
Schools of Respondents
Means of Traveling to Campbell Field
5%
6%
9%
9%
14%
14%
18%
26%
0% 5% 10% 15% 20% 25% 30%
Other
Rosemont Elementary
Mount Sen�nel Secondary
W.E. Graham Elementary and Secondary
Brent Kennedy Elementary
LV Rogers Secondary School
South Nelson Elementary
Trafalgar Middle School
11%
11%
24%
22%
22%
38%
68%
0% 10% 20% 30% 40% 50% 60% 70% 80%
I wouldn't travel to Campbell Field
I could drive myself
Walk / scooter / skateboard
Public transportaon
School bus
Bicycle
I could get a ride from someone
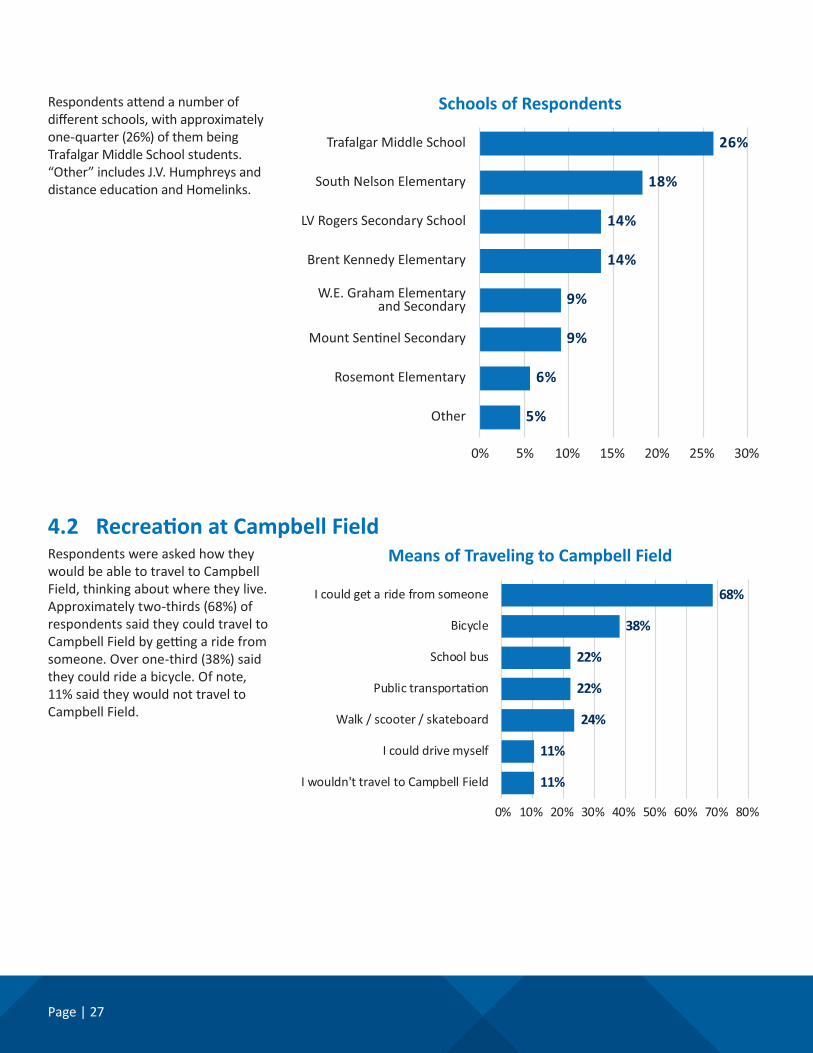
Respondentsattendanumberofdifferentschools,withapproximatelyone-quarter (26%) of them being TrafalgarMiddleSchoolstudents.“Other”includesJ.V.HumphreysanddistanceeducationandHomelinks.
RespondentswereaskedhowtheywouldbeabletotraveltoCampbellField,thinkingaboutwheretheylive.Approximatelytwo-thirds(68%)ofrespondents said they could travel to CampbellFieldbygettingaridefromsomeone. Over one-third (38%) said theycouldrideabicycle.Ofnote,11%saidtheywouldnottraveltoCampbell Field.
4.2 Recreation at Campbell Field
Page | 28
Activity PrioritiesGiven a list of outdoorrecreationactivities,respondentswereaskedto pick the top three (3) that people should be able to do at Campbell Field.Asillustratedinthegraph,cycling/mountainbiking(36%)andfieldsports(31%)werethetopprioritieswithapproximatelyone-third of respondents saying those activitiesareintheirtopthree.1
1 Considering only those respondents who said they would travel to Campbell Field, the top priorityactivitiesremainedthesame.
Top Three OUTDOOR Activities that Should Be Accommodated at Campbell Field
3%
3%
5%
7%
7%
8%
8%
9%
11%
11%
13%
15%
15%
16%
17%
19%
21%
23%
31%
36%
0% 5% 10% 15% 20% 25% 30% 35% 40%
Bird watching / nature apprecia�on
Golf
Gardening
Camping
Tennis / pickleball
Frisbee / disc golf
Motocross
A�end a performance
Dog walking / play
Walking / jogging
Inline ska�ng / skateboarding
Hard court ac�vi�es (e.g. basketball, ball hockey)
Ska�ng
Ball diamond sports (e.g. so�ball, baseball)
Cross country skiing / snowshoeing
Family gatherings (e.g. picnic, BBQ)
BMX biking
Swimming
Field sports (e.g. soccer, football)
Cycling / mountain biking
Page | 29
Top Three INDOOR Activities that Should Be Accommodated at Campbell Field
1%
3%
3%
4%
5%
7%
11%
15%
16%
17%
19%
21%
24%
25%
27%
36%
52%
0% 10% 20% 30% 40% 50% 60%
Tennis / pickleball
Curling
Walking / jogging
Computer ac�vi�es
Comba�ves (mixed mar�al arts / wrestling)
Wood working
Par�cipate in classes / programs
Swimming (lengths, compe��ve)
Host social gatherings
Field sports (e.g. soccer)
A�end performances / events
Fitness / yoga
Hockey (structure / league)
Court sports (e.g. volleyball, basketball)
Ice ska�ng (e.g. figure ska�ng)
Gymnas�cs / parkour
Leisure swimming
Given a list of indoorrecreationactivities,respondentswereaskedto pick the top three (3) that people should be able to do at Campbell Field.Asillustratedinthegraph,leisureswimming(52%)andgymnastics/parkour(36%)werethetopprioritieswithapproximatelyone-third of respondents saying thoseactivitiesareintheirtopthree.2
Other CommentsRespondentswereabletoprovideany comments about building recreationfacilitiesandspacesat Campbell Field. Primarily the commentswerereiteratingthedesireforamenitiesandthetypesofamenitiestobedevelopedincludingaquaticfacilitiesandartificialice.Therewereacoupleofseparaterequestsfortrackandfieldamenitiesto be developed including a 400m track.Theneedforamenitiestosupportunstructuredrecreationwasmentionedaswell.Otherssupportedthelocation.
2 Considering only those respondents who said they would travel to Campbell Field, the top priorityactivitiesremainedthesame.
Household Survey • Over one-quarter (29%) of respondents to the householdsurveylivewithina10minutedriveofCampbell Field. Approximately half (54%) live 11-20 minutesaway.
Community Group Survey • Approximately three-quarters (74%) of groups expect toseeparticipationratesgrowinthenextfewyears.
• Approximately three-quarters (78%) strongly agree and afurther13%somewhatagreethatrecreationfacilitiesand spaces should be developed at the Campbell Field site.
• Topindooractivitypreferencesinclude:
» Fitness/yoga
» Field sports
» Leisureswimming
» Courtsports(e.g.volleyball,basketball)
• Topoutdooractivitypreferencesinclude:
» Fieldsports(e.g.soccer,football)
» Inlineskating/skateboarding
• Approximately three-quarters (72%) of groups are willingtopayanincreaseinuser/rentalfeestodevelopnewrecreationamenitiesinCampbellField.
Student Survey • Approximately three-quarters (74%) of groups expect toseeparticipationratesgrowinthenextfewyears.
• Outdooractivitypreferencesincludethefollowing:
» Cycling/mountainbiking
» Field sports
» Swimming
» BMXbiking
» Family gatherings
• Indooractivitypreferencesincludethefollowing:
» Leisureswimming
» Gymnastics/parkour
» Iceskating
» Courtsports(e.g.volleyball,basketball)
» Hockey
Page | 32
Appendix
Appendix A: Post Card
rdck.ca
Do you live in Castlegar, Nelson or Village of Slocan? What about Areas E, F, H (South), I or J (Bombi North)?The Regional District of Central Kootenay along with several partners is planning for the possible development of recreation amenities on Campbell Field. To properly plan for this potential development it is important to hear from area residents.
Your household is invited to participate in the survey!To participate in the survey, please visit www.rdck.ca/CampbellField and use your code below when prompted.
Your survey access code:
XXXXXXXX
For a paper copy of the survey email [email protected]. For technical issues with the survey contact RC Strategies at 1.877.727.9204 (toll free).
Campbell Field Reimagination Project Household Survey
Campbell Field Reimagination ProjectRecreation Amenity Potential
Household Survey Your input is important!
Kootenay River
Slocan River
Hig
hway 3
a & 6
Hig
hw
ay
3a
Hig
hw
ay
6S
loca
n Va
lley H
erita
ge
Trail
Sloca
n Val
ley
Her
itag
e Tr
ail
Playmor Junction
Campbell Field8.6 acres (3.5 hectares)
Campbell Field
Brent Kennedy Elementary
Mount Sentinel Secondary School
What recreation amenities would you like to see developed at
Campbell Field?
Win a $100 Visa Gift Card!
Page | 33
Appendix B: Household Questionnaire
Campbell Field Reimagination ProjectHousehold Questionnaire
In 2016 the Regional District of Central Kootenay (RDCK) acquired Campbell Field thanks to a generous donation from the South Slocan Sports Association. Sitting beside the Mount Sentinel Secondary School near the Playmor Junction, this 3.5 hectare site presents a significant opportunity for the development of recreation amenities (indoor and outdoor) to satisfy the needs of residents in the broader area.
The RDCK has several Recreation Master Plans in place that serve as great references for potential amenity needs. However, it is important to hear from residents that may benefit from any new recreation amenities. This includes residents from Castlegar, Nelson, Village of Slocan, and Areas E, F, H (South), I, and J (Bombi North).
Please answer the following questions considering the views of all people in your household by the end of October. As a token of thanks for participating in the survey, your name (one per household) will be entered into a draw for a $100 Visa Gift Card. To be included in the draw complete the entry form below. Your contact information will be utilized solely for the purposes of the draw and will not be reported in connection with any of the responses you have provided.
If you have any questions or would like a hard copy of the questionnaire to fill out please contact [email protected].
Draw Entry Form
Name (first name only):
Phone Number:
Personal information you provide in this questionnaire is collected pursuant to section 26 of the Freedom of Information and Protection of Privacy Act. This information will be used for the purpose of developing new recreation amenities OR contacting the winner of the draw.
Questions about the collection of this information may be directed to the Privacy Officer, 250-352-6665, [email protected] or Box 590, 202 Lakeside Drive, Nelson, BC V1L 5R4.
For more information [email protected] | 250.352.6665 | 1.800.268.7325 (BC) | or visit rdck.ca
Page | 34
Page | 2
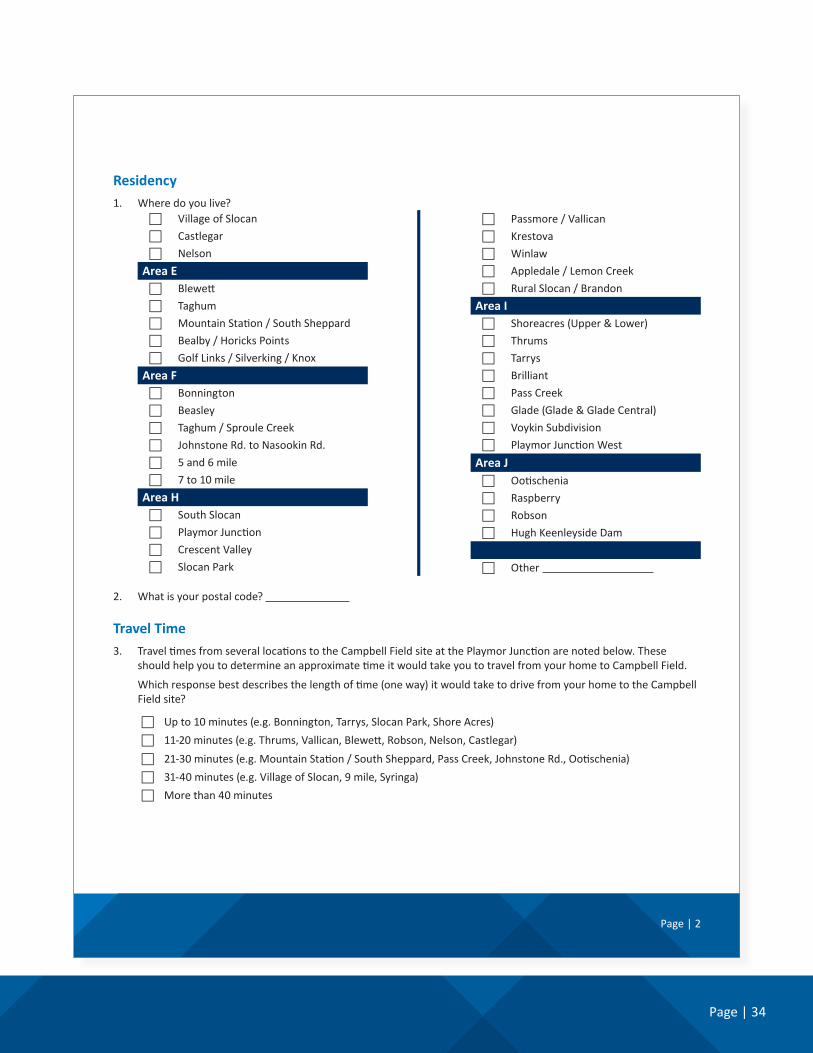
Residency1. Where do you live?
c Village of Slocan
c Castlegar
c Nelson
Area Ec Blewett
c Taghum
c Mountain Station / South Sheppard
c Bealby / Horicks Points
c Golf Links / Silverking / Knox
Area Fc Bonnington
c Beasley
c Taghum / Sproule Creek
c Johnstone Rd. to Nasookin Rd.
c 5 and 6 mile
c 7 to 10 mile
Area H c South Slocan
c Playmor Junction
c Crescent Valley
c Slocan Park
c Passmore / Vallican
c Krestova
c Winlaw
c Appledale / Lemon Creek
c Rural Slocan / Brandon
Area Ic Shoreacres (Upper & Lower)
c Thrums
c Tarrys
c Brilliant
c Pass Creek
c Glade (Glade & Glade Central)
c Voykin Subdivision
c Playmor Junction West
Area J c Ootischenia
c Raspberry
c Robson
c Hugh Keenleyside Dam
c Other
2. What is your postal code?
Travel Time3. Travel times from several locations to the Campbell Field site at the Playmor Junction are noted below. These
should help you to determine an approximate time it would take you to travel from your home to Campbell Field.
Which response best describes the length of time (one way) it would take to drive from your home to the Campbell Field site?
c Up to 10 minutes (e.g. Bonnington, Tarrys, Slocan Park, Shore Acres)
c 11-20 minutes (e.g. Thrums, Vallican, Blewett, Robson, Nelson, Castlegar)
c 21-30 minutes (e.g. Mountain Station / South Sheppard, Pass Creek, Johnstone Rd., Ootischenia)
c 31-40 minutes (e.g. Village of Slocan, 9 mile, Syringa)
c More than 40 minutes
Page | 35
Page | 3
Willingness to TravelConsidering the time it would take to travel from your home to Campbell Field, please indicate whether you would travel there to participate in the following activities. (Note: the activities listed are based on community input and discussions throughout the previous master planning processes.)
4. Are you willing to travel to Campbell Field to participate in each of the following outdoor activities?
Outdoor Activities Yes No UnsureNo one in my household participates in this activity.
Attend a performance c c c c
Ball diamond sports (e.g. softball, baseball)
c c c c
Bird watching / nature appreciation
c c c c
BMX biking c c c c
Camping c c c c
Cross country skiing / snowshoeing
c c c c
Cycling / mountain biking c c c c
Dog walking / play c c c c
Family gatherings (e.g. picnic, BBQ)
c c c c
Field sports (e.g. soccer / football)
c c c c
Frisbee / Disc golf c c c c
Gardening c c c c
Golf c c c c
Hard court activities (e.g. basketball, ball hockey)
c c c c
Inline skating / skateboarding c c c c
Motocross c c c c
Skating c c c c
Swimming c c c c
Tennis / pickleball c c c c
Walking/ jogging c c c c
Other (please specify): c c c c
Other (please specify): c c c c
Page | 36
Page | 4
a. From the list below, please identify your top three (3) outdoor activity preferences for which you would travel to Campbell Field to participate in.
c Attend a performance c Gardening
c Ball diamond sports (e.g. softball, baseball) c Golf
c Bird watching / nature appreciation c Hard court activities (e.g. basketball, ball hockey)
c BMX biking c Inline skating / skateboarding
c Camping c Motocross
c Cross country skiing / snowshoeing c Skating
c Cycling / mountain biking c Swimming
c Dog walking / play c Tennis / pickleball
c Family gatherings (e.g. picnic, BBQ) c Walking/ jogging
c Field sports (e.g. soccer / football) c Other (please specify):
c Frisbee / Disc golf c Other (please specify):
Page | 37
Page | 5
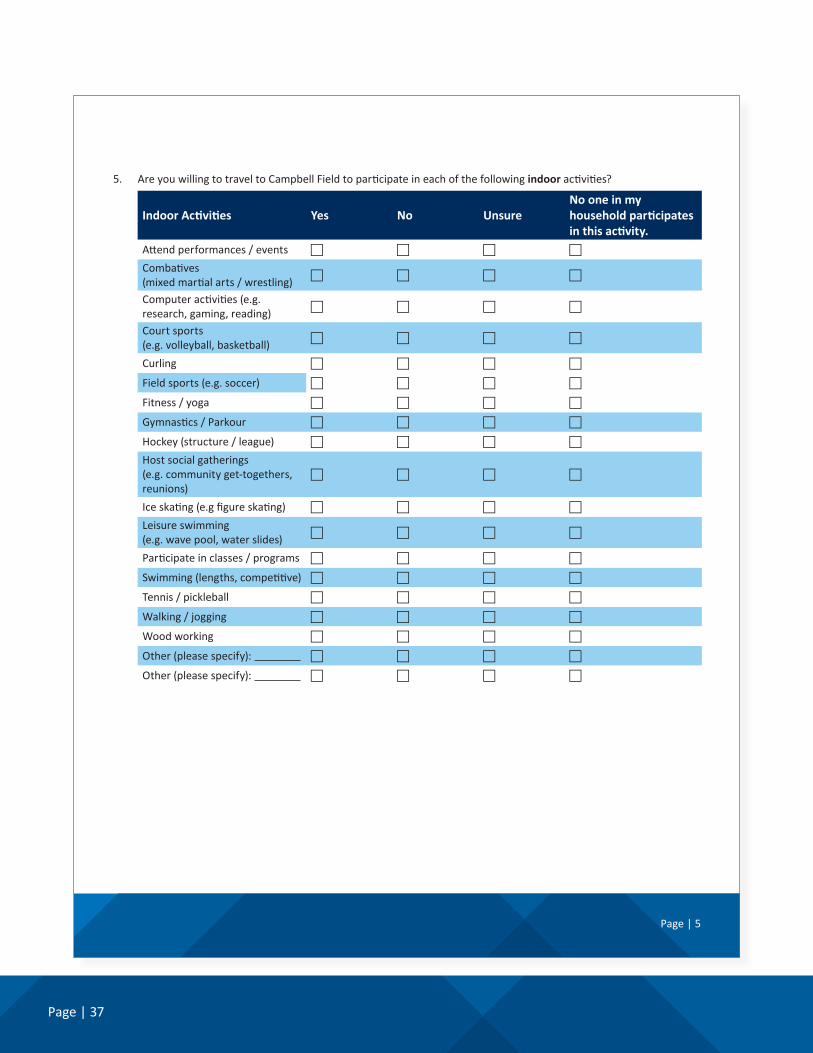
5. Are you willing to travel to Campbell Field to participate in each of the following indoor activities?
Indoor Activities Yes No UnsureNo one in my household participates in this activity.
c Court sports (e.g. volleyball, basketball) c Swimming (lengths, competitive)
c Curling c Tennis / pickleball
c Field sports (e.g. soccer) c Walking / jogging
c Fitness / yoga c Wood working
c Gymnastics / Parkour c Other (please specify):
c Hockey (structure / league) c Other (please specify):
cHost social gatherings (e.g. community get-togethers, reunions)
Willingness to Pay 6. Would you support an increase in your annual property taxes if it meant that new recreation amenities were to be
developed at Campbell Field?
c Yes c No c Unsure
Other Comments7. Please use the space below to provide any other comments you may have about the development of Campbell
Field.
Page | 39
Page | 7
Respondent Profile 8. How long have you lived in the area? (Castlegar, Nelson, Village of Slocan, Areas E, F, H (south), I, and J (Bombi north)
c Less than 1 year
c 1-5 years
c 6-10 years
c More than 10 years
9. Please describe your household by identifying the number of members in each of the age groups.
0 - 4 yrs 5 - 9 yrs 10 - 14 yrs 15 - 19 yrs
20 - 29 yrs 30 - 39 yrs 40 - 49 yrs 50 - 59 yrs
60 - 69 yrs 70 - 79 yrs 80 years and older
Thank you very much for providing your answers. Your input is very important as the RDCK and its partners reimagine the Campbell Field site.
Page | 40
Appendix C: Coded Survey Findings by Electoral AreaQuestion: Are you willing to travel to Campbell Field to participate in the following OUTDOOR activities?
Yes No Unsure
No one in my household
participates in this activity.
AttendaperformanceVillageofSlocan 78% 11% 11%Castlegar 72% 15% 10% 3%Nelson 79% 4% 12% 6%Area E 74% 7% 2% 17%Area F 87% 2% 10% 2%Area H 84% 3% 10% 3%Area I 79% 6% 8% 8%AreaJ 54% 23% 14% 9%
Balldiamondsports(e.g.softball,baseball)VillageofSlocan 39% 33% 28%Castlegar 19% 40% 11% 30%Nelson 20% 27% 8% 45%Area E 22% 24% 15% 39%Area F 32% 29% 3% 36%Area H 42% 18% 8% 32%Area I 40% 16% 3% 40%AreaJ 29% 46% 9% 17%
Birdwatching/natureappreciationVillageofSlocan 39% 28% 17% 17%Castlegar 39% 34% 10% 16%Nelson 57% 15% 11% 17%Area E 61% 13% 11% 15%Area F 68% 11% 13% 8%Area H 51% 18% 11% 20%Area I 55% 16% 10% 18%AreaJ 29% 43% 9% 20%
Page | 41
Yes No Unsure
No one in my household
participates in this activity.
BMXbikingVillageofSlocan 17% 44% 39%Castlegar 15% 42% 3% 40%Nelson 19% 30% 7% 45%Area E 20% 22% 9% 50%Area F 31% 24% 3% 42%Area H 27% 25% 6% 42%Area I 19% 25% 8% 48%AreaJ 9% 43% 11% 37%
CampingVillageofSlocan 11% 61% 28%Castlegar 36% 42% 7% 15%Nelson 36% 33% 16% 16%Area E 22% 48% 4% 26%Area F 37% 44% 11% 8%Area H 16% 51% 12% 21%Area I 25% 40% 12% 22%AreaJ 23% 54% 9% 14%
Crosscountryskiing/snowshoeingVillageofSlocan 44% 22% 11% 22%Castlegar 51% 29% 4% 15%Nelson 71% 11% 8% 11%Area E 72% 11% 2% 15%Area F 74% 8% 10% 8%Area H 64% 20% 6% 11%Area I 69% 8% 12% 12%AreaJ 54% 26% 3% 17%
Cycling/mountainbikingVillageofSlocan 50% 33% 17%Castlegar 42% 29% 10% 19%Nelson 59% 16% 9% 16%Area E 63% 13% 7% 17%Area F 65% 15% 3% 18%Area H 58% 21% 6% 15%Area I 60% 10% 8% 22%AreaJ 31% 31% 11% 26%
Page | 42
Yes No Unsure
No one in my household
participates in this activity.
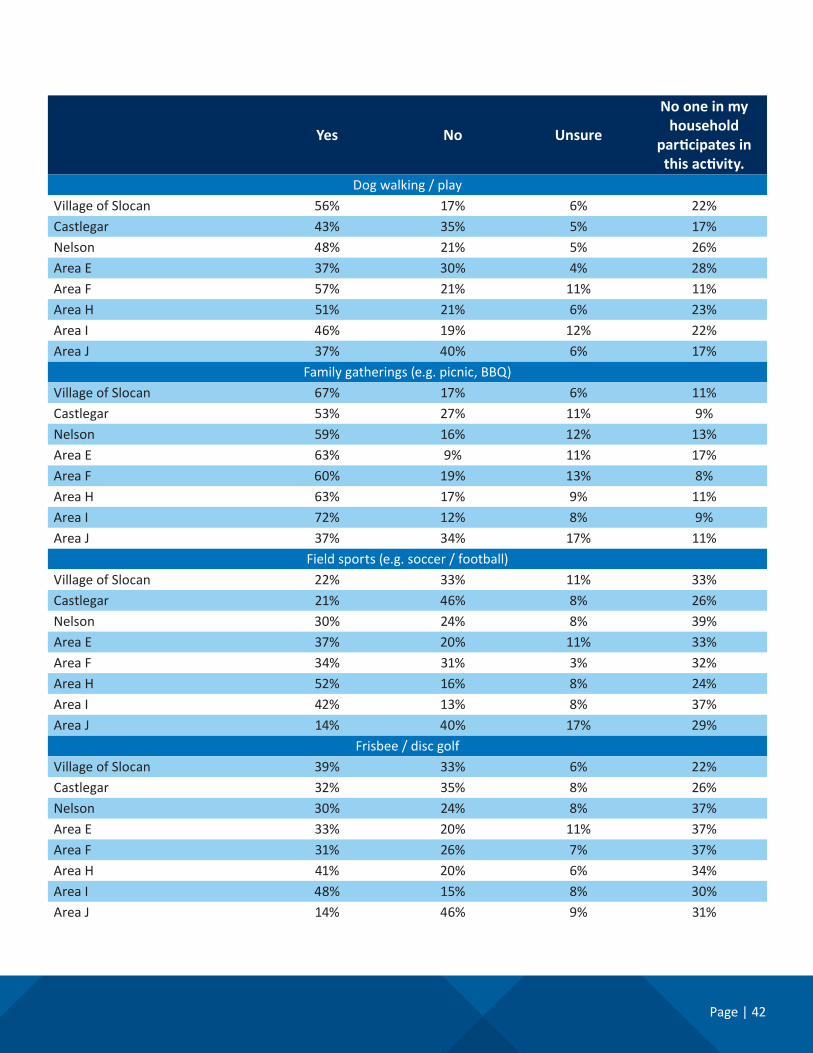
Dogwalking/playVillageofSlocan 56% 17% 6% 22%Castlegar 43% 35% 5% 17%Nelson 48% 21% 5% 26%Area E 37% 30% 4% 28%Area F 57% 21% 11% 11%Area H 51% 21% 6% 23%Area I 46% 19% 12% 22%AreaJ 37% 40% 6% 17%
Familygatherings(e.g.picnic,BBQ)VillageofSlocan 67% 17% 6% 11%Castlegar 53% 27% 11% 9%Nelson 59% 16% 12% 13%Area E 63% 9% 11% 17%Area F 60% 19% 13% 8%Area H 63% 17% 9% 11%Area I 72% 12% 8% 9%AreaJ 37% 34% 17% 11%
Fieldsports(e.g.soccer/football)VillageofSlocan 22% 33% 11% 33%Castlegar 21% 46% 8% 26%Nelson 30% 24% 8% 39%Area E 37% 20% 11% 33%Area F 34% 31% 3% 32%Area H 52% 16% 8% 24%Area I 42% 13% 8% 37%AreaJ 14% 40% 17% 29%
Frisbee/discgolfVillageofSlocan 39% 33% 6% 22%Castlegar 32% 35% 8% 26%Nelson 30% 24% 8% 37%Area E 33% 20% 11% 37%Area F 31% 26% 7% 37%Area H 41% 20% 6% 34%Area I 48% 15% 8% 30%AreaJ 14% 46% 9% 31%
Page | 43
Yes No Unsure
No one in my household
participates in this activity.
GardeningVillageofSlocan 22% 44% 11% 22%Castlegar 22% 54% 9% 15%Nelson 21% 46% 13% 20%Area E 15% 48% 9% 28%Area F 24% 44% 15% 18%Area H 29% 46% 6% 18%Area I 28% 33% 15% 24%AreaJ 6% 60% 14% 20%
GolfVillageofSlocan 11% 50% 11% 28%Castlegar 21% 50% 6% 23%Nelson 15% 38% 5% 42%Area E 15% 39% 2% 44%Area F 26% 32% 10% 32%Area H 21% 37% 6% 36%Area I 31% 33% 6% 30%AreaJ 17% 49% 9% 26%
Hardcourtactivities(e.g.basketball,ballhockey)VillageofSlocan 17% 44% 6% 33%Castlegar 16% 48% 9% 27%Nelson 17% 36% 11% 36%Area E 28% 35% 9% 28%Area F 27% 31% 13% 29%Area H 44% 18% 7% 31%Area I 36% 21% 6% 37%AreaJ 26% 40% 9% 26%
Inlineskating/skateboardingVillageofSlocan 17% 44% 39%Castlegar 21% 46% 3% 30%Nelson 29% 24% 9% 38%Area E 26% 24% 13% 37%Area F 32% 31% 5% 32%Area H 39% 21% 6% 34%Area I 25% 24% 6% 45%AreaJ 9% 46% 6% 40%
Page | 44
Yes No Unsure
No one in my household
participates in this activity.
MotocrossVillageofSlocan 56% 44%Castlegar 9% 48% 4% 39%Nelson 6% 41% 3% 50%Area E 13% 35% 9% 44%Area F 16% 37% 3% 44%Area H 18% 38% 1% 43%Area I 9% 40% 3% 48%AreaJ 6% 51% 3% 40%
SkatingVillageofSlocan 33% 33% 11% 22%Castlegar 34% 45% 5% 15%Nelson 47% 20% 9% 24%Area E 39% 20% 11% 30%Area F 50% 21% 13% 16%Area H 66% 13% 5% 17%Area I 48% 19% 10% 22%AreaJ 23% 46% 9% 23%
SwimmingVillageofSlocan 67% 6% 6% 22%Castlegar 39% 44% 5% 13%Nelson 45% 27% 8% 19%Area E 39% 26% 9% 26%Area F 53% 31% 10% 7%Area H 64% 17% 7% 12%Area I 51% 19% 12% 18%AreaJ 31% 43% 11% 14%
Tennis/pickleballVillageofSlocan 22% 39% 11% 28%Castlegar 25% 44% 8% 23%Nelson 24% 26% 12% 39%Area E 37% 26% 11% 26%Area F 36% 27% 5% 32%Area H 51% 16% 10% 24%Area I 42% 16% 16% 25%AreaJ 20% 40% 6% 34%
Page | 45
Yes No Unsure
No one in my household
participates in this activity.
Walking/joggingVillageofSlocan 44% 28% 6% 22%Castlegar 53% 34% 6% 7%Nelson 62% 16% 8% 13%Area E 54% 24% 9% 13%Area F 74% 16% 3% 7%Area H 59% 22% 6% 13%Area I 69% 13% 5% 13%AreaJ 34% 49% 3% 14%
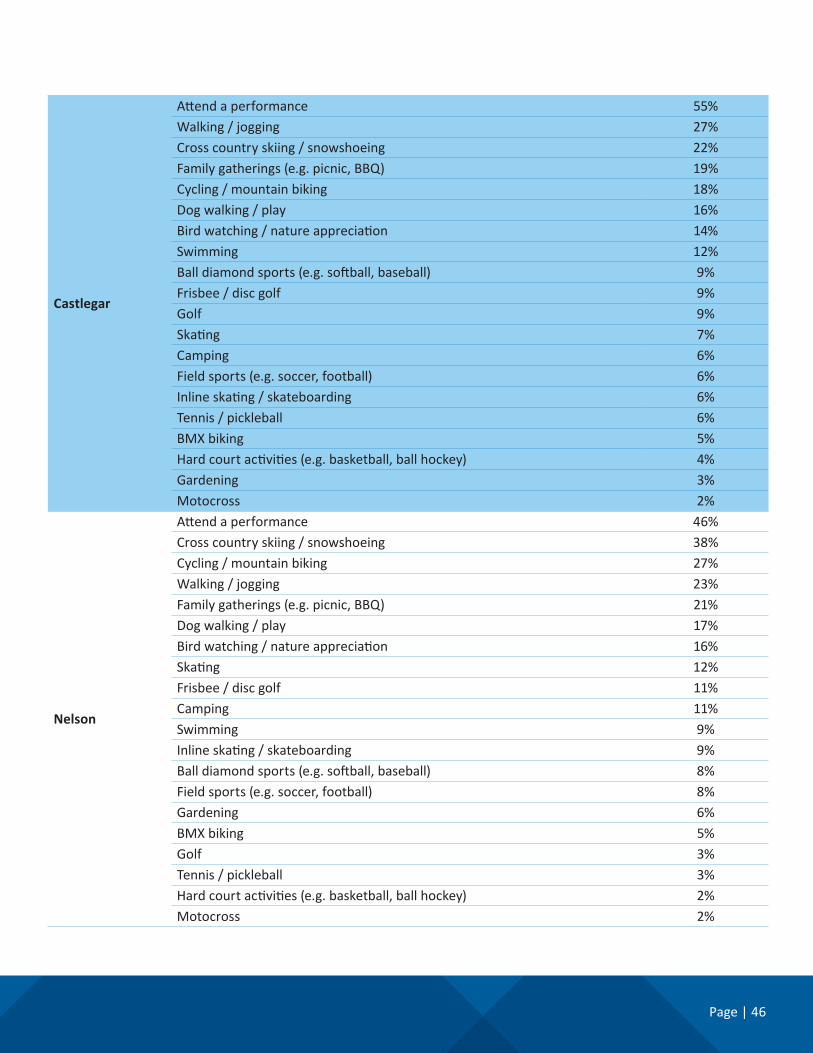
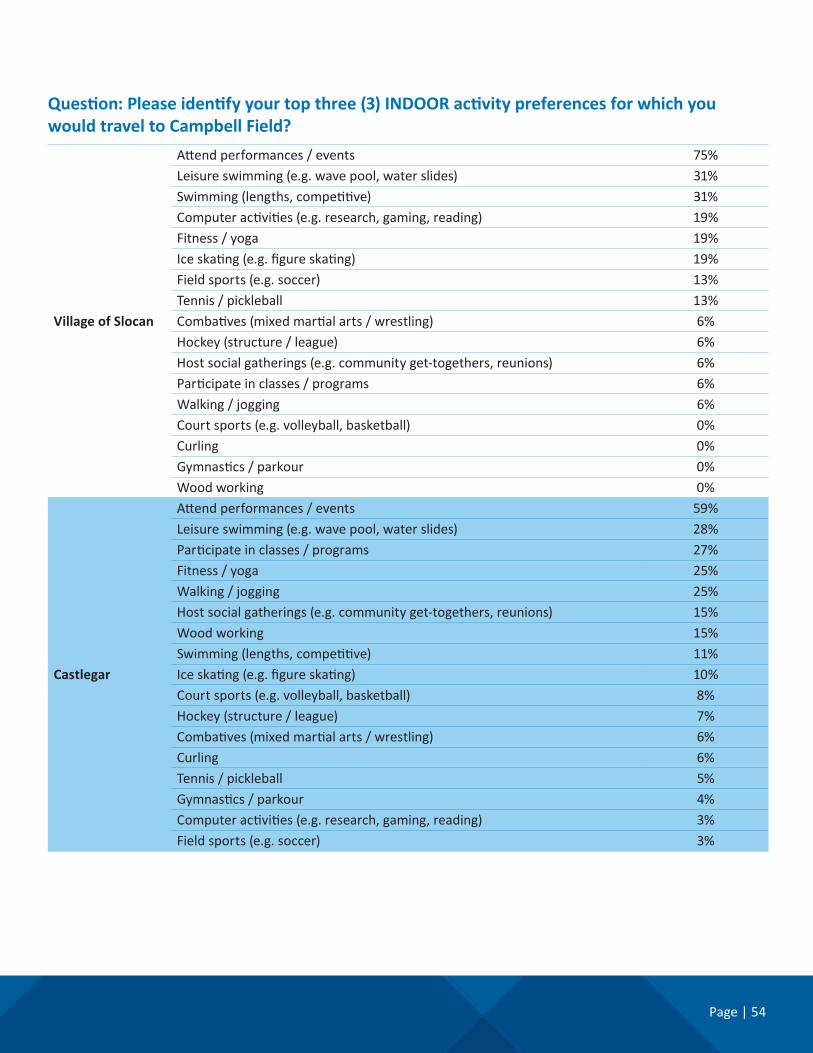
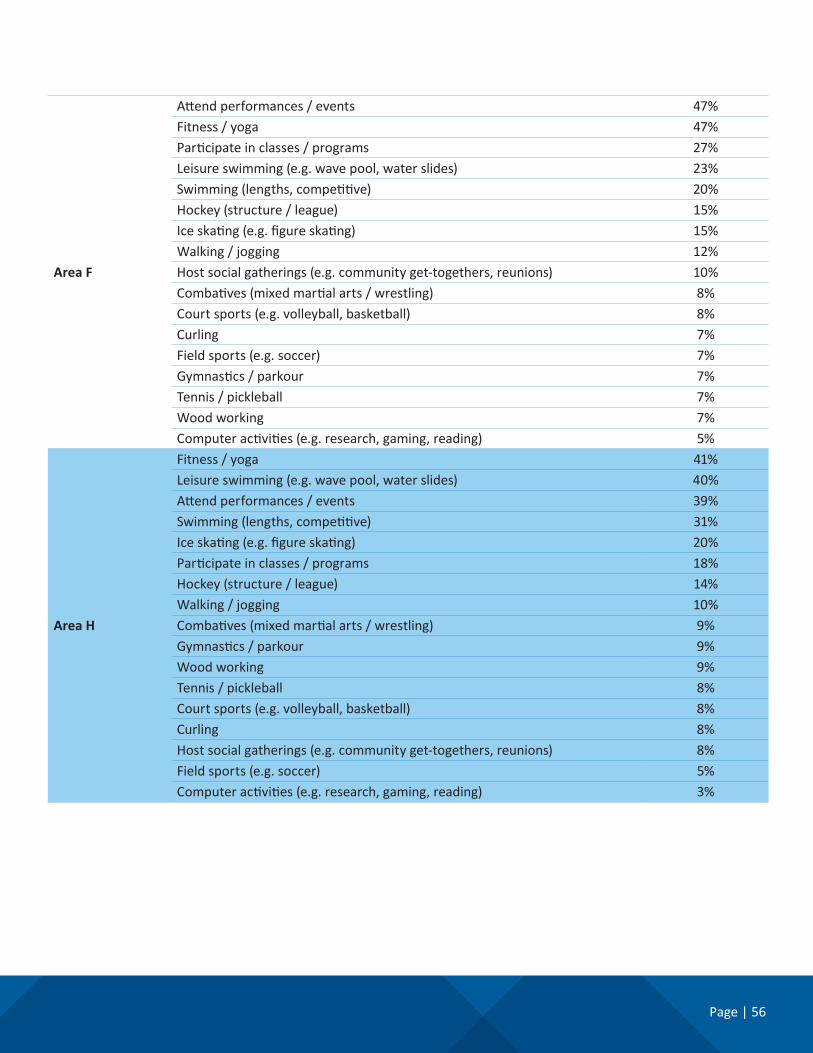
Question: Please identify your top three (3) OUTDOOR activity preferences for which you would travel to Campbell Field?
Question: Would you support an increase in annual property taxes if it meant that new recreation amenities were to be developed at Campbell Field?
Village of SlocanYes 65%No 6%Unsure 29%
CastlegarYes 33%No 45%Unsure 22%
NelsonYes 42%No 25%Unsure 33%
Area EYes 42%No 31%Unsure 27%
Area FYes 55%No 19%Unsure 26%
Area HYes 66%No 13%Unsure 21%
Area IYes 49%No 19%Unsure 31%
Area JYes 17%No 57%Unsure 26%
Question: How long have you lived in the area?
Village of Slocan
Lessthan1year -1-5 years 25%6-10 years 31%Morethan10years. 44%
Castlegar
Lessthan1year 1%1-5 years 16%6-10 years 10%Morethan10years. 74%
Nelson
Lessthan1year 3%1-5 years 19%6-10 years 9%Morethan10years. 69%
Area E
Lessthan1year -1-5 years 7%6-10 years 16%Morethan10years. 78%
Area F
Lessthan1year 3%1-5 years 23%6-10 years 15%Morethan10years. 59%
Area H
Lessthan1year 1%1-5 years 15%6-10 years 12%Morethan10years. 71%
Area I
Lessthan1year 2%1-5 years 19%6-10 years 6%Morethan10years. 73%
Area J
Lessthan1year -1-5 years 9%6-10 years 9%Morethan10years. 83%
Page | 59
Appendix D: Community Group Questionnaire
Campbell Field Reimagination ProjectCommunity Group Questionnaire
In 2016 the Regional District of Central Kootenay (RDCK) acquired Campbell Field thanks to a generous donation from the South Slocan Sports Association. Sitting beside the Mount Sentinel Secondary School near the Playmor Junction, this 3.5 hectare site presents a significant opportunity for the development of recreation amenities (indoor and outdoor) to satisfy the needs of residents in the broader area.
The RDCK has several Recreation Master Plans in place that serve as a great reference for potential amenity needs. However, it is important to hear from organizations providing recreation programming to residents from Castlegar, Nelson, Village of Slocan, and Areas E, F, H (south), I, and J (Bombi north).
Your organization is invited to provide input by completing this questionnaire. To ensure data accuracy only one (1) response per group is permitted. Please submit your response by October 30, 2020.
If you have any questions or would like a hard copy of the questionnaire to fill out please contact [email protected].
About Your Organization1. Please provide the following information about your organization.
a. Organization Name
b. Contact Person’s Name and Title
2. Briefly explain the purpose of your organization (mission) and its main activities.
3. From the age groups below, please indicate which ones best describe your primary participants/members. (Select all that apply.)
c Children (0-5 years) c Adult (19-39 years)
c Youth (6-12 years) c Adult (40-64 years)
c Teens (13-18 years) c Seniors (65 years and older)
4. How many participants/members belong to your organization?
5. What has been the trend over the past few years regarding participant/member numbers? What are your expectations over the next few years?
a. Over the past few years c Growing c Remaining stable c Declining
b. Expectations for next few years c Growing c Remaining stable c Declining
For more information [email protected] | 250.226.0008 | 1.800.268.7325 (BC) | or visit rdck.ca
Page | 60
Page | 2
6. We are interested to know where your participants/members live. Please provide some estimates of the residency of your participants / members.
% Castlegar
% Nelson
% Village of Slocan
% Area E (Blewett, Taghum , Mountain Station/South Sheppard, Bealby/Horicks Points, Golf Links/Silverking/Knox)
% Area F (Bonnington, Beasley, Taghum/Sproule Creek, Johnstone Rd. to Nasookin Rd., 5 and 6 mile, 7 to 10 mile)
% Area H (South Slocan, Playmor Junction, Crescent Valley, Slocan Park, Passmore/Vallican, Krestova, Winlaw, Appledale/Lemon Creek, Rural Slocan/Brandon)
% Area I (Shoreacres (Upper & Lower), Thrums, Tarrys, Brilliant, Pass Creek, Glade (Glade & Glade Central), Voykin Subdivision, Playmor Junction West)
% Area J (Ootischenia, Raspberry, Robson, Hugh Keenleyside Dam)
% Other (please specify)
100% TOTAL
Facility & Space Assessment7. How satisfied are you with the current recreation facilities and spaces (indoor and outdoor) in the region and do
they meet the needs of your group’s programs and activities?
c Very satisfied
c Somewhat satisfied
c Neither satisfied or dissatisfied
c Somewhat dissatisfied
c Very dissatisfied
a. Explain your answer
Page | 61
Page | 3
8. The RDCK along with several partners are considering the development of some recreation facilities at the Campbell Field site. To what extent do you agree that recreation facilities and spaces (indoor and outdoor) should be developed on the Campbell Field site?
c Strongly Agree
c Somewhat Agree
c Neither agree or disagree
c Somewhat disagree
c Strongly disagree
a. Explain your answer
9. The facilities and spaces that could be developed at the Campbell Field site would support a number of activities. Consider the list of indoor and outdoor activities below. Please identify your top three activity preferences that any new facility development should accommodate.
a. Select up to your top three (3) indoor activity preferences that should be accommodated with new facility development at the Campbell Field site.
c Attend performances / events c Ice skating (e.g figure skating)
c Combatives (mixed martial arts / wrestling) c Leisure swimming (e.g. wave pool, water slides)
Campbell Field Reimagination ProjectStudent Questionnaire
Thanks to a donation from the South Slocan Sports Association, the Regional District of Central Kootenay is thinking about developing some new recreation facilities and spaces on the Campbell Field Site.
For more information [email protected] | 250.352.6665 | 1.800.268.7325 (BC) | or visit rdck.ca
We are interested in your thoughts. Please answer the following questions by telling us what you think. Thank you!
Slocan
Nelson
Nelson (Dams)
Castlegar
Salmo
Mount Sentinel Secondary
Slocan Valley Rail Trail
Playm
or Road
Playmor Road
Osa
cho
ff R
oa
d
Ed
en
Ro
ad
Mt S
entinel R
oad
Campbell FieldStudy Area
Page | 65
Page | 2
About You1. How old are you?
c 11 or younger c 13 c 15 c 17 c 19 or olderc 12 c 14 c 16 c 18
2. What school do you attend? c Brent Kennedy Elementaryc Distance Education and HomelInksc J.V Humphreysc Kinnaird Elementaryc LV Rogers Secondary Schoolc Mount Sentinel Secondaryc Nelson Christian Community Schoolc Robson Elementary
c Stanley Humphreys Secondary c Trafalgar Middle School c Twin Rivers Elementaryc Waldorfc W.E.Graham Elementary and Secondaryc Winlaw Elementaryc Wildflowerc Other (please specify):
Recreation at Campbell Field3. Remembering where you live, how would you be able to travel to Campbell Field? (You can pick more than one answer.)
c I wouldn’t travel to Campbell Fieldc Walk / scooter / skateboardc Bicycle c I could drive myselfc I could get a ride from someonec School busc Public Transportation
4. From the list of outdoor recreation activities, please pick the top 3 that people should be able to do at Campbell Field.
c Attend a performance c Gardeningc Ball diamond sports (e.g. softball, baseball) c Golfc Bird watching / nature appreciation c Hard court activities (e.g. basketball, ball hockey)c BMX biking c Inline skating / skateboardingc Camping c Motocrossc Cross country skiing / snowshoeing c Skatingc Cycling / mountain biking c Swimming c Dog walking / play c Tennis / pickleballc Family gatherings (e.g. picnic, BBQ) c Walking/ joggingc Field sports (e.g. soccer / football) c Other (please specify): c Frisbee / Disc golf c Other (please specify):
Page | 66
Page | 3
5. From the list of indoor recreation activities, please pick the top 3 that people should be able to do at Campbell Field.
c Attend performances / events c Ice skating (e.g figure skating)c Combatives (mixed martial arts / wrestling) c Leisure swimming (e.g. wave pool, water slides)
cComputer activities (e.g. research, gaming, reading) c Participate in classes / programs
c Court sports (e.g. volleyball, basketball) c Swimming (lengths, competitive)c Curling c Tennis / pickleballc Field sports (e.g. soccer) c Walking / joggingc Fitness / yoga c Wood workingc Gymnastics / Parkour c Other (please specify): c Hockey (structure / league) c Other (please specify):
cHost social gatherings (e.g. community get-togethers, reunions)
6. Use the space to tell us any other comments you want about building recreation facilities and spaces at Campbell Field.