Campbell Lake Tributary Water Quality Investigation July 2012 through June 2013 Prepared for the Alaska Department of Environmental Conservation Gay A. Davis and Jeffrey C. Davis P.O. Box 923, Talkeetna AK 99676 July 2013
6.0 Literature Cited ....................................................................................................................... 16
Appendix A. Microbial Community Identification ..................................................................... 17
Appendix B. ADFG Pathology Laboratory Report ...................................................................... 18
Appendix C. Site Photographs ..................................................................................................... 19
ARRI July 2013 Campbell Lake Tributary Water Quality
1
1.0SummaryWater quality in Campbell Lake is impaired due to failure to meet state criteria for total fecal coliform bacteria, and a current recovery plan is being implemented. However, fecal loading from all tributaries to Campbell Lake has not been quantified. A small tributary stream enters the east side of Campbell Lake near the North end. In addition to being a possible source of fecal coliform bacteria, this tributary often contains large orange flocculent deposits. This study was conducted to evaluate this tributary stream as a potential source of fecal coliform bacteria and to determine the causes of orange flocculent deposits. Water sampling was conducted on this tributary immediately upstream from Campbell Lake. Samples were collected on 4 dates within a 30-day period in July and August, a 30-day period in August and September of 2012, and 4 dates within a 30 day period in May to June 2013. Water samples were collected and analyzed for total fecal coliform bacteria. Concurrent with water sample collection, were in situ measures of turbidity, pH, specific conductivity, dissolved oxygen, and temperature. The presence of orange flocculent, debris, and foam were noted and photographed on all sampling dates. Water samples were collected during a fall storm event in 2012 and during base flow conditions in June 2013 and analyzed for concentrations of copper, lead, zinc, and iron. Sediment samples were collected in August 2012 and analyzed for concentrations of these same metals. A sample of the orange flocculent was collected in June 2013 and submitted for visual identification of the microbial community. The tributary to Campbell Lake was found to contain concentrations of fecal coliform bacteria that exceed Alaska water quality criteria during the summer and fall; however, due to low stream discharge, this tributary is not likely to be a major source of bacteria to Campbell Lake. The orange flocculent is due to natural oxidation and deposition of iron, facilitated by the bacterium Leptothrix which dominated the microbial community, but may be exacerbated by concentrating dissolved iron with the subsurface drainage system. Copper and zinc in bed sediment exceed threshold concentrations at which biological effects have been documented and established State water quality criteria. Water quality, in particular high concentrations of dissolved iron may be the cause of juvenile Chinook salmon mortalities which were observed on multiple occasions. The extent to which impaired water quality and toxic bed sediments extend into Campbell Lake is unknown.
2.0IntroductionCampbell Lake and Campbell Creek are on the waterbody recovery tract for not meeting the Water Quality Criteria (WQC) for fecal coliform bacteria (ADEC 2012). Total Maximum Daily Load (TMDL) plans have been approved and are currently being implemented. However, loading from all tributary sources has not been calculated. A tributary to Campbell Lake drains industrial, commercial, and urban zones of mid-Anchorage and may be contributing to the coliform bacterial load in Campbell Lake. There has been no previous water quality evaluation of this tributary (Campbell Lake Tributary). Fecal coliform bacteria discharging from this tributary to Campbell Lake should be considered in the recovery plan. In addition, many Anchorage area streams are listed as water quality impaired due to fecal coliforms (ADEC
ARRI July 2013 Campbell Lake Tributary Water Quality
2
2010), and sampling of this tributary will increase our understanding of the distribution of fecal bacteria within the municipality. Orange flocculent deposits have been observed in Campbell Lake Tributary. The composition of these flocculants and factors influencing their development may also be an indicator of poor water quality. Iron deposits (orange color) or organic flocculants are often observed in warm wetland streams draining peatland or organic rich soils. Alternately, high dissolved carbon concentrations from human sources may be responsible for residue and foam formation. The objectives of this study were to determine (1) the abundance of total fecal coliform bacteria in this small tributary stream near Campbell Lake, and whether concentrations exceed WQS, (2) possible sources of fecal bacteria, (3) the abundance and distribution and duration of debris or residue (flocculent), and (4) basic water physical and chemical characteristics including concentrations of metals commonly observed in stormwater runoff.
3.0Methods
3.1QualityAssuranceSample collection, sample preservation, sample analyses, data management and reporting followed a DEC approved Quality Assurance Project Plan (QAPP).
3.2SamplingLocationThe study stream is located in Anchorage, Alaska (Figure 1) south of Diamond Boulevard. The study stream flows west from King Street to C Street where it enters a sediment basin. At the outlet of the sediment basin the stream enters a buried pipe for 2.5 km and emerges approximately 200 m upstream from Campbell Lake on the west side of Victor Street (Figure 2). Stream surveys and water samples were collected on all sampling dates at a station located immediately downstream from Victor Road (61.13227 N x -149.92242 W). Stream surveys and measures of turbidity were conducted on multiple dates in May and June of 2013 from King Street to the outlet of the sediment basin.
ARRI July 2013 Campbell Lake Tributary Water Quality
3
Figure 1. Drawing of Alaska, Southcentral Alaska showing Anchorage and the sampling area.
Figure 2. Map of sampling area showing Campbell Lake, and sampling location on Campbell Lake Tributary.
3.3SamplingDatesSample collection dates for each of the study parameters is shown in Table 1.
Sampling Location
ARRI July 2013 Campbell Lake Tributary Water Quality
4
Table 1. Sampling dates with X marking parameters measured on each date. Sp. Cond. = specific conductivity, D.O. = dissolved oxygen.
Fecal Coliforms pH, Sp. Cond. D.O.
Turbidity Metals
7/19/12 X X X 7/24/12 X X X 8/1/12 X X X 8/16/12 X X X Water/Sediment 9/7/12 X X X 9/13/12 X X X 9/21/12 X X X 9/27/12 X X X 4/26/13 X X King St to Lake 4/30/13 X X King St to Lake 5/2/13 X X X 5/9/13 X X X 5/17/13 X X X 5/21/13 X X King St to Lake 6/11/13 X X Water 6/24/13 X X King St to Lake
3.4FecalColiformBacteriaWater samples were collected for total fecal coliform analyses in a well-mixed portion of the stream approximately 10 m downstream from Victor Road. Samples were collected from mid-water depth by drawing water into a sterile 60 ml syringe and discharging the water from the syringe into a sample bottle provided by SGS (analytical laboratory). This process was repeated to obtain two 100 ml samples. Sample bottles were placed in a cooler with frozen gel paks and transported to the laboratory for analyses, usually within 1 hour of collection. Samples were analyzed for fecal coliform bacteria using the membrane filtration method (SM 9222D).
3.5TurbidityStream water turbidity was measured in situ from water samples collected into a sample bottle at mid-water depth. Water samples were analyzed for turbidity using a LaMotte TC-3000e turbidimeter. The meter was tested and calibrated (1 and 10 NTU standards) or calibration verified (10 NTU standard) on each sampling date prior to use. Turbidity was measured three times from each sample collected and results reported as the average of these three measurements.
3.6OrangeFlocculentandDebrisQualitative surveys were conducted on each sampling date and at each location for the presence of orange flocculants or debris. Surveys were conducted on open water sections of the stream downstream from Victor Road, and on a subset of dates at the open water sections from King Street to the C Street sediment basin.
ARRI July 2013 Campbell Lake Tributary Water Quality
5
A sample of the flocculent was collected, frozen, and shipped to the microbiology laboratory at Brigham Young University for visual species identification.
3.7MetalsWater samples were collected in 250 ml bottles at mid-water depth and submitted to AM Test (analytical laboratory) for total and dissolved copper, lead, zinc, iron, and hardness. Sediment samples were collected on one sampling date and analyzed for the same 4 metals. Water samples for dissolved metals were field-filtered. All water samples were acidified (HNO3) and held at 6°C until analyzed.
3.8DissolvedOxygen,pH,SpecificConductivity,TemperatureStream water specific conductivity, pH, and temperature were measured using a YSI 63 meter and probe. Water temperature was recorded by the YSI meter. Dissolved oxygen was measured using a YSI 550A meter. All meters were tested for accuracy and calibrated on the day of and prior to field sampling. Probes were submerged to approximately 0.5 times water depth within the flowing channel avoiding areas of stagnant water. Probes were allowed to equilibrate for 2 minutes prior to recording results. Water temperature was also measured using temperature loggers (Onset ProV2) that recorded water temperature every 30 minutes Temperature loggers were tested for accuracy at 0° and 20°C prior to field deployment against an in-certification NIST traceable thermometer.
4.0Results
4.1QualityAssuranceWater sample collection and analyses complied with the quality assurance criteria within the QAPP. Sampling completeness was 100% for all measures with the exception of dissolved oxygen and specific conductivity, which did meet the minimum criteria of 90%. Dissolved oxygen and specific conductivity were not measured on one sampling date due to meter malfunction. All field measurement meters met the accuracy criteria of 85 to 115% when tested against purchased standards. Dissolved oxygen meters were calibrated and measured 100% saturation with the calibration port prior to stream measurements. All fecal coliform bacteria samples were delivered to SGS within 2 hours of collection and processed prior to the 6 hour hold time. SGS implemented their quality assurance protocols for microbial analyses. The QAPP did not define relative percent difference (RPD) values for microbial samples. Water and sediment samples analyzed for metal concentrations implemented the collection, preservation, holding, and analytical methods as described within the QAPP. AM Test RPD values were < 2.3% within the quality assurance range of 20%. Accuracy of recovery of matrix spikes was from 96 to 101% within the quality assurance range of 85 to 115%.
ARRI July 2013 Campbell Lake Tributary Water Quality
6
4.2FecalColiformBacteriaWater samples were collected to determine if total fecal coliform concentration exceeded Alaska Water Quality Standard Criteria and if inputs were influencing recovery plans for Campbell Lake. Water quality criteria for fecal coliforms in fresh water are shown in Table 1 (ADEC 2012). Fecal coliform concentrations for August and September 2012 are shown in Table 2 and for May 2013 in Table 3. The most stringent water quality criteria was exceed for two 30-day periods from August 16 to September 27 (Table 4). During these time periods geometric means were greater than 20 cfu/100 ml and more than 50% of the samples were greater than 40 cfu/100 ml. Water quality criteria were not exceeded during the spring sampling period of 2013. Fecal coliform concentrations were moderately related to changes in stream discharge and suggest higher concentration in surface runoff. The highest concentration of fecal coliforms (~300 cfu/100 ml) occurred in the fall (September 21, 2012). This also coincided with the highest flow measurement of 6.8 cfs, whereas one week early discharge was 0.1 cfs and fecal coliform concentrations were < 10 cfu/100 ml). The second highest concentration of fecal coliforms, near 100 cfu/100 ml occurred on August 1 at a stream flow of 0.39 cfs, an increase of 0.27 cfs from the previous week. Stream flows were high during the spring, decreasing from ~5 cfs in early May to 2 cfs by May 21. The highest concentration of fecal coliform bacteria in the spring of 2013 (74 cfu/100 ml) occurred on the first sampling date on May 3 and declined to 1 cfu/100 ml by the end of May. Table 2. Alaska water quality criteria for fecal coliform bacteria in fresh water (DEC 2012).
(2) FECAL COLIFORM BACTERIA (FC), FOR FRESH WATER USES (See note 1)
(A) Water Supply (i) drinking, culinary, and food processing
In a 30-day period, the geometric mean may not exceed 20 FC/100 ml, and not more than 10% of the samples may exceed 40 FC/100 ml. For groundwater, the FC concentration must be less than 1 FC/100 ml, using the fecal coliform Membrane Filter Technique, or less than 3 FC/100 ml, using the fecal coliform most probable number (MPN) technique.
ARRI July 2013 Campbell Lake Tributary Water Quality
7
Table 3. Total fecal coliform bacteria concentrations (cfu/100 ml) for the two replicate samples on each sampling date (July through September 2012), with geometric means for the previous 4 samples (4-Sample Geometric Mean) and 4 previous dates (4-Date Geometric Mean).
Table 5. Geometric mean fecal coliform concentrations (cfu/100 ml) for those time periods with 4 sampling dates and percent of samples with concentrations above 40 cfu/100 ml.
Geometric Mean % > 40 cfu/100 mlJune 19 to Aug 16 16.8 25 Aug 16 to Sep 21 44.9 50 Sep 7 to Sep 27 30.0 50 May 9 to May 21 13.2 37.5
4.3TurbidityStream water turbidity was consistently high in Campbell Lake Tributary and often exhibited extremely high values. Stream water turbidity from water samples collected below Victor Road near Campbell Lake on all sampling dates are shown in Figures 1 and 2. Turbidity was > 5 NTU on all sampling dates (100 %), 73% of the samples were > 10 NTU, and 20% of the samples were > 100 NTU. The natural conditions for turbidity in this stream were not measured, therefore we could not evaluate compliance with WQS. However, based on our 20 years of experience sampling streams with Southcentral Alaska, turbidity in non-glacial streams is less than 5 NTU, except during high spring and storm flows. The highest turbidity measurements occurred on August 16, 2012, and February 14 and June 24, 2013. Stream flow was not measured on February 14 or June 24.
ARRI July 2013 Campbell Lake Tributary Water Quality
8
Testing the effectiveness of the C street sediment basin was not a study objective. However, the high turbidity measured at our sampling locations lead to increased sample collection upstream on 4 dates during the spring of 2013 (Figure 5). On April 24, Turbidity increased from 8 NTU at King Street to 23 NTU below the sediment basin (sediment inlet was ice covered). Similarly, on May 21 turbidity increased from 6 NTU at the inlet to 12 NTU at the outlet of the sediment basin. However, on the other dates turbidity decreased from 60 to 9 NTU and from 14 to 4 NTU from the inlet to the outlet of the sediment basin. On June 24, turbidity was over 100 NTU at Victor Road, but less than 5 NTU at the outlet of the sediment basin upstream. Therefore, while the sediment basin does not appear to be effective under all conditions, the large increases in turbidity appear to be occurring due to inputs downstream.
Figure 3. Turbidity downstream from Victor Road on sampling dates during the summer and fall of 2012.
Figure 4. Turbidity downstream from Victor Road during winter and spring of 2013.
7.8 8.6 9.5
183.0
30.217.9 31.7 10.4
0
20
40
60
80
100
120
140
160
180
200
Turbidity (NTU
)
143.7
16.9 19.2
8.6 12.3 11.0
114.3
0
20
40
60
80
100
120
140
160
Turbidity (NTU
)
ARRI July 2013 Campbell Lake Tributary Water Quality
9
Figure 5. Turbidity in Campbell Lake Tributary on 4 dates from King Street to Victor Road.
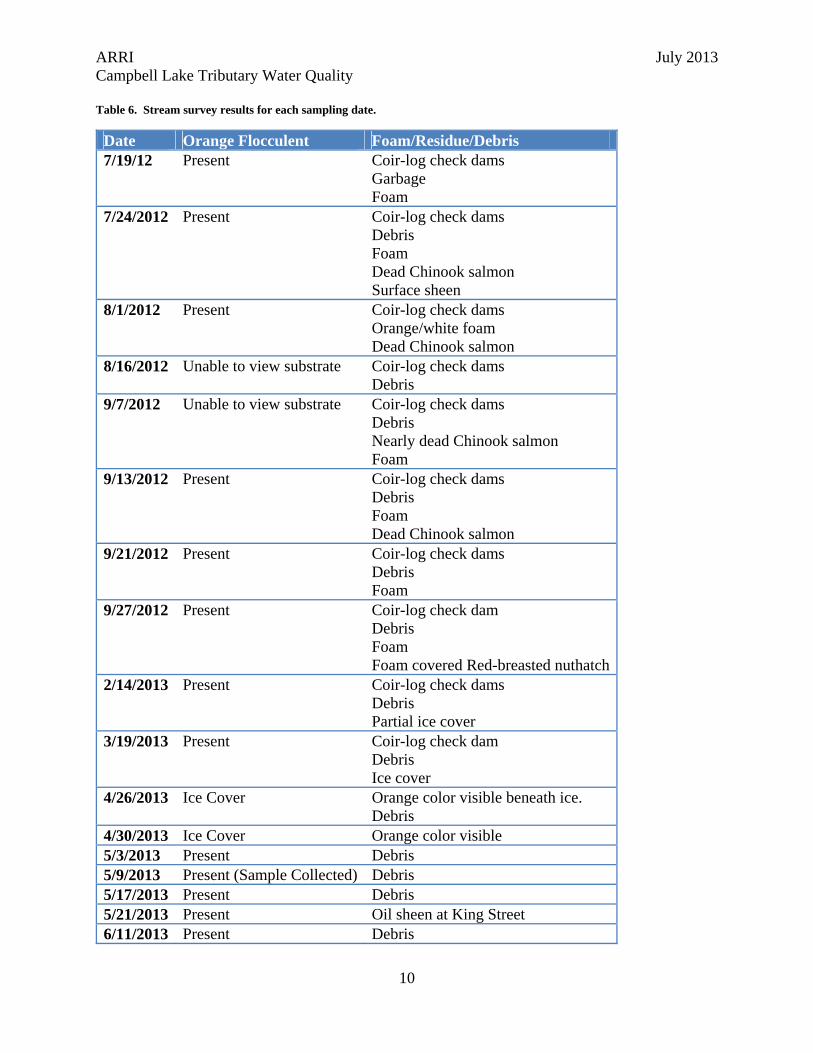
4.4OrangeFlocculentandDebrisThe orange flocculent was present on all sampling dates. We were unable to differentiate changes in the abundance of flocculent between sampling dates due to differences in water depth and turbidity. There were many days when turbidity was above 10 NTU and it was difficult to view the stream substrate. On days when turbidity and stream flow was low, the stream bottom was visible and the orange flocculent was easy to observe. However, on all sampling dates the orange color was present even on or under the ice surface. Waders were always colored orange following sampling. The orange colored flocculent is oxidized iron deposits caused by the bacteria Leptothrix (see Appendix A). The bacterium oxidizes iron which accumulates in the sheath surrounding the organism. Leptothrix is present in waters with low dissolved oxygen and reduced iron. This bacterium is also responsible for the oily sheen often observed in stagnant wetland pools or streams or in groundwater seeps. Conditions that support Leptothrix occur naturally in wetland streams or in areas of upwelling iron-rich groundwater. Human sources of carbon rich anaerobic conditions, such as wastewater facilities, also promote proliferation of this bacterium. High dissolved carbon concentrations are also one cause of the presence of foam in streams. Therefore, the sources of oxygen poor high carbon waters should be used to determine if the orange flocculent is natural or due to a human caused pollutant. Garbage and debris were observed in the stream on all sampling dates and there was a foam buildup on most dates at the Victor Road culvert outlet. There is a coir log check dam in the stream that was present on all sampling dates. This check dam serves no apparent purpose and should be removed. Garbage (plastic bags) was also present in the stream on most sampling dates.
0
20
40
60
80
100
120
140
King Street Inlet Sed Basin Outlet Sed Basin Victor Road
Turbidity (NTU
)
4/26/2013 4/30/2013 5/21/2013 6/24/2013
ARRI July 2013 Campbell Lake Tributary Water Quality
10
Table 6. Stream survey results for each sampling date.
Date Orange Flocculent Foam/Residue/Debris 7/19/12 Present Coir-log check dams
3/19/2013 Present Coir-log check dam Debris Ice cover
4/26/2013 Ice Cover Orange color visible beneath ice. Debris
4/30/2013 Ice Cover Orange color visible 5/3/2013 Present Debris 5/9/2013 Present (Sample Collected) Debris 5/17/2013 Present Debris 5/21/2013 Present Oil sheen at King Street 6/11/2013 Present Debris
ARRI July 2013 Campbell Lake Tributary Water Quality
11
Date Orange Flocculent Foam/Residue/Debris Foam in culvert
6/24/2013 Unable to View Substrate Coir-log check dam Debris Foam in culvert
Dead or dying juvenile salmon were observed in the stream on multiple occasions. Dead Chinook salmon juveniles were submitted to the ADFG fish pathology laboratory for evaluation. Pathological findings were not conclusive; however, a brown film was observed on fish gills consistent with oxidized iron precipitate (Phippen et al. 2008, see Appendix B for ADFG reports).
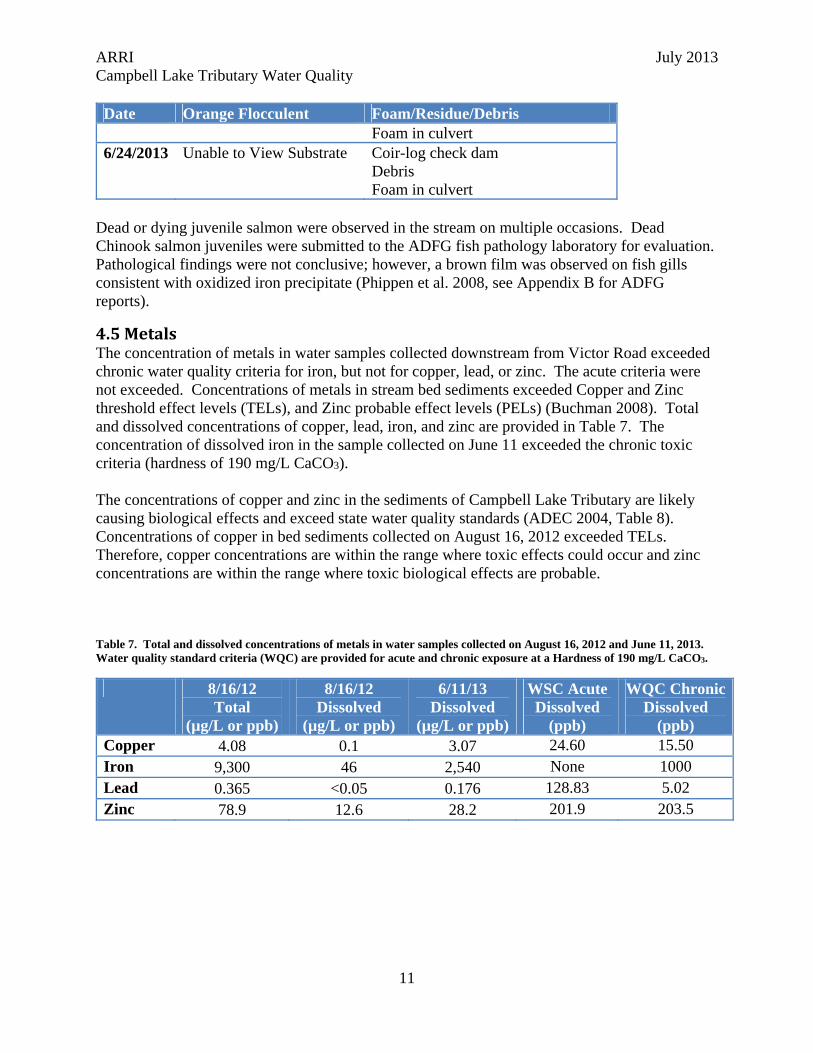
4.5MetalsThe concentration of metals in water samples collected downstream from Victor Road exceeded chronic water quality criteria for iron, but not for copper, lead, or zinc. The acute criteria were not exceeded. Concentrations of metals in stream bed sediments exceeded Copper and Zinc threshold effect levels (TELs), and Zinc probable effect levels (PELs) (Buchman 2008). Total and dissolved concentrations of copper, lead, iron, and zinc are provided in Table 7. The concentration of dissolved iron in the sample collected on June 11 exceeded the chronic toxic criteria (hardness of 190 mg/L CaCO3). The concentrations of copper and zinc in the sediments of Campbell Lake Tributary are likely causing biological effects and exceed state water quality standards (ADEC 2004, Table 8). Concentrations of copper in bed sediments collected on August 16, 2012 exceeded TELs. Therefore, copper concentrations are within the range where toxic effects could occur and zinc concentrations are within the range where toxic biological effects are probable. Table 7. Total and dissolved concentrations of metals in water samples collected on August 16, 2012 and June 11, 2013. Water quality standard criteria (WQC) are provided for acute and chronic exposure at a Hardness of 190 mg/L CaCO3.
ARRI July 2013 Campbell Lake Tributary Water Quality
12
Table 8. Campbell Lake Tributary sediment metal concentrations and associated TEL and PEL levels.
Sediment (µg/g or ppm)
TEL (NOAA ppm) PEL (NOAA ppm)
Copper 58.9 35.7 197.0 Iron 187,000 Not Available Not Available Lead 17.9 35.0 91.3 Zinc 1060 123.0 315.0
4.6DissolvedOxygen,pH,SpecificConductivity,TemperatureStream water characteristics are consistent for streams with high groundwater input (Table 9). Stream water temperatures were less than 16°C on all sampling dates. Stream water pH was low likely due to high organic acids and the discharge of reduced iron. Low dissolved oxygen likely was the result of the discharge of groundwater, reduced iron and potentially high dissolved organic matter. Table 9. Stream water temperature, dissolved oxygen, pH, and specific conducitivy measured downstream from Victor Road on all sampling dates.
ARRI July 2013 Campbell Lake Tributary Water Quality
13
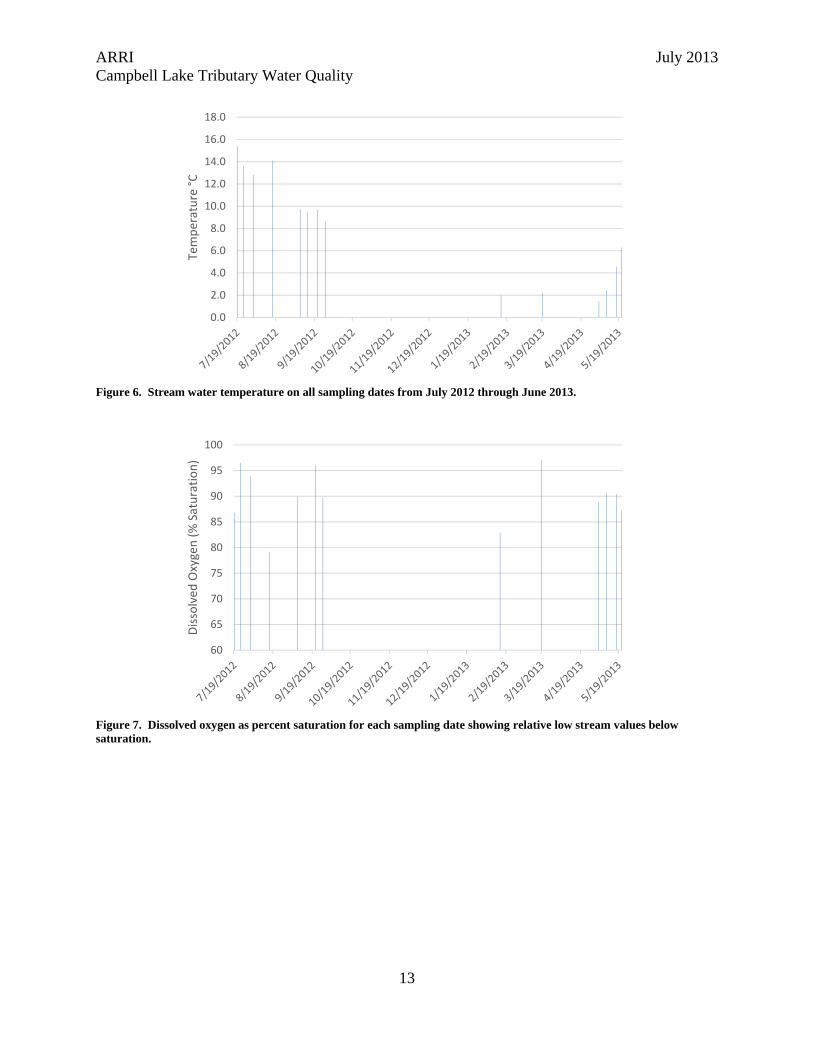
Figure 6. Stream water temperature on all sampling dates from July 2012 through June 2013.
Figure 7. Dissolved oxygen as percent saturation for each sampling date showing relative low stream values below saturation.
0.0
2.0
4.0
6.0
8.0
10.0
12.0
14.0
16.0
18.0
Temperature °C
60
65
70
75
80
85
90
95
100
Dissolved
Oxygen (% Saturation)
ARRI July 2013 Campbell Lake Tributary Water Quality
14
Figure 8. Stream water pH for all sampling dates showing value below neutral with extreme low values on some sampling dates. Stream water pH was higher during winter.
Figure 9. Specific conductivity on all sampling dates showing high concentrations of dissolved ions except during winter.
4.50
5.00
5.50
6.00
6.50
7.00
7.50
8.00
8.50
pH
5
55
105
155
205
255
305
355
405
455
505
Specific Conductivity (µS/cm
)
ARRI July 2013 Campbell Lake Tributary Water Quality
15
Figure 10. Stream flow as measured on each sampling date. Flows were much less than 1 cfs on most dates with the exception of a fall storm and during spring runoff.
5.0DiscussionThe concentrations of total fecal coliform bacteria exceed Alaska WQC during multiple time periods in the summer and fall but not during the spring. Relatively low concentrations of fecal coliforms in stream during spring runoff is consistent with sampling conducted in the North and South Forks of Little Campbell Creek, Ship Creek, and Cottonwood Creek (Davis and Davis 2010, 2011). While concentrations of fecal coliforms in Campbell Lake Tributary were greater than water quality criteria they were much lower than those measured in Little Campbell Creek. Discharge from Campbell Lake Tributary is generally low; therefore, while not improving upon conditions in Campbell Lake, loading from this tributary does not appear to be a major source of fecal coliforms. The orange flocculent is the result of natural chemical oxidation and bacterial mediated oxidation of reduced iron. However, the diversion of the stream into an underground pipe may result in reduced oxidation rates contributing to toxic conditions when the stream daylights downstream from Victor Road. Subsurface organic matter decomposition reduces oxygen concentrations in groundwater and results in soluble reduced iron. When groundwater discharges to the surface iron is oxidized, becomes insoluble and is deposited on stream beds. This natural process could be exacerbated by diverting a stream into underground pipes. The concentration of oxygen in streams flowing through underground pipes is likely reduced due to the elimination of oxygen production through photosynthesis, reduced rates of diffusion, and oxygen consumption by respiration. As iron rich anoxic groundwater discharges to a stream flowing on the surface, the presence of oxygen promotes oxidation and deposition, and dissolved iron does not increase. However, if the stream is flowing through a perforated subsurface pipe, iron in groundwater discharged to the pipe may not be oxidized, and concentrations can increase to toxic levels. When the stream resurfaces, these high concentrations of iron become rapidly oxidized, creating nuisance accumulations of orange flocculent, and juvenile fish mortalities.
0
1
2
3
4
5
6
7
8
Stream
Flow (cfs)
ARRI July 2013 Campbell Lake Tributary Water Quality
16
Turbidity was consistently high within this Campbell Lake Tributary and the stream has a brown appearance on most dates. Turbidity is extremely high on some sampling dates (>100 NTU) resulting in a plume of turbid water into Campbell Lake. On one sampling date, turbidity was low at the outlet of the C Street sediment basin, but extremely high at Victor Road. Therefore, it appears that sediment input is occurring at some point between these two locations. As the stream is contained within a subsurface pipe, inputs must be through the storm drain system. Campbell Lake Tributary contains concentrations of fecal coliform bacteria that exceed water quality criteria during the summer and fall; however, due to low stream discharge, this tributary is not likely to be a major source of bacteria to Campbell Lake. The orange flocculent is due to natural oxidation and deposition of iron, but is exacerbated by concentrating dissolved iron with the subsurface drainage system. Dissolved iron concentrations exceeded chronic water quality criteria and are the likely cause of juvenile Chinook salmon mortalities. Copper and zinc in bed sediment exceed threshold at which biological effects have been documented and water quality criteria. The extent to which, or if impaired water quality and toxic bed sediments extend into Campbell Lake in unknown.
6.0LiteratureCitedAlaska Department of Environmental Conservation (ADEC), 2010. Alaska’s Final 2010
Integrated Water Quality Monitoring and Assessment Report. Juneau, Alaska. Alaska Department of Environmental Conservation (ADEC), March 2004, Sediment Quality
Guidelines, Technical Memorandum prepared by Division of Spill Prevention and Response, Contaminated Sites Remediation Program.
Alaska Department of Environmental Conservation. 2012a. 18 AAC 70, Water Quality Standards. Juneau, Alaska.
Alaska Department of Environmental Conservation. 2012b. Alaska Water Quality Criteria Manual for Toxic and Other Deleterious Organic and Inorganic Substances, as amended through December 12, 2008. Juneau, Alaska.
Buchman, M.F. 2008. Screening Quick Reference Tables, NOAA OR&R Report 08-1, Seattle WA, Office of Response and Restoration Division, National Oceanic and Atmospheric Administration, 34 pages.
Davis, J.C. and G.A. Davis. 2011. Lower Ship Creek Water Quality Monitoring as Related to Petroleum Hydrocarbon Pollution and Fecal Coliform Bacteria. Final Report for the Alaska Department of Environmental Conservation. Contract No. 18-6002. The Aquatic Restoration and Research Institute. Talkeetna, AK.
Davis, J.C. and G.A. Davis. 2010. Fecal coliform bacteria source assessment in the waters of Cottonwood Creek, Wasilla, and Little Campbell Creek, Anchorage. Final Report for the Alaska Department of Environmental Conservation. Contract No. 18-2011-21-7. Aquatic Restoration and Research Institute. Talkeetna, Alaska.
Phippen, B., C. Horvath, R. Nordin, N. Nagpal. 2008. Ambient Water Quality Guidelines for Iron. Prepared for: Science and Information Branch, Water Stewardship Division, Ministry of Environment, Province of British Columbia.
ARRI July 2013 Campbell Lake Tributary Water Quality: Appendix A
AppendixA.MicrobialCommunityIdentification
Campbell Lake Tributary Bacterial Identification and Discussion
Jason Bahr
1
Blank Page
Campbell Lake Tributary Bacterial Identification
1
IntroductionAccording to ARRI observations, the Campbell Lake Tributary is home to red films and flocculate materials. In the recent past there have been industrial accidents involving red mud or sludge from alumina production through the Bayer process, which cause us to reflect when we observe red or orange material in freshwaters (Gelencsér et al., 2011). One event of note is the Ajka, Hungary alumina sludge spill. This spill negatively impacted downstream waters by increasing pH, sediment metal and sodium concentrations, and it decreased biological community function (Klebercz et al., 2012). It also resulted in the injury of 122 people, the death of 10 individuals, and potential low-level respiratory impairment (Gelencsér et al., 2011). Although there have been incidences when anthropogenic red sludge was harmful to the environment and humans, naturally occurring bacteria are often the cause of red flocculate formation in freshwater environments (Robbins, 2013). Fortunately, this appears to be the case in the Campbell Lake Tributary.
MethodsOn June 20, frozen sediment samples were received by the microbial laboratory at Brigham Young University, with a request for visual classification of organisms within the sample and an evaluation of the causes of the “orange floc” development. The sample was thawed, and random subsamples were placed on slides for microscopic identification. Visual identification of “orange floc” material in sediment from the Campbell Lake Tributary was carried out using a 100 x oil lens on an Olympus CHS compound microscope with a 10 x eyepiece. The overall power of magnification was 1000x. We used Algae of Utah as a basic identification guide for phytoplankton (Flowers, 1938). Iron oxidizing bacteria were identified using the USGS website “What is the Red?” (Robbins, 2013). Identification was conducted by Jason Bahr and Erin Flemming Jones, who have a combined experience of over 200 hours visually identifying phytoplankton and other microbial species.
ResultsMultiple individuals were identified including the diatom Synedra and the biflagellate chlorophyte Chlamydomonas nivalis, commonly seen as watermelon snow. The sediment sample also contained a larval chironomidae, which is a facultative anaerobe. The most relevant identification made was that of the iron oxidizing bacterial genus Leptothrix (Robbins, 2013).
DiscussionLeptothrix is a very common, naturally occurring bacterium. Colonies of Leptothrix will position themselves in areas with low O2 tension and high, constant ferrous iron concentrations (Maier et al., 2009). This is the primary reason Leptothrix species are often found in wastewater effluent pipelines; and where anoxic, high carbon waters seep into streams and lakes from wetlands (Druschel et al., 2008). Leptothrix colonies swarm and form long, filamentous sheath colonies by binary fission. When conditions become harsh, the swarm will scatter and each individual will use flagella to move to a more favorable environment, thus founding a new swarm colony (Madigan et al., 2003). Leptothrix is chemoheterotrophic (Paul and Clark, 1996). This genera is capable of oxidizing ferrous iron when it is chelated to organic molecules such as humic
Campbell Lake Tributary Bacterial Identification
2
substances. The iron is precipitated out onto the bacterium’s sheath, giving it a red hue, while the organic material can be used as carbon and energy sources (Madigan et al., 2003). This accumulation enables Leptothrix to withstand increased concentrations of iron (Paul and Clark, 1996).
Conclusion The presence of Leptothrix and other aquatic and sediment species indicate that the “orange floc” material is natural and safe. It is interesting to note, however, that Leptothrix’s ability to precipitate iron oxides onto its sheath might explain the disparate concentrations of sediment, dissolved, and total iron in areas with ”orange floc” in the Campbell Lake Tributary (concentrations of dissolved and sediment Fe provided by ARRI). The bacteria are pulling dissolved iron out of the water column and concentrating it in the sediment. This process could eventually become a problem if areas near the “orange floc” become negatively affected by increased iron concentrations, or areas downstream become iron deficient.
References Druschel, G., D. Emerson, R. Sutka, P. Suchecki, and G. Luther III. “Low-oxygen and Chemical Kinetic Constraints on the Geochemical Niche of Neutrophilic Iron(II) Oxidizing Microorganisms.” Geochimica Et Cosmochimica Acta 72.14 (2008): 3358-370. Print. Flowers, Seville. Algae of Utah. Salt Lake City: S.n., 1938. Print. Gelencsér, A., N. Kováts, B. Turóczi, A. Rostási, A. Hoffer, K. Imre, I. Nyirő-Kósa, D. Csákberényi- Malasics, A. Tóth, A. Czitrovszky, A. Nagy, S. Nagy, A. Ács, A. Kovács, A. Ferincz, Z. Hartyáni, and M. Pósfai. "The Red Mud Accident in Ajka (Hungary): Characterization and Potential Health Effects of Fugitive Dust." Environ. Sci. Technol. 45.4 (2011): 1608-615. Web of Knowledge. Web. 24 June 2013. Klebercz, O., W. M. Mayes, A. D. Anton, V. Feigl, A. P. Jarvis, and K. Gruiz. “Ecotoxicity of Fluvial Sediments Downstream of the Ajka Red Mud Spill, Hungary.” Journal of Environmental Monitoring 14.8 (2012): 2063-071. Web of Knowledge. Web. 24 June 2013. Madigan, Michael T., John M. Martinko, and Jack Parker. Brock Biology of Microorganisms. Upper Saddle River: Prentice Hall International, 2003. Print. Maier, Raina M., Ian L. Pepper, and Charles P. Gerba. Environmental Microbiology. Amsterdam [etc.: Elsevier/Academic, 2009. Print. Robbins, Norrie. What’s the Red in the Water? U.S. Geological Survey, 10 Jan. 2013. Web. 20 June 2013. <http://pubs.usgs.gov/gip/microbes/>. Paul, E. A., and Clark, F. E. Soil Microbiology and Biochemistry. London: Academic, 1996. Print.
ARRI July 2013 Campbell Lake Tributary Water Quality: Appendix B
AppendixB.ADFGPathologyLaboratoryReport
ACCESSION No. 2013-0040 - 1 -
ACCESSION NO: 2013-0040
ALASKA DEPARTMENT OF FISH AND GAME DIVISION OF COMMERCIAL FISHERIES - FISH PATHOLOGY SECTION
REPORT OF LABORATORY EXAMINATION LOT (YEAR, STOCK, SPECIES): Campbell Lake Chinook salmon, Oncorhynchus tshawytscha FACILITY: Aquatic Research and Restoration Institute CONTACT PERSON/ADDRESS: Gay Davis, P. O. Box 923, Talkeetna, AK 996576 SAMPLE DATE: 9/13/12 DATE SAMPLE RECEIVED: 9/14/12 LIFE STAGE: pre- smolt SPECIMEN TYPE: Whole fish STATE: Dead; transported at room temperature for 1.5 h, then refrigerated overnight. WILD: Unknown NUMBER OF SAMPLES: 1 HISTORY/SIGNS: Client is investigating the impacts of urban runoff on salmon in the Campbell Lake
area. This fish was found dead in a tributary of Campbell Lake, near Victor Rd, at 3:30 pm on 9/13/12. No primary pathogens were detected from dead fish in a previous report (Acc. No. 2013-0003). However, suboptimum water quality was suspected as the likely cause of mortality, as high temperature was recorded and turbid water indicated high TSS. Additional water quality data gathered in the present case includes: 0.56 µg/l dissolved copper, < 0.05 µg/l dissolved lead, 12.6 µg/l dissolved zinc and 0.05 mg/l dissolved iron.
REASON FOR SUBMISSION: Determine cause of mortality. FINAL REPORT DATE: 9/25/12 CLINICAL FINDINGS
NECROPSY: MORTALITIES: 1/1 abundant brown organic material, sticks, leaves, etc. on skin gills and mouth 1/1 lightly pink, but intact gills 0/1 abnormal interior gross findings 1/1 gill wet mount contained few trichodinids, many algae and copious amount of brown organic material 2/2 skin scrapings contained several motile and non-motile bacilli (post-mortem artifact), many algae and copious amounts of brown organic material 1/1 debris removed from mouth contained many motile bacilli (artifact), an adult female mite with 2-3 attached egg casings, one trichodinid, several algae and copious amounts of brown organic material FAT: 0/1 positive for Renibacterium salmoninarum BACTERIOLOGY: 0/1 kidneys struck on TSA at 15°C for 4 days had bacterial growth. DIAGNOSIS: Unknown, but likely related to water quality
ACCESSION No. 2013-0040 - 2 -
COMMENTS/RECOMMENDATIONS: No primary pathogens were detected in the fish that was submitted. A few trichodinids (ciliates) were observed, but these parasites are considered relatively weak pathogens compared to other external protozoans infesting fish. Although high numbers of these parasites can cause disease, this usually only occurs in aquaculture with stressed fish rearing at high densities under suboptimum conditions. Bacteria were not isolated on general nutrient media and there are no endemic viruses of Chinook salmon in Alaska that cause acute mortality. Furthermore, there were no clinical signs indicative of bacterial septicemia or viremia.
Water quality tests reported in the previous case (Acc. No. 2013-0003) indicated that high water
temperature and possibly high TSS were important contributory factors of mortality. Water from this location was retested for heavy metal content and results are reported above. Levels of dissolved metals that are associated with fish kills are as follows: 0.03-0.7 mg/l copper, 1-31.5 mg/l lead, 0.4-1.76 mg/l zinc and >0.5 mg/l iron (Noga, 2010). All reported values in the present case were below these lethal levels. Total metals were also measured and the high level of iron (9.3 mg/l) could indicate that the brown organic material observed on these fish is comprised of insoluble iron, as iron precipitates in the presence of oxygen and appears brown.
The cause of fish mortality in this project still remains unknown. However, the absence of
detectable primary pathogens supports that poor water quality is an important contributory factor. Additional sample submission to the Fish Pathology Laboratory is no longer warranted for this project because no infectious agents have been detected in several sampled fish. For future sample submission of other cases, refer to the submission guidelines emailed on 9/21/12, paying special attention to the need for contacting the laboratory prior to intended submission. Recommendations include continued monitoring of water quality.
FISH HEALTH INVESTIGATOR: Bentz, Ferguson
TECHNICAL ASSISTANCE: Dickson COPIES TO: FY2013, Misc., Otis, Hollowell, Lewis, Rozen, Davis, Rabung, Meyers REFERENCES: Noga, E.J., 2010. Fish Disease. Diagnosis and Treatment. Mosby-Year Book, Inc., Missouri, USA.
ARRI July 2013 Campbell Lake Tributary Water Quality: Appendix C
AppendixC.SitePhotographs
Photograph 1. Aerial view of Campbell Lake Tributary showing the location of the snow dump and sediment basin on the West side of C street and the sampling location on the West side of Victor Road. The tributary flows underground from the sediment basin to Victor Road.
Snow Dump and Sedimentation Pond
Sampling Location
ARRI July 2013 Campbell Lake Tributary Water Quality: Appendix C
Photograph 2. Aerial view of snow storage and sedimentation pond west of C Street.
Photograph 3. Campbell Lake tributary where it exits from the C Street culvert on July 19, 2012.
ARRI July 2013 Campbell Lake Tributary Water Quality: Appendix C
Photograph 4. Inlet to sedimentation pond July 19, 2012.
Photograph 5. Inlet to the C street sedimentation pond on July 19, 2012.
ARRI July 2013 Campbell Lake Tributary Water Quality: Appendix C
Photograph 6. Outlet C street sedimentation pond spillway on July 19, 2012. Campbell Lake tributary enters a culvert at this location and reemerges on the west side of Victor Road.
Photograph 7. Downstream culvert outlet at Victor Road on July 19, 2013.
ARRI July 2013 Campbell Lake Tributary Water Quality: Appendix C
Photograph 8. Campbell Lake tributary on July 19, 2012, showing coir log check dam and turbid water (7.8 NTU).
Photograph 9. Campbell Lake Tributary flowing into Campbell Lake on July 19, 2012.
ARRI July 2013 Campbell Lake Tributary Water Quality: Appendix C
Photograph 10. Chinook salmon mortality from Campbell Lake tributary collected on July 19, 2012.
Photograph 11. Sampling site downstream from Victor Road on July 24. Turbidity was 8.62 NTU
ARRI July 2013 Campbell Lake Tributary Water Quality: Appendix C
Photograph 12. Outlet of Victor Road culvert on August 1, 2012. Turbidity was 9.51 NTU.
ARRI July 2013 Campbell Lake Tributary Water Quality: Appendix C
Photograph 13. Outlet of Victor Road Culvert on August 16, 2012. Turbidity was 183 NTU.
Photograph 14. Plume of turbid water entering Campbell Lake on August 16, 2012.
ARRI July 2013 Campbell Lake Tributary Water Quality: Appendix C
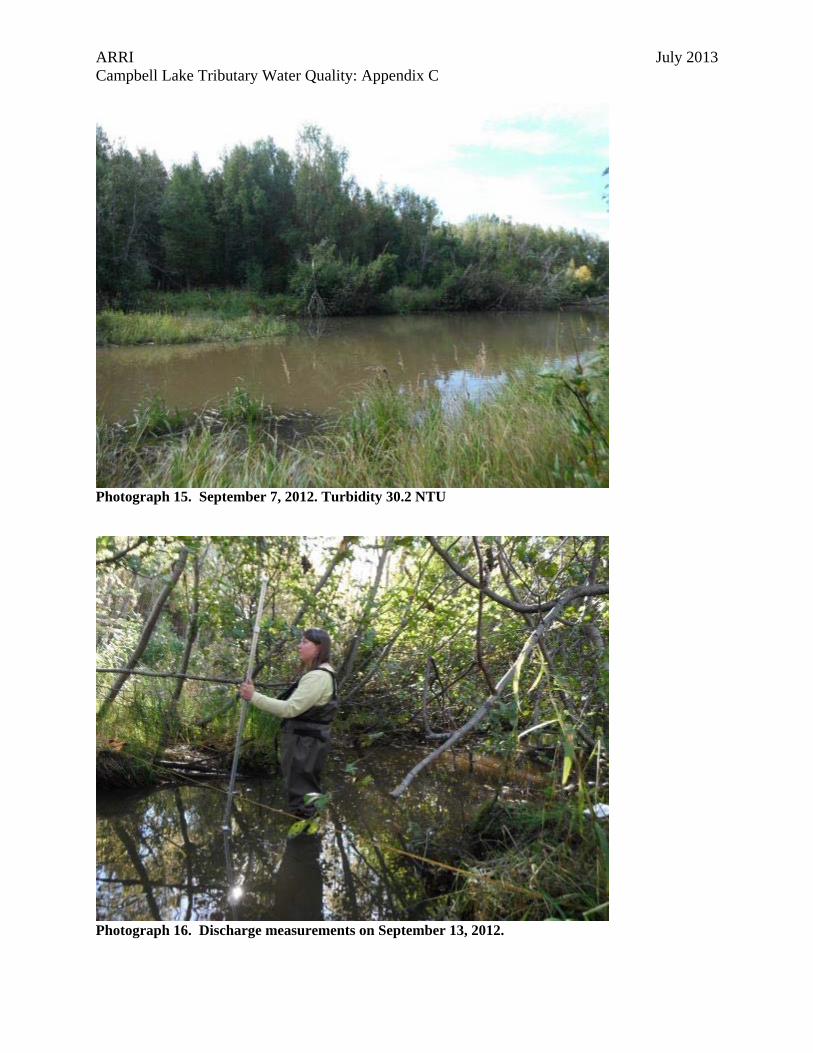
Photograph 15. September 7, 2012. Turbidity 30.2 NTU
Photograph 16. Discharge measurements on September 13, 2012.
ARRI July 2013 Campbell Lake Tributary Water Quality: Appendix C
Photograph 17. Mouth of Campbell Lake Tributary on September 21, 2012. Turbidity was 31.7 NTU.
Photograph 18. Rescued Red breasted nuthatch collected from the Victor Road culvert on September 27, 2012.
ARRI July 2013 Campbell Lake Tributary Water Quality: Appendix C
Photograph 19. Foam and debris at Victor Road culvert outlet on September 27, 2012. Turbidity was 10.4 NTU.
Photograph 20. Open water downstream from Victor Road culvert on February 14, 2013. Turbidity was 143.7 NTU.
ARRI July 2013 Campbell Lake Tributary Water Quality: Appendix C
Photograph 21. Ice surface at Victor Road culvert on March 19, 2013.
ARRI July 2013 Campbell Lake Tributary Water Quality: Appendix C
Photograph 22. Sampling below the sediment basin on May 21, 2013.
Photograph 23. Sheen caused by iron oxidizing bacteria near King Street.