17
CAMPUS PARKING AND TRANSPORTATION STUDY
| Date post: | 29-Apr-2018 |
| Category: |
Documents |
| Upload: | nguyendien |
| View: | 224 times |
| Download: | 4 times |
CAMPUS PARKING AND TRANSPORTATION STUDY
A P P E N D I X122 123K A N S A S S TAT E U N I V E R S I T Y N O R T H C A M P U S CO R R I D O R M A S T E R P L A N 2015
Table 1: Parking Space Inventor y
*Does not include motorcycle parking spaces
Parking Lot Type Designation Number of Spaces*
O Off Campus Students 619
W Faculty/ Staff 1,370
K Faculty/ Staff 84
T O, W, K Permits Valid 1,736
D Derby Complex Residents 345
GM Kramer Complex Residents 318
R Dormitory Residents 1,127
J Jardine Apartment Residents 1,326
Y Restricted Access 1,127
Z All Permits Valid 1,737
Parking Garage Faculty/ Staff Students and Metered 1,367
Other Miscellaneous 97
Total 11,253
Parking Garage
Existing Conditions
Parking Supply
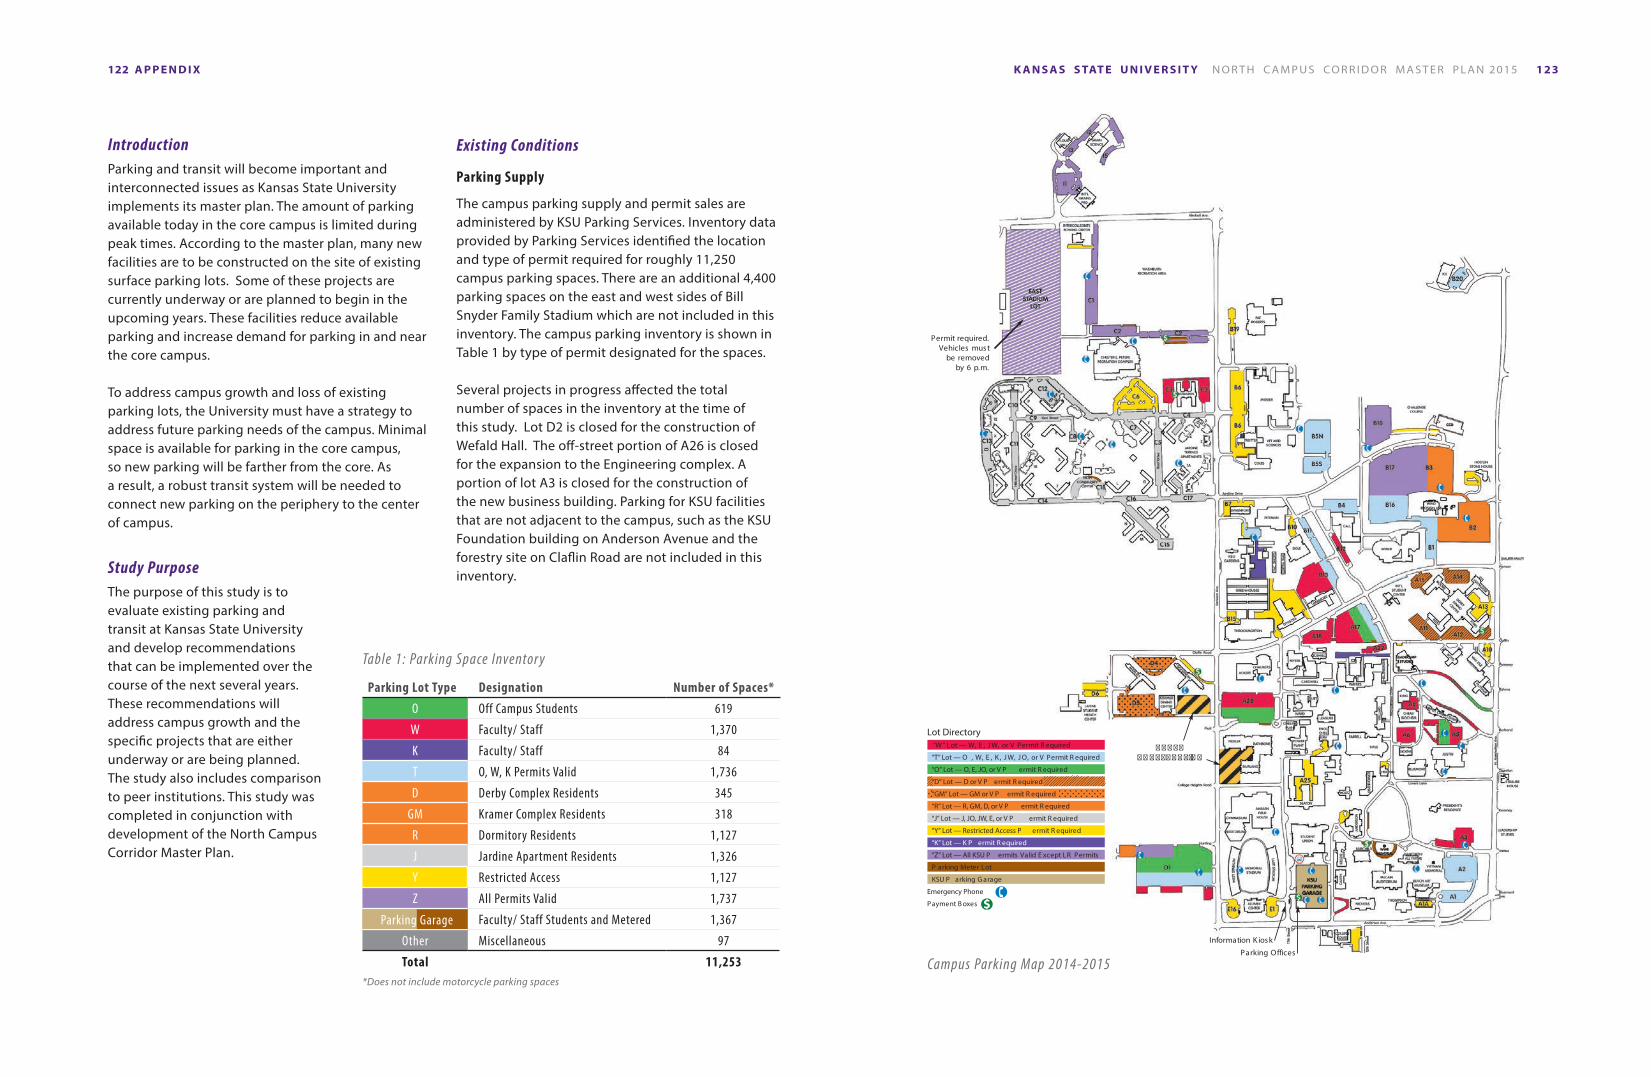
The campus parking supply and permit sales are administered by KSU Parking Services. Inventory data provided by Parking Services identified the location and type of permit required for roughly 11,250 campus parking spaces. There are an additional 4,400 parking spaces on the east and west sides of Bill Snyder Family Stadium which are not included in this inventory. The campus parking inventory is shown in Table 1 by type of permit designated for the spaces.
Several projects in progress affected the total number of spaces in the inventory at the time of this study. Lot D2 is closed for the construction of Wefald Hall. The off-street portion of A26 is closed for the expansion to the Engineering complex. A portion of lot A3 is closed for the construction of the new business building. Parking for KSU facilities that are not adjacent to the campus, such as the KSU Foundation building on Anderson Avenue and the forestry site on Claflin Road are not included in this inventory.Study Purpose
The purpose of this study is to evaluate existing parking and transit at Kansas State University and develop recommendations that can be implemented over the course of the next several years. These recommendations will address campus growth and the specific projects that are either underway or are being planned. The study also includes comparison to peer institutions. This study was completed in conjunction with development of the North Campus Corridor Master Plan.
IntroductionParking and transit will become important and interconnected issues as Kansas State University implements its master plan. The amount of parking available today in the core campus is limited during peak times. According to the master plan, many new facilities are to be constructed on the site of existing surface parking lots. Some of these projects are currently underway or are planned to begin in the upcoming years. These facilities reduce available parking and increase demand for parking in and near the core campus.
To address campus growth and loss of existing parking lots, the University must have a strategy to address future parking needs of the campus. Minimal space is available for parking in the core campus, so new parking will be farther from the core. As a result, a robust transit system will be needed to connect new parking on the periphery to the center of campus.
Lot Directory “W” Lot — W, E , J W, or V Permit R equired
“T” Lot — O , W, E , K , J W, J O, or V Permit R equired
“O” Lot — O, E, JO, or V P ermit R equired
“D” Lot — D or V P ermit R equired
“GM” Lot — GM or V P ermit R equired
“R” Lot — R, GM, D, or V P ermit R equired
“J” Lot — J, JO, JW, E, or V P ermit R equired
“Y” Lot — Restricted Access P ermit R equired
“K” Lot — K P ermit R equired
“Z” Lot — All KSU P ermits Valid E xcept LR Permits
P arking Meter Lot
KSU P arking G arage
Emergency Phone
Payment B oxes
Permit required.Vehicles must
be removed by 6 p.m.
Information K iosk
Parking Offices
� � � � �� � � � � � � � � �� �
Campus Parking Map 2014-2015
A P P E N D I X124 125K A N S A S S TAT E U N I V E R S I T Y N O R T H C A M P U S CO R R I D O R M A S T E R P L A N 2015
The inventory includes nearly 1,400 spaces in the parking garage located in the northeast corner of Anderson Avenue and 17th Street, on the south side of the Student Union. The garage includes 500 student spaces, 400 preferred spaces, 130 reserved spaces, and 270 metered spaces. Drivers with permits allowing garage access are issued an RFID tag that operates the entry and exit gates. All other drivers take a ticket upon entry to the garage. Ticketholders can pay at the garage exit or at pay stations in the garage stairwell. Construction of the garage was completed during the 2009 - 2010 school year. At the current rate of payment for the garage, the debt will not be retired until around 2040.
Parking Permits
The types of parking permits correspond to the different categories of parking needs for the campus. The type of permit fees, number of permits sold, and revenue is shown in Table 2.
The majority of parking on campus is for faculty, staff, and off-campus students who commute to campus primarily during business hours on weekdays. There are different types of permits available for commuters. The cost of a staff parking permit varies by salary level. A small number of permits for reserved parking can also be purchased in many of the surface parking lots and in the parking garage.
Many on-campus residents have a vehicle parked on campus throughout each day of the week, including weekends. Residence Hall students can purchase a D, R, or GM permit. Jardine Apartment residents can purchase either a J permit, or a JO permit for an additional $10. The JO permit allows them to park in both J and O lots.
The on-campus population in dormitories and apartments is roughly 5,200, and there were 3,877 on-campus resident parking permits sold during the 2014 - 2015 school year. This corresponds to approximately 75 percent of on-campus residents
purchasing parking permits, which is a higher percentage than are purchased by the off-campus student population. This is due in part to many off-campus students living close enough to campus that they can bike or walk. There are also a number of off-campus students who park on the streets in the neighborhoods surrounding the campus.
The total number of permits sold in 2014 – 2015 exceeds the inventory for an oversell ratio of 1.2 permits per parking space. Off-campus commuter parking is typically oversold on campuses because the demand for commuter parking varies by day of week and time of day. This is especially true of students who do not attend classes all day every day. Parking for on-campus residents cannot be oversold because essentially all residents with a vehicle need parking available overnight and during much of the weekday.
Parking fees will increase for each type of permit by approximately 5 percent for the 2015 – 2016 school year. With the fee increase, the average student permit (without parking garage access) will cost $180 per year and the average employee permit will cost $185 per year. If the same number of permits is sold in 2015 – 2016 with the new fee structure, the total revenue will be approximately $2,860,000.
Parking Data Collection
To determine how the existing parking supply is utilized, parking occupancy data was collected during typical weekdays when regular classes were in session. The number of parked vehicles was manually inventoried on Tuesday, December 9, 2014, and Wednesday, December 10, 2014. During these days, temperatures were close to the averages, skies were clear, and there was no precipitation. Inventories were conducted at each parking area every two hours during one of the days between 7:00 a.m. and 5:00 p.m. Parking occupancy data for the garage was derived from the count of entering and exiting vehicles, which was provided by Parking Services staff. The peak occupancy of each lot was generally
Table 2: 2014-2015 Annual Parking Permit Fees and Revenue
Parking Permit Type Designation Permit Cost Number of Permits Sold* Permit Revenue
O Off-Campus Student $170 2,109 $358,530
O (with garage access) Off-Campus Student $180 4,007 $721,260
R, D, GM Residence Hall $170 2,991 $508,470
J Jardine Apartment Residents $170 133 $22,6101
JO Jardine Resident Commuter $180 753 $135,540
W, K, Y Faculty Staff (FT1) $150 437 $65,550
Faculty Staff (FT2) $175 1,315 $203,125
Faculty Staff (FT3) $190 1,502 $285,380
12-Hour Reserved $900 89 $80,100
24-Hour Reserved $1,300 14 $18,200
Garage Preferred Faculty Staff $410 294 $120,540
Garage Reserved Faculty Staff $610 119 $72,590
Total 13,247 2,591,895
W, K, Y
*Through April 10, 2015
O (with garage access)
JO
Parking Lot Type Designation
Number of Spaces
Peak Occupancy
Percent Occupied
O Off-Campus Students 619 609 98%
W Faculty/ Staff 1,370 1,263 92%
K Faculty/ Staff 84 64 76%
T O, W, K Permits Valid 1,736 1,612 93%
D Derby Complex Residents 345 304 88%
GM Kramer Complex Residents
318 291 92%
R Residence Halls 1,127 1,132 100%
J Jardine Apartment Residents
1,326 959 72%
Y Restricted Access 1,127 875 78%
Z All Permits Valid 1,737 1,080 62%
Parking Garage
Faculty/ Staff Students and Metered
1,367 864 63%
Other Miscellaneous 97 78 80%
Total 11,253 9,131 81%
Table 3: Peak Parking Occupancy
A P P E N D I X126 127K A N S A S S TAT E U N I V E R S I T Y N O R T H C A M P U S CO R R I D O R M A S T E R P L A N 2015
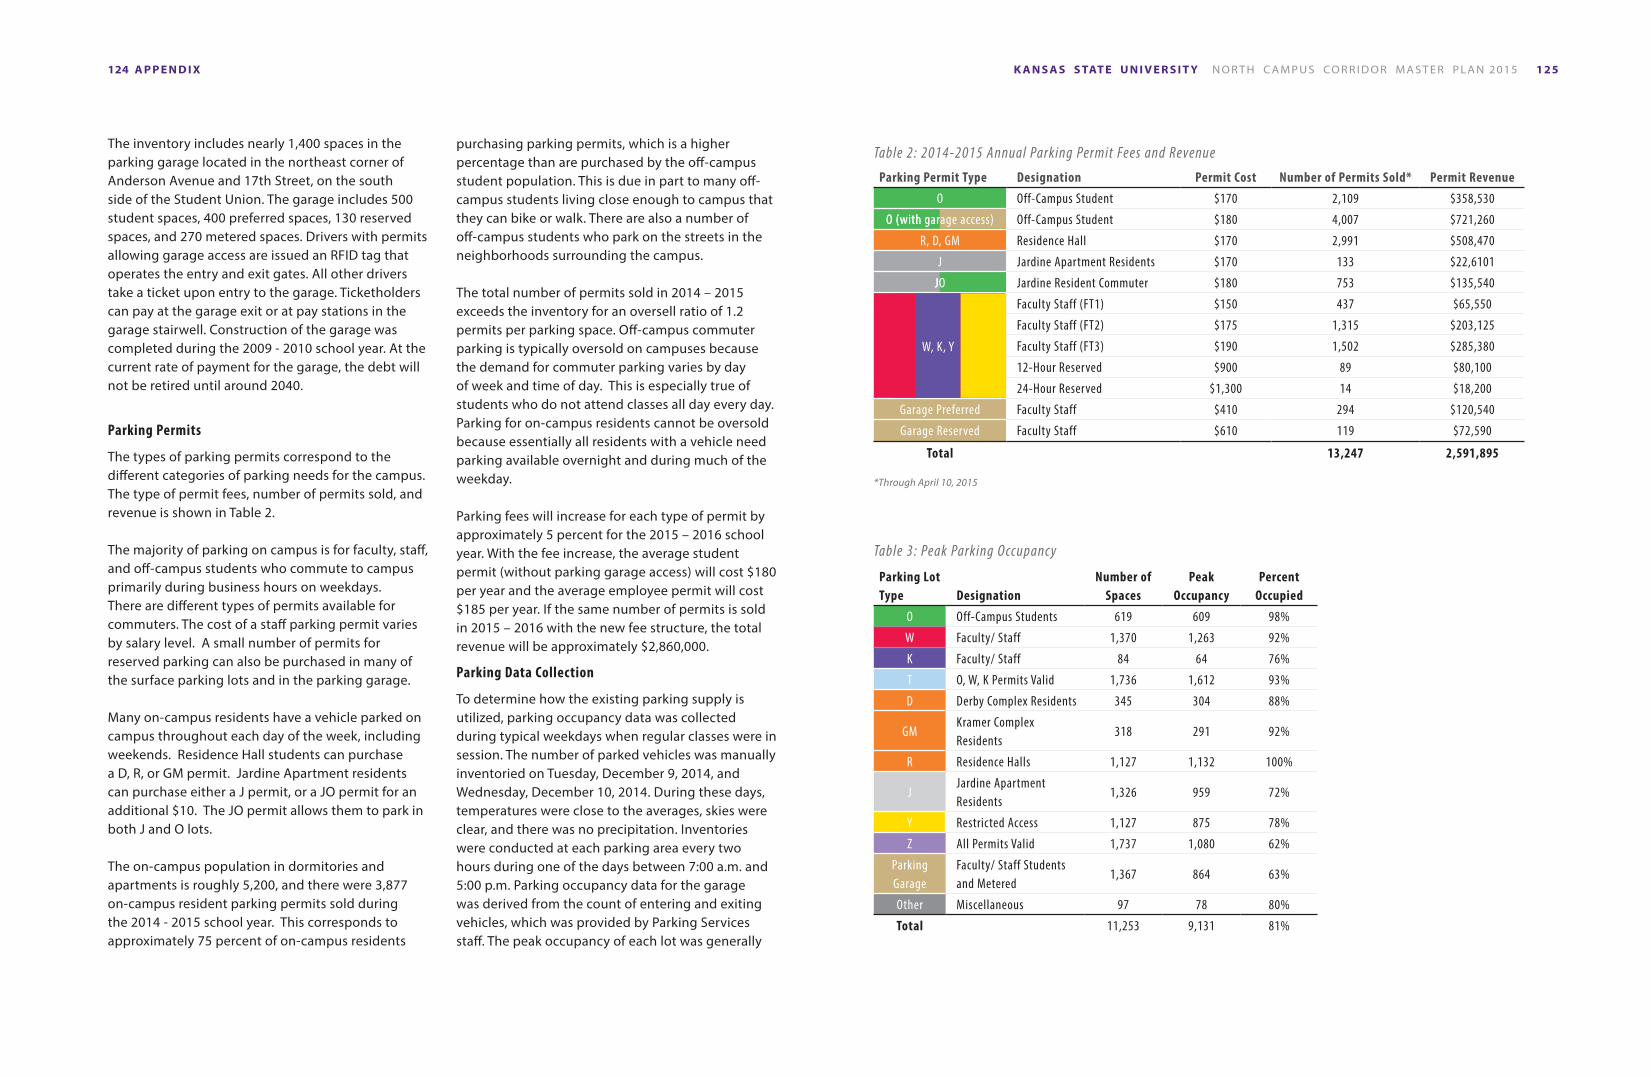
found to occur between 9:00 a.m. and 1:00 p.m. The results of the parking occupancy data collection is shown in Table 3.
The data collected indicates that most of the surface parking areas south of Claflin Road are essentially full at peak times on a typical weekday. The available parking remaining consists of reserved, metered, or handicapped spaces. Parking occupancy begins to decrease north of Claflin Road, but remains at 70 percent or more in most areas. The only sizable parking areas with low occupancy percentage are north of Jardine Drive. The exception to this is the parking garage at the Student Union. It has a low parking occupancy rate due to low usage of reserved, preferred, and metered parking at the time of the data collection.
Parking Occupancy During a Typical Weekday
Total Parking Demand O, T, W, Y, Z LotsD, GM, J, R Lots
9000
8000
7000
6000
5000
4000
3000
2000
1000
07:00 AM
Occu
pied
Par
king
Spa
ces
9:00 AM 11:00 AM 1:00 PM 3:00 PM 5:00 PM
The graph illustrates the demand for parking over the course of a typical weekday. The peak demand for parking on campus occurs at 11:00 a.m., then slowly declines throughout the afternoon. One trend to note is demonstrated when the parking demand for on-campus residents and commuters is separated. The demand for on-campus residents is essentially unchanged throughout the course of a typical weekday, while the commuter demand fluctuates. This indicates that on-campus residents generally do not use their vehicles over the course of a typical weekday. Many on-campus residents park in Z lot as well (lot D1 and B17) because R lots are at capacity during all time periods.
Existing Peak Parking Occupancy
< 50% Peak Occupancy
71%-85% Peak Occupancy
> 95% Peak Occupancy
50%-70% Peak Occupancy
86%-95% Peak Occupancy
N0’ 1200’
Kimball Avenue
Kimball Avenue
Jardine Drive
Anderson Avenue
Deni
son
Aven
ue
N. M
anha
ttan
Ave
nue
Colle
ge A
venu
e
Hillc
rest
Driv
e
Claflin Road
A P P E N D I X128 129K A N S A S S TAT E U N I V E R S I T Y N O R T H C A M P U S CO R R I D O R M A S T E R P L A N 2015
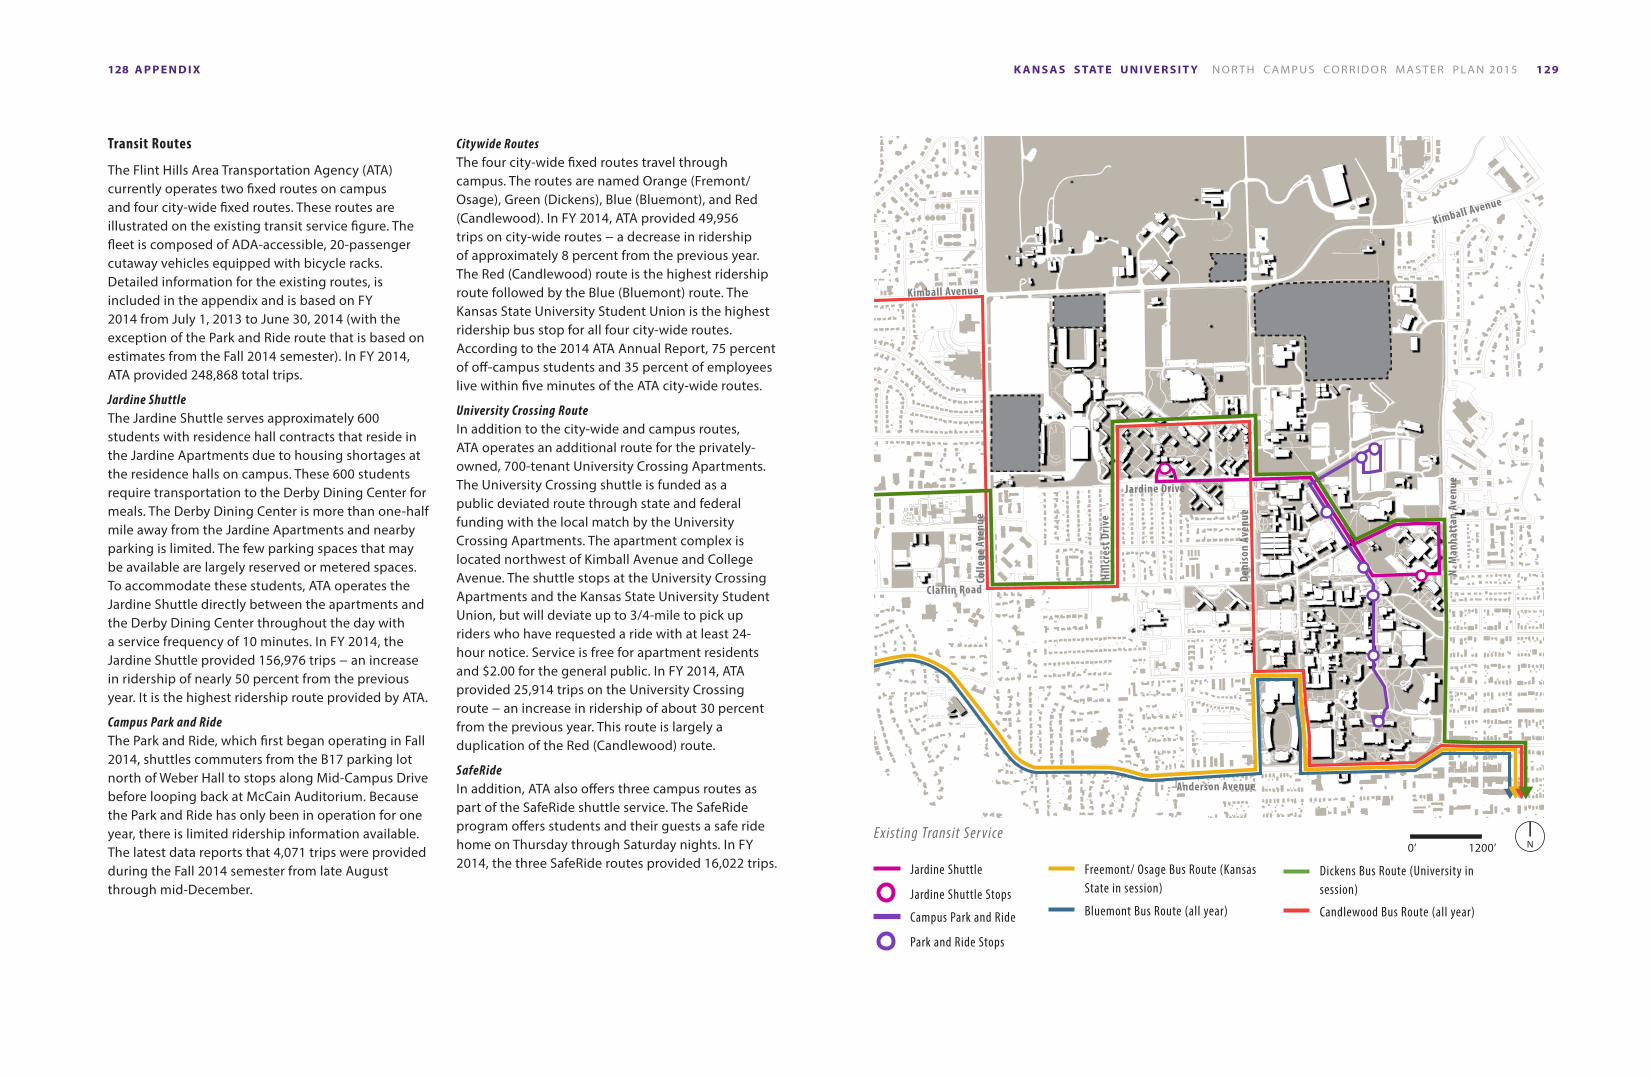
Transit Routes
The Flint Hills Area Transportation Agency (ATA) currently operates two fixed routes on campus and four city-wide fixed routes. These routes are illustrated on the existing transit service figure. The fleet is composed of ADA-accessible, 20-passenger cutaway vehicles equipped with bicycle racks. Detailed information for the existing routes, is included in the appendix and is based on FY 2014 from July 1, 2013 to June 30, 2014 (with the exception of the Park and Ride route that is based on estimates from the Fall 2014 semester). In FY 2014, ATA provided 248,868 total trips.
Jardine ShuttleThe Jardine Shuttle serves approximately 600 students with residence hall contracts that reside in the Jardine Apartments due to housing shortages at the residence halls on campus. These 600 students require transportation to the Derby Dining Center for meals. The Derby Dining Center is more than one-half mile away from the Jardine Apartments and nearby parking is limited. The few parking spaces that may be available are largely reserved or metered spaces. To accommodate these students, ATA operates the Jardine Shuttle directly between the apartments and the Derby Dining Center throughout the day with a service frequency of 10 minutes. In FY 2014, the Jardine Shuttle provided 156,976 trips − an increase in ridership of nearly 50 percent from the previous year. It is the highest ridership route provided by ATA.
Campus Park and RideThe Park and Ride, which first began operating in Fall 2014, shuttles commuters from the B17 parking lot north of Weber Hall to stops along Mid-Campus Drive before looping back at McCain Auditorium. Because the Park and Ride has only been in operation for one year, there is limited ridership information available. The latest data reports that 4,071 trips were provided during the Fall 2014 semester from late August through mid-December.
Citywide RoutesThe four city-wide fixed routes travel through campus. The routes are named Orange (Fremont/Osage), Green (Dickens), Blue (Bluemont), and Red (Candlewood). In FY 2014, ATA provided 49,956 trips on city-wide routes − a decrease in ridership of approximately 8 percent from the previous year. The Red (Candlewood) route is the highest ridership route followed by the Blue (Bluemont) route. The Kansas State University Student Union is the highest ridership bus stop for all four city-wide routes. According to the 2014 ATA Annual Report, 75 percent of off-campus students and 35 percent of employees live within five minutes of the ATA city-wide routes.
University Crossing RouteIn addition to the city-wide and campus routes, ATA operates an additional route for the privately-owned, 700-tenant University Crossing Apartments. The University Crossing shuttle is funded as a public deviated route through state and federal funding with the local match by the University Crossing Apartments. The apartment complex is located northwest of Kimball Avenue and College Avenue. The shuttle stops at the University Crossing Apartments and the Kansas State University Student Union, but will deviate up to 3/4-mile to pick up riders who have requested a ride with at least 24-hour notice. Service is free for apartment residents and $2.00 for the general public. In FY 2014, ATA provided 25,914 trips on the University Crossing route − an increase in ridership of about 30 percent from the previous year. This route is largely a duplication of the Red (Candlewood) route.
SafeRideIn addition, ATA also offers three campus routes as part of the SafeRide shuttle service. The SafeRide program offers students and their guests a safe ride home on Thursday through Saturday nights. In FY 2014, the three SafeRide routes provided 16,022 trips.
Existing Transit Ser viceN0’ 1200’
Dickens Bus Route (University in session)
Candlewood Bus Route (all year)Bluemont Bus Route (all year)
Freemont/ Osage Bus Route (Kansas State in session)
Jardine Shuttle
Jardine Shuttle Stops
Campus Park and Ride
Park and Ride Stops
Kimball Avenue
Kimball Avenue
Jardine Drive
Anderson Avenue
Deni
son
Aven
ue
N. M
anha
ttan
Ave
nue
Colle
ge A
venu
e
Hillc
rest
Driv
e
Claflin Road
A P P E N D I X130 131K A N S A S S TAT E U N I V E R S I T Y N O R T H C A M P U S CO R R I D O R M A S T E R P L A N 2015
Transit Revenue and Operating Costs
In FY 2014, ATA had a total revenue of $1,831,410 (including demand response service). Federal grants provided $1,142,829 while service contracts generated $550,975. Farebox recovery generated an additional $130,982. Excluding federal funding, the largest source of funds is the service contract with Kansas State University for $289,750 − approximately 16 percent of the total revenue. The University contract covers the operating cost for the campus routes in addition to subsidizing a portion of the city-wide routes. Because the Park and Ride shuttle was not in operation during FY 2014, the referenced contract information does not include the Park and Ride route (estimate provided by ATA for the Park and Ride route for the Fall 2014 semester is approximately $37,000).
Campus routes are currently funded by six different funding sources: four KSU departments, one private entity, and general ATA funding through state and federal funds. There is no student fee dedicated to transit service at this time and service on the campus routes is provided at no charge to students, faculty, and staff with valid KSU identification. Students, faculty, and staff are also eligible for free point-to-point service on the city-wide routes only from the Kansas State University Foundation, the Student Union, or Edwards Hall. Full fare for the general public on city-wide and campus routes is $1.00 (with the exception of SafeRide routes for $2.00 for the general public).
The total operating budget for FY 2014 was $562,316. Of that budget, the Jardine shuttle has an annual operating cost of $114,417, which converts to an hourly operating cost of $23.38 per hour. Annual operating cost of the campus Park and Ride route is not included in the budget as it was not in operation during FY 2014. The operating cost for the Park and Ride route is estimated to be $74,000, or an hourly operating cost of roughly $38.50 per hour.
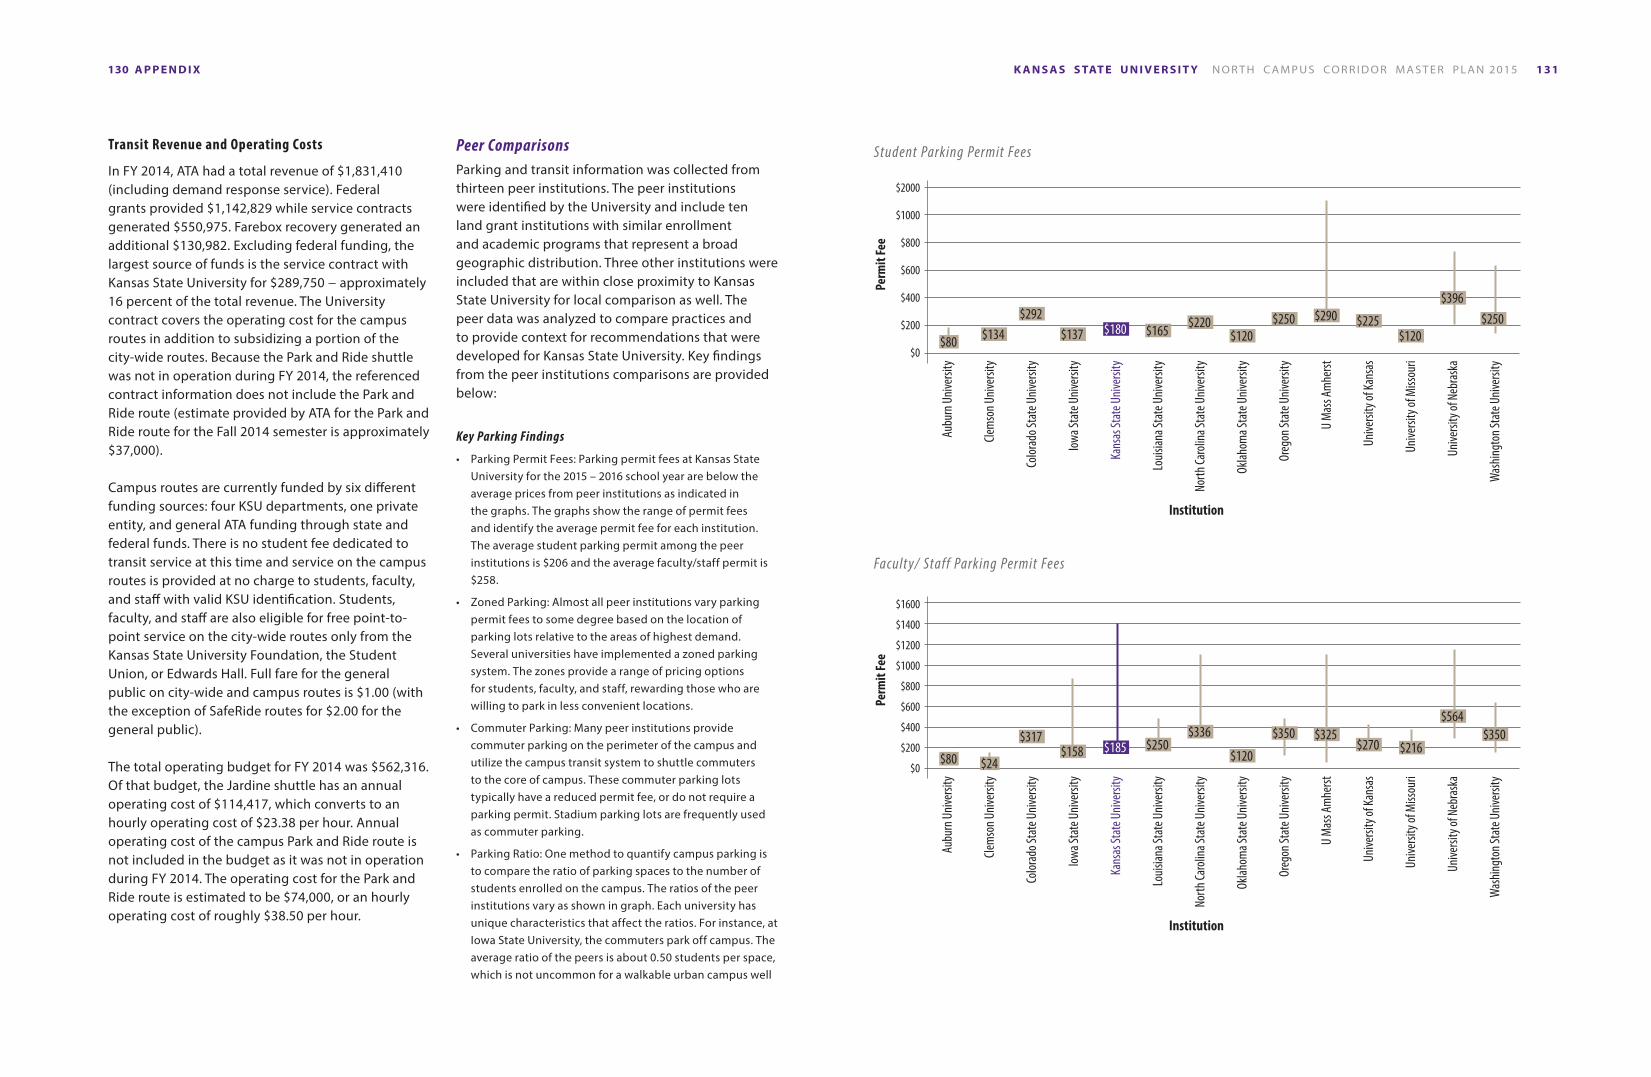
Peer ComparisonsParking and transit information was collected from thirteen peer institutions. The peer institutions were identified by the University and include ten land grant institutions with similar enrollment and academic programs that represent a broad geographic distribution. Three other institutions were included that are within close proximity to Kansas State University for local comparison as well. The peer data was analyzed to compare practices and to provide context for recommendations that were developed for Kansas State University. Key findings from the peer institutions comparisons are provided below:
Key Parking Findings
• Parking Permit Fees: Parking permit fees at Kansas State University for the 2015 – 2016 school year are below the average prices from peer institutions as indicated in the graphs. The graphs show the range of permit fees and identify the average permit fee for each institution. The average student parking permit among the peer institutions is $206 and the average faculty/staff permit is $258.
• Zoned Parking: Almost all peer institutions vary parking permit fees to some degree based on the location of parking lots relative to the areas of highest demand. Several universities have implemented a zoned parking system. The zones provide a range of pricing options for students, faculty, and staff, rewarding those who are willing to park in less convenient locations.
• Commuter Parking: Many peer institutions provide commuter parking on the perimeter of the campus and utilize the campus transit system to shuttle commuters to the core of campus. These commuter parking lots typically have a reduced permit fee, or do not require a parking permit. Stadium parking lots are frequently used as commuter parking.
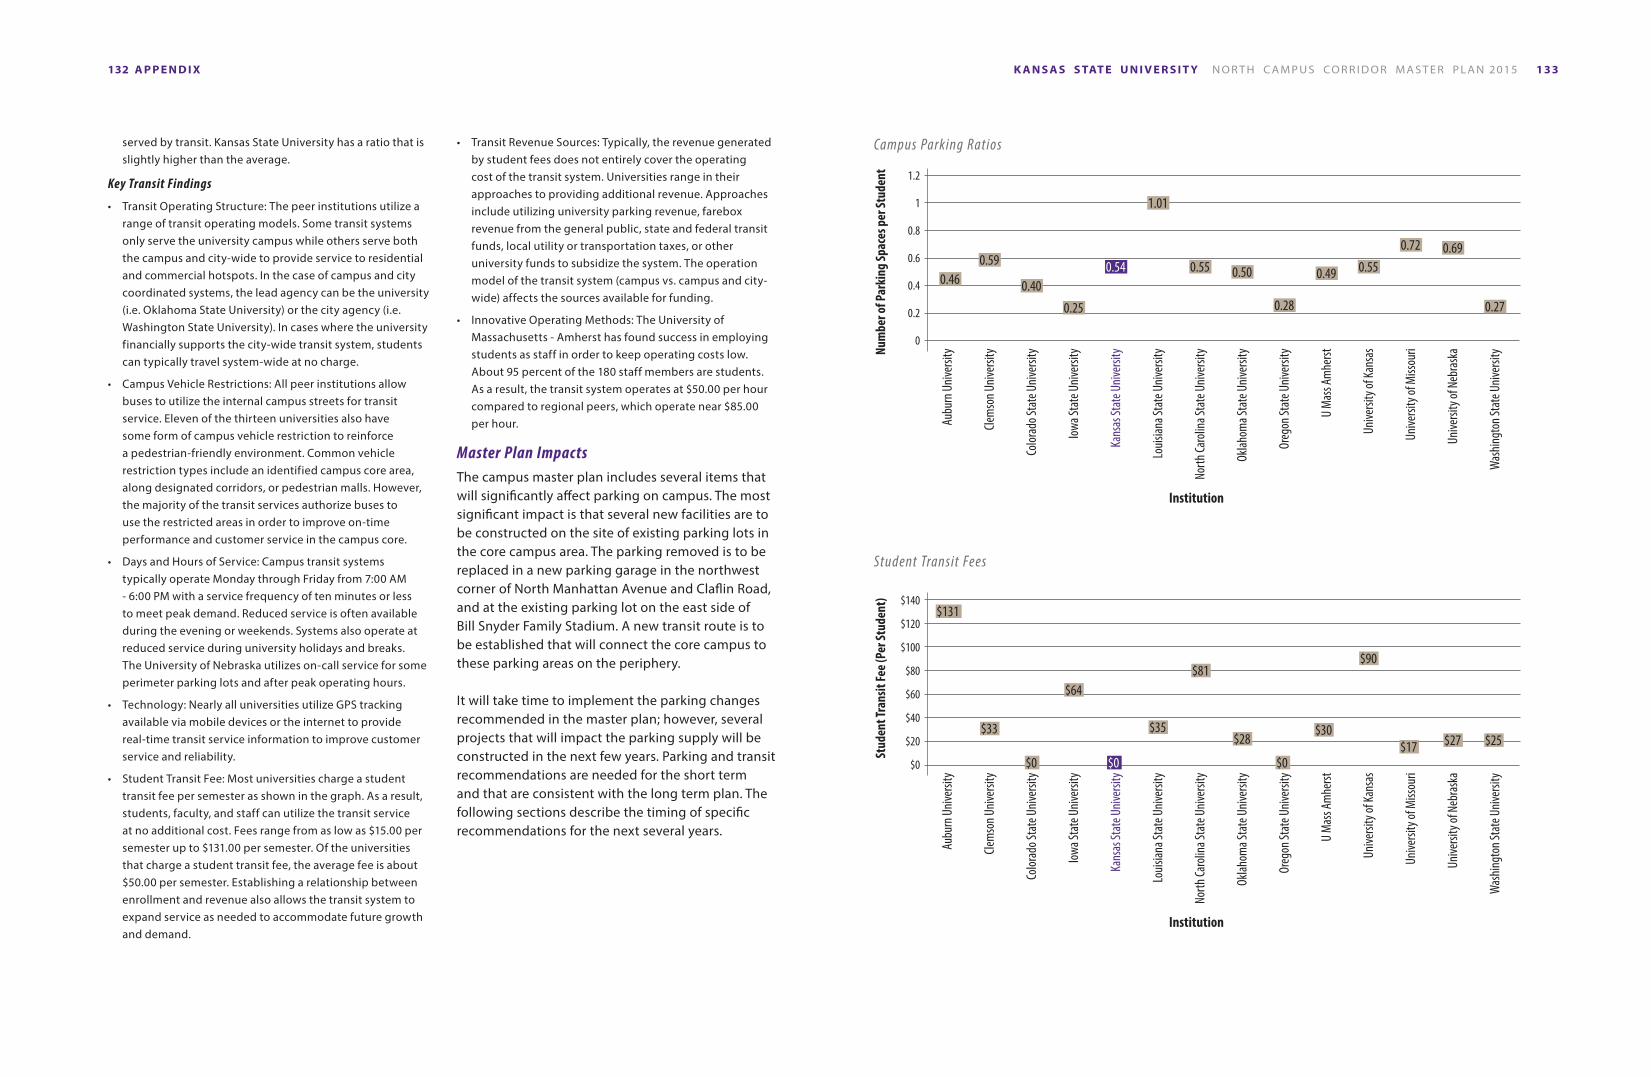
• Parking Ratio: One method to quantify campus parking is to compare the ratio of parking spaces to the number of students enrolled on the campus. The ratios of the peer institutions vary as shown in graph. Each university has unique characteristics that affect the ratios. For instance, at Iowa State University, the commuters park off campus. The average ratio of the peers is about 0.50 students per space, which is not uncommon for a walkable urban campus well
Aubu
rn U
niver
sity
Perm
it Fe
e
Clem
son U
niver
sity
Color
ado S
tate
Univ
ersit
y
Iowa S
tate
Univ
ersit
y
Kans
as St
ate U
niver
sity
Louis
iana S
tate
Univ
ersit
y
North
Caro
lina S
tate
Univ
ersit
y
Oklah
oma S
tate
Univ
ersit
y
Oreg
on St
ate U
niver
sity
U M
ass A
mhe
rst
Unive
rsity
of Ka
nsas
Unive
rsity
of M
issou
ri
Unive
rsity
of N
ebra
ska
Was
hingt
on St
ate U
niver
sity
$0
Institution
$200
$400
$600
$800
$1000
$2000
$80 $134 $137 $120 $120$180 $165 $220 $225$250 $250$290$396
$292
Aubu
rn U
niver
sity
Perm
it Fe
e
Clem
son U
niver
sity
Color
ado S
tate
Univ
ersit
y
Iowa S
tate
Univ
ersit
y
Kans
as St
ate U
niver
sity
Louis
iana S
tate
Univ
ersit
y
North
Caro
lina S
tate
Univ
ersit
y
Oklah
oma S
tate
Univ
ersit
y
Oreg
on St
ate U
niver
sity
U M
ass A
mhe
rst
Unive
rsity
of Ka
nsas
Unive
rsity
of M
issou
ri
Unive
rsity
of N
ebra
ska
Was
hingt
on St
ate U
niver
sity
$0
Institution
$200
$400
$600
$800
$1000
$1200
$1400
$1600
$80 $24$158 $120
$270$185 $250$336 $350 $325
$216$350
$564$317
Student Parking Permit Fees
Facult y/ Staff Parking Permit Fees
A P P E N D I X132 133K A N S A S S TAT E U N I V E R S I T Y N O R T H C A M P U S CO R R I D O R M A S T E R P L A N 2015
served by transit. Kansas State University has a ratio that is slightly higher than the average.
Key Transit Findings
• Transit Operating Structure: The peer institutions utilize a range of transit operating models. Some transit systems only serve the university campus while others serve both the campus and city-wide to provide service to residential and commercial hotspots. In the case of campus and city coordinated systems, the lead agency can be the university (i.e. Oklahoma State University) or the city agency (i.e. Washington State University). In cases where the university financially supports the city-wide transit system, students can typically travel system-wide at no charge.
• Campus Vehicle Restrictions: All peer institutions allow buses to utilize the internal campus streets for transit service. Eleven of the thirteen universities also have some form of campus vehicle restriction to reinforce a pedestrian-friendly environment. Common vehicle restriction types include an identified campus core area, along designated corridors, or pedestrian malls. However, the majority of the transit services authorize buses to use the restricted areas in order to improve on-time performance and customer service in the campus core.
• Days and Hours of Service: Campus transit systems typically operate Monday through Friday from 7:00 AM - 6:00 PM with a service frequency of ten minutes or less to meet peak demand. Reduced service is often available during the evening or weekends. Systems also operate at reduced service during university holidays and breaks. The University of Nebraska utilizes on-call service for some perimeter parking lots and after peak operating hours.
• Technology: Nearly all universities utilize GPS tracking available via mobile devices or the internet to provide real-time transit service information to improve customer service and reliability.
• Student Transit Fee: Most universities charge a student transit fee per semester as shown in the graph. As a result, students, faculty, and staff can utilize the transit service at no additional cost. Fees range from as low as $15.00 per semester up to $131.00 per semester. Of the universities that charge a student transit fee, the average fee is about $50.00 per semester. Establishing a relationship between enrollment and revenue also allows the transit system to expand service as needed to accommodate future growth and demand.
• Transit Revenue Sources: Typically, the revenue generated by student fees does not entirely cover the operating cost of the transit system. Universities range in their approaches to providing additional revenue. Approaches include utilizing university parking revenue, farebox revenue from the general public, state and federal transit funds, local utility or transportation taxes, or other university funds to subsidize the system. The operation model of the transit system (campus vs. campus and city-wide) affects the sources available for funding.
• Innovative Operating Methods: The University of Massachusetts - Amherst has found success in employing students as staff in order to keep operating costs low. About 95 percent of the 180 staff members are students. As a result, the transit system operates at $50.00 per hour compared to regional peers, which operate near $85.00 per hour.
Master Plan ImpactsThe campus master plan includes several items that will significantly affect parking on campus. The most significant impact is that several new facilities are to be constructed on the site of existing parking lots in the core campus area. The parking removed is to be replaced in a new parking garage in the northwest corner of North Manhattan Avenue and Claflin Road, and at the existing parking lot on the east side of Bill Snyder Family Stadium. A new transit route is to be established that will connect the core campus to these parking areas on the periphery.
It will take time to implement the parking changes recommended in the master plan; however, several projects that will impact the parking supply will be constructed in the next few years. Parking and transit recommendations are needed for the short term and that are consistent with the long term plan. The following sections describe the timing of specific recommendations for the next several years.
Aubu
rn U
niver
sityNu
mbe
r of P
arki
ng Sp
aces
per
Stud
ent
Clem
son U
niver
sity
Color
ado S
tate
Univ
ersit
y
Iowa S
tate
Univ
ersit
y
Kans
as St
ate U
niver
sity
Louis
iana S
tate
Univ
ersit
y
North
Caro
lina S
tate
Univ
ersit
y
Oklah
oma S
tate
Univ
ersit
y
Oreg
on St
ate U
niver
sity
U M
ass A
mhe
rst
Unive
rsity
of Ka
nsas
Unive
rsity
of M
issou
ri
Unive
rsity
of N
ebra
ska
Was
hingt
on St
ate U
niver
sity
0
Institution
0.2
0.4
0.6
0.8
1
1.2
0.46 0.40
0.25 0.28 0.27
0.59 0.54 0.55 0.550.690.72
0.50 0.49
1.01
Aubu
rn U
niver
sity
Stud
ent T
rans
it Fe
e (Pe
r Stu
dent
)
Clem
son U
niver
sity
Color
ado S
tate
Univ
ersit
y
Iowa S
tate
Univ
ersit
y
Kans
as St
ate U
niver
sity
Louis
iana S
tate
Univ
ersit
y
North
Caro
lina S
tate
Univ
ersit
y
Oklah
oma S
tate
Univ
ersit
y
Oreg
on St
ate U
niver
sity
U M
ass A
mhe
rst
Unive
rsity
of Ka
nsas
Unive
rsity
of M
issou
ri
Unive
rsity
of N
ebra
ska
Was
hingt
on St
ate U
niver
sity
$0
Institution
$20
$40
$60
$80
$100
$120
$140
$33 $35 $30$28 $27 $25$17
$64$81
$90
$0 $0 $0
$131
Campus Parking Ratios
Student Transit Fees
A P P E N D I X134 135K A N S A S S TAT E U N I V E R S I T Y N O R T H C A M P U S CO R R I D O R M A S T E R P L A N 2015
2015 – 2016 School Year Impacts
Construction of a new chiller plant began in the spring of 2015. During construction, 200 parking spaces north of Weber Hall in lot B16 will be used for construction vehicles for the school year. At the time of data collection, lot B16 had a capacity of 271 spaces, with a peak occupancy of 215 (79%). Based on the data collected, there will be capacity in nearby lots B17 and B18 to accommodate the loss of parking in B16; however all three of these lots will be near capacity at peak times. During parking data collection, equipment and trailers were observed parking in lot B18. To maximize the capacity of the lot, these vehicles should be moved out of the lot.
To increase availability of parking in “O” lots, the “JO” permit should be discontinued. Jardine Apartment residents already have parking spaces allotted for them on campus in J lots. As such, it is not necessary to allow them access to the “O” lots as well. This will be a major change for Jardine Apartments residents, however they do have options to travel to destinations on campus. They can walk, bicycle, or ride transit.
In conjunction with the chiller plan project, Mid-Campus Drive will be reconstructed as a pedestrian mall between Lovers Lane and Old Claflin Road. The pedestrian mall will be constructed as a 26-foot wide concrete corridor. The pedestrian mall will be closed to public travel, however emergency and service vehicles will be able to travel on the corridor. This change will impact the Park and Ride route, as it travels primarily on Mid-Campus Drive.
The Park and Ride should be able to continue operating on Mid-Campus Drive after it is converted to a pedestrian mall. Since the pedestrian mall has been designed to accommodate emergency and service vehicle traffic, the 20-passenger cutaway buses should not have any difficulty traveling
through the corridor. It should be noted that other peer institutions permit buses to operate on designated corridors where vehicle use is typically restricted.
Allowing transit to operate along the pedestrian mall is a safety concern since pedestrians may not anticipate vehicle traffic on Mid-Campus Drive. Travel speeds of buses on the corridor will be slow, allowing ample time for bus drivers and pedestrians to observe and react to conditions. Currently, the Park and Ride route is not significantly hindered by pedestrian traffic on Mid-Campus Drive. Nonetheless, the current Park and Ride schedule can shift approximately five minutes in an effort to avoid class change times and reduce pedestrian conflicts during peak times. This is most significant near Hale Library and Willard Hall. The operation of the Park and Ride on the pedestrian mall can also serve as a trial to assess the safety and operational impacts of transit on the pedestrian mall. The outcome of the trial will have implications on future route options as the campus transit service expands.
2015 – 2016 Recommendations
• Move all equipment and trailers out of Lot B18
• Discontinue sale of “JO” parking permits
• Operate Park and Ride route on the Mid-Campus Drive pedestrian mall
• Adjust Park and Ride schedule to avoid peak pedestrian conflicts during class change times
2016 – 2017 School Year Impacts
Two large projects will be complete for the 2016– 2017 school year. The new College of Business Administration (CBA) building and Wefald Hall will open. Both buildings will have a nominal effect on the parking supply, as few spaces will be added. The parking data collected already accounts for parking displaced by the two buildings, because those areas were closed when the parking supply and occupancy data was collected.
The demand for on-campus resident parking will increase for the 2016 – 2017 school year. Wefald Hall will add 540 beds for on-campus residents. The initial occupancy of Wefald Hall is not known but, there will be no more residence hall contract students living at the Jardine Apartments when Wefald hall opens. Based on current parking permit sales, 75 percent of on-campus residents purchase a parking permit. Therefore, at least 400 parking spaces are needed for Wefald Hall at full occupancy. The CBA building will have a minimal effect on parking demand in the short term, as the college is already on campus and will grow into the new space over time.
There is no parking available adjacent to Wefald Hall that can accommodate the new demand. Residents of the Kramer complex (residence halls adjacent to Wefald Hall) currently park in lots D1, B2, B3, and B17. These lots are between 1/3 and 2/3 of a mile from the Kramer complex. This distance is an existing concern of these residents since they must walk to get to and from their vehicles. There is no capacity available in lots D1, B2, or B3. Chiller plant construction will be complete in 2016, restoring the capacity of lot B16 to 200 spaces, which will increase availability in the adjacent lots B17 and B18. Even so, there will only be about 200 spaces available in those lots. The result is between 200 and 400 additional parking spaces will need to be provided for Wefald Hall residents.
The only area on campus with significant available parking will be near Bill Snyder Family Stadium. The condition of the pavement at the stadium will not support everyday vehicle traffic and will need to be reconstructed before it is used on a daily basis. Parking at the east stadium lot is not a desirable option for residence hall students, as the lot must be vacated before men’s and women’s basketball games and football games. Therefore, the east stadium lot is only an option for commuter parking. Coordination with the Athletics department will be essential to make sure that the commuters have exited the lot in time for game traffic to arrive. Commuter parking could be consolidated to the east stadium lot, allowing lot B18 and a portion of lot B17 to be designated for residence hall parking. Residents would then be able to ride campus transit to and from their vehicles parking in these lots. Another option would be to designate more space in the D1 lot for residents, however it would not be served by transit. Commuters currently parking in the D1 lot could be relocated to the east stadium lot and/or the parking garage. Allotting more spaces in the garage to commuters would require a policy change.
Ongoing coordination with the Athletics Department will be essential to ensure that parking is provided for commuters and for basketball operations. The parking lot is used on a daily basis for the Basketball Training Facility. On basketball game days, a portion of the lot is needed for Athletics staff, media, and special guests.
A P P E N D I X136 137K A N S A S S TAT E U N I V E R S I T Y N O R T H C A M P U S CO R R I D O R M A S T E R P L A N 2015
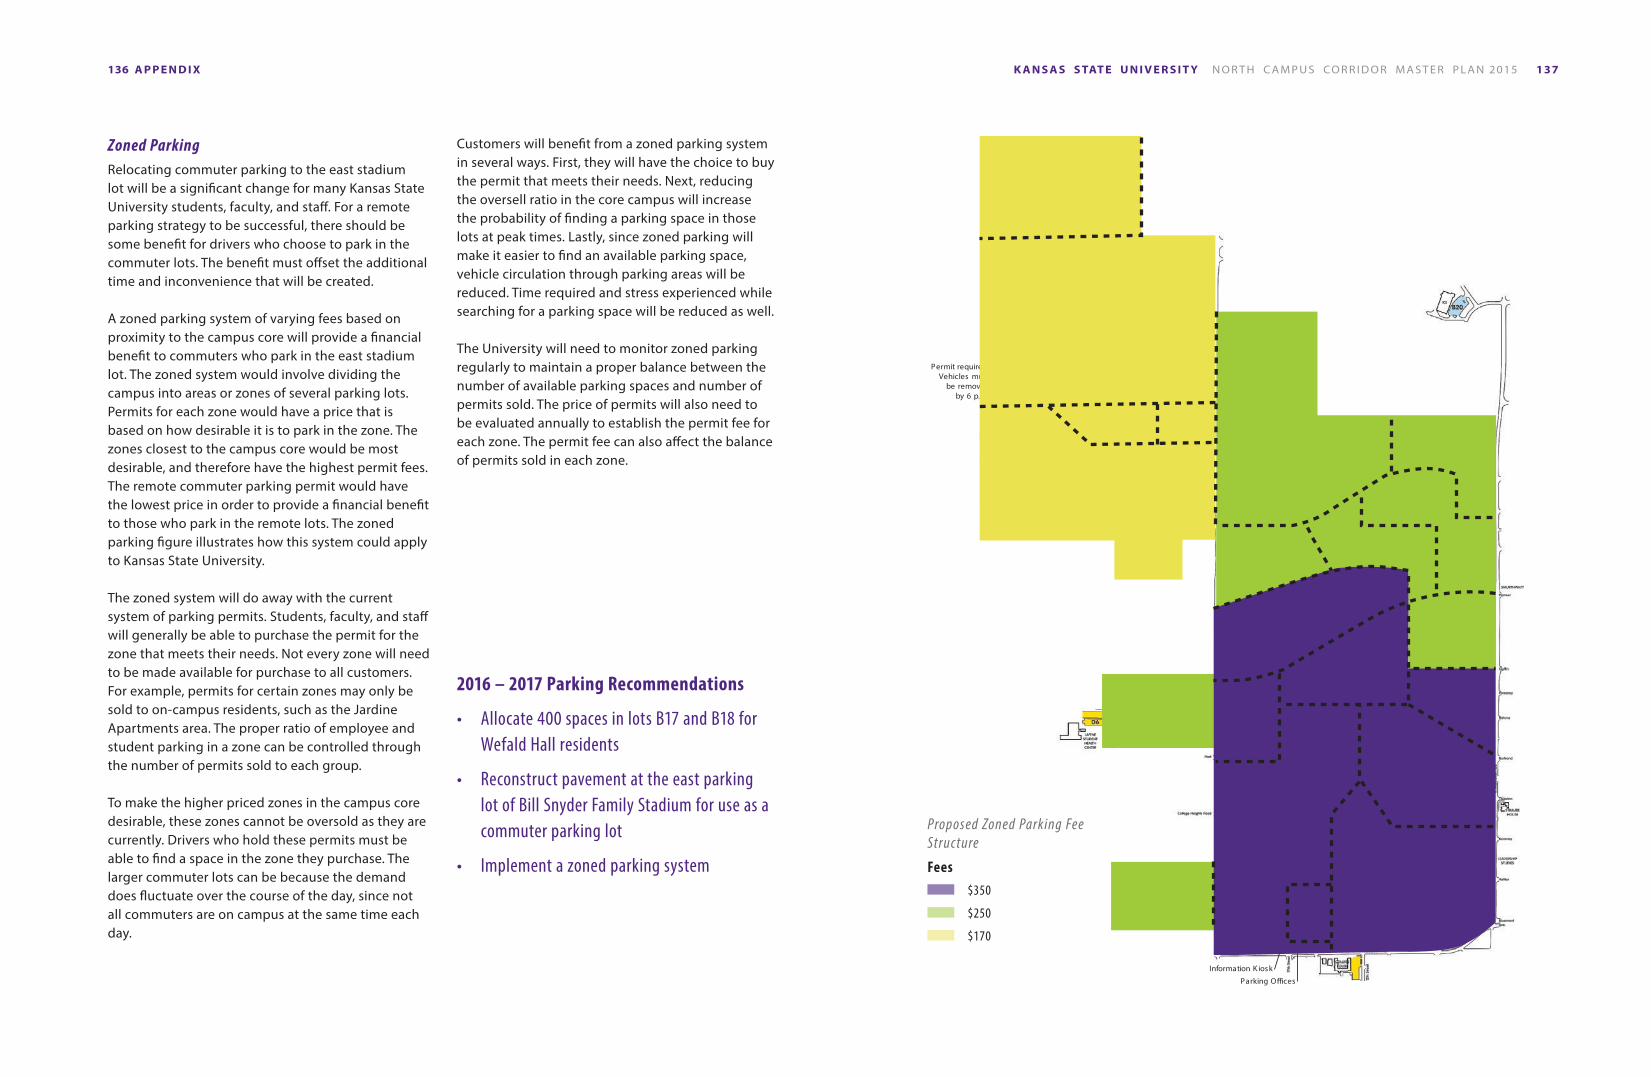
Zoned ParkingRelocating commuter parking to the east stadium lot will be a significant change for many Kansas State University students, faculty, and staff. For a remote parking strategy to be successful, there should be some benefit for drivers who choose to park in the commuter lots. The benefit must offset the additional time and inconvenience that will be created.
A zoned parking system of varying fees based on proximity to the campus core will provide a financial benefit to commuters who park in the east stadium lot. The zoned system would involve dividing the campus into areas or zones of several parking lots. Permits for each zone would have a price that is based on how desirable it is to park in the zone. The zones closest to the campus core would be most desirable, and therefore have the highest permit fees. The remote commuter parking permit would have the lowest price in order to provide a financial benefit to those who park in the remote lots. The zoned parking figure illustrates how this system could apply to Kansas State University.
The zoned system will do away with the current system of parking permits. Students, faculty, and staff will generally be able to purchase the permit for the zone that meets their needs. Not every zone will need to be made available for purchase to all customers. For example, permits for certain zones may only be sold to on-campus residents, such as the Jardine Apartments area. The proper ratio of employee and student parking in a zone can be controlled through the number of permits sold to each group.
To make the higher priced zones in the campus core desirable, these zones cannot be oversold as they are currently. Drivers who hold these permits must be able to find a space in the zone they purchase. The larger commuter lots can be because the demand does fluctuate over the course of the day, since not all commuters are on campus at the same time each day.
Customers will benefit from a zoned parking system in several ways. First, they will have the choice to buy the permit that meets their needs. Next, reducing the oversell ratio in the core campus will increase the probability of finding a parking space in those lots at peak times. Lastly, since zoned parking will make it easier to find an available parking space, vehicle circulation through parking areas will be reduced. Time required and stress experienced while searching for a parking space will be reduced as well.
The University will need to monitor zoned parking regularly to maintain a proper balance between the number of available parking spaces and number of permits sold. The price of permits will also need to be evaluated annually to establish the permit fee for each zone. The permit fee can also affect the balance of permits sold in each zone.
2016 – 2017 Parking Recommendations
• Allocate 400 spaces in lots B17 and B18 for Wefald Hall residents
• Reconstruct pavement at the east parking lot of Bill Snyder Family Stadium for use as a commuter parking lot
• Implement a zoned parking system
Permit required.Vehicles must
be removed by 6 p.m.
Information K iosk
Parking Offices
Proposed Zoned Parking Fee Structure
Fees
$250
$350
$170
A P P E N D I X138 139K A N S A S S TAT E U N I V E R S I T Y N O R T H C A M P U S CO R R I D O R M A S T E R P L A N 2015
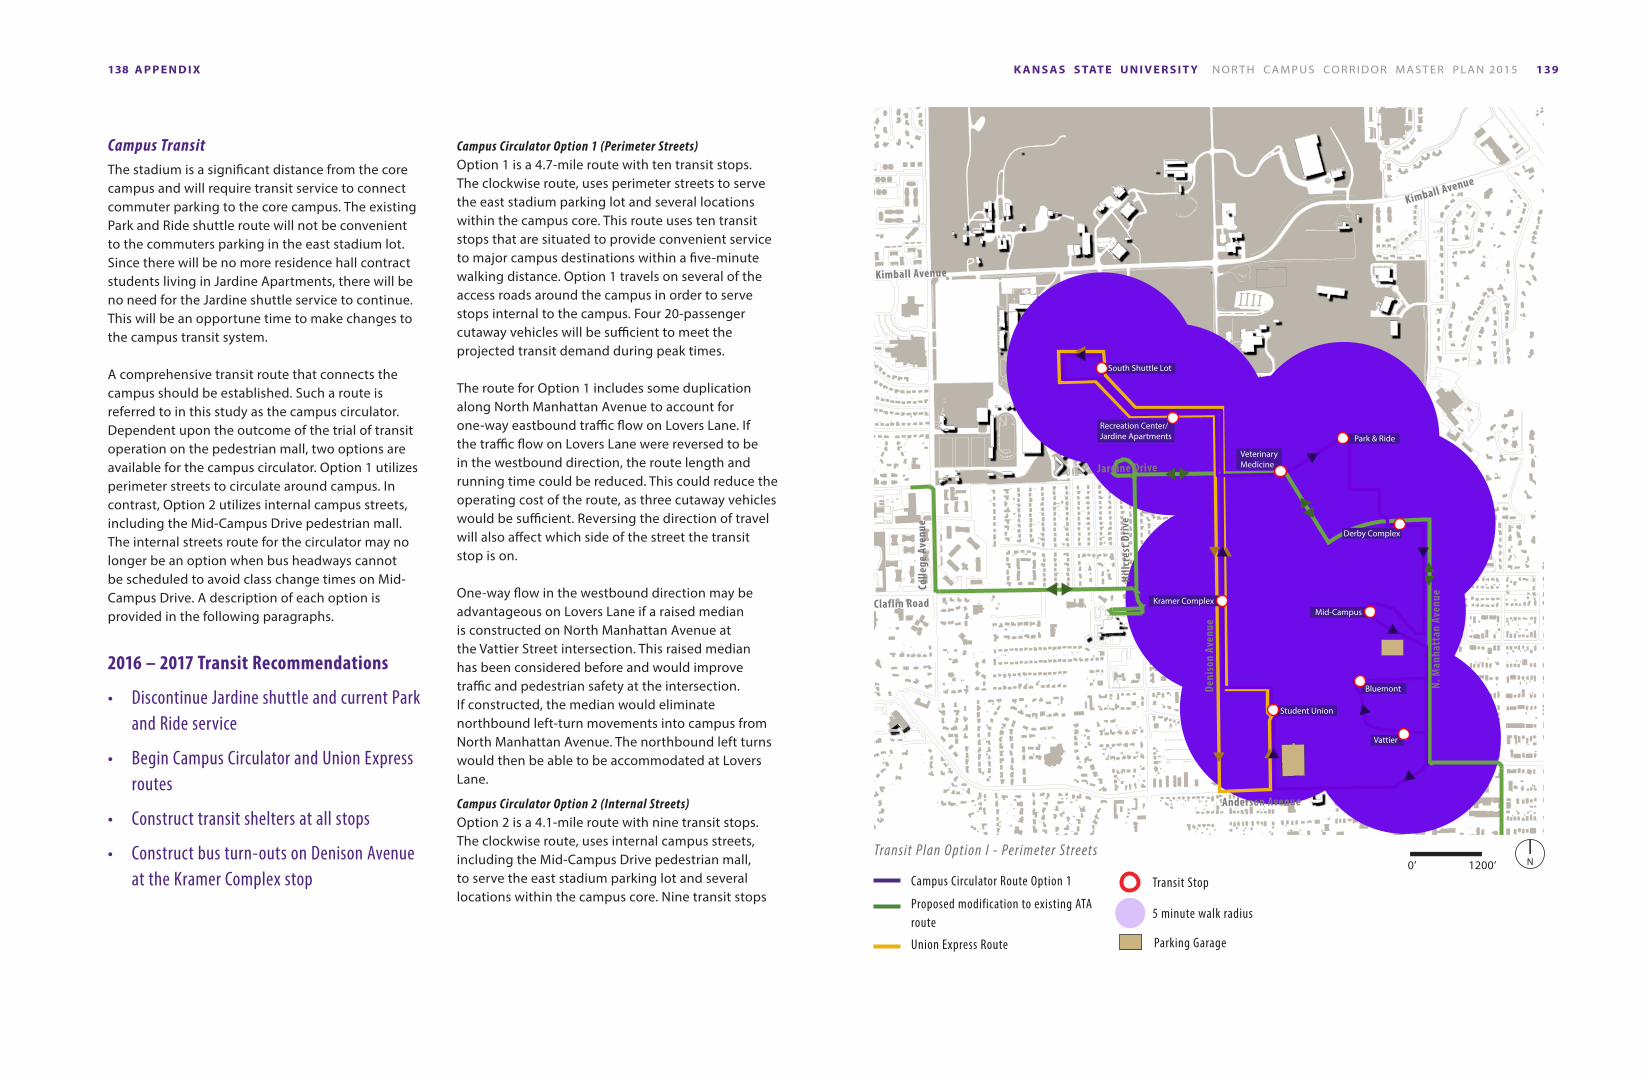
Campus TransitThe stadium is a significant distance from the core campus and will require transit service to connect commuter parking to the core campus. The existing Park and Ride shuttle route will not be convenient to the commuters parking in the east stadium lot. Since there will be no more residence hall contract students living in Jardine Apartments, there will be no need for the Jardine shuttle service to continue. This will be an opportune time to make changes to the campus transit system.
A comprehensive transit route that connects the campus should be established. Such a route is referred to in this study as the campus circulator. Dependent upon the outcome of the trial of transit operation on the pedestrian mall, two options are available for the campus circulator. Option 1 utilizes perimeter streets to circulate around campus. In contrast, Option 2 utilizes internal campus streets, including the Mid-Campus Drive pedestrian mall. The internal streets route for the circulator may no longer be an option when bus headways cannot be scheduled to avoid class change times on Mid-Campus Drive. A description of each option is provided in the following paragraphs.
Campus Circulator Option 1 (Perimeter Streets)Option 1 is a 4.7-mile route with ten transit stops. The clockwise route, uses perimeter streets to serve the east stadium parking lot and several locations within the campus core. This route uses ten transit stops that are situated to provide convenient service to major campus destinations within a five-minute walking distance. Option 1 travels on several of the access roads around the campus in order to serve stops internal to the campus. Four 20-passenger cutaway vehicles will be sufficient to meet the projected transit demand during peak times.
The route for Option 1 includes some duplication along North Manhattan Avenue to account for one-way eastbound traffic flow on Lovers Lane. If the traffic flow on Lovers Lane were reversed to be in the westbound direction, the route length and running time could be reduced. This could reduce the operating cost of the route, as three cutaway vehicles would be sufficient. Reversing the direction of travel will also affect which side of the street the transit stop is on.
One-way flow in the westbound direction may be advantageous on Lovers Lane if a raised median is constructed on North Manhattan Avenue at the Vattier Street intersection. This raised median has been considered before and would improve traffic and pedestrian safety at the intersection. If constructed, the median would eliminate northbound left-turn movements into campus from North Manhattan Avenue. The northbound left turns would then be able to be accommodated at Lovers Lane.
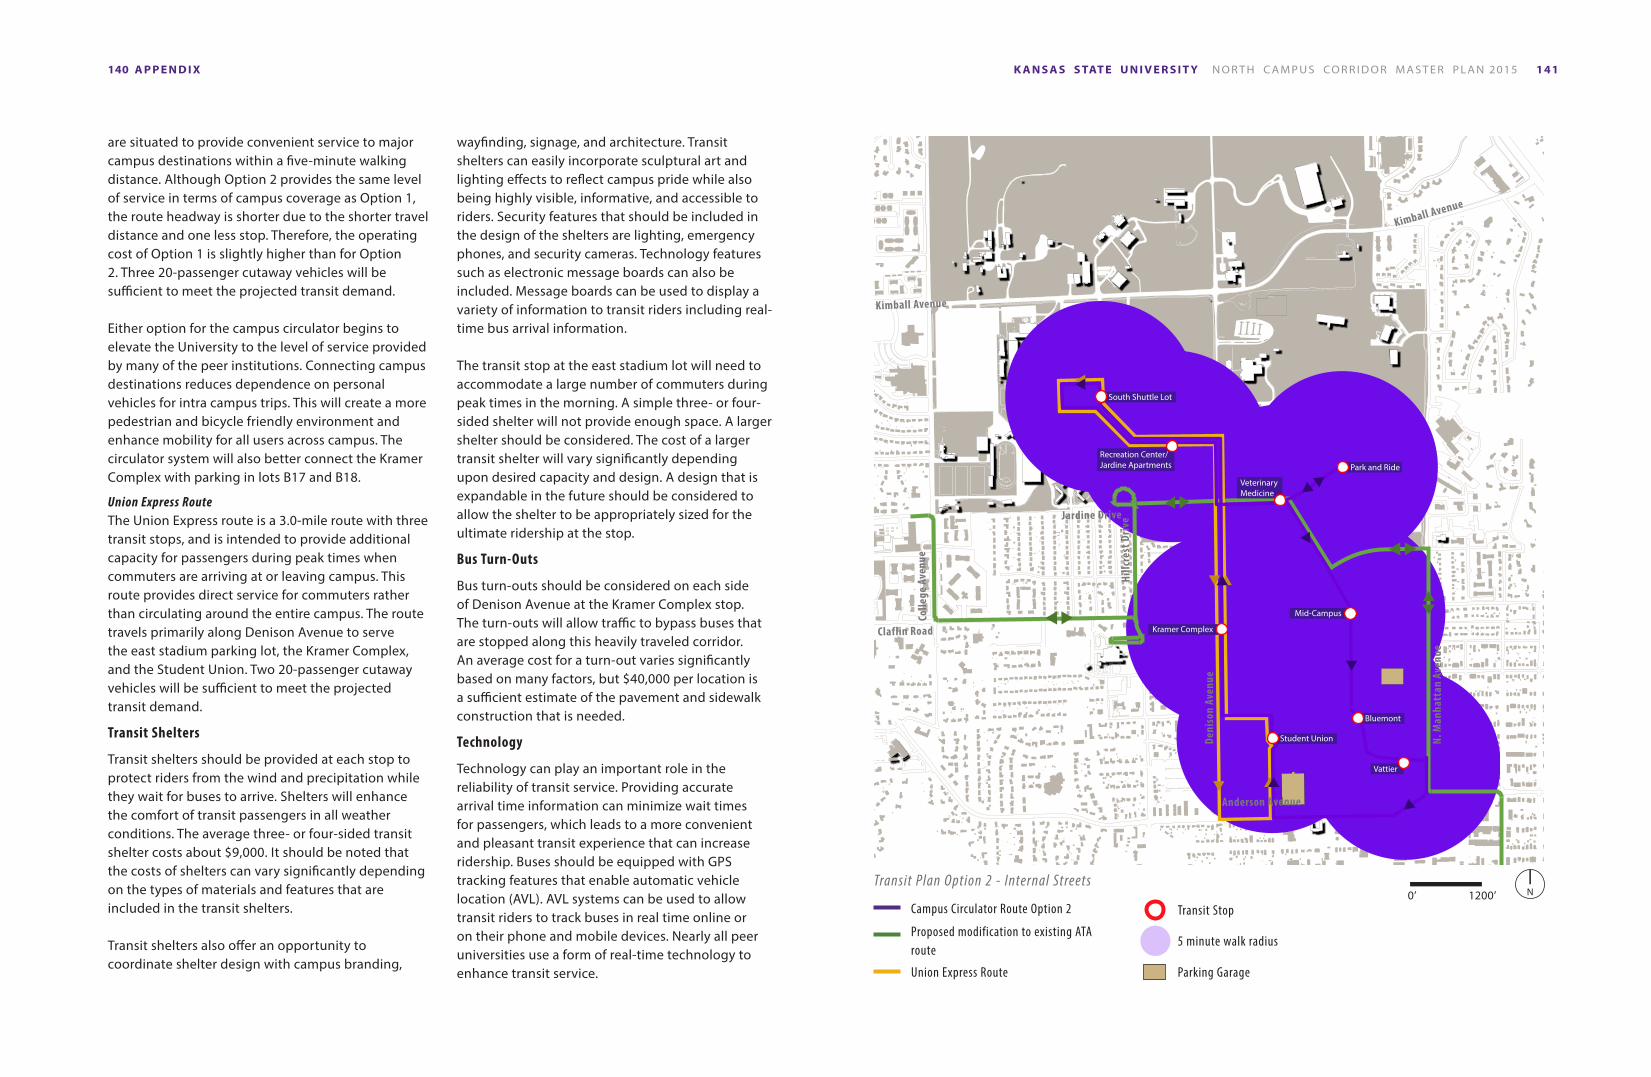
Campus Circulator Option 2 (Internal Streets)Option 2 is a 4.1-mile route with nine transit stops. The clockwise route, uses internal campus streets, including the Mid-Campus Drive pedestrian mall, to serve the east stadium parking lot and several locations within the campus core. Nine transit stops
2016 – 2017 Transit Recommendations
• Discontinue Jardine shuttle and current Park and Ride service
• Begin Campus Circulator and Union Express routes
• Construct transit shelters at all stops
• Construct bus turn-outs on Denison Avenue at the Kramer Complex stop
Parking Garage
Kramer Complex
Student Union
Vattier
Bluemont
Mid-Campus
Derby Complex
Park & Ride
South Shuttle Lot
Recreation Center/ Jardine Apartments
Veterinary Medicine
Transit Plan Option I - Perimeter Streets
Campus Circulator Route Option 1
5 minute walk radius
Transit Stop
Proposed modification to existing ATA route
Union Express Route
N0’ 1200’
Kimball Avenue
Kimball Avenue
Jardine Drive
Anderson Avenue
Deni
son
Aven
ue
N. M
anha
ttan
Ave
nueCo
llege
Ave
nue
Hillc
rest
Driv
e
Claflin Road
A P P E N D I X140 141K A N S A S S TAT E U N I V E R S I T Y N O R T H C A M P U S CO R R I D O R M A S T E R P L A N 2015
are situated to provide convenient service to major campus destinations within a five-minute walking distance. Although Option 2 provides the same level of service in terms of campus coverage as Option 1, the route headway is shorter due to the shorter travel distance and one less stop. Therefore, the operating cost of Option 1 is slightly higher than for Option 2. Three 20-passenger cutaway vehicles will be sufficient to meet the projected transit demand.
Either option for the campus circulator begins to elevate the University to the level of service provided by many of the peer institutions. Connecting campus destinations reduces dependence on personal vehicles for intra campus trips. This will create a more pedestrian and bicycle friendly environment and enhance mobility for all users across campus. The circulator system will also better connect the Kramer Complex with parking in lots B17 and B18.
Union Express RouteThe Union Express route is a 3.0-mile route with three transit stops, and is intended to provide additional capacity for passengers during peak times when commuters are arriving at or leaving campus. This route provides direct service for commuters rather than circulating around the entire campus. The route travels primarily along Denison Avenue to serve the east stadium parking lot, the Kramer Complex, and the Student Union. Two 20-passenger cutaway vehicles will be sufficient to meet the projected transit demand.
Transit Shelters
Transit shelters should be provided at each stop to protect riders from the wind and precipitation while they wait for buses to arrive. Shelters will enhance the comfort of transit passengers in all weather conditions. The average three- or four-sided transit shelter costs about $9,000. It should be noted that the costs of shelters can vary significantly depending on the types of materials and features that are included in the transit shelters.
Transit shelters also offer an opportunity to coordinate shelter design with campus branding,
wayfinding, signage, and architecture. Transit shelters can easily incorporate sculptural art and lighting effects to reflect campus pride while also being highly visible, informative, and accessible to riders. Security features that should be included in the design of the shelters are lighting, emergency phones, and security cameras. Technology features such as electronic message boards can also be included. Message boards can be used to display a variety of information to transit riders including real-time bus arrival information.
The transit stop at the east stadium lot will need to accommodate a large number of commuters during peak times in the morning. A simple three- or four-sided shelter will not provide enough space. A larger shelter should be considered. The cost of a larger transit shelter will vary significantly depending upon desired capacity and design. A design that is expandable in the future should be considered to allow the shelter to be appropriately sized for the ultimate ridership at the stop.
Bus Turn-Outs
Bus turn-outs should be considered on each side of Denison Avenue at the Kramer Complex stop. The turn-outs will allow traffic to bypass buses that are stopped along this heavily traveled corridor. An average cost for a turn-out varies significantly based on many factors, but $40,000 per location is a sufficient estimate of the pavement and sidewalk construction that is needed.
Technology
Technology can play an important role in the reliability of transit service. Providing accurate arrival time information can minimize wait times for passengers, which leads to a more convenient and pleasant transit experience that can increase ridership. Buses should be equipped with GPS tracking features that enable automatic vehicle location (AVL). AVL systems can be used to allow transit riders to track buses in real time online or on their phone and mobile devices. Nearly all peer universities use a form of real-time technology to enhance transit service.
Kramer Complex
Student Union
Vattier
Bluemont
Mid-Campus
Park and Ride
Veterinary Medicine
Recreation Center/ Jardine Apartments
South Shuttle Lot
Transit Plan Option 2 - Internal Streets
Campus Circulator Route Option 2
5 minute walk radius
Parking Garage
Transit Stop
Proposed modification to existing ATA route
Union Express Route
N0’ 1200’
Kimball Avenue
Kimball Avenue
Jardine Drive
Anderson Avenue
Deni
son
Aven
ue
N. M
anha
ttan
Ave
nue
Colle
ge A
venu
e
Hillc
rest
Driv
e
Claflin Road
A P P E N D I X142 143K A N S A S S TAT E U N I V E R S I T Y N O R T H C A M P U S CO R R I D O R M A S T E R P L A N 2015
Other Improvements
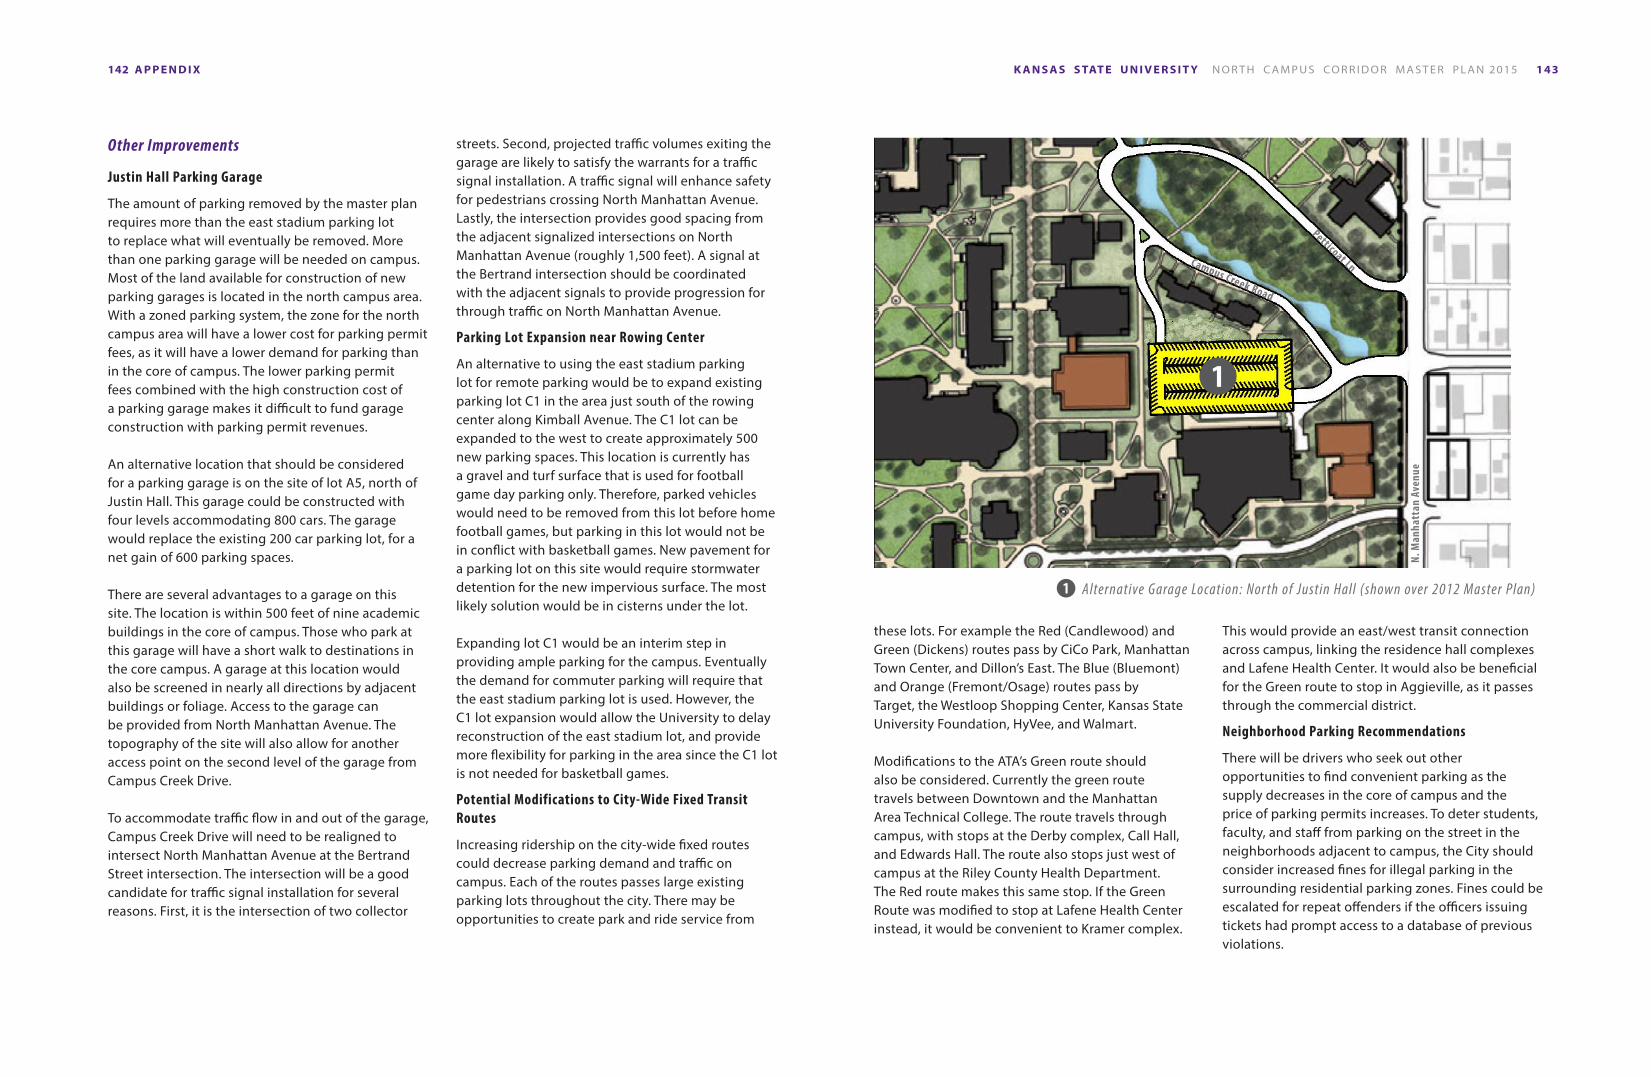
Justin Hall Parking Garage
The amount of parking removed by the master plan requires more than the east stadium parking lot to replace what will eventually be removed. More than one parking garage will be needed on campus. Most of the land available for construction of new parking garages is located in the north campus area. With a zoned parking system, the zone for the north campus area will have a lower cost for parking permit fees, as it will have a lower demand for parking than in the core of campus. The lower parking permit fees combined with the high construction cost of a parking garage makes it difficult to fund garage construction with parking permit revenues.
An alternative location that should be considered for a parking garage is on the site of lot A5, north of Justin Hall. This garage could be constructed with four levels accommodating 800 cars. The garage would replace the existing 200 car parking lot, for a net gain of 600 parking spaces.
There are several advantages to a garage on this site. The location is within 500 feet of nine academic buildings in the core of campus. Those who park at this garage will have a short walk to destinations in the core campus. A garage at this location would also be screened in nearly all directions by adjacent buildings or foliage. Access to the garage can be provided from North Manhattan Avenue. The topography of the site will also allow for another access point on the second level of the garage from Campus Creek Drive.
To accommodate traffic flow in and out of the garage, Campus Creek Drive will need to be realigned to intersect North Manhattan Avenue at the Bertrand Street intersection. The intersection will be a good candidate for traffic signal installation for several reasons. First, it is the intersection of two collector
streets. Second, projected traffic volumes exiting the garage are likely to satisfy the warrants for a traffic signal installation. A traffic signal will enhance safety for pedestrians crossing North Manhattan Avenue. Lastly, the intersection provides good spacing from the adjacent signalized intersections on North Manhattan Avenue (roughly 1,500 feet). A signal at the Bertrand intersection should be coordinated with the adjacent signals to provide progression for through traffic on North Manhattan Avenue.
Parking Lot Expansion near Rowing Center
An alternative to using the east stadium parking lot for remote parking would be to expand existing parking lot C1 in the area just south of the rowing center along Kimball Avenue. The C1 lot can be expanded to the west to create approximately 500 new parking spaces. This location is currently has a gravel and turf surface that is used for football game day parking only. Therefore, parked vehicles would need to be removed from this lot before home football games, but parking in this lot would not be in conflict with basketball games. New pavement for a parking lot on this site would require stormwater detention for the new impervious surface. The most likely solution would be in cisterns under the lot.
Expanding lot C1 would be an interim step in providing ample parking for the campus. Eventually the demand for commuter parking will require that the east stadium parking lot is used. However, the C1 lot expansion would allow the University to delay reconstruction of the east stadium lot, and provide more flexibility for parking in the area since the C1 lot is not needed for basketball games.
Potential Modifications to City-Wide Fixed Transit Routes
Increasing ridership on the city-wide fixed routes could decrease parking demand and traffic on campus. Each of the routes passes large existing parking lots throughout the city. There may be opportunities to create park and ride service from
these lots. For example the Red (Candlewood) and Green (Dickens) routes pass by CiCo Park, Manhattan Town Center, and Dillon’s East. The Blue (Bluemont) and Orange (Fremont/Osage) routes pass by Target, the Westloop Shopping Center, Kansas State University Foundation, HyVee, and Walmart.
Modifications to the ATA’s Green route should also be considered. Currently the green route travels between Downtown and the Manhattan Area Technical College. The route travels through campus, with stops at the Derby complex, Call Hall, and Edwards Hall. The route also stops just west of campus at the Riley County Health Department. The Red route makes this same stop. If the Green Route was modified to stop at Lafene Health Center instead, it would be convenient to Kramer complex.
This would provide an east/west transit connection across campus, linking the residence hall complexes and Lafene Health Center. It would also be beneficial for the Green route to stop in Aggieville, as it passes through the commercial district.
Neighborhood Parking Recommendations
There will be drivers who seek out other opportunities to find convenient parking as the supply decreases in the core of campus and the price of parking permits increases. To deter students, faculty, and staff from parking on the street in the neighborhoods adjacent to campus, the City should consider increased fines for illegal parking in the surrounding residential parking zones. Fines could be escalated for repeat offenders if the officers issuing tickets had prompt access to a database of previous violations.
Alternative Garage Location: Nor th of Justin Hall (shown over 2012 Master Plan)
1
1
N. M
anha
ttan
Ave
nue
Campus Creek Road
Petticoat Ln
A P P E N D I X144 145K A N S A S S TAT E U N I V E R S I T Y N O R T H C A M P U S CO R R I D O R M A S T E R P L A N 2015
service is expected from 7:30 AM - 9:30 AM with an additional two hours of peak service from 4:00 PM - 6:00 PM. During peak service, service frequency is about 10 minutes. Eleven hours of non-peak service would also be offered, establishing transit service hours from 6:00 AM to 9:00 PM. Non-peak service frequency is about 15 to 20 minutes.
Based on the capacity assumptions and desired service levels, estimates for the transit operating and capital costs are outlined in the appendix. Capital costs do not include estimates for transit storage, and maintenance facilities. These costs will be dependent upon KSU’s decision to operate the transit service in-house or through a contracted operation.
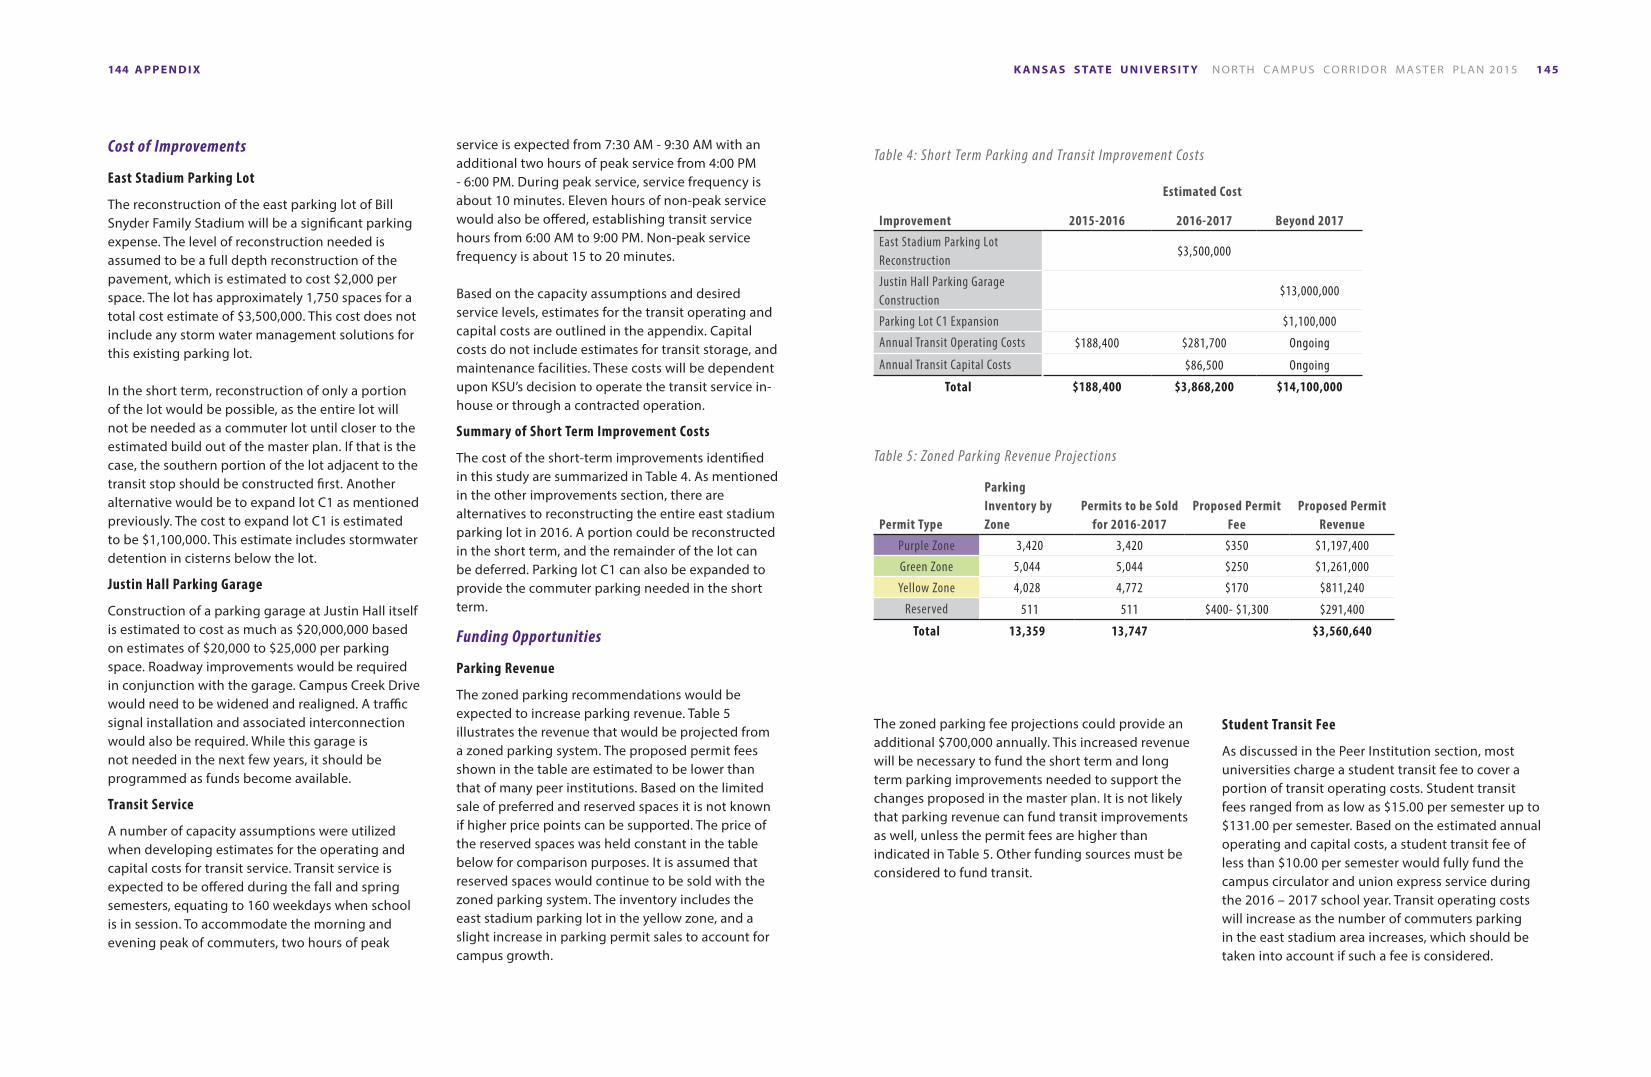
Summary of Short Term Improvement Costs
The cost of the short-term improvements identified in this study are summarized in Table 4. As mentioned in the other improvements section, there are alternatives to reconstructing the entire east stadium parking lot in 2016. A portion could be reconstructed in the short term, and the remainder of the lot can be deferred. Parking lot C1 can also be expanded to provide the commuter parking needed in the short term.
Funding Opportunities
Parking Revenue
The zoned parking recommendations would be expected to increase parking revenue. Table 5 illustrates the revenue that would be projected from a zoned parking system. The proposed permit fees shown in the table are estimated to be lower than that of many peer institutions. Based on the limited sale of preferred and reserved spaces it is not known if higher price points can be supported. The price of the reserved spaces was held constant in the table below for comparison purposes. It is assumed that reserved spaces would continue to be sold with the zoned parking system. The inventory includes the east stadium parking lot in the yellow zone, and a slight increase in parking permit sales to account for campus growth.
Cost of Improvements
East Stadium Parking Lot
The reconstruction of the east parking lot of Bill Snyder Family Stadium will be a significant parking expense. The level of reconstruction needed is assumed to be a full depth reconstruction of the pavement, which is estimated to cost $2,000 per space. The lot has approximately 1,750 spaces for a total cost estimate of $3,500,000. This cost does not include any storm water management solutions for this existing parking lot.
In the short term, reconstruction of only a portion of the lot would be possible, as the entire lot will not be needed as a commuter lot until closer to the estimated build out of the master plan. If that is the case, the southern portion of the lot adjacent to the transit stop should be constructed first. Another alternative would be to expand lot C1 as mentioned previously. The cost to expand lot C1 is estimated to be $1,100,000. This estimate includes stormwater detention in cisterns below the lot.
Justin Hall Parking Garage
Construction of a parking garage at Justin Hall itself is estimated to cost as much as $20,000,000 based on estimates of $20,000 to $25,000 per parking space. Roadway improvements would be required in conjunction with the garage. Campus Creek Drive would need to be widened and realigned. A traffic signal installation and associated interconnection would also be required. While this garage is not needed in the next few years, it should be programmed as funds become available.
Transit Service
A number of capacity assumptions were utilized when developing estimates for the operating and capital costs for transit service. Transit service is expected to be offered during the fall and spring semesters, equating to 160 weekdays when school is in session. To accommodate the morning and evening peak of commuters, two hours of peak
Table 5: Zoned Parking Revenue Projections
Table 4: Shor t Term Parking and Transit Improvement Costs
Permit Type
Parking Inventory by Zone
Permits to be Sold for 2016-2017
Proposed PermitFee
Proposed Permit Revenue
Purple Zone 3,420 3,420 $350 $1,197,400
Green Zone 5,044 5,044 $250 $1,261,000
Yellow Zone 4,028 4,772 $170 $811,240
Reserved 511 511 $400- $1,300 $291,400
Total 13,359 13,747 $3,560,640
Improvement
Estimated Cost
2015-2016 2016-2017 Beyond 2017
East Stadium Parking Lot Reconstruction
$3,500,000
Justin Hall Parking Garage Construction
$13,000,000
Parking Lot C1 Expansion $1,100,000
Annual Transit Operating Costs $188,400 $281,700 Ongoing
Annual Transit Capital Costs $86,500 Ongoing
Total $188,400 $3,868,200 $14,100,000
The zoned parking fee projections could provide an additional $700,000 annually. This increased revenue will be necessary to fund the short term and long term parking improvements needed to support the changes proposed in the master plan. It is not likely that parking revenue can fund transit improvements as well, unless the permit fees are higher than indicated in Table 5. Other funding sources must be considered to fund transit.
Student Transit Fee
As discussed in the Peer Institution section, most universities charge a student transit fee to cover a portion of transit operating costs. Student transit fees ranged from as low as $15.00 per semester up to $131.00 per semester. Based on the estimated annual operating and capital costs, a student transit fee of less than $10.00 per semester would fully fund the campus circulator and union express service during the 2016 – 2017 school year. Transit operating costs will increase as the number of commuters parking in the east stadium area increases, which should be taken into account if such a fee is considered.
A P P E N D I X146 147K A N S A S S TAT E U N I V E R S I T Y N O R T H C A M P U S CO R R I D O R M A S T E R P L A N 2015
Faculty/Staff Contribution
A significant portion of the transit ridership is expected to be faculty and staff that park at the east stadium commuter lot. Therefore, the University could consider some type of faculty/staff contribution to the transit system. This could be in the form of a small payroll deduction (rather than purchasing a campus parking permit) or included in the cost of a parking permit for the commuter lots. The tax benefits available for commuters should be considered. Federal tax law stipulates that employers can allow employees to use pretax dollars to pay for transit passes or subsidize employees transit passes.
At many of the peer institutions, fee-paying students and faculty/staff are eligible to ride city-wide systems at no additional charge, another potential benefit for both the University and the city’s transit system as it continues to grow. This type of partnership should be established as student and/or faculty/staff fees are considered.
Other Funding Sources
Transit Grant ProgramsThe U.S. Department of Transportation currently administers grant programs for transit related capital improvements. These funds can be used for transit shelters and stops, bus turn-outs, and buses. The federal contribution can be as high as 80 percent of the cost because Manhattan is classified as an urbanized area.
Naming Rights / AdvertisingRevenue from naming rights or advertisements is another possible source of revenue. Recognition plaques or advertising space can be integrated into vehicles, transit shelters, benches, and other transit amenities such as trash cans. Advertising is a common source of additional revenue for many campus and municipal transit systems.
Farebox Recovery
While revenue from the public could be a relatively small portion of revenue, farebox recovery offers another potential funding source. With the University supporting the campus transit system, it is not uncommon to charge the public a small fare for use of the service.
Private PartnershipsIn addition to the existing city-wide and campus routes, ATA operates an additional route for the University Crossing Apartments that shuttles students from the apartments to the Student Union. The route is funded as a public deviated route through state and federal funding with the local match by the University Crossing Apartments. University Crossing Apartments funds the route because the service is marketing tool and amenity for residents. As demonstrated by the University Crossing route, there is an opportunity to collaborate with other apartment complexes to enhance transit service with high frequency fixed routes between the city’s residential hotspots and the University campus.
Other Innovative MethodsAs discussed in the comparison of peer institutions, another approach to reducing operating costs is to employ part-time staff. The University of Massachusetts - Amherst has had success in employing students as staff to keep operating costs lows. About 95 percent of the 180 staff members are students. As a result, the transit system operates at $50.00 per hour compared to regional peers that operate near $85.00 per hour.
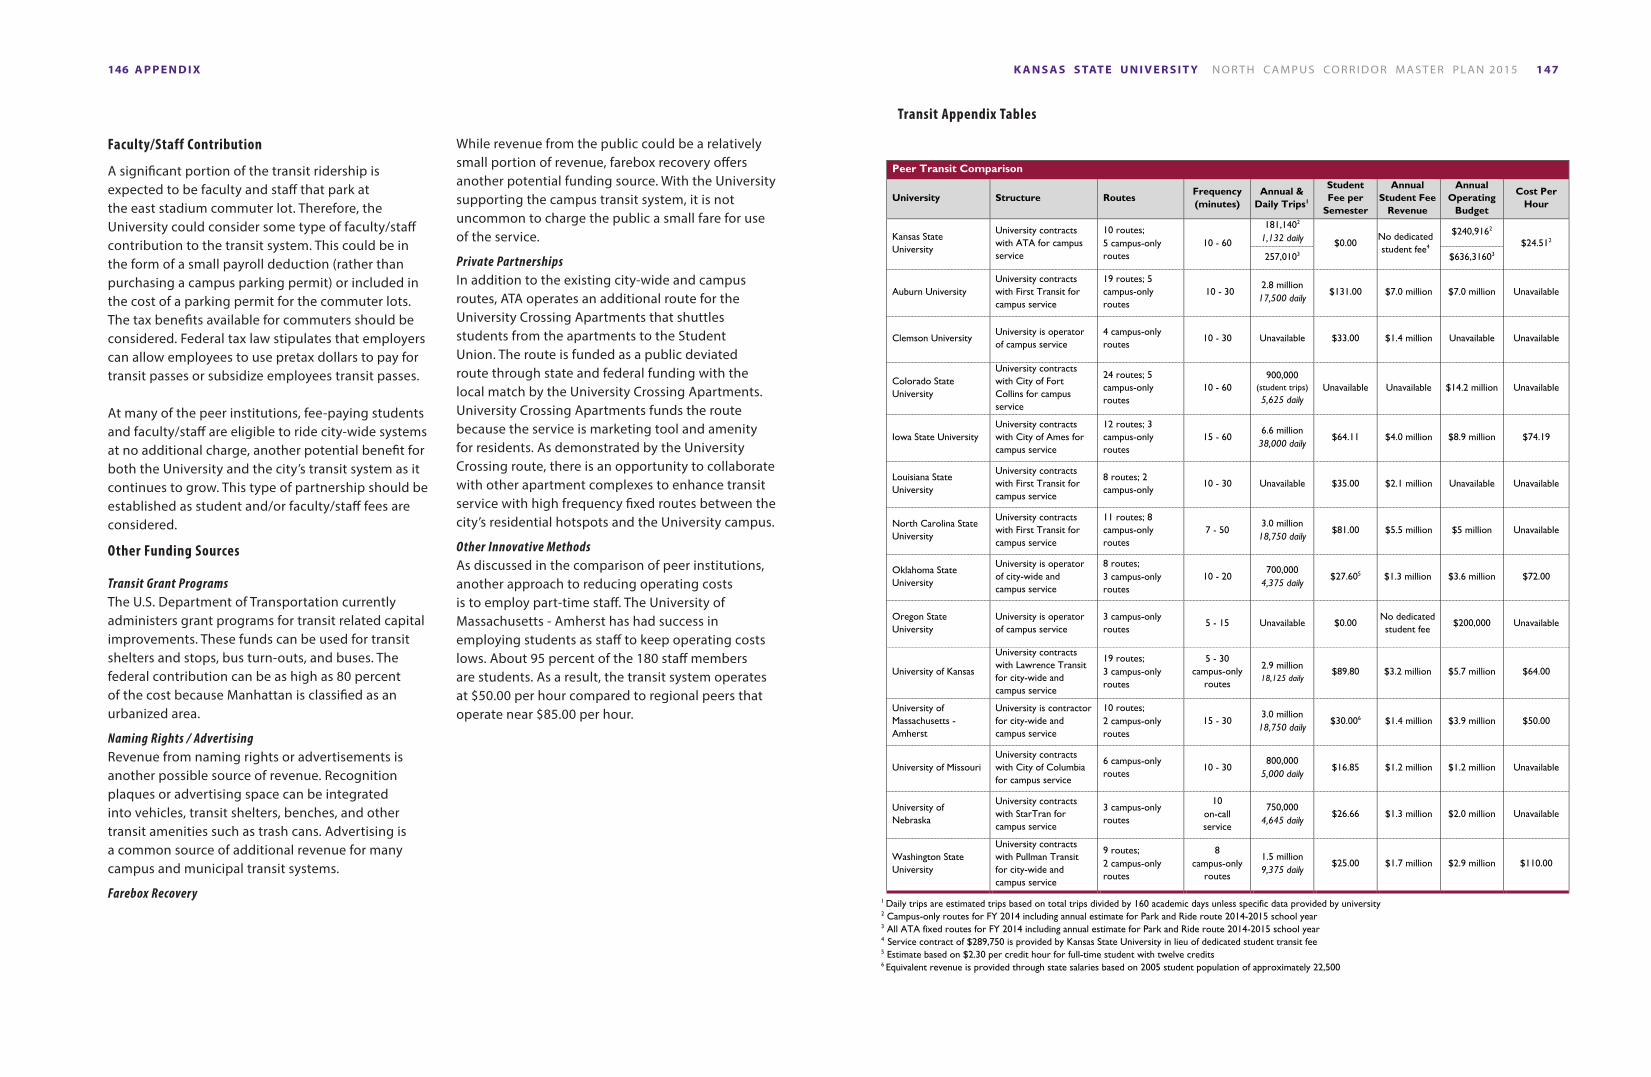
Peer Transit Comparison
University Structure Routes Frequency (minutes)
Annual & Daily Trips1
Student Fee per
Semester
Annual Student Fee
Revenue
Annual Operating
Budget
Cost Per Hour
Kansas State University
University contracts with ATA for campus service
10 routes; 5 campus-only routes
10 - 60
181,1402
1,132 daily $0.00 No dedicated student fee4
$240,9162
$24.512 257,0103 $636,31603
Auburn University University contracts with First Transit for campus service
19 routes; 5 campus-only routes
10 - 30 2.8 million
17,500 daily $131.00 $7.0 million $7.0 million Unavailable
Clemson University University is operator of campus service
4 campus-only routes
10 - 30 Unavailable $33.00 $1.4 million Unavailable Unavailable
Colorado State University
University contracts with City of Fort Collins for campus service
24 routes; 5 campus-only routes
10 - 60 900,000
(student trips) 5,625 daily
Unavailable Unavailable $14.2 million Unavailable
Iowa State University University contracts with City of Ames for campus service
12 routes; 3 campus-only routes
15 - 60 6.6 million
38,000 daily $64.11 $4.0 million $8.9 million $74.19
Louisiana State University
University contracts with First Transit for campus service
8 routes; 2 campus-only
10 - 30 Unavailable $35.00 $2.1 million Unavailable Unavailable
North Carolina State University
University contracts with First Transit for campus service
11 routes; 8 campus-only routes
7 - 50 3.0 million
18,750 daily $81.00 $5.5 million $5 million Unavailable
Oklahoma State University
University is operator of city-wide and campus service
8 routes; 3 campus-only routes
10 - 20 700,000
4,375 daily $27.605 $1.3 million $3.6 million $72.00
Oregon State University
University is operator of campus service
3 campus-only routes
5 - 15 Unavailable $0.00 No dedicated student fee
$200,000 Unavailable
University Structure Routes Frequency (minutes)
Annual & Daily Trips
Student Fee per
Semester
Annual Student Fee
Revenue
Annual Operating
Budget
Cost Per Hour
University of Kansas
University contracts with Lawrence Transit for city-wide and campus service
19 routes; 3 campus-only routes
5 - 30 campus-only
routes
2.9 million 18,125 daily
$89.80 $3.2 million $5.7 million $64.00
University of Massachusetts - Amherst
University is contractor for city-wide and campus service
10 routes; 2 campus-only routes
15 - 30 3.0 million
18,750 daily $30.006 $1.4 million $3.9 million $50.00
University of Missouri University contracts with City of Columbia for campus service
6 campus-only routes
10 - 30 800,000
5,000 daily $16.85 $1.2 million $1.2 million Unavailable
University of Nebraska
University contracts with StarTran for campus service
3 campus-only routes
10 on-call service
750,000 4,645 daily
$26.66 $1.3 million $2.0 million Unavailable
Washington State University
University contracts with Pullman Transit for city-wide and campus service
9 routes; 2 campus-only routes
8 campus-only
routes
1.5 million 9,375 daily
$25.00 $1.7 million $2.9 million $110.00
1 Daily trips are estimated trips based on total trips divided by 160 academic days unless specific data provided by university 2 Campus-only routes for FY 2014 including annual estimate for Park and Ride route 2014-2015 school year 3 All ATA fixed routes for FY 2014 including annual estimate for Park and Ride route 2014-2015 school year 4 Service contract of $289,750 is provided by Kansas State University in lieu of dedicated student transit fee 5 Estimate based on $2.30 per credit hour for full-time student with twelve credits 6 Equivalent revenue is provided through state salaries based on 2005 student population of approximately 22,500
Transit Appendix Tables
A P P E N D I X148 149K A N S A S S TAT E U N I V E R S I T Y N O R T H C A M P U S CO R R I D O R M A S T E R P L A N 2015
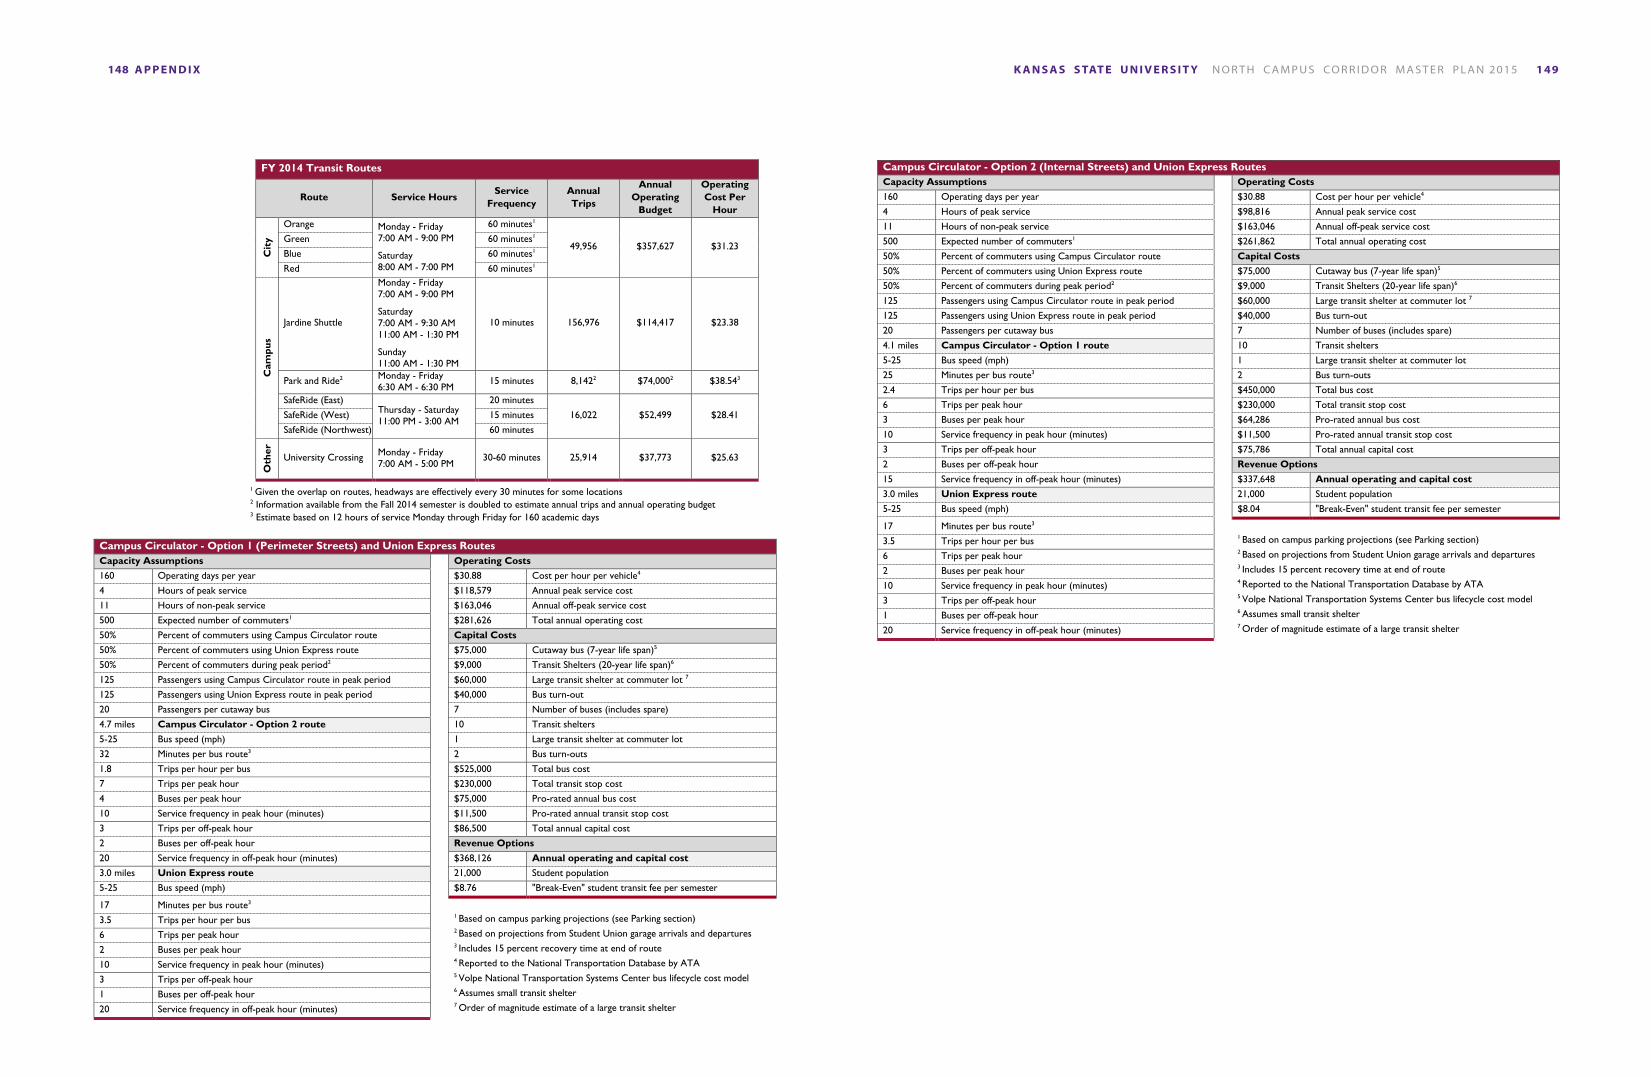
FY 2014 Transit Routes
Route Service Hours Service
Frequency Annual Trips
Annual Operating
Budget
Operating Cost Per
Hour
Cit
y
Orange Monday - Friday 7:00 AM - 9:00 PM
Saturday 8:00 AM - 7:00 PM
60 minutes1
49,956 $357,627 $31.23 Green 60 minutes1
Blue 60 minutes1
Red 60 minutes1 C
ampu
s
Jardine Shuttle
Monday - Friday 7:00 AM - 9:00 PM
Saturday 7:00 AM - 9:30 AM 11:00 AM - 1:30 PM
Sunday 11:00 AM - 1:30 PM
10 minutes 156,976 $114,417 $23.38
Park and Ride2 Monday - Friday 6:30 AM - 6:30 PM
15 minutes 8,1422 $74,0002 $38.543
SafeRide (East) Thursday - Saturday 11:00 PM - 3:00 AM
20 minutes 16,022 $52,499 $28.41 SafeRide (West) 15 minutes
SafeRide (Northwest) 60 minutes
Oth
er
University Crossing Monday - Friday 7:00 AM - 5:00 PM
30-60 minutes 25,914 $37,773 $25.63
1 Given the overlap on routes, headways are effectively every 30 minutes for some locations 2 Information available from the Fall 2014 semester is doubled to estimate annual trips and annual operating budget 3 Estimate based on 12 hours of service Monday through Friday for 160 academic days
Campus Circulator - Option 1 (Perimeter Streets) and Union Express Routes Capacity Assumptions Operating Costs 160 Operating days per year $30.88 Cost per hour per vehicle4 4 Hours of peak service $118,579 Annual peak service cost 11 Hours of non-peak service $163,046 Annual off-peak service cost 500 Expected number of commuters1 $281,626 Total annual operating cost 50% Percent of commuters using Campus Circulator route Capital Costs 50% Percent of commuters using Union Express route $75,000 Cutaway bus (7-year life span)5 50% Percent of commuters during peak period2 $9,000 Transit Shelters (20-year life span)6 125 Passengers using Campus Circulator route in peak period $60,000 Large transit shelter at commuter lot 7 125 Passengers using Union Express route in peak period $40,000 Bus turn-out 20 Passengers per cutaway bus 7 Number of buses (includes spare) 4.7 miles Campus Circulator - Option 2 route 10 Transit shelters 5-25 Bus speed (mph) 1 Large transit shelter at commuter lot 32 Minutes per bus route3 2 Bus turn-outs 1.8 Trips per hour per bus $525,000 Total bus cost 7 Trips per peak hour $230,000 Total transit stop cost 4 Buses per peak hour $75,000 Pro-rated annual bus cost 10 Service frequency in peak hour (minutes) $11,500 Pro-rated annual transit stop cost 3 Trips per off-peak hour $86,500 Total annual capital cost 2 Buses per off-peak hour Revenue Options 20 Service frequency in off-peak hour (minutes) $368,126 Annual operating and capital cost 3.0 miles Union Express route 21,000 Student population 5-25 Bus speed (mph) $8.76 "Break-Even" student transit fee per semester
17 Minutes per bus route3 3.5 Trips per hour per bus 1 Based on campus parking projections (see Parking section)
6 Trips per peak hour 2 Based on projections from Student Union garage arrivals and departures
2 Buses per peak hour 3 Includes 15 percent recovery time at end of route
10 Service frequency in peak hour (minutes) 4 Reported to the National Transportation Database by ATA
3 Trips per off-peak hour 5 Volpe National Transportation Systems Center bus lifecycle cost model
1 Buses per off-peak hour 6 Assumes small transit shelter
20 Service frequency in off-peak hour (minutes) 7 Order of magnitude estimate of a large transit shelter
Campus Circulator - Option 2 (Internal Streets) and Union Express Routes Capacity Assumptions Operating Costs 160 Operating days per year $30.88 Cost per hour per vehicle4
4 Hours of peak service $98,816 Annual peak service cost 11 Hours of non-peak service $163,046 Annual off-peak service cost 500 Expected number of commuters1 $261,862 Total annual operating cost 50% Percent of commuters using Campus Circulator route Capital Costs 50% Percent of commuters using Union Express route $75,000 Cutaway bus (7-year life span)5
50% Percent of commuters during peak period2 $9,000 Transit Shelters (20-year life span)6 125 Passengers using Campus Circulator route in peak period $60,000 Large transit shelter at commuter lot 7 125 Passengers using Union Express route in peak period $40,000 Bus turn-out 20 Passengers per cutaway bus 7 Number of buses (includes spare) 4.1 miles Campus Circulator - Option 1 route 10 Transit shelters 5-25 Bus speed (mph) 1 Large transit shelter at commuter lot 25 Minutes per bus route3 2 Bus turn-outs 2.4 Trips per hour per bus $450,000 Total bus cost 6 Trips per peak hour $230,000 Total transit stop cost 3 Buses per peak hour $64,286 Pro-rated annual bus cost 10 Service frequency in peak hour (minutes) $11,500 Pro-rated annual transit stop cost 3 Trips per off-peak hour $75,786 Total annual capital cost 2 Buses per off-peak hour Revenue Options 15 Service frequency in off-peak hour (minutes) $337,648 Annual operating and capital cost 3.0 miles Union Express route 21,000 Student population 5-25 Bus speed (mph) $8.04 "Break-Even" student transit fee per semester
17 Minutes per bus route3 3.5 Trips per hour per bus 1 Based on campus parking projections (see Parking section)
6 Trips per peak hour 2 Based on projections from Student Union garage arrivals and departures
2 Buses per peak hour 3 Includes 15 percent recovery time at end of route
10 Service frequency in peak hour (minutes) 4 Reported to the National Transportation Database by ATA
3 Trips per off-peak hour 5 Volpe National Transportation Systems Center bus lifecycle cost model
1 Buses per off-peak hour 6 Assumes small transit shelter
20 Service frequency in off-peak hour (minutes) 7 Order of magnitude estimate of a large transit shelter
A P P E N D I X150 151K A N S A S S TAT E U N I V E R S I T Y N O R T H C A M P U S CO R R I D O R M A S T E R P L A N 2015
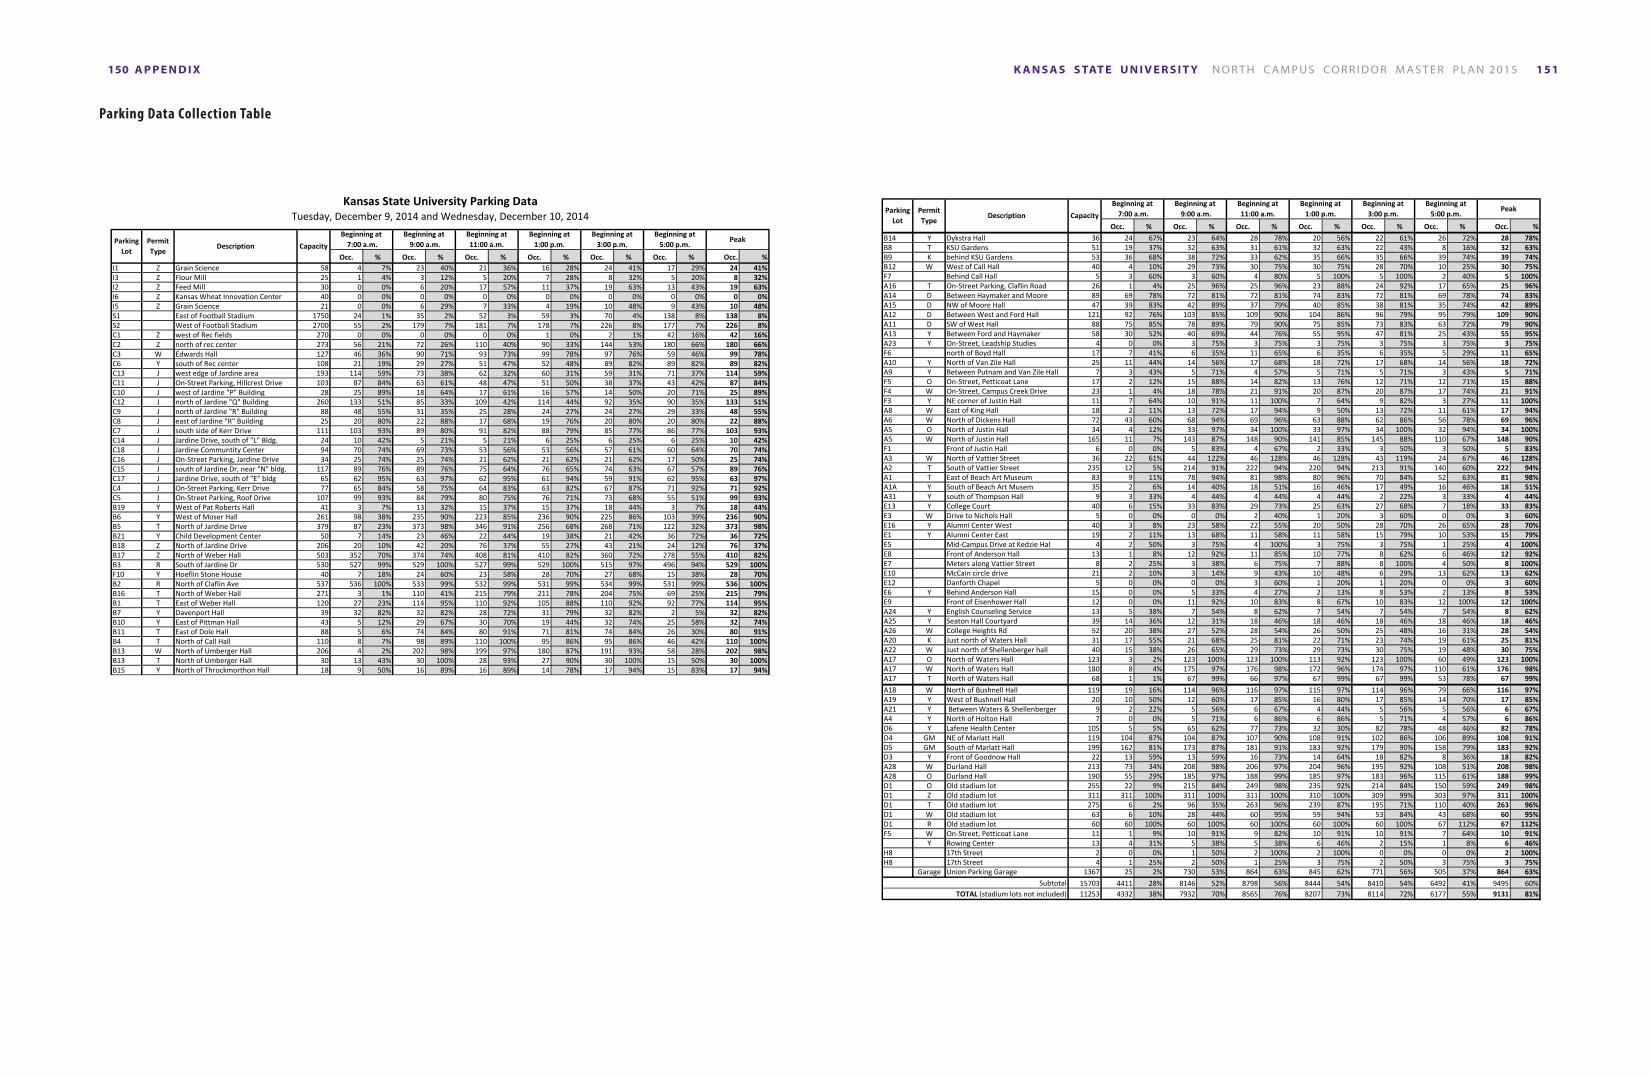
Occ. % Occ. % Occ. % Occ. % Occ. % Occ. % Occ. %I1 Z Grain Science 58 4 7% 23 40% 21 36% 16 28% 24 41% 17 29% 24 41%I3 Z Flour Mill 25 1 4% 3 12% 5 20% 7 28% 8 32% 5 20% 8 32%I2 Z Feed Mill 30 0 0% 6 20% 17 57% 11 37% 19 63% 13 43% 19 63%I6 Z Kansas Wheat Innovation Center 40 0 0% 0 0% 0 0% 0 0% 0 0% 0 0% 0 0%I5 Z Grain Science 21 0 0% 6 29% 7 33% 4 19% 10 48% 9 43% 10 48%S1 East of Football Stadium 1750 24 1% 35 2% 52 3% 59 3% 70 4% 138 8% 138 8%S2 West of Football Stadium 2700 55 2% 179 7% 181 7% 178 7% 226 8% 177 7% 226 8%C1 Z west of Rec fields 270 0 0% 0 0% 0 0% 1 0% 2 1% 42 16% 42 16%C2 Z north of rec center 273 56 21% 72 26% 110 40% 90 33% 144 53% 180 66% 180 66%C3 W Edwards Hall 127 46 36% 90 71% 93 73% 99 78% 97 76% 59 46% 99 78%C6 Y south of Rec center 108 21 19% 29 27% 51 47% 52 48% 89 82% 89 82% 89 82%C13 J west edge of Jardine area 193 114 59% 73 38% 62 32% 60 31% 59 31% 71 37% 114 59%C11 J On-Street Parking, Hillcrest Drive 103 87 84% 63 61% 48 47% 51 50% 38 37% 43 42% 87 84%C10 J west of Jardine "P" Building 28 25 89% 18 64% 17 61% 16 57% 14 50% 20 71% 25 89%C12 J north of Jardine "Q" Building 260 133 51% 85 33% 109 42% 114 44% 92 35% 90 35% 133 51%C9 J north of Jardine "R" Building 88 48 55% 31 35% 25 28% 24 27% 24 27% 29 33% 48 55%C8 J east of Jardine "R" Building 25 20 80% 22 88% 17 68% 19 76% 20 80% 20 80% 22 88%C7 J south side of Kerr Drive 111 103 93% 89 80% 91 82% 88 79% 85 77% 86 77% 103 93%C14 J Jardine Drive, south of "L" Bldg. 24 10 42% 5 21% 5 21% 6 25% 6 25% 6 25% 10 42%C18 J Jardine Communtity Center 94 70 74% 69 73% 53 56% 53 56% 57 61% 60 64% 70 74%C16 J On-Street Parking, Jardine Drive 34 25 74% 25 74% 21 62% 21 62% 21 62% 17 50% 25 74%C15 J south of Jardine Dr, near "N" bldg. 117 89 76% 89 76% 75 64% 76 65% 74 63% 67 57% 89 76%C17 J Jardine Drive, south of "E" bldg 65 62 95% 63 97% 62 95% 61 94% 59 91% 62 95% 63 97%C4 J On-Street Parking, Kerr Drive 77 65 84% 58 75% 64 83% 63 82% 67 87% 71 92% 71 92%C5 J On-Street Parking, Roof Drive 107 99 93% 84 79% 80 75% 76 71% 73 68% 55 51% 99 93%B19 Y West of Pat Roberts Hall 41 3 7% 13 32% 15 37% 15 37% 18 44% 3 7% 18 44%B6 Y West of Moser Hall 261 98 38% 235 90% 223 85% 236 90% 225 86% 103 39% 236 90%B5 T North of Jardine Drive 379 87 23% 373 98% 346 91% 256 68% 268 71% 122 32% 373 98%B21 Y Child Development Center 50 7 14% 23 46% 22 44% 19 38% 21 42% 36 72% 36 72%B18 Z North of Jardine Drive 206 20 10% 42 20% 76 37% 55 27% 43 21% 24 12% 76 37%B17 Z North of Weber Hall 503 352 70% 374 74% 408 81% 410 82% 360 72% 278 55% 410 82%B3 R South of Jardine Dr 530 527 99% 529 100% 527 99% 529 100% 515 97% 496 94% 529 100%F10 Y Hoeflin Stone House 40 7 18% 24 60% 23 58% 28 70% 27 68% 15 38% 28 70%B2 R North of Claflin Ave 537 536 100% 533 99% 532 99% 531 99% 534 99% 531 99% 536 100%B16 T North of Weber Hall 271 3 1% 110 41% 215 79% 211 78% 204 75% 69 25% 215 79%B1 T East of Weber Hall 120 27 23% 114 95% 110 92% 105 88% 110 92% 92 77% 114 95%B7 Y Davenport Hall 39 32 82% 32 82% 28 72% 31 79% 32 82% 2 5% 32 82%B10 Y East of Pittman Hall 43 5 12% 29 67% 30 70% 19 44% 32 74% 25 58% 32 74%B11 T East of Dole Hall 88 5 6% 74 84% 80 91% 71 81% 74 84% 26 30% 80 91%B4 T North of Call Hall 110 8 7% 98 89% 110 100% 95 86% 95 86% 46 42% 110 100%B13 W North of Umberger Hall 206 4 2% 202 98% 199 97% 180 87% 191 93% 58 28% 202 98%B13 T North of Umberger Hall 30 13 43% 30 100% 28 93% 27 90% 30 100% 15 50% 30 100%B15 Y North of Throckmorthon Hall 18 9 50% 16 89% 16 89% 14 78% 17 94% 15 83% 17 94%
Kansas State University Parking DataTuesday, December 9, 2014 and Wednesday, December 10, 2014
Beginning at11:00 a.m.
Beginning at 1:00 p.m.
Beginning at 3:00 p.m.
Beginning at 5:00 p.m.
PeakParking Lot
Permit Type
Description CapacityBeginning at
7:00 a.m.Beginning at
9:00 a.m.
Parking Data Collection Table
Occ. % Occ. % Occ. % Occ. % Occ. % Occ. % Occ. %
Beginning at11:00 a.m.
Beginning at 1:00 p.m.
Beginning at 3:00 p.m.
Beginning at 5:00 p.m.
PeakParking Lot
Permit Type
Description CapacityBeginning at
7:00 a.m.Beginning at
9:00 a.m.
B14 Y Dykstra Hall 36 24 67% 23 64% 28 78% 20 56% 22 61% 26 72% 28 78%B8 T KSU Gardens 51 19 37% 32 63% 31 61% 32 63% 22 43% 8 16% 32 63%B9 K behind KSU Gardens 53 36 68% 38 72% 33 62% 35 66% 35 66% 39 74% 39 74%B12 W West of Call Hall 40 4 10% 29 73% 30 75% 30 75% 28 70% 10 25% 30 75%F7 Behind Call Hall 5 3 60% 3 60% 4 80% 5 100% 5 100% 2 40% 5 100%A16 T On-Street Parking, Claflin Road 26 1 4% 25 96% 25 96% 23 88% 24 92% 17 65% 25 96%A14 D Between Haymaker and Moore 89 69 78% 72 81% 72 81% 74 83% 72 81% 69 78% 74 83%A15 D NW of Moore Hall 47 39 83% 42 89% 37 79% 40 85% 38 81% 35 74% 42 89%A12 D Between West and Ford Hall 121 92 76% 103 85% 109 90% 104 86% 96 79% 95 79% 109 90%A11 D SW of West Hall 88 75 85% 78 89% 79 90% 75 85% 73 83% 63 72% 79 90%A13 Y Between Ford and Haymaker 58 30 52% 40 69% 44 76% 55 95% 47 81% 25 43% 55 95%A23 Y On-Street, Leadship Studies 4 0 0% 3 75% 3 75% 3 75% 3 75% 3 75% 3 75%F6 north of Boyd Hall 17 7 41% 6 35% 11 65% 6 35% 6 35% 5 29% 11 65%A10 Y North of Van Zile Hall 25 11 44% 14 56% 17 68% 18 72% 17 68% 14 56% 18 72%A9 Y Between Putnam and Van Zile Hall 7 3 43% 5 71% 4 57% 5 71% 5 71% 3 43% 5 71%F5 O On-Street, Petticoat Lane 17 2 12% 15 88% 14 82% 13 76% 12 71% 12 71% 15 88%F4 W On-Street, Campus Creek Drive 23 1 4% 18 78% 21 91% 20 87% 20 87% 17 74% 21 91%F3 Y NE corner of Justin Hall 11 7 64% 10 91% 11 100% 7 64% 9 82% 3 27% 11 100%A8 W East of King Hall 18 2 11% 13 72% 17 94% 9 50% 13 72% 11 61% 17 94%A6 W North of Dickens Hall 72 43 60% 68 94% 69 96% 63 88% 62 86% 56 78% 69 96%A5 O North of Justin Hall 34 4 12% 33 97% 34 100% 33 97% 34 100% 32 94% 34 100%A5 W North of Justin Hall 165 11 7% 143 87% 148 90% 141 85% 145 88% 110 67% 148 90%F1 Front of Justin Hall 6 0 0% 5 83% 4 67% 2 33% 3 50% 3 50% 5 83%A3 W North of Vattier Street 36 22 61% 44 122% 46 128% 46 128% 43 119% 24 67% 46 128%A2 T South of Vattier Street 235 12 5% 214 91% 222 94% 220 94% 213 91% 140 60% 222 94%A1 T East of Beach Art Museum 83 9 11% 78 94% 81 98% 80 96% 70 84% 52 63% 81 98%A1A Y South of Beach Art Musem 35 2 6% 14 40% 18 51% 16 46% 17 49% 16 46% 18 51%A31 Y south of Thompson Hall 9 3 33% 4 44% 4 44% 4 44% 2 22% 3 33% 4 44%E13 Y College Court 40 6 15% 33 83% 29 73% 25 63% 27 68% 7 18% 33 83%E3 W Drive to Nichols Hall 5 0 0% 0 0% 2 40% 1 20% 3 60% 0 0% 3 60%E16 Y Alumni Center West 40 3 8% 23 58% 22 55% 20 50% 28 70% 26 65% 28 70%E1 Y Alumni Center East 19 2 11% 13 68% 11 58% 11 58% 15 79% 10 53% 15 79%E5 Mid-Campus Drive at Kedzie Hal 4 2 50% 3 75% 4 100% 3 75% 3 75% 1 25% 4 100%E8 Front of Anderson Hall 13 1 8% 12 92% 11 85% 10 77% 8 62% 6 46% 12 92%E7 Meters along Vattier Street 8 2 25% 3 38% 6 75% 7 88% 8 100% 4 50% 8 100%E10 McCain circle drive 21 2 10% 3 14% 9 43% 10 48% 6 29% 13 62% 13 62%E12 Danforth Chapel 5 0 0% 0 0% 3 60% 1 20% 1 20% 0 0% 3 60%E6 Y Behind Anderson Hall 15 0 0% 5 33% 4 27% 2 13% 8 53% 2 13% 8 53%E9 Front of Eisenhower Hall 12 0 0% 11 92% 10 83% 8 67% 10 83% 12 100% 12 100%A24 Y English Counseling Service 13 5 38% 7 54% 8 62% 7 54% 7 54% 7 54% 8 62%A25 Y Seaton Hall Courtyard 39 14 36% 12 31% 18 46% 18 46% 18 46% 18 46% 18 46%A26 W College Heights Rd 52 20 38% 27 52% 28 54% 26 50% 25 48% 16 31% 28 54%A20 K Just north of Waters Hall 31 17 55% 21 68% 25 81% 22 71% 23 74% 19 61% 25 81%A22 W Just north of Shellenberger hall 40 15 38% 26 65% 29 73% 29 73% 30 75% 19 48% 30 75%A17 O North of Waters Hall 123 3 2% 123 100% 123 100% 113 92% 123 100% 60 49% 123 100%A17 W North of Waters Hall 180 8 4% 175 97% 176 98% 172 96% 174 97% 110 61% 176 98%A17 T North of Waters Hall 68 1 1% 67 99% 66 97% 67 99% 67 99% 53 78% 67 99%Occ. % Occ. % Occ. % Occ. % Occ. % Occ. % Occ. %
Beginning at11:00 a.m.
Beginning at 1:00 p.m.
Beginning at 3:00 p.m.
Beginning at 5:00 p.m.
PeakParking Lot
Permit Type
Description CapacityBeginning at
7:00 a.m.Beginning at
9:00 a.m.
A18 W North of Bushnell Hall 119 19 16% 114 96% 116 97% 115 97% 114 96% 79 66% 116 97%A19 Y West of Bushnell Hall 20 10 50% 12 60% 17 85% 16 80% 17 85% 14 70% 17 85%A21 Y Between Waters & Shellenberger 9 2 22% 5 56% 6 67% 4 44% 5 56% 5 56% 6 67%A4 Y North of Holton Hall 7 0 0% 5 71% 6 86% 6 86% 5 71% 4 57% 6 86%D6 Y Lafene Health Center 105 5 5% 65 62% 77 73% 32 30% 82 78% 48 46% 82 78%D4 GM NE of Marlatt Hall 119 104 87% 104 87% 107 90% 108 91% 102 86% 106 89% 108 91%D5 GM South of Marlatt Hall 199 162 81% 173 87% 181 91% 183 92% 179 90% 158 79% 183 92%D3 Y Front of Goodnow Hall 22 13 59% 13 59% 16 73% 14 64% 18 82% 8 36% 18 82%A28 W Durland Hall 213 73 34% 208 98% 206 97% 204 96% 195 92% 108 51% 208 98%A28 O Durland Hall 190 55 29% 185 97% 188 99% 185 97% 183 96% 115 61% 188 99%D1 O Old stadium lot 255 22 9% 215 84% 249 98% 235 92% 214 84% 150 59% 249 98%D1 Z Old stadium lot 311 311 100% 311 100% 311 100% 310 100% 309 99% 303 97% 311 100%D1 T Old stadium lot 275 6 2% 96 35% 263 96% 239 87% 195 71% 110 40% 263 96%D1 W Old stadium lot 63 6 10% 28 44% 60 95% 59 94% 53 84% 43 68% 60 95%D1 R Old stadium lot 60 60 100% 60 100% 60 100% 60 100% 60 100% 67 112% 67 112%F5 W On-Street, Petticoat Lane 11 1 9% 10 91% 9 82% 10 91% 10 91% 7 64% 10 91%
Y Rowing Center 13 4 31% 5 38% 5 38% 6 46% 2 15% 1 8% 6 46%H8 17th Street 2 0 0% 1 50% 2 100% 2 100% 0 0% 0 0% 2 100%H8 17th Street 4 1 25% 2 50% 1 25% 3 75% 2 50% 3 75% 3 75%
Garage Union Parking Garage 1367 25 2% 730 53% 864 63% 845 62% 771 56% 505 37% 864 63%15703 4411 28% 8146 52% 8798 56% 8444 54% 8410 54% 6492 41% 9495 60%11253 4332 38% 7932 70% 8565 76% 8207 73% 8114 72% 6177 55% 9131 81%TOTAL (stadium lots not included)
Subtotal
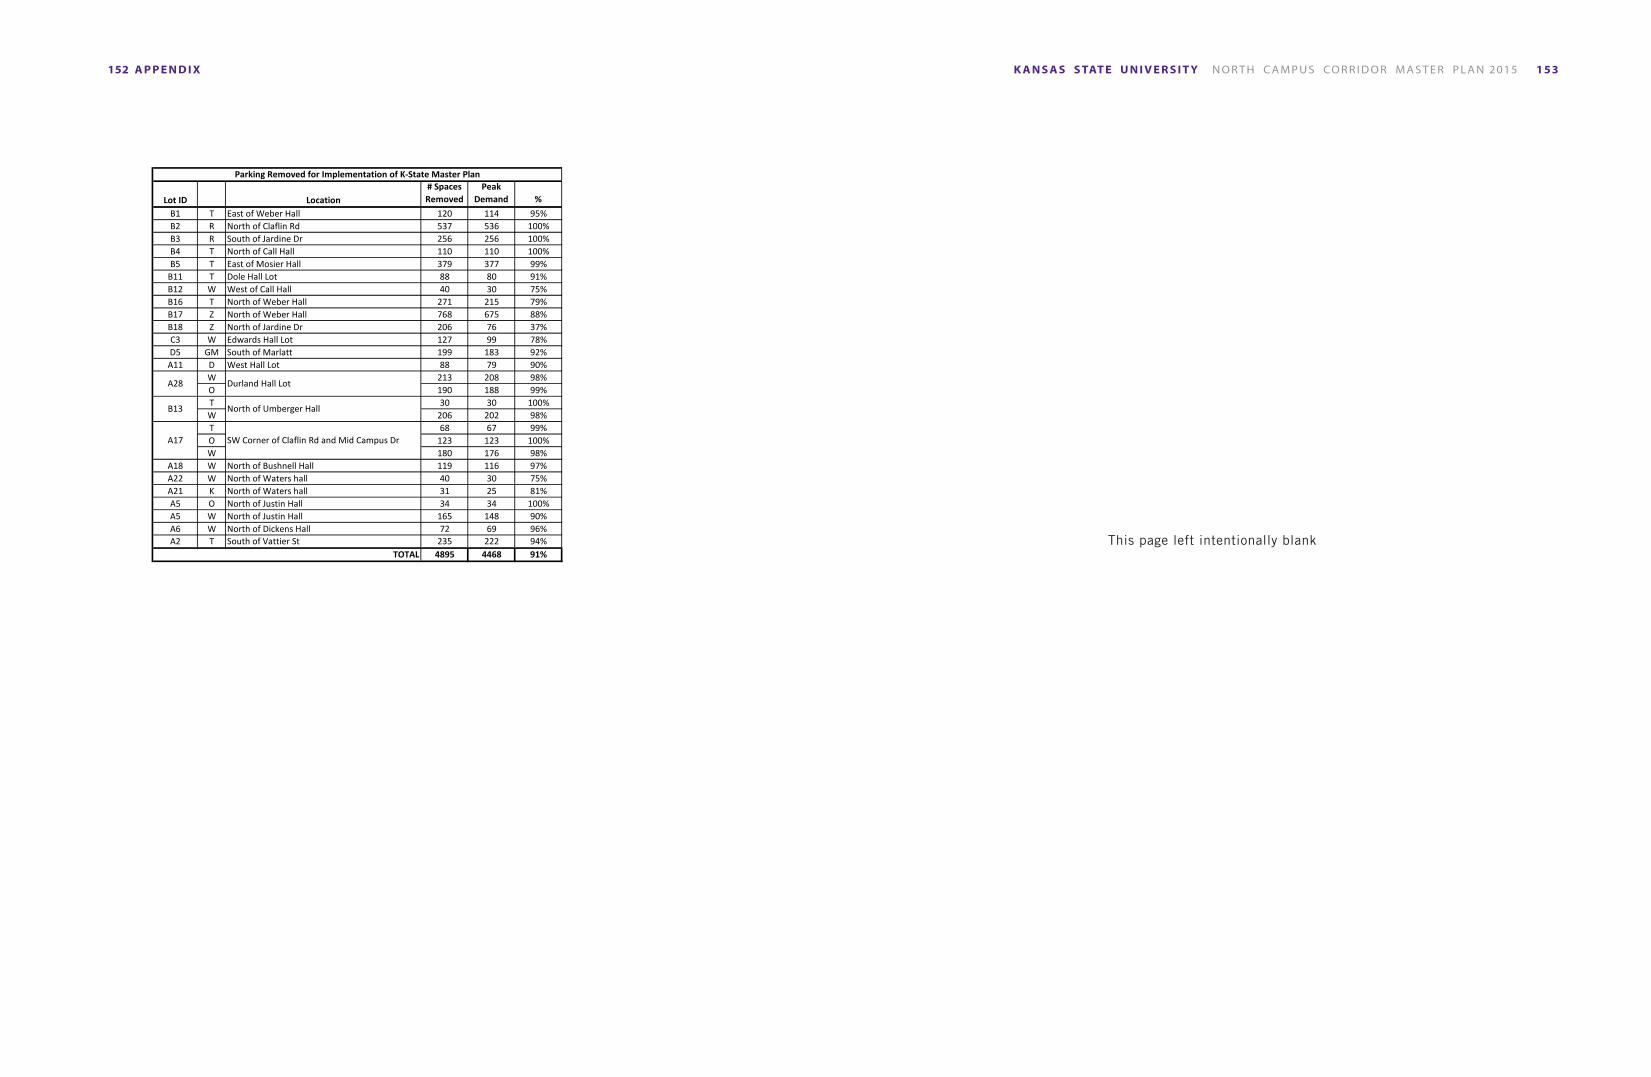
153K A N S A S S TAT E U N I V E R S I T Y N O R T H C A M P U S CO R R I D O R M A S T E R P L A N 2015A P P E N D I X152
Lot ID Location# Spaces Removed
Peak Demand %
B1 T East of Weber Hall 120 114 95%B2 R North of Claflin Rd 537 536 100%B3 R South of Jardine Dr 256 256 100%B4 T North of Call Hall 110 110 100%B5 T East of Mosier Hall 379 377 99%
B11 T Dole Hall Lot 88 80 91%B12 W West of Call Hall 40 30 75%B16 T North of Weber Hall 271 215 79%B17 Z North of Weber Hall 768 675 88%B18 Z North of Jardine Dr 206 76 37%C3 W Edwards Hall Lot 127 99 78%D5 GM South of Marlatt 199 183 92%
A11 D West Hall Lot 88 79 90%W 213 208 98%O 190 188 99%T 30 30 100%W 206 202 98%T 68 67 99%O 123 123 100%W 180 176 98%
A18 W North of Bushnell Hall 119 116 97%A22 W North of Waters hall 40 30 75%A21 K North of Waters hall 31 25 81%A5 O North of Justin Hall 34 34 100%A5 W North of Justin Hall 165 148 90%A6 W North of Dickens Hall 72 69 96%A2 T South of Vattier St 235 222 94%
4895 4468 91%
Parking Removed for Implementation of K-State Master Plan
TOTAL
A28 Durland Hall Lot
A17 SW Corner of Claflin Rd and Mid Campus Dr
North of Umberger HallB13
This page left intentionally blank


