6.1 Appendix I Survey protocol ................................................................................... 37
6.3 Appendix III Table 1a .............................................................................................. 37
Table 1a. Numbers of Campylobacter spp. in whole fresh chicken collected from all
shop types, including major retailers during .................................................................. 37
4
Acknowledgements
The authors would like to say thank you to the following people:
All staff who were involved in the successful delivery of this project from PHE and AFBI through the sampling and testing of chickens
Tara French, Abrar Jaffer and colleagues at the Food Standards Agency
Colleagues in GBRU at PHE Colindale for speciation data
Colleagues in PHE Statistics Unit
Jacquelyn McCormick and Richard Elson for support with epidemiological data
5
Abbreviations
ºC Degrees Celsius
GBRU Gastrointestinal Bacteria Reference Unit
cfu Colony forming units
CI Confidence Interval
EQA External Quality Assurance
FSA Food Standards Agency
FSS Food Standards Scotland
g Gram
h Hour(s)
PHE Public Health England
IQA Internal Quality Assurance
ISO International Standard Organisation
l Litre
LIMS Laboratory Information Management System
mCCDA modified Charcoal Cefoperazone Deoxycholate Agar
mg Milligram
ml Millilitre
MRD Maximum Recovery Diluent
n Number
OR Odds Ratio
SOP Standard Operating Procedure
spp. Species
UK United Kingdom
UKAS United Kingdom Accreditation Service
6
Executive summary
Campylobacter spp. are the most common bacterial cause of foodborne illness in the UK, with chicken considered to be the most important vehicle for this organism. The Food Standards Agency (FSA) agreed with industry to reduce Campylobacter spp. contamination in raw chicken and issued a target to reduce the prevalence of the most contaminated chickens (those with > 1000 cfu per g chicken neck skin) to below 10 % at the end of the slaughter process, initially by 2016.
A UK-wide survey was undertaken to determine the levels of Campylobacter spp. on whole UK-produced, fresh chicken at retail sale. The first three survey years of data was collected by FSA Project FS241044 (2014/15)/ FS102121 (2015/2018) and this report represents results from sampling and testing chickens in the fourth survey year. The samples were distributed throughout the UK (in proportion to the population size of each country) and testing was performed by four laboratory sites; three Public Health England (PHE) laboratories and one laboratory in Northern Ireland (Agri-Food & Biosciences Institute, Belfast). Campylobacter spp. numeration testing on chicken samples was performed using the EN/TS/ISO 10272-2 standard enumeration method applied with a detection limit of 10 colony forming units (cfu) per gram of neck skin.
During the first months of this 4th survey year chickens (n = 1044) were sampled from all retailer groups, including major retailers, with the large majority (98 %) tested from August to October 2017 (hereafter referred to as the first sampling period). Based on this data, Campylobacter spp. were detected in the majority (56 %) of chicken neck skin samples and 7 % of samples had > 1000 cfu per g chicken skin (highly contaminated chicken category). There were significant differences in the proportion of highly contaminated chickens (ranging from 0 to 21 %) between the different types of retailers that could not be explained by differences in remaining shelf-life, chicken weight, sampling period or the type of rearing used. Comparison of individual approval codes (signifying the slaughter house premises) also showed a significant difference in the proportion of chickens with >1000 cfu per g, ranging from 0 to 27 %, and it was noted that some retailers were predominantly supplied by specific approved slaughter premises. There was no significant difference in the proportion of highly contaminated chickens between smaller or larger chickens. There was no evidence of birds with access to range (e.g. free-range and organic birds) being more contaminated than birds reared under standard conditions, but with much fewer free-range and organic birds tested there was limited precision in the comparisons made.
Chickens from smaller retail shops were tested for an entire year, from August 2017 to July 2018 (n = 829). Campylobacter spp. were detected in 75 % of these chicken skin samples obtained from non-major retailer shops, and 15 % of samples had counts above 1000 cfu per g chicken skin. Comparison of individual approval codes showed a significant difference in the proportion of chickens with >1000 cfu per g, ranging from 0 to 24 %. The proportion of samples with > 1000 cfu/g of Campylobacter spp. was not significantly different over the different sampling periods for these samples collected from an entire year from the smaller retail shops. There was no significant difference in the proportion of highly contaminated chickens between smaller or larger chickens nor was there any evidence that birds with
7
access to range (e.g. free-range and organic birds) were more contaminated than birds reared under standard conditions.
Taking into account all samples tested during the 4th survey year, C. jejuni alone was isolated from the majority (78 %) of chicken skin samples from which isolates were submitted for speciation (n = 1024). Campylobacter coli alone was identified in 16 % of samples. Both species were found in 6 % of samples. C coli was more frequently isolated from birds with access to range in comparison to those reared as standard birds.
In the samples tested from non-major retail shops, from the entire year (from August to July 2018), C. jejuni was slightly less prevalent during the summer period compared to the rest of the year but this difference was not statistically significant.
The average proportion of fresh, whole chicken at retail sale in the UK that are contaminated with a high level of Campylobacter spp. has decreased considerably but chickens from the group of shops comprising smaller retailers, independents and butchers remain highly contaminated, suggesting more action is needed to achieve better control of Campylobacter spp. in those chickens. Data from this year and the previous survey years have demonstrated an overall substantial decline in the level of highly contaminated fresh, whole UK retail chicken. The FSA has indicated that the retail proxy for the proportion of highly contaminated retail chickens should be less than 7 % and continued monitoring has demonstrated a sustained decline but not for all market sectors.
8
1.0 Background
Campylobacter species, especially Campylobacter jejuni (C. jejuni), are the main cause of human bacterial gastroenteritis in the developed world and it is estimated that there are in excess of half a million cases and 80,000 general practitioner consultations annually in the UK (Strachan et al. 2010, Tam et al. 2012). Source-attribution studies, outbreak investigations and case-control reports all incriminate chicken meat as the key food-borne vehicle for Campylobacter spp. infection, with cross contamination from poultry being identified as an important transmission route (Tam et al. 2009, Danis et al. 2009, Friedman et al. 2004; Mullner et al. 2009, Sheppard et al. 2009). Consumption of undercooked poultry or cross contamination from raw poultry meat is believed to be an important vehicle of infection (EFSA, 2009). Raw chicken meat is frequently contaminated with Campylobacter spp. and a decrease in the exposure levels from this source is likely to reduce the number of human cases of campylobacteriosis. The packaging of raw chicken has also been identified as a potential risk for infection. However, data published previous to the FSA survey lacked critical information on the levels detected on outer packaging, and it is not known how levels on the outer packaging relate to levels on the chicken it contains (Jorgensen et al. 2002).
The Food Standards Agency (FSA) agreed with industry to reduce Campylobacter spp. contamination in raw chicken and issued a target for this in order to measure the effectiveness of the FSA’s Campylobacter Risk Management Programme (FSA 2010; FSA 2013). The target was to reduce the percentage of chickens produced in UK poultry slaughterhouses (sampled at the post-chill stage) that are contaminated with >1,000 colony forming units (cfu) per gram (g), from a 2008 baseline of 27 % to less than 10 % by December 2015; this target was rolled over to 2016 as it had not been achieved by the end of 2015 (FSA 2015b, FSS 2015).
In theory, such a reduction would also be expected to be reflected in the levels found on chicken at retail sale, although fresh chicken sampled at retail may on average have lower levels of Campylobacter spp. compared to those present immediately after slaughter, as Campylobacter spp. levels are known to reduce during the shelf-life of the chicken at retail-sale (Purnell et al. 2004).
Enumeration
The most important factor known to affect counts of Campylobacter spp. on a chicken carcass is the colonisation status of the chicken itself prior to slaughter (EFSA 2010a; Bull et al. 2006; Reich et al. 2008; Rosenquist et al. 2003). Studies have shown that when birds were not colonised at slaughter, Campylobacter spp. were either not detected or recorded as being present in very low numbers on carcasses (Allen et al. 2007). According to data from an EU survey, a colonised batch of chickens was 30 times more likely to result in a carcass that was contaminated with Campylobacter spp. than a non-colonised batch (EFSA 2010b). In the EU survey there was a very high proportion (70 %) of unexplained variance in Campylobacter-contamination results attributable to slaughterhouse-specific factors in colonised broiler batches for countries with a high prevalence, which included the UK. This is supported by other data, that identified different levels of Campylobacter
9
contamination on carcasses despite carcasses originating from the same house and/or batch of birds sent for slaughter (Sampers et al. 2008; Figuerosa et al. 2009).
The prevalence of Campylobacter spp. in retail chicken, as determined by the standard ISO 10272-1 enrichment culture detection (presence/absence) method, has been associated with the time of year sampled (Meldrum 2005, CLASSP Project Team 2010, Hutchison et al. 2006). However, the counts in post-chill chickens were not significantly associated with the month of sampling in the 2008 EU survey. The type of sample examined may also affect the counts obtained, but there is evidence that counts from carcass rinse and neck skin samples taken from the same chicken correlate well (Jorgensen et al. 2002).
Campylobacter spp. have been enumerated using conventional culture, Enzyme Linked Immunosorbent Assay (ELISA), and methods based on DNA amplification (Jorgensen et al. 2002; Borck et al. 2002, Oyarzabal et al. 2005, Dufrenne et al. 2001, Hong et al. 2003; Wolffs et al. 2005; Fukushima et al. 2007). Accurate enumeration data are needed to support effective monitoring and risk assessment of Campylobacter spp. contamination in chicken meat and depend on the availability of reliable methods. Campylobacter spp. are fastidious bacteria with demanding growth requirements and this may challenge accurate and reliable detection and enumeration (Hutchison et al. 2006). While it is normally assumed that detection by enrichment culture is more sensitive than detection by direct plating, the EU survey reported instances where Campylobacter spp. were detected by enumeration but not by enrichment suggesting that the enrichment method yielded false negative results (EFSA 2010b). This has been reported elsewhere and may be associated with failure to grow Campylobacter sufficiently due to over-growth of other bacteria in the enrichment medium (Habib et al. 2008, Jasson et al. 2009). The EN/ISO 10272-2 method recommended by the International Organisation for Standardisation provides a horizontal method for the enumeration of Campylobacter spp. involving direct plating onto modified charcoal cefoperazone desoxycholate agar (mCCDA) and incubation for 48 h at 41.5 °C (Anonymous, 2017). A collaborative study (Rosenquist et al. 2007) confirmed that direct plating on mCCDA is an acceptable protocol for the enumeration of thermotolerant Campylobacter spp. in chicken meat. The study, however, also found difficulties in detecting low numbers and variation between laboratories possibly due to difficulties in handling Campylobacter spp. Direct spread plating on mCCDA has also been shown to be a reliable alternative to the most probable number method (Scherer et al. 2006). This medium was therefore chosen for this study.
In the EU survey about two-thirds of the Campylobacter spp. isolates from broiler carcasses were identified as C. jejuni, while one third was Campylobacter coli (C. coli) (EFSA 2010b). Speciation data is essential for meaningful epidemiological analysis and can allow accurate interpretation of antibiotic resistance data. With the introduction of molecular methods for determining species, these methods have been proven to be quick and reliable using species specific genes (Best et al. 2003, Melero et al. 2011).
Findings from previous survey years
In March 2012, the FSA put in place a new ongoing UK monitoring programme of chicken carcasses, sampled at post-chill. The FSA also completed a review, with
10
stakeholders, of the joint campylobacter reduction target that was agreed in 2010, which had incorporated new data (FSA 2013). Industry (with support from the FSA) have developed a programme of initiatives from farm to fork to engage the whole of the food chain regarding the control of Campylobacter spp. under the umbrella of the Joint Working Group on Campylobacter (JWG). The JWG then developed into the Acting on Campylobacter Together (ACT) campaign (FSA 2015a). In 2014-15, the FSA funded project FS241044 that looked to gather a year of data from whole raw chicken at retail sale (FSA 2015c). During that first survey year 4,011 samples of whole, UK-produced, fresh chicken from February 2014 to March 2015 were tested. The prevalence of Campylobacter spp. in the fresh chicken at retail in the UK was found to be 73.3 % (PHE 2015). A significant proportion (19.4 %) of samples had > 1000 cfu per g chicken skin, and this ranged between all retailers from 12.9 to 29.9 %. Overall, Campylobacter spp. were detected from the outer-packaging swab in 6.8 % of samples. The Campylobacter spp. contamination found on the outer packaging was at low levels, but between 100 and 4,500 Campylobacter spp. cfu per swab were detected in 1.6 % of samples. There were significant differences between retailers that could not be explained by differences in shelf-life remaining, chicken weights, time of year sampled or type of chicken rearing. Some approval codes (signifying the slaughter house premises) also showed a significant difference in the proportion of chickens with >1000 cfu per g, ranging from 9.4 to 29.7 %, and it was noted that some retailers were supplied by specific approved premises. A higher proportion of chickens had a high level of Campylobacter spp. during the summer compared to winter months. The larger chickens, those >1750 g in weight, showed a higher risk of being contaminated with >1000 cfu per g. There was no evidence of birds with access to range (e.g. free-range and organic birds) being more contaminated than birds reared under standard conditions but with much fewer free-range and organic birds tested (reflecting market share) no precise comparison could be made. For the majority of chicken skin samples (76.6 %) from which isolates were submitted for speciation, C. jejuni was identified. C. coli was identified in 13.9 % of samples. Both species were found in 4.2 % of samples. Campylobacter coli was more frequently isolated in the summer compared to winter and spring months and was more frequently isolated from birds with access to range. Where Campylobacter spp. was isolated from both the skin and the corresponding outer packing sample, the same species was detected in 93 % of these samples. As in the first survey year (project FS241044) it was identified that a significant proportion of chicken on sale in the UK remained contaminated, therefore Campylobacter spp. in chicken continued to be important in terms of foodborne disease risk. These findings led to the FSA continuing the monitoring programme over three further years (under project FS102121), aiming to determine the prevalence and levels of Campylobacter spp. contamination on fresh whole chilled chickens produced in the UK and sold at UK retail outlets by sampling up to a 36 month period. The project also was to continue to identify Campylobacter spp. present and determine susceptibility of isolates to a defined range of antimicrobial agents (the results of antimicrobial susceptibility testing are published as a separate report).
In the second survey year, the prevalence of Campylobacter spp. in the fresh
chicken at retail in the UK had declined to 61.3 % and the proportion of samples with
> 1000 cfu per g chicken skin to 11.4 % (PHE 2017). There were significant
differences in the proportion of highly contaminated chickens (ranging from 6.7 to
17.7 %) between retailers that could not be explained by differences in shelf-life
11
remaining, chicken weights, sampling period or the type of rearing used. Comparing
individual approval codes (signifying the slaughter house premises) also showed a
significant difference in the proportion of chickens with >1000 cfu per g, ranging from
1.8 to 19.3 %, and it was noted that some retailers were predominantly supplied by
specific approved premises. A higher proportion of chickens were highly
contaminated with Campylobacter spp. during the first summer months compared to
the subsequent months. The larger chickens (ie. those weighing > 1750 g) showed a
higher risk of being contaminated with >1000 cfu per g. There was no evidence of
birds with access to range (e.g. free-range and organic birds) being more
contaminated than birds reared under standard conditions but with much fewer free-
range and organic birds tested there was limited precision in the comparison made.
For the majority of chicken skin samples (83.0 %) from which isolates were
submitted for speciation, C. jejuni alone was identified. C. coli alone was identified in
13.5 % of samples. Both species were found in 3.4 % of samples. C. coli was more
frequently isolated in the summer months, and also more frequently isolated from
birds with access to range.
In the third survey year (4268 samples), the prevalence of Campylobacter spp. in the
fresh chicken at retail in the UK had declined further to 54 % and the proportion of
samples with > 1000 cfu per g chicken skin to 6 % (PHE 2018). There were
differences in the proportion of highly contaminated chickens (ranging from 1 to 18
%) between retailer groups and between individual approval codes (ranging from 1
to 19 %). For the majority of chicken skin samples (87.7 %) from which isolates
were submitted for speciation C. jejuni was identified. C. coli was identified in 10.2 %
of samples.
In summary, the survey data have shown that the proportion of fresh, whole chicken at retail sale in the UK that are contaminated with a high level of Campylobacter spp. has decreased considerably but chickens from the group of shops comprising smaller retailers, independents and butchers have remained more highly contaminated. From July 2017, the top nine retailers agreed to publish their own Campylobacter results on their consumer websites and as a result of this, these retailers were no longer included in the survey from 2018. The current focus on smaller establishments and their suppliers may allow the improvements to be made across their supply chain including any supplies into the catering trade.
The purpose of examining numbers of Campylobacter spp. in fresh whole chicken on retail sale in the UK for a fourth survey year was to determine whether a sustained decline in contamination remained evident. Furthermore, possible factors affecting the proportion of highly contaminated chickens were investigated using a logistic regression model to enable an assessment of whether associations observed when a variable is assessed in isolation could be explained by confounding.
12
2.0 Methods
Sampling and testing procedures for the survey and the method evaluation work was agreed with the FSA. The survey protocol used for the time-period from August 2017 to July 2018 is briefly described (FSA 2016; enclosed as Appendix I).
2.1 Sampling method Sampling was spread across the UK and designed to reflect population sizes. The numbers of free-range and organic chickens sampled within these were based on market share data from Kantar (FSA 2016). During the first months chickens from all retailer groups were tested including major retailers. A similar number of samples were obtained from each major retailer, an approach also used during the second and third survey year (PHE 2017, 2018). Chickens from smaller retail shops were sampled for an entire year, from August 2017 to July 2018. A small number (reflecting a likely very minor market share) of chickens labelled as Halal (including a very few sold by major retailers) or Kosher were also sampled as part of the sample spanning the entire year. Samples for the survey were collected by trained individuals, who purchased samples from retail outlets and transported them to the appropriate testing laboratory according to the survey protocol. On arrival at the laboratory, the air temperature of the cool boxes was taken using calibrated data loggers or temperature probes. Samples were documented using photographs and details were logged onto the laboratory information management system.
2.2 Microbiological methods Four laboratories undertook the testing during the survey period; three PHE Food, Water and Environmental Microbiology Service Laboratories and the Agri-Food & Biosciences Institute, Belfast. All laboratories enumerated Campylobacter spp. based on EN/ISO 10272-2 for the enumeration of Campylobacter spp. as detailed in the FSA survey protocol (FSA 2016) using modified Charcoal Cefoperazone Deoxycholate Agar as the primary plating medium.
Neck-skin samples were prepared as described before (Appendix I) using a 1:9 (w/w) dilution of chicken neck-skin and buffered peptone water. Sample weights were between 2 to 10 g pure neck-skin.
2.3 Quality Assurance During the previous FS241044 project a pilot study of 400 samples was initiated before commencing to establish and validate methods for sampling and enumerating Campylobacter spp. in samples from chickens. The pilot provided the basis on which the current survey of whole UK-produced fresh retail chicken was developed. The amended weight of neck skin was validated at the end of survey year 2, from 25 g of neck skin to between 2 and 10 g. This was carried out due to changes in chicken production resulting in increased amounts of neck skin being removed.
13
All laboratories participate in recognised External Quality Assurance schemes (e.g. https://www.gov.uk/government/collections/external-quality-assessment-eqa-and-proficiency-testing-pt-for-food-water-and-environmental-microbiology) including the FSA funded scheme for enumeration of Campylobacter species, as well as operating comprehensive internal quality assurance schemes as part of the requirements of their accreditation to ISO 17025/2005 as assessed annually by the United Kingdom Accreditation Service (UKAS). All analyses were performed by trained and competent staff in a UKAS accredited laboratory operating an internal audit and review programme.
2.4 Statistical Analysis Cross tabulations were analysed by the calculation of Clopper-Pearson exact 95 % confidence intervals for the proportion in each cfu per g category. In addition, the Pearson chi square test of association has been used to test the null hypothesis of no association between the measured variable and Campylobacter contamination. Fisher’s exact test was used for individual comparisons when samples were small. The expected counts in the individual cells of the table, together with the contribution to the overall chi square test statistics have been calculated to enable the identification of specific categories that determine the association.
Logistic regression analysis (a penalised likelihood method (Firth logistic regression) was chosen to cope with zero events) was used to assess whether any associations could be explained as a result of confounding by other important predictors of contamination. The outcome variable used was constructed around the FSA reduction target with the “positive” outcome defined as >1000 cfu per g, and a “negative” outcome being 1000 or fewer cfu per g.
For each predictor variable, the estimated odds ratios prior to and after adjustment
for the confounding effects of the other important predictors were obtained from the
logistic regression models. This enables an assessment of whether associations
observed when a variable is assessed in isolation can be explained by confounding.
Factors examined were retailer, rearing regime, chicken weight, time of test in relation to shelf-life and time period sampled in.
No post-hoc weighting for retailers market share was applied to any of the statistical analyses presented in this report.
Fresh raw whole UK produced chickens were collected from retail outlets across the UK between August 2017 and July 2018 (Figure 1).
Figure 1a Figure 1b
Figure 1. Geographical location of chicken samples collected for the survey.
Samples tested as part of the first sampling period that included major retailers (collected from August to October 2017 except for a small proportion collected in early November and December) (Fig1a) and samples tested over an entire year from smaller retail shops (Fig 1b).
Retailers tend to use centralised distribution centres and therefore it is likely that similar chickens are sold in all their stores and because of this and considerations of transport times samples were mainly collected from sentinel urban areas.
15
Samples from other types of shops including independents and butchers may vary more across the country, nevertheless a wide range of approval numbers were represented and sampled from both northern and southern areas of the country (see section 3.1.3).
3.1 Numbers of Campylobacter spp. in chicken skin samples from whole fresh UK produced chicken.
During the first months of this 4th survey year chickens from all types of retail shops were tested from August to October 2017 with an additional small proportion of chickens completed in early November (n = 10) and December (n = 6) to ensure sufficient samples from each of the major retailers (this dataset is hereafter referred to as the first sampling period dataset).
Based on this data, Campylobacter spp. were detected in the majority (56 %) of chicken skin samples and 7 % (95 % CI = 5 to 9 %) of the samples had counts above 1000 cfu per g chicken skin. The highest single count detected was 125000 cfu of Campylobacter per g chicken skin.
The FSA instructed PHE to continue to test chickens from smaller retail shops only, so that samples from these shops were obtained throughout an entire year, from August 2017 to July 2018 as these chickens were thought to constitute a greater risk. Campylobacter spp. were detected in 75 % of these chicken skin samples and 15 % (95 % CI =12 to 17 %) had counts above 1000 cfu per g chicken skin. The highest single count detected was 105000 cfu of Campylobacter per g chicken skin.
3.1.1 Campylobacter spp. in chicken skin samples in relation to retailer.
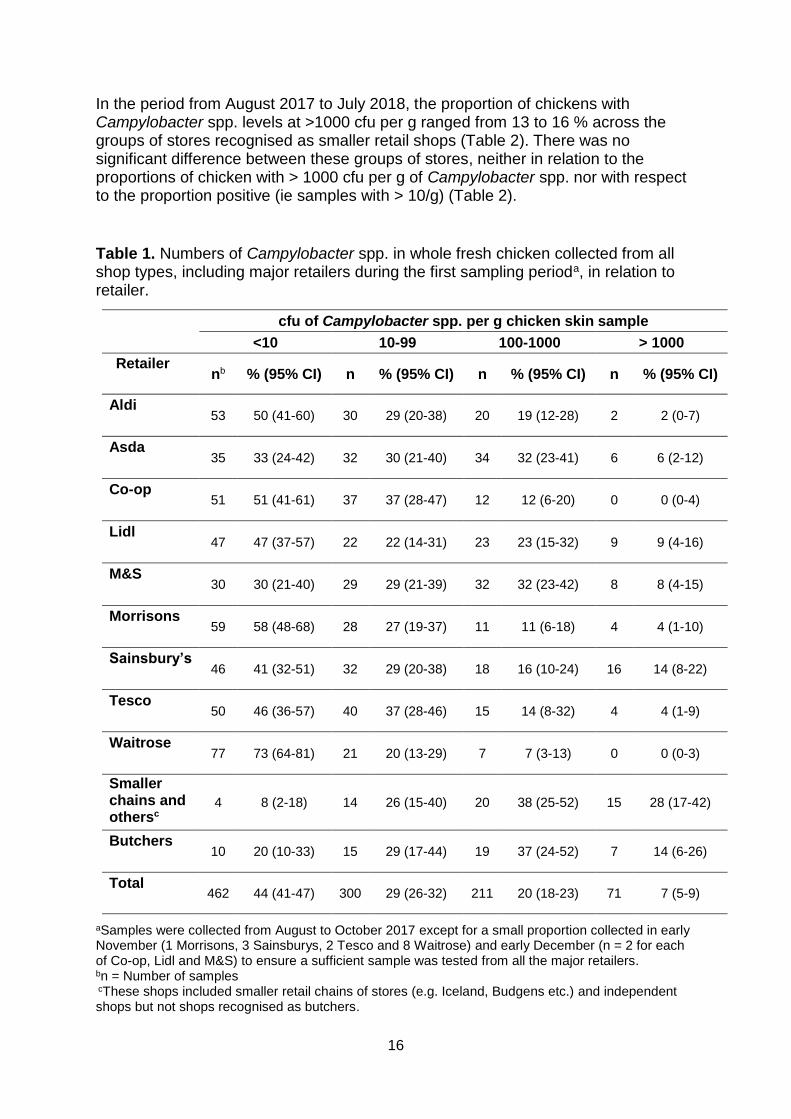
The proportion of chickens with Campylobacter spp. levels at >1000 cfu per g ranged from 0 to 28 % amongst the retailers tested during the first sampling period (Table 1). Confidence intervals are given for each retailer and these show the likely range of the results allowing for the number of samples taken. The 95 % confidence intervals means that we would expect the true prevalence to fall within the lower and upper confidence limits 95 % of the time.
For the nine larger retailers (i.e. Aldi, Asda, Co-op, Lidl, M&S, Morrisons, Sainsbury’s, Tesco and Waitrose) between 0 and 14 % of chicken had Campylobacter spp. levels of > 1000 cfu per g. Shops that did not belong to these major retailers (smaller retailers/independent shops) had a significantly (p < 0.001; Fishers exact test) higher proportion of chickens with > 1000 cfu per g of Campylobacter spp. compared to the average for all samples (Table 1). The proportion of chickens with Campylobacter spp. levels at >1000 cfu per g was significantly (p < 0.01; Fishers exact test) lower in chickens obtained from Co-op or Waitrose compared to the average for all samples. Similar results and 95 % confidence intervals were obtained when omitting the 20 samples that were taken in November and early December (Appendix III).
Possible confounding of results was investigated using logistic regression (3.2).
16
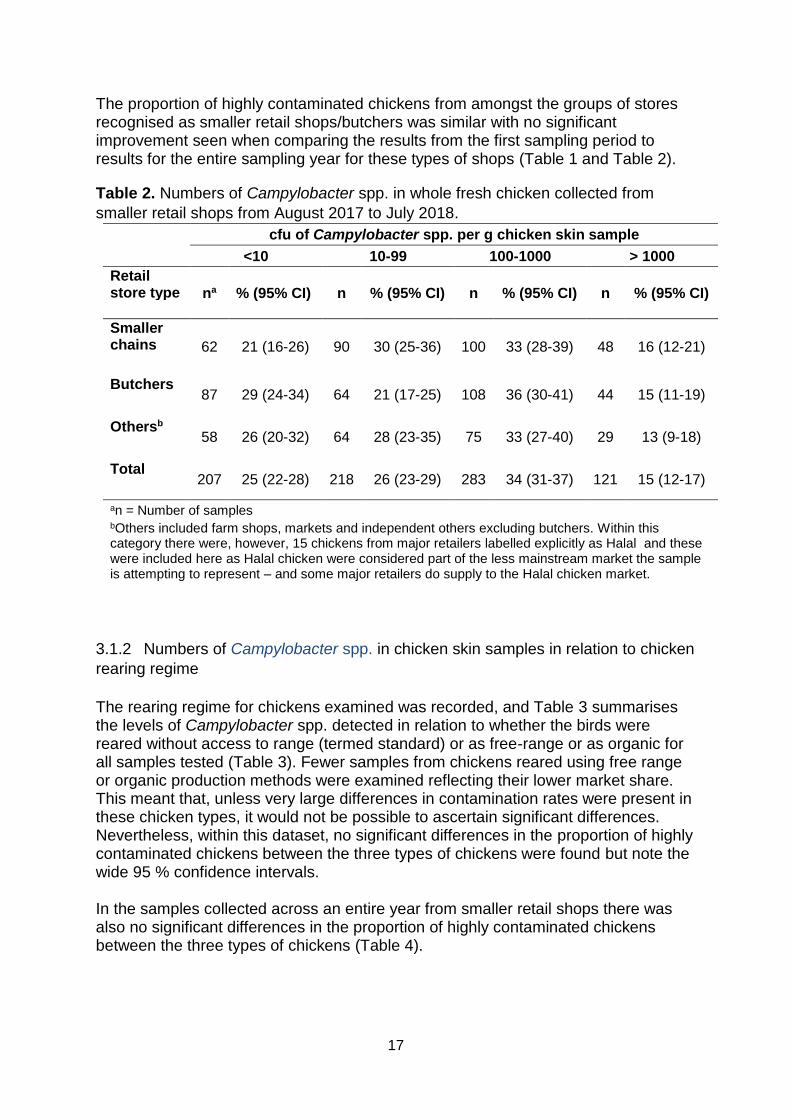
In the period from August 2017 to July 2018, the proportion of chickens with Campylobacter spp. levels at >1000 cfu per g ranged from 13 to 16 % across the groups of stores recognised as smaller retail shops (Table 2). There was no significant difference between these groups of stores, neither in relation to the proportions of chicken with > 1000 cfu per g of Campylobacter spp. nor with respect to the proportion positive (ie samples with > 10/g) (Table 2).
Table 1. Numbers of Campylobacter spp. in whole fresh chicken collected from all shop types, including major retailers during the first sampling perioda, in relation to retailer.
cfu of Campylobacter spp. per g chicken skin sample <10 10-99 100-1000 > 1000
Retailer nb % (95% CI) n % (95% CI) n % (95% CI) n % (95% CI)
aSamples were collected from August to October 2017 except for a small proportion collected in early November (1 Morrisons, 3 Sainsburys, 2 Tesco and 8 Waitrose) and early December (n = 2 for each of Co-op, Lidl and M&S) to ensure a sufficient sample was tested from all the major retailers. bn = Number of samples cThese shops included smaller retail chains of stores (e.g. Iceland, Budgens etc.) and independent shops but not shops recognised as butchers.
17
The proportion of highly contaminated chickens from amongst the groups of stores recognised as smaller retail shops/butchers was similar with no significant improvement seen when comparing the results from the first sampling period to results for the entire sampling year for these types of shops (Table 1 and Table 2).
Table 2. Numbers of Campylobacter spp. in whole fresh chicken collected from
smaller retail shops from August 2017 to July 2018. cfu of Campylobacter spp. per g chicken skin sample <10 10-99 100-1000 > 1000
Retail store type na % (95% CI) n % (95% CI) n % (95% CI) n % (95% CI) Smaller chains 62 21 (16-26) 90 30 (25-36) 100 33 (28-39) 48 16 (12-21)
an = Number of samples bOthers included farm shops, markets and independent others excluding butchers. Within this category there were, however, 15 chickens from major retailers labelled explicitly as Halal and these were included here as Halal chicken were considered part of the less mainstream market the sample is attempting to represent – and some major retailers do supply to the Halal chicken market.
3.1.2 Numbers of Campylobacter spp. in chicken skin samples in relation to chicken
rearing regime
The rearing regime for chickens examined was recorded, and Table 3 summarises the levels of Campylobacter spp. detected in relation to whether the birds were reared without access to range (termed standard) or as free-range or as organic for all samples tested (Table 3). Fewer samples from chickens reared using free range or organic production methods were examined reflecting their lower market share. This meant that, unless very large differences in contamination rates were present in these chicken types, it would not be possible to ascertain significant differences. Nevertheless, within this dataset, no significant differences in the proportion of highly contaminated chickens between the three types of chickens were found but note the wide 95 % confidence intervals. In the samples collected across an entire year from smaller retail shops there was also no significant differences in the proportion of highly contaminated chickens between the three types of chickens (Table 4).
18
Table 3. Numbers of Campylobacter spp. in whole fresh retail chicken in relation to bird rearing regime (all samples included).
cfu of Campylobacter spp. per g chicken skin sample
Table 4. Numbers of Campylobacter spp. in whole fresh chicken collected from
collected from smaller retail shops from August 2017 to July 2018, in relation to bird
rearing regime.
cfu of Campylobacter spp. per g chicken skin sample <10 10-99 100-1000 >1000
Rearing regime na %
(95% CI) n
% (95% CI)
n %
(95% CI) n
% (95% CI)
Standard 179 26
(23-29) 176
25 (22-29)
236 34
(30-38) 103
15 (12-18)
- of which Halal 23 30
(20-41) 16
21 (12-32)
28 36
(26-48) 10
13 (6-23)
- of which Kosher 6 40
(16-68) 2
13 (2-40)
6 40
(16-68) 1
7 (2-32)
Free Range 28 21
(14-29) 42
32 (24-40)
45 34
(26-43) 18
14 (8-21)
Organic 0 - 0 - 2 - 0 - an = Number of samples
3.1.3 Numbers of Campylobacter spp. in chicken skin samples in relation to chicken
processor approval number.
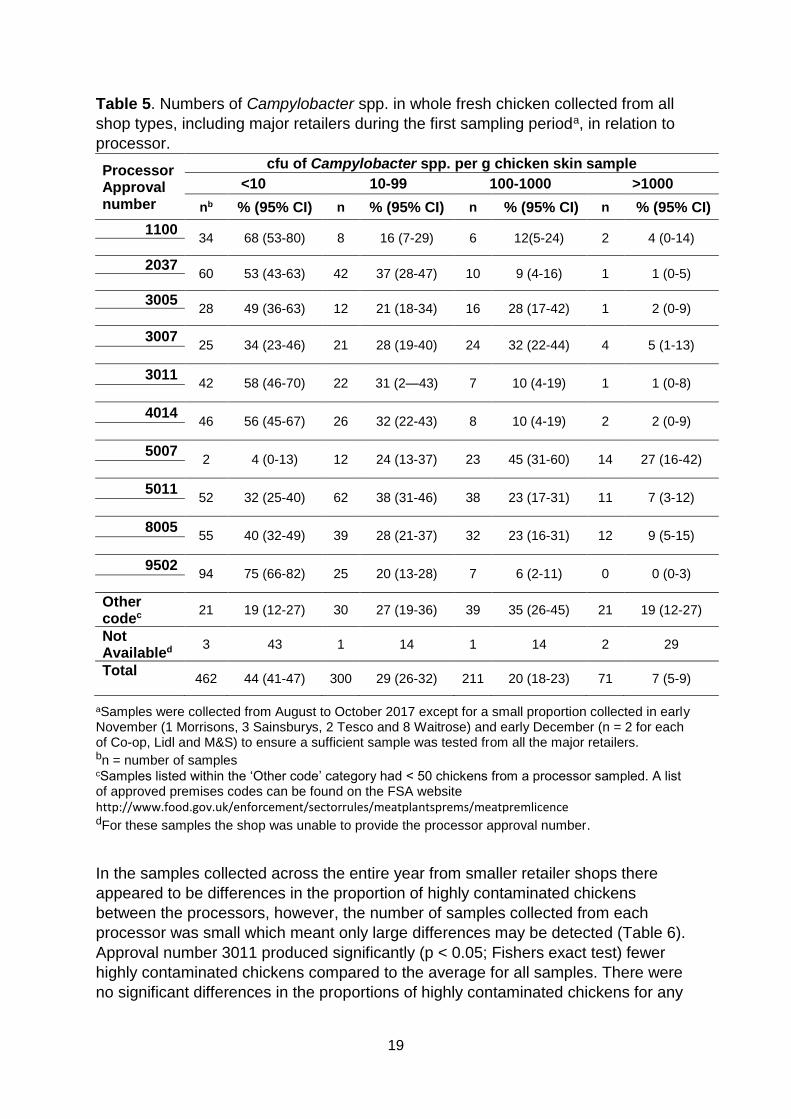
There were significant differences in the distribution of contamination of chickens with Campylobacter spp. between the different processor approval numbers (i.e. slaughter house premises) during the first sampling period where samples from major retailers dominated (Table 5).
The percentage of chickens with >1000 cfu of Campylobacter spp. per g ranged from 1 % for approval number 9502 to 19 % for approval number 5007. Approval number 9502 produced significantly (p < 0.001; Fishers exact test) fewer highly contaminated chickens compared to the average for all approval numbers. The group of ‘other’ production premises (these premises tended to represent smaller premises and fewer than 50 samples were tested from these) and approval number 5007 produced significantly (p < 0.001; Fishers exact test) more highly contaminated chickens compared to the average of all samples tested.
19
Table 5. Numbers of Campylobacter spp. in whole fresh chicken collected from all
shop types, including major retailers during the first sampling perioda, in relation to
processor.
Processor Approval number
cfu of Campylobacter spp. per g chicken skin sample
<10 10-99 100-1000 >1000
nb % (95% CI) n % (95% CI) n % (95% CI) n % (95% CI)
aSamples were collected from August to October 2017 except for a small proportion collected in early November (1 Morrisons, 3 Sainsburys, 2 Tesco and 8 Waitrose) and early December (n = 2 for each of Co-op, Lidl and M&S) to ensure a sufficient sample was tested from all the major retailers. bn = number of samples cSamples listed within the ‘Other code’ category had < 50 chickens from a processor sampled. A list of approved premises codes can be found on the FSA website http://www.food.gov.uk/enforcement/sectorrules/meatplantsprems/meatpremlicence dFor these samples the shop was unable to provide the processor approval number.
In the samples collected across the entire year from smaller retailer shops there
appeared to be differences in the proportion of highly contaminated chickens
between the processors, however, the number of samples collected from each
processor was small which meant only large differences may be detected (Table 6).
Approval number 3011 produced significantly (p < 0.05; Fishers exact test) fewer
highly contaminated chickens compared to the average for all samples. There were
no significant differences in the proportions of highly contaminated chickens for any
of the remaining production premises compared to the average for all production
premises (Fishers exact test).
Table 6. Numbers of Campylobacter spp. in whole fresh chicken collected from smaller retail shops from August 2017 to July 2018, in relation to processor.
Processor Approval number
cfu of Campylobacter spp. per g chicken skin sample
<10 10-99 100-1000 >1000
na % (95% CI) n % (95% CI) n % (95% CI) n % (95% CI)
Other codesb 68 30 (24-37) 49 22 (17-28) 82 36 (30-43) 26 12 (8-16) Not Availablec 24 34 (23-46) 15 21 (12-32) 22 31 (21-43) 10 14 (7-24) Total for all codes 207 25 (22-28) 218 26 (23-29) 283 34 (31-37) 121 15 (12-17)
an = number of sample bSamples listed within the ‘Other code’ category had < 25 chickens from a processor sampled. A list of approved premises codes can be found on the FSA website
http://www.food.gov.uk/enforcement/sectorrules/meatplantsprems/meatpremlicence cFor these samples the shop was unable to provide the processor approval number
3.1.4 Numbers of Campylobacter spp. in whole fresh chicken in relation to sampling
period (in samples collected from smaller retail shop from August 2017 to July 2018).
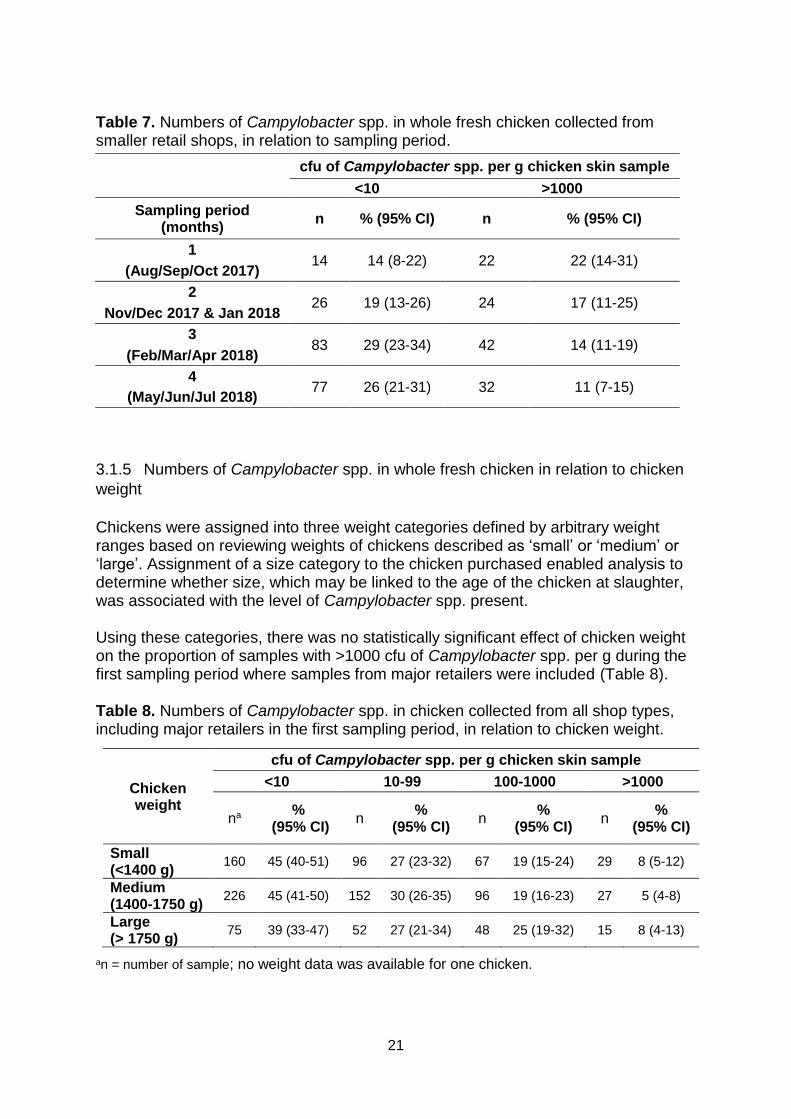
The proportion of samples with > 1000 cfu/g of Campylobacter spp. was not significantly different between the different sampling periods for the samples collected from an entire year from the smaller retail shops (Table 7). The proportion of samples with < 10 cfu/g of Campylobacter spp. was highest in the third sampling period (Table 7).
Table 7. Numbers of Campylobacter spp. in whole fresh chicken collected from smaller retail shops, in relation to sampling period.
cfu of Campylobacter spp. per g chicken skin sample <10 >1000
Sampling period (months)
n % (95% CI) n % (95% CI)
1 14 14 (8-22) 22 22 (14-31)
(Aug/Sep/Oct 2017)
2 26 19 (13-26) 24 17 (11-25)
Nov/Dec 2017 & Jan 2018
3 83 29 (23-34) 42 14 (11-19)
(Feb/Mar/Apr 2018)
4 77 26 (21-31) 32 11 (7-15)
(May/Jun/Jul 2018)
3.1.5 Numbers of Campylobacter spp. in whole fresh chicken in relation to chicken
weight
Chickens were assigned into three weight categories defined by arbitrary weight ranges based on reviewing weights of chickens described as ‘small’ or ‘medium’ or ‘large’. Assignment of a size category to the chicken purchased enabled analysis to determine whether size, which may be linked to the age of the chicken at slaughter, was associated with the level of Campylobacter spp. present. Using these categories, there was no statistically significant effect of chicken weight on the proportion of samples with >1000 cfu of Campylobacter spp. per g during the first sampling period where samples from major retailers were included (Table 8). Table 8. Numbers of Campylobacter spp. in chicken collected from all shop types, including major retailers in the first sampling period, in relation to chicken weight.
Chicken weight
cfu of Campylobacter spp. per g chicken skin sample
an = number of sample; no weight data was available for one chicken.
22
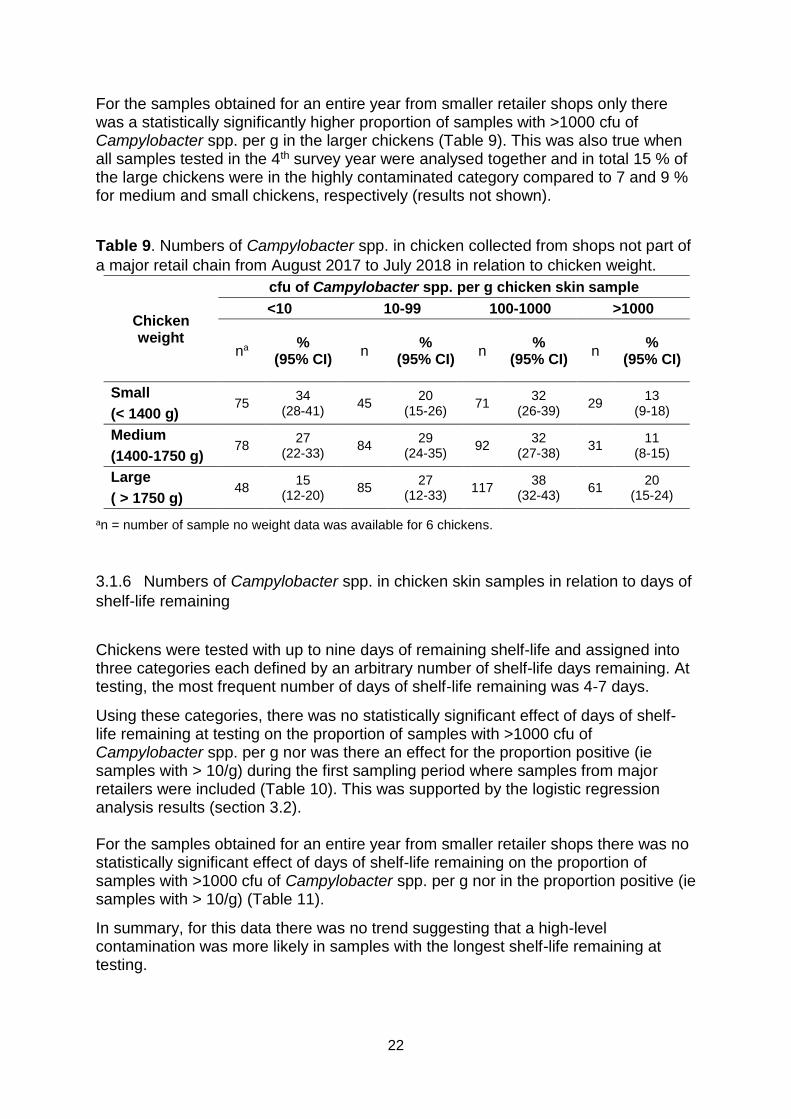
For the samples obtained for an entire year from smaller retailer shops only there was a statistically significantly higher proportion of samples with >1000 cfu of Campylobacter spp. per g in the larger chickens (Table 9). This was also true when all samples tested in the 4th survey year were analysed together and in total 15 % of the large chickens were in the highly contaminated category compared to 7 and 9 % for medium and small chickens, respectively (results not shown).
Table 9. Numbers of Campylobacter spp. in chicken collected from shops not part of
a major retail chain from August 2017 to July 2018 in relation to chicken weight.
Chicken weight
cfu of Campylobacter spp. per g chicken skin sample
<10 10-99 100-1000 >1000
na %
(95% CI) n
% (95% CI)
n %
(95% CI) n
% (95% CI)
Small 75
34 (28-41)
45 20
(15-26) 71
32 (26-39)
29 13
(9-18) (< 1400 g)
Medium 78
27 (22-33)
84 29
(24-35) 92
32 (27-38)
31 11
(8-15) (1400-1750 g)
Large 48
15 (12-20)
85 27
(12-33) 117
38 (32-43)
61 20
(15-24) ( > 1750 g)
an = number of sample no weight data was available for 6 chickens.
3.1.6 Numbers of Campylobacter spp. in chicken skin samples in relation to days of
shelf-life remaining
Chickens were tested with up to nine days of remaining shelf-life and assigned into three categories each defined by an arbitrary number of shelf-life days remaining. At testing, the most frequent number of days of shelf-life remaining was 4-7 days.
Using these categories, there was no statistically significant effect of days of shelf-life remaining at testing on the proportion of samples with >1000 cfu of Campylobacter spp. per g nor was there an effect for the proportion positive (ie samples with > 10/g) during the first sampling period where samples from major retailers were included (Table 10). This was supported by the logistic regression analysis results (section 3.2). For the samples obtained for an entire year from smaller retailer shops there was no statistically significant effect of days of shelf-life remaining on the proportion of samples with >1000 cfu of Campylobacter spp. per g nor in the proportion positive (ie samples with > 10/g) (Table 11).
In summary, for this data there was no trend suggesting that a high-level contamination was more likely in samples with the longest shelf-life remaining at testing.
23
Table 10. Numbers of Campylobacter spp. in chicken collected from all shop types, including major retailers in the first sampling perioda, in relation to days shelf-life remaining.
Remaining shelf-life in daysb
cfu of Campylobacter spp. per g chicken skin sample
<10 10-99 100-1000 >1000
n % (95 % CI) n % (95% CI) n % (95% CI) n % (95% CI)
aSamples were collected from August to October 2017 except for a small proportion collected in early November (1 Morrisons, 3 Sainsburys, 2 Tesco and 8 Waitrose) and early December (n = 2 for each of Co-op, Lidl and M&S) to ensure a sufficient sample was tested from all the major retailers. bThere was no shelf-life date provided for 4 samples.
Table 11. Numbers of Campylobacter spp. in chicken collected from shops not part of a major retail chain from August 2017 to July 2018 in relation to days of remaining shelf-life.
Remaining shelf-life in days
cfu of Campylobacter spp. per g chicken skin sample
<10 10-99 100-1000 >1000
n % (95 % CI) n % (95 % CI) n % (95 % CI) n % (95 % CI)
Whilst the protocol stipulated to test a 10 g neck-skin sample not all chickens had sufficient neck-skin available for 10 g to be tested and were then tested with sample weights from 2 to < 10 g. The average grams of neck-skin in samples did not differ significantly between retailers. While it is possible that the level of cfu of Campylobacter spp. per g skin may be affected by the total weight of neck-skin used, data from the previous survey year (PHE 2016) indicated that while the proportion of neck-skin influenced the contamination rate, it did not confound the association between retailer and the proportion of highly contaminated chickens found. This issue was also addressed further as part of the logistic regression analysis described below (3.2)
24
Some retailers consistently sold chickens packed using a modified atmosphere packaging (MAP) whilst the large majority of chickens obtained from butchers and other non-major retailers were not MAP packed. MAP packing was therefore highly correlated with retailer type. For a proportion of the chickens it proved difficult to ascertain from the packaging whether the chicken was in fact packed using MAP or not, thus making detailed analysis problematic. Campylobacter spp. are microaerophilic and do not tolerate atmospheric oxygen levels as effectively as aerobic organisms and it is possible that higher levels of oxygen could decrease survival (Blankenship & Craven, 1982; Grigoriadis et al., 1997).
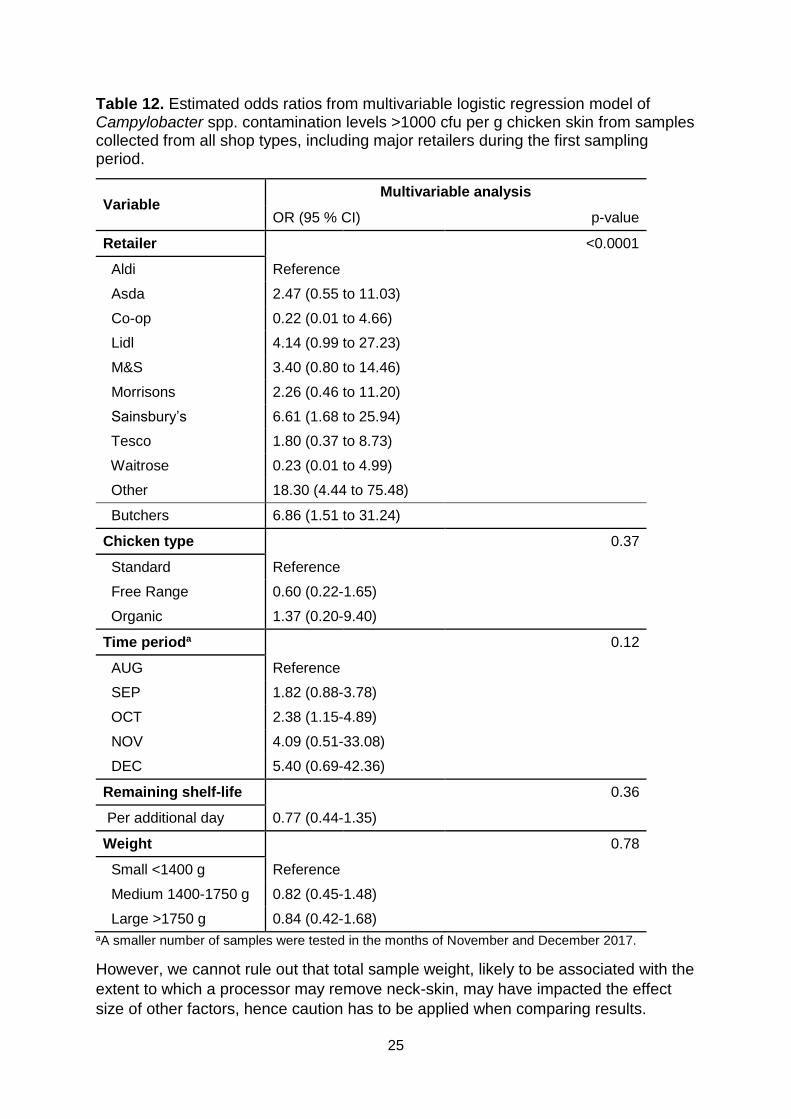
3.2 Logistic regression Analysis of the cfu of Campylobacter per g of chicken skin did not detect noticeable
confounding factors and the multivariable logistic regression model provided very
similar estimates of odds ratios to those obtained when each variable was
considered in isolation in the single variable logistic regression analysis (Table 12).
In the approach used for the regression the same variables were retained as used in
the previous years to make the results comparable over the years.
This indicated that the variation in the percentage of chickens with the highest level
of Campylobacter spp. contamination (over 1000 cfu/g) from the different retailers
could not be explained by chicken type, time period of sampling, days of shelf-life
remaining or chicken weight, and as such is likely to represent genuine variation
between the retailers. The group of smaller retail outlets including independents and
butchers, was significantly different to the “reference” Aldi (selected as reference as
first in alphabet). It was decided that the analysis should be focused around
differences between retailers, in line with the previous study data (FSA 2016).
Due to the relationship between retailers and processors it was not possible to
separate any individual association they may have with high level Campylobacter
spp. contamination. It is likely that the processor has a bearing on contamination rate
and this will be manifested as variations in the contamination rate between retailers.
As retailers may source chickens from multiple processors, it would be difficult for
consumers to make informed choices on the basis of information about the
processor and hence processor was not included in the logistic regression model.
The possible effect of the amount of neck-skin weight in the sample was examined
by including this variable in the logistic regression. It was significant with an
estimated odds ratio of 1.25 (95% CI 1.09 to 1.45) per g (p = 0.001) but this did not
impact on any of the variation between retailer.
Therefore the amount of neck-skin in the sample did not confound the effect of other
factors including retailer. Both present and past data have indicated that the total
weight of the neck-skin sample does not confound other factors (i.e. other factors
remain independently significant).
25
Table 12. Estimated odds ratios from multivariable logistic regression model of Campylobacter spp. contamination levels >1000 cfu per g chicken skin from samples collected from all shop types, including major retailers during the first sampling period.
Variable Multivariable analysis
OR (95 % CI) p-value
Retailer <0.0001
Aldi Reference
Asda 2.47 (0.55 to 11.03)
Co-op 0.22 (0.01 to 4.66)
Lidl 4.14 (0.99 to 27.23)
M&S 3.40 (0.80 to 14.46)
Morrisons 2.26 (0.46 to 11.20)
Sainsbury’s 6.61 (1.68 to 25.94)
Tesco 1.80 (0.37 to 8.73)
Waitrose 0.23 (0.01 to 4.99)
Other 18.30 (4.44 to 75.48)
Butchers 6.86 (1.51 to 31.24)
Chicken type 0.37
Standard Reference
Free Range 0.60 (0.22-1.65)
Organic 1.37 (0.20-9.40)
Time perioda 0.12
AUG Reference
SEP 1.82 (0.88-3.78)
OCT 2.38 (1.15-4.89)
NOV 4.09 (0.51-33.08)
DEC 5.40 (0.69-42.36)
Remaining shelf-life 0.36
Per additional day 0.77 (0.44-1.35)
Weight 0.78
Small <1400 g Reference
Medium 1400-1750 g 0.82 (0.45-1.48)
Large >1750 g 0.84 (0.42-1.68)
aA smaller number of samples were tested in the months of November and December 2017.
However, we cannot rule out that total sample weight, likely to be associated with the
extent to which a processor may remove neck-skin, may have impacted the effect
size of other factors, hence caution has to be applied when comparing results.
26
3.3 Campylobacter species isolated from skin samples of fresh whole UK produced chicken at retail
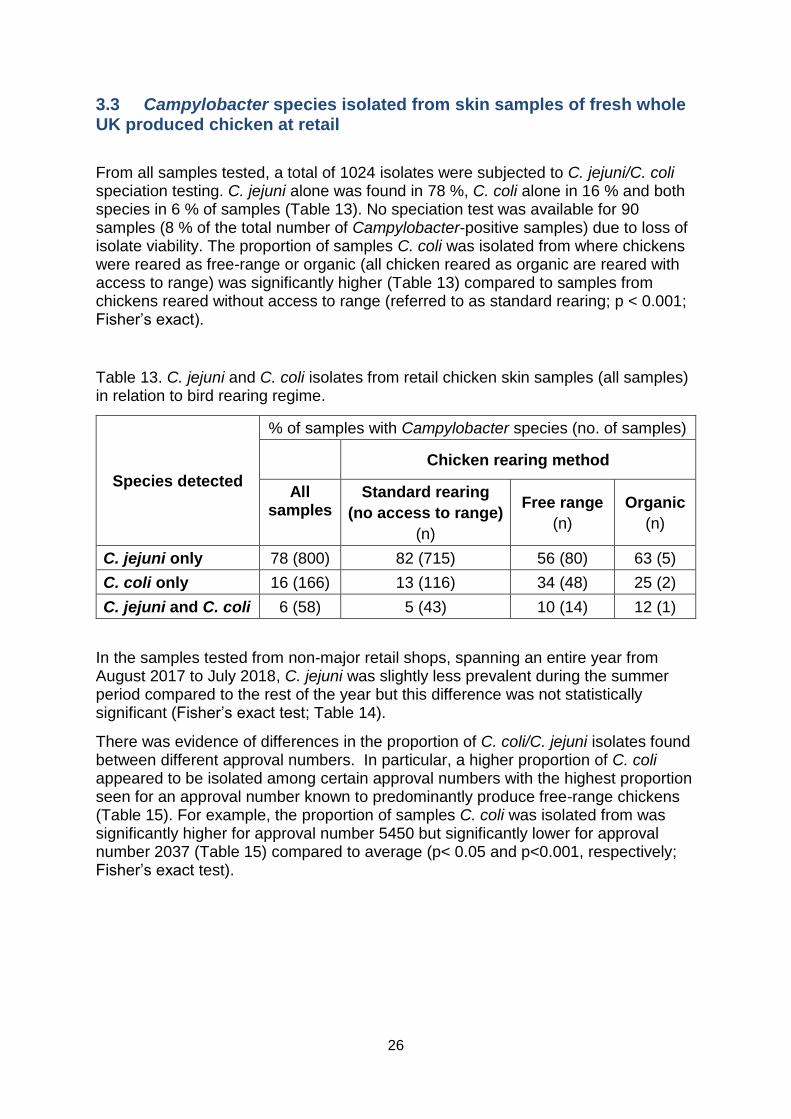
From all samples tested, a total of 1024 isolates were subjected to C. jejuni/C. coli speciation testing. C. jejuni alone was found in 78 %, C. coli alone in 16 % and both species in 6 % of samples (Table 13). No speciation test was available for 90 samples (8 % of the total number of Campylobacter-positive samples) due to loss of isolate viability. The proportion of samples C. coli was isolated from where chickens were reared as free-range or organic (all chicken reared as organic are reared with access to range) was significantly higher (Table 13) compared to samples from chickens reared without access to range (referred to as standard rearing; p < 0.001; Fisher’s exact).
Table 13. C. jejuni and C. coli isolates from retail chicken skin samples (all samples) in relation to bird rearing regime.
Species detected
% of samples with Campylobacter species (no. of samples)
Chicken rearing method
All samples
Standard rearing
(no access to range)
(n)
Free range
(n)
Organic
(n)
C. jejuni only 78 (800) 82 (715) 56 (80) 63 (5)
C. coli only 16 (166) 13 (116) 34 (48) 25 (2)
C. jejuni and C. coli 6 (58) 5 (43) 10 (14) 12 (1)
In the samples tested from non-major retail shops, spanning an entire year from August 2017 to July 2018, C. jejuni was slightly less prevalent during the summer period compared to the rest of the year but this difference was not statistically significant (Fisher’s exact test; Table 14).
There was evidence of differences in the proportion of C. coli/C. jejuni isolates found between different approval numbers. In particular, a higher proportion of C. coli appeared to be isolated among certain approval numbers with the highest proportion seen for an approval number known to predominantly produce free-range chickens (Table 15). For example, the proportion of samples C. coli was isolated from was significantly higher for approval number 5450 but significantly lower for approval number 2037 (Table 15) compared to average (p< 0.05 and p<0.001, respectively; Fisher’s exact test).
27
Table 14. Distribution of C. jejuni and C. coli isolates from chicken skin samples collected from smaller chains and others in relation to season.
% of samples with Campylobacter species (no. of samples)
Species detected
Season
Summer
(August 2017 and
June & July 2018)
(n = 133)
Autumn, Winter and Spring (September-December 2017
& January-May 2018)
(n = 441)
C. jejuni only 66 (88) 72 (316)
C. coli only 24 (32) 21 (92)
C. jejuni and C. coli 10 (13) 7 (33)
Table 15. C. jejuni and C. coli isolates from retail chicken (all samples) in relation to processor.
Processor Approval Number
C. jejuni only C. coli only C. jejuni and C. coli
No. of samples
No. of samples
No. of samples
% % %
1100 94 16 6 1 0 0
2037 98 45 0 0 2 1
3005 93 25 4 1 4 1
3007 90 46 8 4 2 1
3011 95 36 5 2 0 0
4014 94 29 6 2 0 0
5003 69 29 19 8 12 5
5007 71 154 19 42 9 20
5008 75 12 13 2 13 2
5011 83 84 14 14 3 3
5464 85 33 10 4 5 2
5450 59 10 35 6 6 1
8005 88 65 8 6 4 3
9502 90 26 7 2 3 1
9509 84 21 16 4 0 0
9554 68 13 26 5 5 1
Other code# 64 121 29 54 7 13
Not Available§ 73 35 19 9 8 4
All processor approval numbers
78 800 16 166 6 58
§Shop was unable to provide processor Approval number. #Samples listed within the ‘Other code’ category had < 15 isolates from the processor sampled within the study. A list of approved premises codes can be found on the FSA website http://www.food.gov.uk/enforcement/sectorrules/meatplantsprems/meatpremlicence
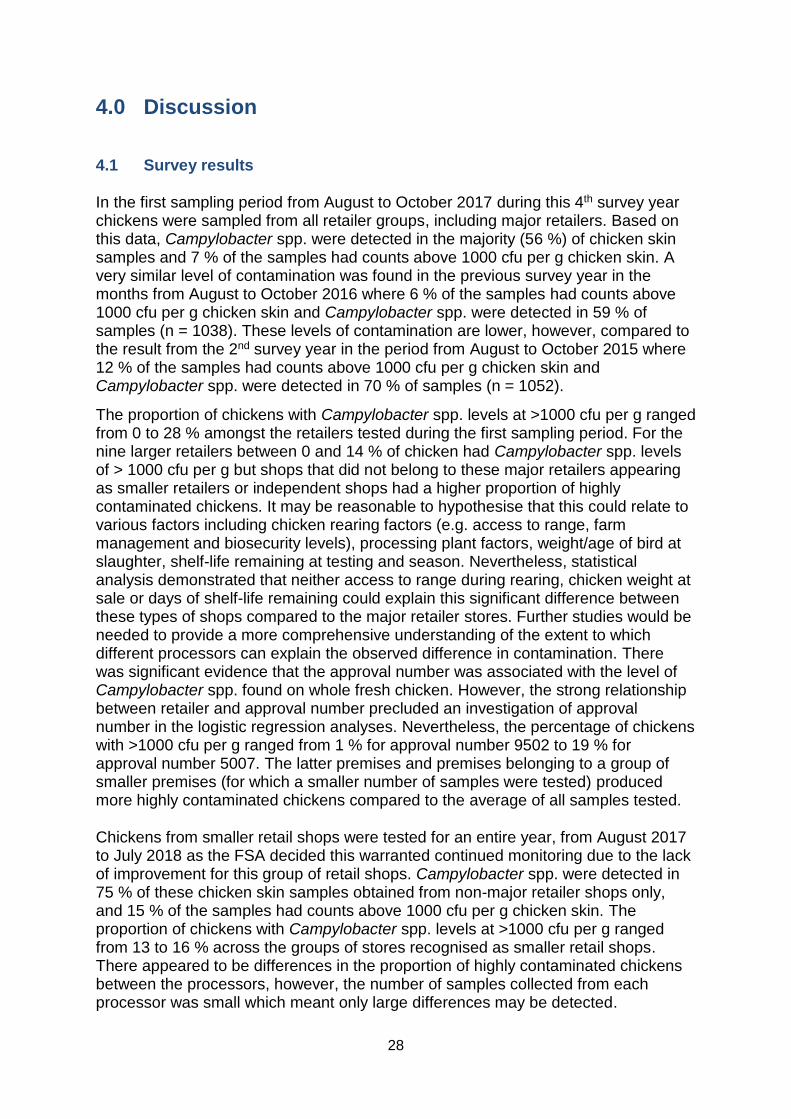
In the first sampling period from August to October 2017 during this 4th survey year chickens were sampled from all retailer groups, including major retailers. Based on this data, Campylobacter spp. were detected in the majority (56 %) of chicken skin samples and 7 % of the samples had counts above 1000 cfu per g chicken skin. A very similar level of contamination was found in the previous survey year in the months from August to October 2016 where 6 % of the samples had counts above 1000 cfu per g chicken skin and Campylobacter spp. were detected in 59 % of samples (n = 1038). These levels of contamination are lower, however, compared to the result from the 2nd survey year in the period from August to October 2015 where 12 % of the samples had counts above 1000 cfu per g chicken skin and Campylobacter spp. were detected in 70 % of samples (n = 1052).
The proportion of chickens with Campylobacter spp. levels at >1000 cfu per g ranged from 0 to 28 % amongst the retailers tested during the first sampling period. For the nine larger retailers between 0 and 14 % of chicken had Campylobacter spp. levels of > 1000 cfu per g but shops that did not belong to these major retailers appearing as smaller retailers or independent shops had a higher proportion of highly contaminated chickens. It may be reasonable to hypothesise that this could relate to various factors including chicken rearing factors (e.g. access to range, farm management and biosecurity levels), processing plant factors, weight/age of bird at slaughter, shelf-life remaining at testing and season. Nevertheless, statistical analysis demonstrated that neither access to range during rearing, chicken weight at sale or days of shelf-life remaining could explain this significant difference between these types of shops compared to the major retailer stores. Further studies would be needed to provide a more comprehensive understanding of the extent to which different processors can explain the observed difference in contamination. There was significant evidence that the approval number was associated with the level of Campylobacter spp. found on whole fresh chicken. However, the strong relationship between retailer and approval number precluded an investigation of approval number in the logistic regression analyses. Nevertheless, the percentage of chickens with >1000 cfu per g ranged from 1 % for approval number 9502 to 19 % for approval number 5007. The latter premises and premises belonging to a group of smaller premises (for which a smaller number of samples were tested) produced more highly contaminated chickens compared to the average of all samples tested.
Chickens from smaller retail shops were tested for an entire year, from August 2017 to July 2018 as the FSA decided this warranted continued monitoring due to the lack of improvement for this group of retail shops. Campylobacter spp. were detected in 75 % of these chicken skin samples obtained from non-major retailer shops only, and 15 % of the samples had counts above 1000 cfu per g chicken skin. The proportion of chickens with Campylobacter spp. levels at >1000 cfu per g ranged from 13 to 16 % across the groups of stores recognised as smaller retail shops. There appeared to be differences in the proportion of highly contaminated chickens between the processors, however, the number of samples collected from each processor was small which meant only large differences may be detected.
29
Whilst there was no evidence that free-range or organic chickens were more highly contaminated than standard birds, this finding should be treated with caution as low numbers of free-range and organic chickens were examined due to their low overall market share. Their corresponding confidence intervals were wide and would therefore only be able to verify very large differences. Nevertheless, a very similar finding was made in the second and third survey years (PHE 2017).
From the majority of chicken skin samples (78 %) C. jejuni (only) was isolated while C. coli (only), was identified in 16 % of samples. Compared to previous survey years the proportion of C. coli was higher and this was probably related to a larger proportion of chickens obtained from smaller premises. The proportion of samples C. coli was isolated from where chickens were reared as free-range or organic (all chicken reared as organic are reared with access to range) was significantly higher compared to samples from chickens reared without access to range.
In the previous survey years slightly lower proportions of C. jejuni were found (PHE 2015, PHE 2016). In an earlier FSA commissioned survey carried out in 2007 and 2008 (FSA 2009), the proportion of chickens (43 %) from which C. jejuni was isolated was considerably lower than in the current study. It is possible that this finding may relate to differences in the method of detection used. While this survey applied direct enumeration only, the 2007/2008 survey isolates were obtained using an enrichment method. In the CLASSP survey where enrichment culture was used, 62 % were C. jejuni, 32 % were C. coli and both species were detected in 6 % (CLASSP Project Team 2010). In the 2001 retail survey (FSA 2003), 25 % of isolates were C. coli only using an enrichment method. The proportion of human C. jejuni and C. coli strains in UK has been reported as approximately 90 % and 10 %, respectively (CLASSP Project Team 2010).
Recent slaughter house survey data for Campylobacter spp. on chicken carcasses tested after slaughter (and just before being put on retail sale) undertaken by the Animal and Plant Health Agency found a decrease in the proportion of highly contaminated carcases from 28.5 % in 2012-15 to 25.1 % in 2016-17 (FSA 2015c). While the levels of campylobacters on chickens just after slaughter are expected in general to be higher compared to what they are subsequently at retail, it is not clear why the decline for retail chicken appears to be so much more pronounced. Further analysis would be needed to ascertain if differences in sample weight or what proportion of chicken types were included in the testing e.g. in terms of weight could explain any disproportionate trends unlikely to be due the natural decline of viable campylobacters as expected during shelf-life.
In summary, the proportion of chicken at retail sale in the UK that are contaminated with a high level of Campylobacter spp. has decreased. However, the proportion of highly contaminated chickens from smaller retail shops remains high and suggests that more needs to be done to achieve better control of Campylobacter spp. in this part of the sector. Overall, however, the data from this and the previous survey years has demonstrated a significant decline in the level of highly contaminated fresh whole UK retail chicken. The FSA has indicated that the average retail proxy for the proportion of highly contaminated retail chickens should be less than 7 % and continued monitoring can demonstrate that this decline is sustained.
30
4.2 Human Campylobacter spp. infections in the UK
The EFSA Scientific Opinion published in 2011 (EFSA 2011) suggested that reducing the numbers of Campylobacter spp. on carcases by more than 99 % would reduce the public health risk by more than 90 %.
The reporting rate for Campylobacter spp. decreased in the UK from 109.2 per 100,000 population in 2014 to 89.9 per 100,000 in 2016. The rate of reported Campylobacter infections in England as at the lowest rate in 2016 since 2006, and remains below the rate observed in Wales and Scotland (Table 15). However, the rate of reported Campylobacter infections in England and Wales has increased again in 2017 and 2018. The reasons for this increase remains unclear but may relate to changes in the relative importance of foodborne compared to non-foodborne transmission routes, an increased transmission from non-chicken sources and /or other factors including changes in population immunity and the proportion of cases that maybe travel-associated.
Northern Ireland continues to report rates lower than the rest of the UK while Wales has continued to report the highest rates of infection except for 2018 (Table 16). The rate of reported Campylobacter infections in both Scotland and Wales also declined from 2014 to 2016.
Table 16. Number and rate* of reported Campylobacter spp. infections in the United Kingdom and by country per 100,000 population, 2006-2018.
*Rates were calculated based on the ONS 2016 mid-year population estimates; data for
2018 are provisional and not available for some nations yet.
31
4.3 Conclusions
• The proportion of fresh whole chicken on retail sale in the UK that are contaminated with the highest level of Campylobacter spp. has on average, decreased from 2014, but for chickens from smaller retailer shops no decrease has been observed.
• Continued monitoring will be required to demonstrate a sustained decline.
32
5.0 References
Allen, V.M., Bull, S.A., Corry, J.E., Domingue, G., Jørgensen, F., Frost, J.A., Whyte, R., Gonzalez, A., Elviss, N. and Humphrey, T.J. (2007). Campylobacter spp. contamination of chicken carcasses during processing in relation to flock colonisation. Int. J. Food Microbiol. 113:54-61. Anonymous. (2006) International Organisation for Standardisation ISO/TS 10272-2. Microbiology of food and animal feeding stuffs – horizontal method for the detection and enumeration of Campylobacter – Part 2: colony count technique. International Organisation for Standardisation, Geneva. Best EL, Powell EJ, Swift C, Grant KA, Frost JA. (2003). Applicability of a rapid duplex real-time PCR assay for speciation of Campylobacter jejuni and Campylobacter coli directly from culture plates. FEMS Microbiol Lett. 229:237-241. Blankenship, L.C., Craven, S.E. (1982) Campylobacter jejuni survival in chicken meat as a function of temperature. Appl Environ Microbiol. 44:88-92. Borck, B., H. Stryhn, A. K. Ersboll, and K. Pedersen. (2002). Thermophilic Campylobacter spp. in turkey samples: evaluation of two automated enzyme immunoassays and conventional microbiological techniques. J. Appl. Microbiol. 92:574-582. Bull, S.A., Allen, V.M., Domingue, G., Jørgensen, F., Frost, J.A., Ure, R., Whyte, R., Tinker, D., Corry, J.E., Gillard-King, J. and Humphrey, T.J. (2006). Sources of Campylobacter spp. colonizing housed broiler flocks during rearing. Appl Environ Microbiol. 72:645-652. CLASSP Project Team (2010) LACORS/HPA Coordinated Local Authority Sentinel Surveillance of Pathogens (CLASSP) Final Report. Danis, K., Di Renzi, M., O'Neill, W., Smyth, B., McKeown, P., Foley, B., Tohani, V. and Devine, M. (2009) Risk factors for sporadic Campylobacter infection: an all-Ireland case-control study. Euro Surveill. 14. pii: 19123. Davis, M.A. and Conner, D.E. (2007) Survival of Campylobacter jejuni on Poultry Skin and Meat at Varying Temperatures. Poultry Science 86:765-767. Dufrenne, J., Ritmeester, W., Delfgou-van Asch, E., van Leusden, F. and de Jonge, R. (2001). Quantification of the contamination of chicken and chicken products in The Netherlands with Salmonella and Campylobacter. J. Food Prot. 64, 538-541 European Food Safety Authority (EFSA). (2009). Scientific Opinion on Quantification of the risk posed by broiler meat to human campylobacteriosis in the EU (adopted 9 December 2009) http://www.efsa.europa.eu/en/scdocs/scdoc/1437.htm European Food Safety Authority (EFSA). (2011). Scientific Opinion on Campylobacter in broiler meat production: control options and performance objectives and/or targets at different stages of the food chain. EFSA Journal 9:2105.
European Food Safety Authority (EFSA). (2010a). Analysis of the baseline survey on the prevalence of Campylobacter in broiler batches and of Campylobacter and Salmonella on broiler carcasses in the EU, 2008; Part A: Campylobacter and Salmonella prevalence estimates. EFSA J. 8:1503. European Food Safety Authority (EFSA). (2010b). Analysis of the baseline survey on the prevalence of Campylobacter in broiler batches and of Campylobacter and Salmonella on broiler carcasses, in the EU, 2008; Part B: Analysis of factors associated with Campylobacter colonisation of broiler batches and with Campylobacter contamination of broiler carcasses; and investigation of the culture method diagnostic characteristics used to analyse broiler carcass samples. EFSA J. 8:1522. Figueroa, G., Troncoso, M., López, C., Rivas, P. and Toro, M. (2009). Occurrence and enumeration of Campylobacter spp. during the processing of Chilean broilers. BMC Microbiol. 9:94. Food Standards Agency (2003). UK-wide Survey of Salmonella and Campylobacter Contamination of Fresh and Frozen Chicken on Retail Sale. Available at: https://webarchive.nationalarchives.gov.uk/20180411152125tf_/https:/www.food.gov.uk/multimedia/pdfs/campsalmsurvey.pdf Food Standards Agency (2009). FSA report for the UK survey of Campylobacter and Salmonella contamination of fresh chicken at retail sale. FSA Project B18025. Available at: http://webarchive.nationalarchives.gov.uk/20131206121901tf_/http://food.gov.uk/multimedia/pdfs/fsis0409.pdf Food Standards Agency (2010). The joint government and industry target to reduce Campylobacter in UK produced chickens by 2015. Available at: http://webarchive.nationalarchives.gov.uk/20180411152125tf_/https://www.food.gov.uk/sites/default/files/multimedia/pdfs/campytarget.pdf Food Standards Agency (2013) Open Board – 11 September 2013 A refreshed strategy to reduce campylobacteriosis from poultry. Available at: http://webarchive.nationalarchives.gov.uk/20150809120004/http:/www.food.gov.uk/sites/default/files/multimedia/pdfs/board/board-papers-2013/fsa-130904.pdf Food Standards Agency (2015a). ACT: Acting on Campylobacter Together Available at: http://webarchive.nationalarchives.gov.uk/20160407013005/https://www.food.gov.uk/news-updates/campaigns/campylobacter Food Standards Agency (2015b). FSA Board meeting 15 July 2015: Update on the Campylobacter Campaign. Available at: http://webarchive.nationalarchives.gov.uk/20160407234941/https:/www.food.gov.uk/sites/default/files/fsa150705.pdf
Food Standards Agency (2015c). Campylobacter survey: cumulative results from the full 12 months (Q1 - Q4). Available at: http://webarchive.nationalarchives.gov.uk/20160407023310/http://www.food.gov.uk/science/microbiology/campylobacterevidenceprogramme/retail-survey#toc-1 Food Standards Agency (2016). A UK wide microbiological survey of Campylobacter contamination in fresh whole chilled chickens at retail sale (Year 3/ 4) Available at: https://www.food.gov.uk/sites/default/files/media/document/retail_survey_protocol_year3_0.pdf. Food Standards Scotland (FSS) (2015) Board Meeting 15 June 2015 FSS 15/06/04 The Role of Food Standards Scotland in reducing the public health risks associated with Campylobacter. Available at: https://www.foodstandards.gov.scot/downloads/Board_meeting_-_2015_June_15_-_Campylobacter.pdf Friedman, C.R., Hoekstra, R.M., Samuel, M., Marcus, R., Bender, J., Shiferaw, B., Reddy, S., Ahuja, S.D., Helfrick, D.L., Hardnett, F., Carter, M., Anderson, B. and Tauxe, R.V.; Emerging Infections Program FoodNet Working Group. (2004). Risk factors for sporadic Campylobacter infection in the United States: A case-control study in FoodNet sites. Clin. Infect. Dis. 38 Suppl 3:S285-96. Fukushima H, Katsube K, Hata Y, Kishi R. and Shimada S. (2007). Rapid Separation and Concentration of Food-borne Pathogens in Food Samples Prior to Quantification by Viable Count and Real-time PCR. Appl. Environ. Microbiol. 73:92-100. Grigoriadis, S.G, Koidis, P.A., Vareltzis, K.P. and Batzios, C.A. (1997) Survival of Campylobacter jejuni Inoculated in Fresh and Frozen Beef Hamburgers stored under Various Temperatures and Atmospheres Journal of Food Protection 8: 883-1012/ 903-907 Habib, I., Sampers, I., Uyttendaele, M., Berkvens, D. and De Zutter, L. (2008). Baseline data from a Belgium-wide survey of Campylobacter species contamination in chicken meat preparations and considerations for a reliable monitoring program. Appl. Environ. Microbiol. 74:5483-5489. Hong, Y., Berrang, M. E., Liu T., Hofacre, C.L., Sanchez, S., Wang, L. and Maurer, J.J. (2003). Rapid detection of Campylobacter coli, C. jejuni, and Salmonella enterica on poultry carcasses by using PCR-enzyme-linked immunosorbent assay. Appl Environ Microbiol. 69:3492-3499. Hutchison, M. L., Walters, L. D., Allen, V. M., Mead, G. C. and Howell, M. (2006). Measurement of Campylobacter numbers on carcasses in British poultry slaughterhouses. J. Food Prot 69:421-424.
Jasson, V., Sampers, I., Botteldoorn, N., López-Gálvez, F., Baert, L., Denayer, S., Rajkovic, A., Habib, I., De Zutter, L., Debevere, J. and Uyttendaele, M. (2009). Characterization of Escherichia coli from raw poultry in Belgium and impact on the
detection of Campylobacter jejuni using Bolton broth. Int J Food Microbiol. 135:248-53. Jorgensen, F., Bailey, R., Williams, S., Henderson, P., Wareing, D.R., Bolton ,F.J., Frost, J.A., Ward, L. and Humphrey, T.J. (2002). Prevalence and numbers of Salmonella and Campylobacter spp. on raw, whole chickens in relation to sampling methods. Int. J. Food Microbiol. 76:151-64. Meldrum, R. J., I. D. Tucker., R. M. and Smith, C. (2005). Three-year surveillance programme in Wales and Northern Ireland examining the prevalence of Campylobacter and Salmonella in retail raw chicken. J Food Prot. 68:1447-1449.
Melero, B., Cocolin L., Rantsiou K., Jaime I. and Rovira J. (2011). Comparison between conventional and qPCR methods for enumerating Campylobacter jejuni in a poultry processing plant. Food Microbiol. 28:1353-1358. Mullner, P., Jones, G., Noble, A., Spencer, S.E., Hathaway, S. and French, N.P. (2009). Source Attribution of Food-borne Zoonoses in New Zealand; a modified Hald Model. Risk Anal. 29:970-984. Oyarzabal, O. A., Macklin, K. S., Barbaree, J. M. and Miller, R.S. (2005). Evaluation of agar plates for direct enumeration of Campylobacter spp. from poultry carcass rinses. Appl. Environ. Microbiol. 71:3351-3354. Public Health England (2015). A Microbiological survey of Campylobacter contamination in fresh whole UK produced chilled chickens at retail sale (2014-15). Available at: https://www.food.gov.uk/sites/default/files/campylobacter-retail-survey-final-report.pdf. Public Health England (2017). A microbiological survey of Campylobacter contamination in fresh whole UK-produced chilled chickens at retail sale. Year 2 Report. FSA Project FS102121. Available at: https://www.food.gov.uk/sites/default/files/media/document/fs102121y2report.pdf Public Health England (2018). A microbiological survey of Campylobacter contamination in fresh whole UK-produced chilled chickens at retail sale. Year 3 Report. FSA Project FS102121. Available at: https://www.food.gov.uk/sites/default/files/media/document/campylobacter-contamination-in-fresh-whole-uk-produced-chilled-chickens-at-retail-sale-year-3-2016-2017_0.pdf Purnell, G., K. Mattick, and T. Humphrey. (2004). The use of “hot wash” treatments to reduce the number of pathogenic and spoilage bacteria on raw retail poultry. J. Food Eng. 62:29-36 Reich F and Atanassova V. et al. (2008). Effects of Campylobacter numbers in caeca on the contamination of broilers carcasses with Campylobacter. International Journal of Food Microbiology. 127:116-120.
Rosenquist, H., Nielsen, N. L., Sommer, H. M., Norrung, B. and Christensen, B. B. (2003). Quantitative risk assessment of human campylobacteriosis associated with thermophilic Campylobacter species in chickens. Int. J. Food Microbiol. 83:87-103. Int J Food Microbiol. 2007 Sep 15;118(2):201-13. Epub 2007 Aug 1. Rosenquist, H., Bengtsson A. and Hansen, T.B. (2007) A collaborative study on a Nordic standard protocol for detection and enumeration of thermotolerant Campylobacter in food (NMKL 119, 3. Ed., 2007). Sampers, I., Habib, I., Berkvens, D., Dumoulin, A., Zutter, L.D. and Uyttendaele, M. (2008). Processing Practices Contribute to Campylobacter Contamination in Belgian Chicken Meat Preparation. Int. J. Food Microbiol. 128:297-303. Scherer, K., Bartelt, E., Sommerfeld, C. and Hildebrandt, G. (2006). Comparison of different sampling techniques and enumeration methods for the isolation and quantification of Campylobacter spp. in raw retail chicken legs. Int J Food Microbiol. 108:115-119. Sheppard S.K., Dallas J.F., Strachan N.J.C., MacRae M., McCarthy N.D., Wilson D.J., Gormley F.J., Falush D., Ogden ID, Maiden MCJ and K.J. Forbes (2009). Campylobacter genotyping to determine the source of human infection. Clin. Infec. Dis. 48:1072-1078. Strachan N.J.C. and Forbes K.J. (2010). The growing UK epidemic of human campylobacteriosis. Lancet 376:665–667. Tam, C.C., Higgins, C.D., Neal, K.R., Rodrigues, L.C., Millership, S.E., O’Brien, S.J. (2009). Campylobacter Case Control Study Group. Emerg. Infect. Dis. 15:1402 Tam CC, Rodrigues LC, Viviani L, Dodds JP, Evans MR, Hunter PR, Gray JJ, Letley LH, Rait G, Tompkins DS and O'Brien SJ (2012). Longitudinal study of infectious intestinal disease in the UK (IID2 study): incidence in the community and presenting to general practice. Gut 61:69-77. Wolffs, P., Norling, B., Hoorfar, J., Griffiths, M. and Radstrom, P. (2005). Quantification of Campylobacter spp. In chicken rinse samples by using flotation prior to real-time PCR. Appl. Environ. Microbiol. 71:5759-5764.
37
6.0 Appendices 6.1 Appendix I Survey protocol
6.2 Appendix II Survey year 4 data
6.3 Appendix III Table 1a
Table 1a. Numbers of Campylobacter spp. in whole fresh chicken collected from all shop types, including major retailers during August to October 2017, in relation to retailer.
cfu of Campylobacter spp. per g chicken skin sample <10 10-99 100-1000 > 1000
Retailer n % (95% CI) n % (95% CI) n % (95% CI) n % (95% CI)