2017 Media Consumption Study 1 Arrows indicate significantly higher than comparison group at 95% confidence interval Can cable survive the threat of streaming services? 2017 MEDIA CONSUMPTION STUDY
Transcript
2017 Media Consumption Study 1Arrows indicate significantly higher than comparison group at 95% confidence interval
Can cable survive the threat of streaming
services?2017 MEDIA CONSUMPTION STUDY
2017 Media Consumption Study 2Arrows indicate significantly higher than comparison group at 95% confidence interval
Have cable in Household (%)
Had a cable subscription? Among those who do not currently subscribe to cable
Despite the fact that a large share of Americans (61%) still have cable in their households, there has been a steady decline
in subscriptions over the past several years. Cord cutting has reached a record pace. Over the last five years, nearly 8 million
US households have abandoned traditional pay TV or eschewed signing up entirely, according to Wall Street research firm,
MoffettNathanson.1 At this point, 8% of current cable subscribers are planning to cut the cord in the next year.2 This trend is further
exacerbated by the fact that millennials are subscribing to cable at lower rates, compared to previous generations. Currently, only
57% of millennials say they have cable in their households and of those who do not, more than a third (34%) said they never had it.
Unsurprisingly, wealthier households have higher rates of cable subscriptions. Also, consumers from wealthier households who do
not currently have cable, are more likely to have cut the cord.
Can cable survive the threat of streaming services?
1 WSJ. “As Streaming Services Amp Up, Not all TV Channels Make the Cut”, May 14, 2017 https://www.wsj.com/articles/as-streaming-services-amp-up-not-all-tv-channels-make-the-cut-14947668012 Fluent, “Marketing to the Heartland: Media Consumption Trends.” 2017 Download report here
Millennial (18-34)
HHI Over 50K
Total
Have cable in Household (%)
HHI Over 50KHHI Under 50KHHI Under 50K
Non-Millennial (35+)
Had a cable subscription? Among those who do not currently subscribe to cable
Millennial (18-34)
Total Non-Millennial (35+)
I never had cable
I stopped subscribing to cable
I never had cable
I stopped subscribing to cable
61% 57%
57%
62%
65%
27%
30%
34%
23%
25%
73%
70%
66%
77%
75%
2017 Media Consumption Study 3Arrows indicate significantly higher than comparison group at 95% confidence interval
Video Sources
Overall, access to video streaming services in the US has surpassed cable subscriptions. This is especially true for the millennial
audience. More than 3 out of 4 millennials have access to some form of streaming service and are more likely to subscribe to Netflix
than they are to have cable in their household. Hulu and YouTube Red are also significantly more popular with younger viewers.
61%
67%
48%
16%
16%
11%
10%
6%
13%
4%
57%
77%
61%
16%
22%
17%
12%
6%
13%
5%
62%
65%
45%
16%
14%
9%
9%
6%
13%
4%
Have Cable in Household (%)
Have access to/watch any streaming services (Net)
Netflix
Amazon Prime Video
Hulu
YouTube Red
HBO Go
Kodi
Sling TV
Other
Total US
Millennials (18-34)
Non-Millennials (35+)
2017 Media Consumption Study 4Arrows indicate significantly higher than comparison group at 95% confidence interval
Viewing Behaviors Among Those Who Have Cable in Household
Paying for Subscription Services
Video streaming is not always a replacement for cable–it is a supplement. Nearly 3 in 4 (72%) Americans who have cable also have
access to/watch a video streaming service, and half of consumers who have cable also have access to/watch video on Netflix.
However, having access to a streaming service doesn’t necessarily mean subscribing. A quarter (25%) of cable owners who watch
streaming video do not pay for the service. Instead, they share passwords with friends and family.
While the majority of Americans (67%) have access to/watch at least one video streaming service, many take advantage of the
ability to share passwords with friends and family. This is especially true for millennials: 60% of younger viewers share streaming
service passwords.
Have access to/watch any
streaming services
Have access to/watch
Netflix
Do not pay for streaming
(share passwords only)
Share passwords (NET)
Share passwords only
Pay
Both (pay for some streaming services, share
passwords for others)
72%
51%
25%
Total US
Millennials (18-34)
Non-Millennials (35+) 51%
25%
49%
26%
60%
29%
40%
31%
48%
23%
52%
25%
2017 Media Consumption Study 5Arrows indicate significantly higher than comparison group at 95% confidence interval
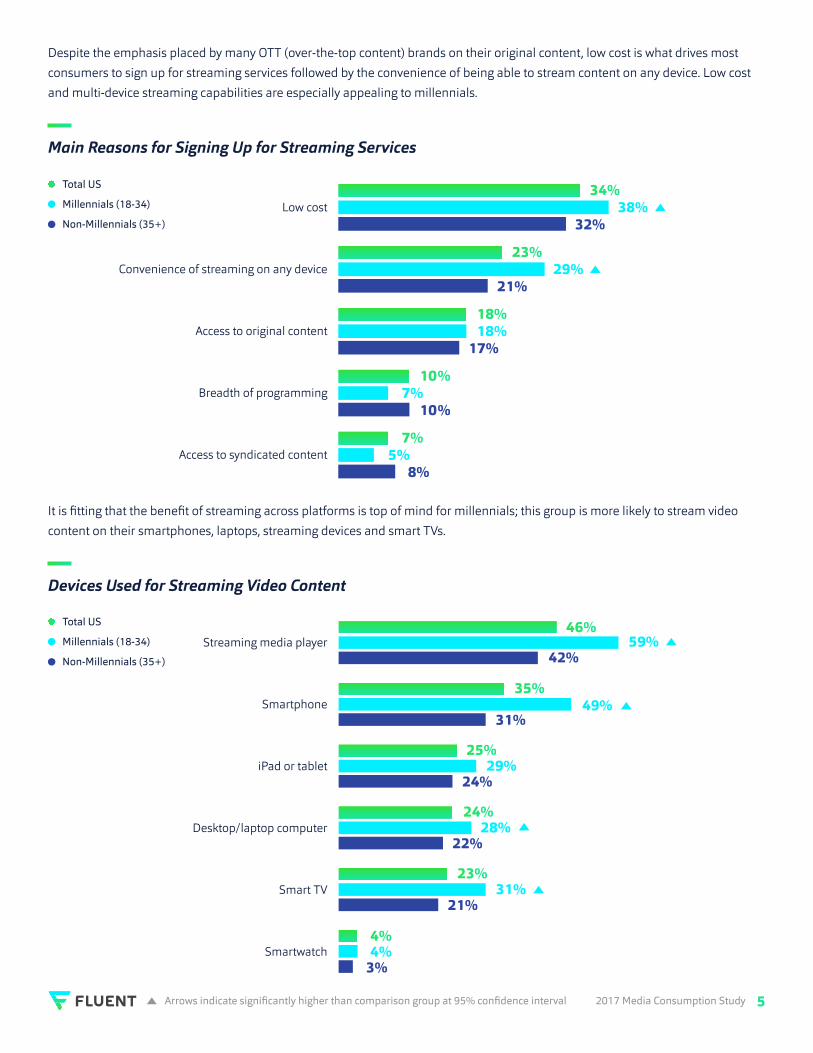
Main Reasons for Signing Up for Streaming Services
Devices Used for Streaming Video Content
Despite the emphasis placed by many OTT (over-the-top content) brands on their original content, low cost is what drives most
consumers to sign up for streaming services followed by the convenience of being able to stream content on any device. Low cost
and multi-device streaming capabilities are especially appealing to millennials.
It is fitting that the benefit of streaming across platforms is top of mind for millennials; this group is more likely to stream video
content on their smartphones, laptops, streaming devices and smart TVs.
Low cost
Convenience of streaming on any device
Access to original content
Breadth of programming
Access to syndicated content
Streaming media player
Smartphone
iPad or tablet
Desktop/laptop computer
Smart TV
Smartwatch
Total US
Millennials (18-34)
Non-Millennials (35+)
Total US
Millennials (18-34)
Non-Millennials (35+)
34%
23%
18%
46%
35%
25%
24%
23%
4%
10%
7%
38%
29%
18%
59%
49%
29%
28%
31%
4%
7%
5%
32%
21%
17%
42%
31%
24%
22%
21%
3%
10%
8%
2017 Media Consumption Study 6Arrows indicate significantly higher than comparison group at 95% confidence interval
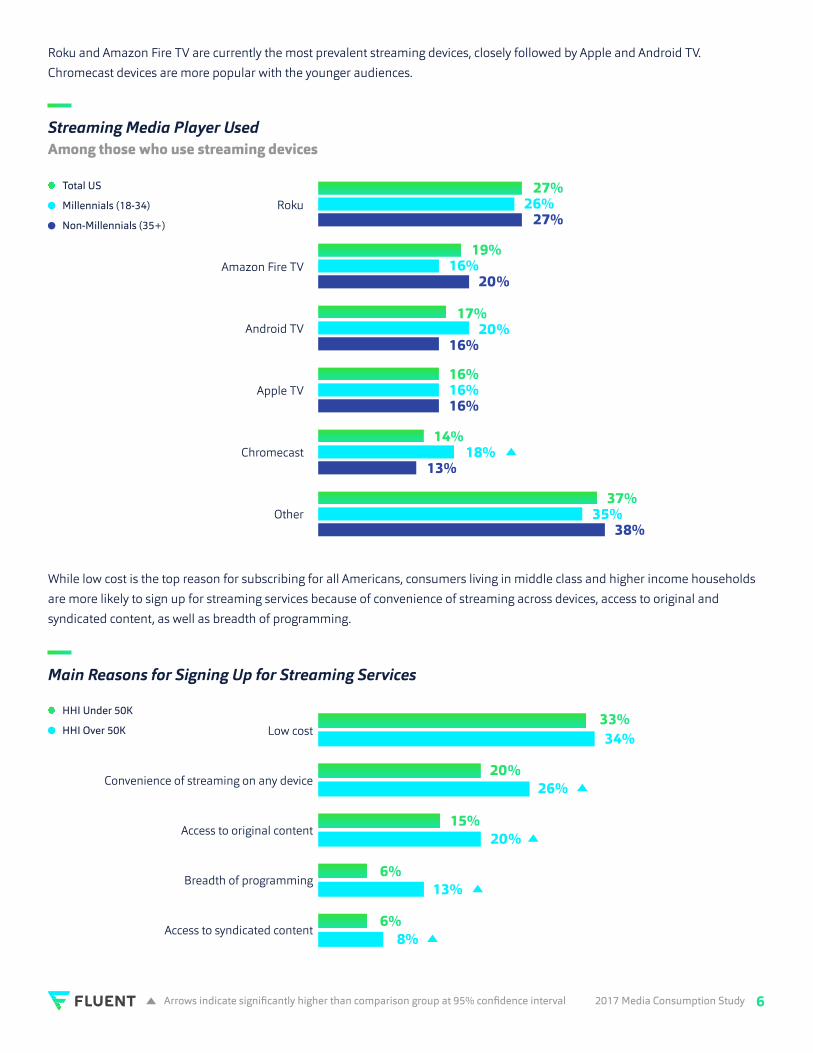
Streaming Media Player Used Among those who use streaming devices
Main Reasons for Signing Up for Streaming Services
Roku and Amazon Fire TV are currently the most prevalent streaming devices, closely followed by Apple and Android TV.
Chromecast devices are more popular with the younger audiences.
While low cost is the top reason for subscribing for all Americans, consumers living in middle class and higher income households
are more likely to sign up for streaming services because of convenience of streaming across devices, access to original and
syndicated content, as well as breadth of programming.
Roku
Amazon Fire TV
Android TV
Apple TV
Chromecast
Other
Low cost
Convenience of streaming on any device
Access to original content
Breadth of programming
Access to syndicated content
Total US
Millennials (18-34)
Non-Millennials (35+)
27%
19%
17%
16%
14%
37%
26%
16%
20%
16%
18%
35%
27%
20%
16%
16%
13%
38%
HHI Under 50K
HHI Over 50K33%
20%
15%
6%
6%
34%
26%
20%
13%
8%
2017 Media Consumption Study 7Arrows indicate significantly higher than comparison group at 95% confidence interval
Devices Used to Stream Video Content
Higher income households tend to be more connected, and therefore are more likely to stream content across several devices. On
the other hand, consumers from lower income households are more likely to stream on their smartphones.
Streaming media player
Smartphone
iPad or tablet
Desktop/laptop computer
Smart TV
Smartwatch
HHI Under 50K
HHI Over 50K
42%
38%
21%
20%
20%
2%
49%
32%
29%
27%
27%
5%
2017 Media Consumption Study 8Arrows indicate significantly higher than comparison group at 95% confidence interval
Watch original content created specifically for the streaming serviceAmong those who have access to any streaming services
Preferred Method of Viewing TV Shows
Do you believe it is OK for streaming services to show ads even though they are already charging a subscription fee?
Streaming Video BehaviorsWhile the original content isn’t the primary reason for signing up for streaming services, consumers do indulge in it. Nearly three
quarters (71%) of Americans who have access to a video streaming service watch original content, with millennials being more
likely to watch original content than older generations.
Most Americans (61%) prefer binging on many episodes at once versus waiting for weekly episodes, and this preference is even
more pronounced among millennials.
Millennials are a lot more accepting of the fact that streaming services need to make money, sometimes through ads, even if they
already charge a subscription fee. Non-millennials are more resistant to the idea of any ads on the platform. Very few consumers
are willing to pay more to avoid ads. Millennials have resigned themselves to watching the ads, while older generations are less
willing to subscribe to such a service altogether.
Millennial (18-34)
Weekly episodes
Total
Entire season at once
No, ads are unacceptable
Yes, but only minimal ads
Yes, any kind of ads
Non-Millennial (35+)
71%
64%
61%
28%
10%
35%
61%
66%
26%
7%
39%
59%
67%
26%
6%
40%
79%68%
Total US
Millennials (18-34)
Non-Millennials (35+)
Total US
Millennials (18-34)
Non-Millennials (35+)
2017 Media Consumption Study 9Arrows indicate significantly higher than comparison group at 95% confidence interval
Would be willing to subscribe to a streaming service that allowed them to watch…
Streaming Sports
Which of the following sports would you pay to watch as part of a streaming service
Would you be willing to pay more for a video streaming service to avoid ads? Among all respondents, irrespective of whether they already stream video
About 1 in 4 Americans (23%) would pay for a streaming service that would allow them to watch sports on any device. Millennials
are more keen on such a streaming option; nearly a third (31%) said they would subscribe. The sport preferences also vary across
generations. Millennials are more interested in basketball and soccer, while the older crowd is more likely to pay for football and
baseball. If a streaming service could choose just one sport to stream, football would have to be it.
About 2 in 10 Americans are interested in a subscription service that would enable them to stream live news reports and live
awards shows, although this interest trails behind streaming sports. Once again, millennials are the most viable target for such
streaming services, as they exhibit a lot more enthusiasm for these emerging services.
Total US
Millennials (18-34)
Non-Millennials (35+)
I would watch the ads I would pay more to avoid ads
I would not subscribe to such a service
30%
53%
16%20%
64%
15%17%
67%
14%
Total US
Millennials (18-34)
Non-Millennials (35+)
Live awards showsLive news reports
26%28%
20%16%
19%
13%
Would subscribe to a streaming service that allowed you to watch live sports on any device
Football
Basketball
Baseball
Soccer
Hockey
Other
74%
49%
32%
17%
14%
25%
23%
64%
53%
27%
25%
12%
23%
31%
77%
47%
34%
14%
14%
25%
21%
Total US Millennial (18-34)
Non-Millennial (35+)
2017 Media Consumption Study 10Arrows indicate significantly higher than comparison group at 95% confidence interval
The leading social media platforms have announced plans to offer streaming content in the near future. When we asked
Americans how likely they are to watch streaming video on these platforms, Facebook came out ahead of Twitter and Snapchat.
This is not surprising, as Facebook boasts much higher usage rates. While millennials are more receptive of the idea of streaming
video through social platforms, they are notably more enthusiastic about streaming video through Snapchat, compared to older
generations.
Among US consumers who do not currently have access to any streaming services, the main reasons are contentment with current
entertainment options and not enough time.
How likely are you to watch streaming video on each platform, once its offered? Very/somewhat likely
Main Reasons for NOT Streaming any Video Content
Total US
Millennials (18-34)
Non-Millennials (35+)Facebook
Snapchat
Twitter
Happy with regular TV/cable
Don't have time
Don't know how to stream
Subscription cost
Don't have streaming device
Insufficient internet
Don't like the programming
35%
17%
15%
26%
25%
12%
12%
11%
8%
6%
44%
37%
21%
32%
11%
13%
2017 Media Consumption Study 11Arrows indicate significantly higher than comparison group at 95% confidence interval
MethodologyFluent’s Streaming Services survey was conducted online within the United States by Fluent, LLC on May 9,
2017 among 2,267 US consumers (aged 18 and up). Due to rounding, percentages may not always add up
to 100%. Fluent’s proprietary ad serving technology includes a real-time survey module that was used to
facilitate the data collection for this study. Respondents were randomly selected and data was weighted to
ABOUT FLUENTFluent, LLC, a cogint company (Nasdaq: COGT), is an industry leader in people-based digital marketing and customer acquisition, serving over 500 leading consumer brands and direct marketers. Leveraging a massive reservoir of proprietary audience data, as well as millions of real-time survey interactions with consumers every day, Fluent enables advertisers to more effectively target and acquire their most valuable customers, with precision, at a massive scale. The company is headquartered in New York City. For more information visit www.fluentco.com.