Can Direct Manipulation Lower the Barriers to Computer Programming and Promote Transfer of Training? An Experimental Study CHRISTOPHER D. HUNDHAUSEN, SEAN F. FARLEY, AND JONATHAN L. BROWN Visualization and End User Programming Lab School of Electrical Engineering and Computer Science Washington State University ________________________________________________________________________ Novices face many barriers when learning to program a computer, including the need to learn both a new syntax and a model of computation. By constraining syntax and providing concrete visual representations on which to operate, direct manipulation programming environments can potentially lower these barriers. However, what if the ultimate learning goal of the novice is to be able to program in conventional textual languages, as is the case for introductory computer science students? Can direct manipulation programming environments lower the initial barriers to programming, and, at the same time, facilitate positive transfer to textual programming? To address this question, we designed a new direct manipulation programming interface for novices, and conducted an experimental study to compare the programming processes and outcomes promoted by the direct manipulation interface against those promoted by a textual programming interface. We found that the direct manipulation interface promoted significantly better initial programming outcomes, positive transfer to the textual interface, and significant differences in programming processes. Our results show that direct manipulation interfaces can provide novices with a “way in” to traditional textual programming. Categories and Subject Descriptors: D.1.7 [Programming Techniques]: Visual Programming; H5.2 [Information Interfaces and Presentation]: User Interfaces - Interaction styles; Theory and methods; K.3.2 [Computing Milieux]: Computers and Education – Computer and Information Science Education General Terms: Design, Experimentation, Human Factors, Languages Additional Key Words and Phrases: direct manipulation, programming education, transfer of training, semantic components analysis, video analysis ________________________________________________________________________ 1. INTRODUCTION
Learning computer programming is a challenging task for many people. While
specialized end-user programming languages and environments are empowering
increasing numbers of computer users to engage in programming tasks [Scaffidi et al.
2005], computer science students, who aim to become professional programmers,
continue to struggle with programming, as evidenced by 30 to 40 percent attrition rates
commonly observed in early programming courses [Beaugouef and Mason 2005]. A key
programming environments (e.g., [Dann et al. 2000]). We focus here on factor (d): the
possibility that the human-computer interface to novice programming environments is
deficient. An extensive line of research, comprehensively reviewed in [Guzdial 2004] and
[Kelleher and Pausch 2005], has attempted to lower the barriers to programming through
a variety of programming interface features, including visual representations of executing
code (e.g., [Ben-Bassat Levy et al. 2003]), drag-and-drop editing (e.g., [Birnbaum and
Goldman 2005]), programming by direct manipulation and gestures (e.g., [Smith et al.
1994]), and support for the declarative constructs that novices appear to use
independently of programming environments [Pane et al. 2002].
In conjunction with our development of an alternative “studio-based” pedagogical
approach to teaching novices how to program [Hundhausen and Brown 2008], we have
contributed to the above line of research through the development of a novice
programming environment called ALVIS LIVE! [Hundhausen and Brown 2005], which
supports both (a) up-to-the-keystroke syntactic and visual semantic feedback (a so-called
“live” editing model), and (b) an interface for generating object creation statements by
direct manipulation—that is, by using a set of tools to directly lay out and modify visual
representations of program variables and data structures in an animation window.
While a recent experimental study of the ALVIS LIVE! environment [Hundhausen
and Brown 2007] showed that its “live” editing model enables novices to program
significantly more accurately than they could without any programming environment at
all, we observed that study participants still struggled to develop correct programs. In
particular, in their attempts to write array iterative algorithms, many participants had
trouble constructing correct loops, and referencing array elements correctly within those
loops through the use of array indices. Consistent with past research [Soloway et al.
1983], we found that iterative constructs proved to be a key stumbling block for
participants in our study.
Given that study participants appeared to benefit from ALVIS LIVE!’s direct
manipulation interface for creating program objects, we posited that a direct manipulation
interface may also address the programming difficulties we observed in our study, as well
3
as facilitate a smooth transition to textual programming. This led to the following three
research questions:
RQ1: Can a direct manipulation interface for programming iterative,
conditionals, and assignment statements in ALVIS LIVE! facilitate (a) faster and more accurate programming, and (b) positive transfer to textual programming?
RQ2: How might the programming processes promoted by such a direct
manipulation interface differ from those promoted by a conventional textual programming interface?
RQ3: What might the design of such a direct manipulation interface look like? In this article, we address these questions by presenting the design of a new direct
manipulation programming interface for the ALVIS LIVE! software, along with an
experimental evaluation and post-hoc video analysis that evaluate how the new interface
compares to a traditional textual interface. The new ALVIS LIVE! interface enables one
to write iterative, conditional, assignment, and arithmetic operations through a
combination of filling in dialog boxes and directly manipulating objects in ALVIS
LIVE!’s animation window. This new interface makes it possible for users to specify,
without having to type in any textual code, the kinds of single procedure, array iterative
algorithms that students typically explore in the first weeks of an introductory computer
programming course.
Given that users of novice programming environments must ultimately migrate to
conventional textual programming environments, a key objective of the direct
manipulation interface explored here is to facilitate positive transfer-of-training to textual
programming. Our concern for the issue of transfer separates the research presented here
from past efforts to develop direct manipulation environments for the sole purpose of
easing the programming task. As we shall see, in an experimental study, our new direct
manipulation interface promoted (a) significantly faster and more accurate initial
programming than the text-based ALVIS LIVE! interface, (b) positive transfer to textual
programming, and (c) programming processes that differed markedly from those
promoted by a textual programming interface.
The remainder of this article is organized as follows. After reviewing related work in
Section 2, we describe our new direct manipulation interface in Section 3. Section 4
presents the design and results of our experimental study, while Section 5 presents a
4
detailed post-hoc video analysis of our study participants’ programming processes.
Finally, Section 6 outlines directions for future research.
2. RELATED WORK
The research presented here develops and experimentally evaluates the effectiveness
and transferability of a new direct manipulation programming interface for novices.
Below, we situate our research within the context of four lines of related work.
2.1 Direct Manipulation and Demonstrational Programming Interfaces
A large body of work, some of which is surveyed in [Cypher 1993], shares our
interest in transforming traditionally text-based programming tasks into tasks that can be
performed by direct manipulation and demonstration. For example, Burnett and Gottfried
[Burnett and Gottfried 1998] describe an extension to the Forms/3 spreadsheet
environment that allows users to program graphical objects by direct manipulation, rather
than by specifying formulas. Likewise, Stasko [1991] presents an environment in which
programmers can specify algorithm animations by direct manipulation, rather than by
writing complex C code.
To make programming more accessible to children who are first learning to program,
numerous novice programming environments have explored direct manipulation and
demonstrational techniques. For example, in Lego Mindstorms [LegoSystemsInc. 1998],
children can program robots by dragging iconic representations of commands from a
palette onto a workspace, where they can be wired together to create a program. In
Stagecast Creator [Smith, Cypher and Spohrer 1994], children specify simulations by
demonstrating graphical rewrite rules in a grid-based world. In Tinker [Lieberman 1993],
novices specify examples through a combination of textual programming and direct
manipulation of objects; with the user’s assistance, Tinker attempts to generalize the
examples into Lisp procedures.
2.2 Novice Programming Environments
More closely related to the direct manipulation programming interface explored here
is a family of novice programming environments used for teaching the imperative
programming paradigm commonly explored in undergraduate computer science courses.
Like ALVIS LIVE!, many of these environments generate visual representations of
program execution (e.g., [Ben-Bassat Levy, Ben-Ari and Uronen 2003; Dann, Cooper
5
and Pausch 2000]). In addition, some of these environments enable the learner to specify
a program at least partly by direct manipulation. For example, ALICE [Dann, Cooper and
Pausch 2000] and JPie [Birnbaum and Goldman 2005] provide drag-and-drop code
editors that prevent syntax errors. In RAPTOR [Carlisle et al. 2005], the user writes
algorithms by laying out a flowchart by direct manipulation; however, the commands
within each element of the flowchart (e.g., conditional and assignment statements) must
still be specified textually.
2.3 Experimental Evaluations of Direct Manipulation Programming Interfaces
While numerous direct manipulation and demonstrational programming interfaces
have been developed, few have been subjected to experimental evaluation in order to
determine whether they actually ease the programming task. In one of the few such
evaluations, Burnett and Gottfried [1998] compared the speed and accuracy with which
users could construct graphics using (a) direct manipulation and (b) textual formulas
within the Forms/3 spreadsheet environment. Their results indicated that users could
perform programming tasks significantly faster and more accurately with the direct
manipulation interface.
In another study, Mudugno et al. [1997] compared the accuracy with which users
could create (by demonstration) and comprehend desktop file manipulation programs
written in a comic strip-based and text-based representational language. Participants were
able to construct significantly more accurate programs using the comic strip-based
language, and to better comprehend the comic strip-based programs they generated.
The experimental comparison presented here differs from these two evaluations in
two key respects. First, our study includes a detailed post-hoc analysis of participants’
programming processes, providing further insight into the impact of direct manipulation
interfaces for computer programming. Second, and more important, our study considers
not only programming performance, but also the extent to which programming in a direct
manipulation interface facilitates positive transfer-of-training to the kind of textual
programming interface that computer science students must ultimately use.
2.4 Studies of Programming Skill Transfer
While no prior empirical studies have specifically considered the issue of whether
direct manipulation programming environments facilitate transfer-of-training to textual
programming environments, there has been significant interest in the issue of transfer as
6
it relates to computer programming. One line of work in this vein used computer
programming tasks as a basis for developing theories of cognitive skill transfer (e.g.,
[Pirolli and Recker 1994; Singley and Anderson 1989]). Another line of work,
comprehensively reviewed by Palumbo [1990], considered the transferability of
programming skill to general problem solving skill.
More closely related to the work presented here is a line of studies that explored the
transferability of skills gained in one programming language or environment to another
programming language or environment. For example, Scholtz and Wiedenbeck [1993;
1990] looked at whether skills gained with the Pascal programming language might
transfer to Ada and Icon. They hypothesized that incongruities in the structure of
programming plans [Soloway et al. 1984]—sets of programming actions that achieve a
desired goal—would hinder transfer. Several of their predictions based upon this
hypothesis were substantiated empirically. They also found that study participants held
fragile knowledge [Perkins and Martin 1986] of their “native” language (Pascal) that
hampered transfer to the other two languages.
In a similar vein, in a semester-long field study within a computing course, Guzdial
et al. [1998] considered the transferability of skills gained in a novice programming
environment (GPCEditor) to a commercial programming environment (THINK Pascal).
Four of the fourteen participants voluntarily switched to THINK Pascal for later course
assignments. Guzdial et al. found that the programs that these participants produced in
THINK Pascal maintained the same level of quality as the programs that participants had
produced previously in GPCEditor, and that the participants preferred THINK Pascal’s
speed and less constraining environment.
3. NEW DIRECT MANIPULATION PROGRAMMING INTERFACE
We developed the new direct manipulation interface to ALVIS LIVE! (henceforth “the
new DM interface”) through an iterative, user-centered design process (see, e.g.,
[Norman and Draper 1986]) . Using the original ALVIS LIVE! as a starting point, we first
constructed a preliminary low fidelity prototype of the new DM interface. The prototype
consisted of a series of static screens that were created by doctoring screenshots of the
original ALVIS LIVE! environment. To test and refine the interface, we ran a “wizard of
oz” prototype study, for which we recruited 15 volunteers out of the fall, 2005 offering of
the introductory computer science course at Washington State University. The design
gradually evolved into its final form through five design iterations, each of which
7
consisted of input from three to five participants. For a detailed account of the user-center
design process that led to our final design, see [Farley 2006].
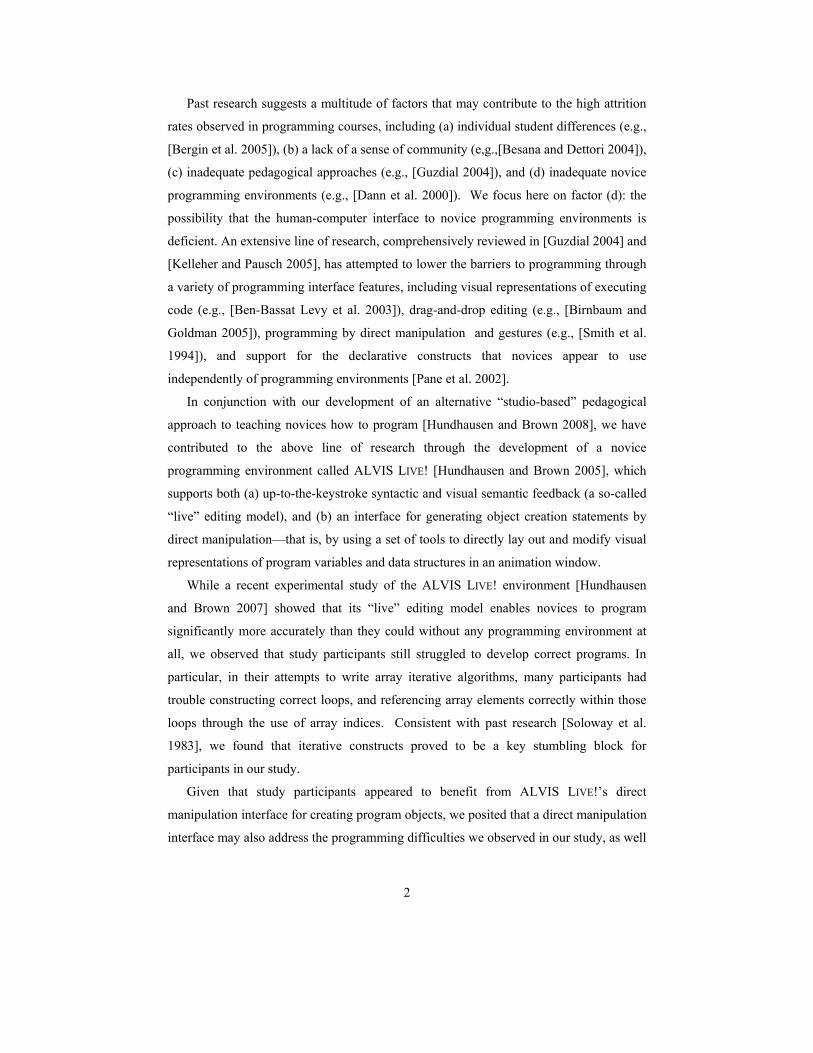
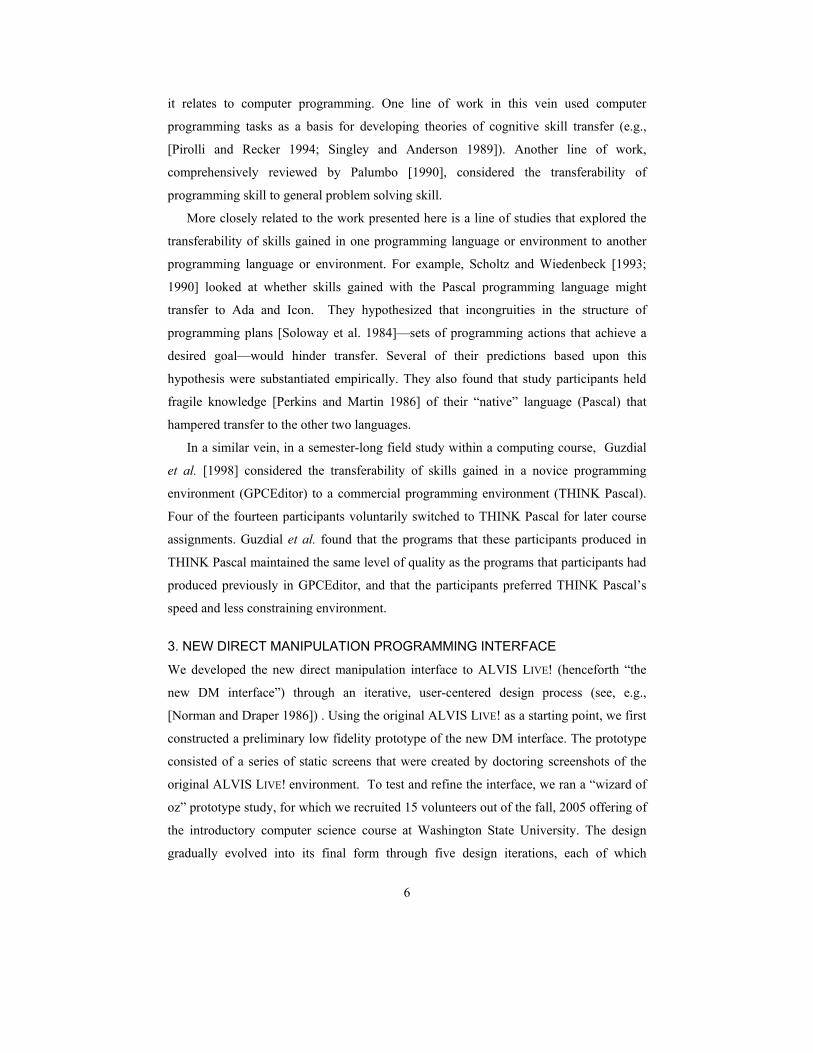
Figure 1 presents an annotated screenshot of the new DM interface, which is identical
to the original ALVIS LIVE! interface [Hundhausen and Brown 2007], except that it
contains four new programming tools—“If,” “Iterate Loop,” “Set,” and “Math” (see
bottom of Toolbox in Figure 1). Just as in the original ALVIS LIVE!, users of the new
DM interface program in a compact pseudocode-like language called SALSA. They can
do so either by typing SALSA commands directly into the Script Window, or by using
the Toolbox Tools to specify commands by placing and directly manipulating objects in
the Animation Window. Through such direct manipulation, SALSA code is dynamically
inserted into the Script Window on the left.
As in the original ALVIS LIVE!, the focal point of the new DM interface is the green
Execution Arrow (see Figure 1), which marks the line of code that was most recently
executed, and that is currently being edited. On every keystroke or direct manipulation
action, that line of code is re-executed, and the graphics in the Animation Window are
dynamically updated to reflect that execution.
3.1 Sample Programming Session
To illustrate how the new DM interface works, we now step through a sample session in
which we use the new interface to code one of the three experimental study tasks—the
“Find Max” algorithm, which identifies the largest value in an array. The complete
SALSA implementation of the algorithm is depicted in Figure 1.
To code this algorithm, we must first create the algorithm objects. We need an array
named a1, a variable named maxSoFar, and an array index named i1. Each of these can
be created using the DM tools. For example, we can create the variable by clicking on
the Create Variable tool to activate it, and then clicking in the Animation Window. A
variable will appear at the cursor’s location. We can create the array in a similar fashion,
using the Create Array tool. To create the array index, the same process is followed, but
here we click on the array cell where we want the index to be positioned (the left-most
cell). We can modify object attributes, such as name or array size, by right clicking on
the object, which provides us with a properties window. As each object is created,
corresponding SALSA code appears in the Script Window.
8
Figure 1. Annotated Snapshot of the New Direct Manipulation Interface to ALVIS LIVE!
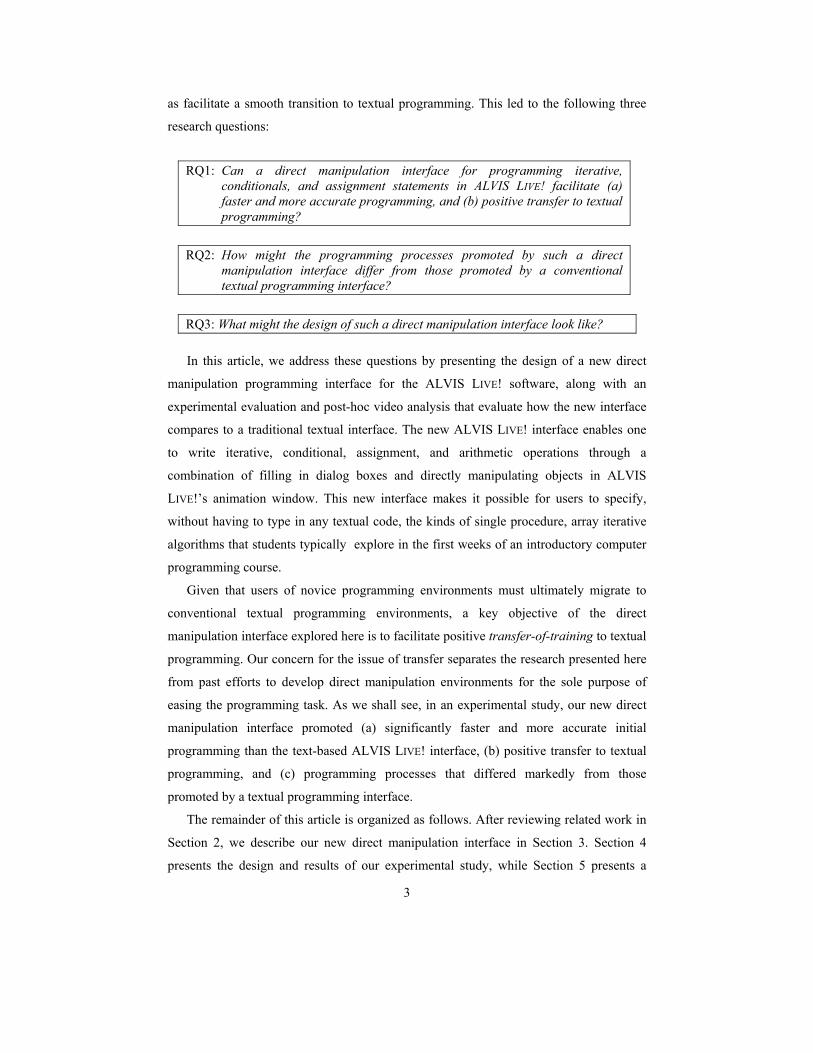
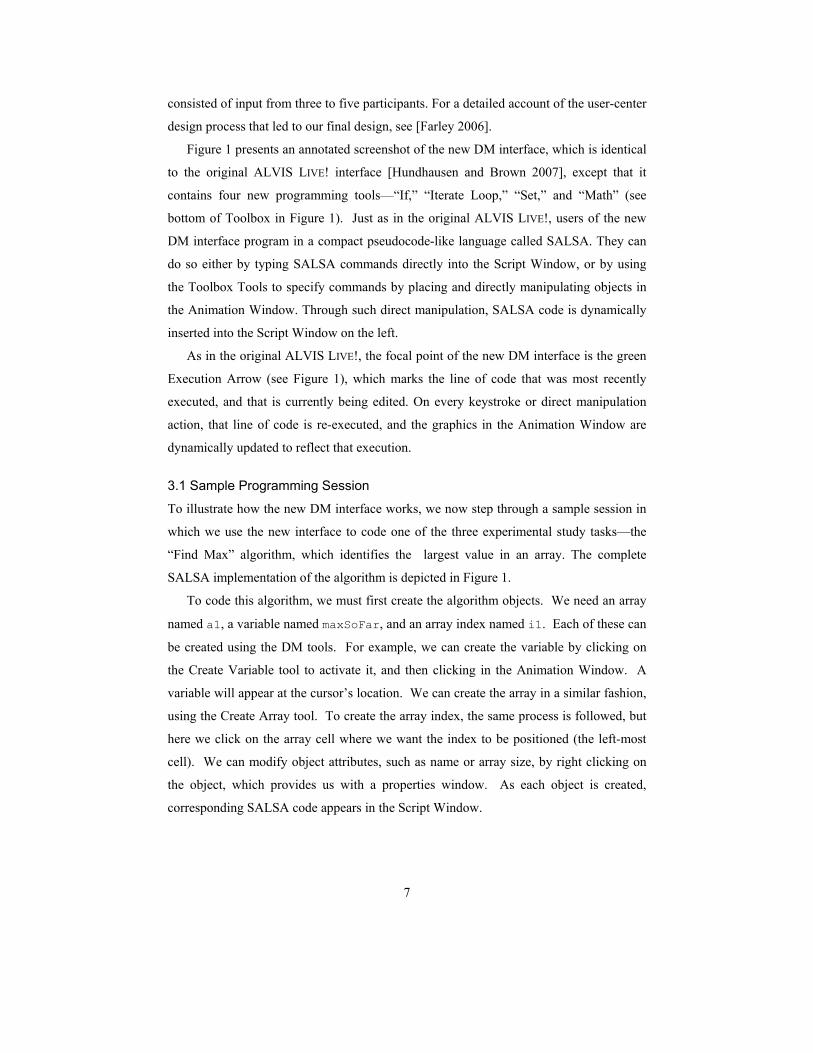
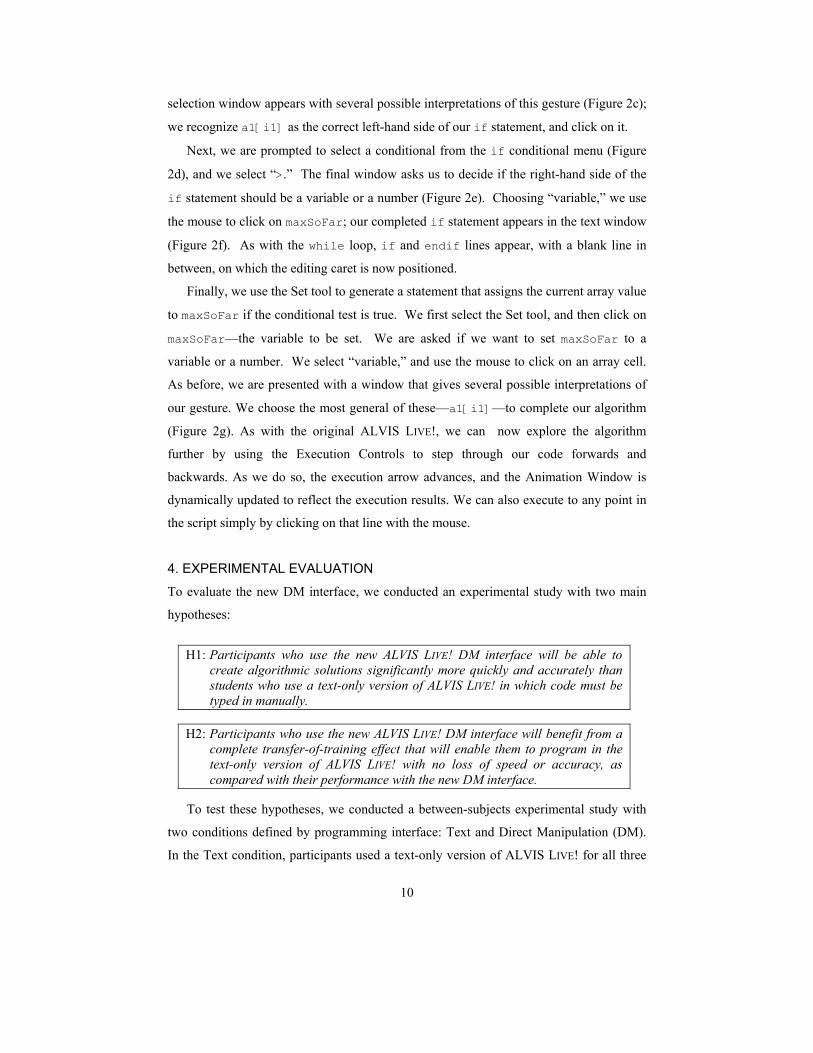
Next, we need to populate the array with numbers. To do this, we first click on the
Populate tool, and then click on the array, and we see the array fill with integer values
(Figure 2a).
Having created all of the necessary program objects we are now in a position to make
use of the new direct manipulation tools to flesh out the algorithm. We first need to
construct a loop to iterate through the array. To do this, we select the Iterate Loop tool,
position the cursor on the i1 index, press the mouse down, and drag the i1 index to the
last array cell. When we release the button, a while loop skeleton appears in the Script
Window consisting of a while statement, an index increment statement, and an
endwhile statement (Figure 2b). A blank line is also created, and the caret is placed
here to indicate that the next line of code will be placed here (unless we move the caret
by clicking elsewhere in the Script Window).
New DM Tools
Script Window
AnimationWindow
Execution Arrow
Execution Controls
Toolbox Tools
9
(a) Populating the array with values by direct manipulation
(b) Creating a while loop by direct manipulation
(c) Selecting left-hand side of if statement
(d) Selecting a conditional operator
(e) Selecting right-hand side of
if statement
(f) Generation of if statement in Script Window
(g) Setting maxSoFar to a1[i1]
Figure 2. Snapshots from a Sample Session with the New ALVIS Live! Direct Manipulation Interface
In order to compare the array values to maxSoFar, we now need an if statement. We
first click on the If tool, and then click on the first cell of the array. An array component
10
selection window appears with several possible interpretations of this gesture (Figure 2c);
we recognize a1[i1] as the correct left-hand side of our if statement, and click on it.
Next, we are prompted to select a conditional from the if conditional menu (Figure
2d), and we select “>.” The final window asks us to decide if the right-hand side of the
if statement should be a variable or a number (Figure 2e). Choosing “variable,” we use
the mouse to click on maxSoFar; our completed if statement appears in the text window
(Figure 2f). As with the while loop, if and endif lines appear, with a blank line in
between, on which the editing caret is now positioned.
Finally, we use the Set tool to generate a statement that assigns the current array value
to maxSoFar if the conditional test is true. We first select the Set tool, and then click on
maxSoFar—the variable to be set. We are asked if we want to set maxSoFar to a
variable or a number. We select “variable,” and use the mouse to click on an array cell.
As before, we are presented with a window that gives several possible interpretations of
our gesture. We choose the most general of these—a1[i1]—to complete our algorithm
(Figure 2g). As with the original ALVIS LIVE!, we can now explore the algorithm
further by using the Execution Controls to step through our code forwards and
backwards. As we do so, the execution arrow advances, and the Animation Window is
dynamically updated to reflect the execution results. We can also execute to any point in
the script simply by clicking on that line with the mouse.
4. EXPERIMENTAL EVALUATION
To evaluate the new DM interface, we conducted an experimental study with two main
hypotheses:
H1: Participants who use the new ALVIS LIVE! DM interface will be able to
create algorithmic solutions significantly more quickly and accurately than students who use a text-only version of ALVIS LIVE! in which code must be typed in manually.
H2: Participants who use the new ALVIS LIVE! DM interface will benefit from a
complete transfer-of-training effect that will enable them to program in the text-only version of ALVIS LIVE! with no loss of speed or accuracy, as compared with their performance with the new DM interface.
To test these hypotheses, we conducted a between-subjects experimental study with
two conditions defined by programming interface: Text and Direct Manipulation (DM).
In the Text condition, participants used a text-only version of ALVIS LIVE! for all three
11
experimental tasks. In this software version, the only way to program was by entering
textual SALSA code via the keyboard (the DM tools were disabled). In contrast, in the
DM condition, for the first two experimental tasks, participants used a version of ALVIS
LIVE! with the new DM interface presented in the previous section, but without the
ability to type in textual commands (text entry into the Script Window was turned off).
Hence, participants in the DM condition had to use the DM tools to program their
solutions to the first two tasks. For the third experimental task, participants in the DM
condition switched to the text-only version of the software, thus enabling us to consider a
transfer-of-training effect.
Programming outcomes were assessed according to two dependent measures—
semantic accuracy and time on task—that we will explain further in Section 4.4. In
addition, to ensure that participants in each condition were equally matched with respect
to general programming knowledge, we administered a multiple-choice pretest. A follow-
up posttest, isomorphic to the pretest, was used to gauge any gains in programming
knowledge; however, our analysis of the pre-test and post-test scores failed to yield any
significant differences (we speculate that the study duration was not long enough for
programming knowledge differences to develop), and we will not consider it further here.
4.1 Participants
We recruited 34 students (29 male, 5 female; mean age 19.7) out of the spring, 2006
offering of CptS 121, the introductory computer science course at Washington State
University. Participants were recruited in the second week of the semester, before they
had received formal instruction on programming. Participants received course credit for
their participation.
4.2 Materials and Tasks
All participants worked on Pentium IV computers running the Windows XP operating
system. Equipped with mice and keyboards, the computers had 1 GB of RAM and either
a 15 or 18 inch LCD color display set to a resolution of 1024 × 768.
Prior to working on the programming tasks, participants in both conditions completed
an informationally-equivalent tutorial that introduced them to the software version they
would be using. The Text version of the tutorial introduced participants to each SALSA
command. Participants were given a sample of each command type, and asked to type
each command into the Script Editor, as well as to use the Execution Tools to execute
12
their code. The DM version of the tutorial was identical, except that, instead of typing in
commands, participants were shown how to generate commands using the DM Tools.
Participants in both conditions completed three isomorphic programming tasks: Find
Max, Replace, and Count. In Find Max, participants were required to construct an
algorithm to locate and identify the largest value in an array. In Replace, participants
were required to construct an algorithm to find and replace array values smaller than 25.
In Count, participants had to write an algorithm to count the number of array values
larger than 50. These tasks were designed so that their solutions were semantically
isomorphic to each other. This allowed us to employ a universal grading system,
regardless of task.
In the DM condition, participants used the DM version of ALVIS LIVE! (see Section
3) for the first two tasks, and the text-only version of ALVIS LIVE! (identical to the DM
version, except that all of the DM Tools were removed) for the third task. In contrast,
participants in the Text condition used the text-only version of ALVIS LIVE! for all three
tasks.
We used Morae® Recorder [Techsmith Corp. 2007] to make lossless recordings of
participants’ screens as they worked on tasks. These recordings allowed us to recreate
participants’ work if needed and to gauge their time on task. They also and served as a
basis for the detailed post-hoc video analysis presented in Section 5.
4.3 Procedure
We used a background questionnaire to screen potential participants for prior
programming experience; students who self-reported any prior programming experience
were excluded from the study. The remaining students were randomly assigned to the two
conditions. In order to guard against task order effects, we fully counterbalanced the
order in which participants completed tasks within each condition. This meant that
roughly six study participants (three per condition) performed each of six possible task
orderings.
The experiment was conducted during three two-hour- and-50-minute sessions, each
with 10 to 12 participants. In each study session, participants first completed a 20-minute
pre-test of conceptual programming knowledge. They then worked through a 15-minute
tutorial specific to the software version they would initially use. Following the tutorial,
participants were asked to start their screen recording and to begin their first task.
Participants were instructed to complete each task as quickly as possible, without
13
sacrificing accuracy, with the stipulation that each of the three tasks had to be completed
in less than 35 minutes. After 35 minutes, or whenever they finished, participants were
asked to save their work, stop their screen recording, and move on to the next task. After
completing the second task, DM participants were asked to complete the third task using
the “text-only” interface; however, they were not provided with a tutorial for that
interface. After finishing all three tasks, participants in both conditions completed a 20-
minute post-test of conceptual programming knowledge (isomorphic to the pre-test), and
then filled out an exit questionnaire.
4.4 Measuring the Dependent Variables
To measure time on task, we reviewed the screen recordings, noting the time at which
each participant started the task (i.e., when ALVIS screen became visible) and stopped
the task (i.e., when participants saved their work for the final time). To measure
programming accuracy, we identified the key semantic elements of a correct solution to
each task. Because our three tasks were isomorphic, each task solution consisted of the
same set of eight semantic components presented in Table I.
As can be seen from Table I, a semantic element mapped to a line or essential
property of a correct solution. A couple of comments are in order regarding these
components. First, whereas the ways in which components 1 through 5 manifested
themselves in code were identical across our three isomorphic study tasks, components 6
and 7 manifested themselves slightly differently across the three tasks, even though they
identify semantically equivalent operations. Second, while semantic component 8 may
appear unnecessary, it makes an important distinction in our grading system. We
discovered that it was possible for a solution to get the first seven components correct,
Table I. Semantic Components of Correct Code Solutions
# Semantic Component Typical Manifestation in SALSA Code 1 Create Array create array a1 with 6 cells
2 Populate Array populate a1 with random ints between 1 and 100
3 Create array index set i1 to index 0 of a1
4 Array index visits each cell Within while loop: add 1 to a1 5 Loop terminates while i1 < cells of a1…endwhile
6 Correct comparison FindMax: if ai[i1] > maxSoFar…endif Replace: if a1[i1] <= 25…endif Count: if a1[i1] >= 50…endif
7 Correct assignment FindMax: set maxSoFar to a1[i1] Replace: set a1[i1] to 0 Count: add 1 to count
8 Correct result Algorithm achieves correct overall result
14
but not obtain the correct result, due to extra lines of code with deleterious effects.
Semantic Component 8 allowed us to distinguish between such solutions and those that
actually achieved the correct result.
We gave each solution a score of 0 to 8 based on its number of correct semantic
elements. Two independent graders achieved a level of agreement exceeding 99% on a
20 percent sample of the solutions. We thus concluded that the scoring system was
reliable, and a single grader scored the remaining solutions.
4.5 Results
Before analyzing our data, we verified that the two conditions were equally matched with
respect to prior programming ability. To do this, we used an independent samples t-test
with Wilks-Satterwhait correction (because we did not want to assume equal variances)
to test for a significant difference between the two conditions’ programming pretest
scores. The test showed that the Text and DM conditions did not vary significantly (df =
27, T = 0.61, p = 0.727). In addition, using normal probability plots, we confirmed that
our accuracy and time-on-task data were normally distributed. Finally, we noted the
following data anomalies:
• The video recording of one DM participant’s task 3 session was missing. Thus,
that participant’s Task 3 time-on-task value was missing.
• Seven of the recording files (one Task 1 DM participant, three Task 2 DM
participants, one Task 2 Text participant, and two Task 3 DM participants) were
corrupt; we were unable to view them directly. In consultation with technicians
at TechSmith Corp., we developed an algorithm to accurately estimate the
durations of these corrupt recordings based on their file sizes. We used these
estimated durations as time-on-task values in these seven cases.
• We needed to drop the task 3 data of three DM participants, since they failed to
switch to the text-only interface.
Figure 3 plots each condition’s accuracy and task time means on a task-by-task basis;
Figure 4 presents box plots of these same data. While the boxplots indicate a substantial
amount of variance in the data—a hallmark of novice performance—these plots suggest
that the DM condition constructed more accurate programs in all three tasks, with the
biggest accuracy difference occurring in the initial task. Similarly, in all three tasks, the
15
(a) Plot of accuracy
(b) Plot of time-on-task
Figure 3. Mean Accuracy and Time on Task Plots by Task
(a) Box plot of accuracy
(b) Box plot of time-on-task
Figure 4. Mean Accuracy and Time on Task Plots by Task
DM condition took less time than the Text condition, with the biggest difference
occurring in the second task.
To get an overall indication of whether a statistically significant difference existed
between the conditions with respect to accuracy and time-on-task across all three tasks,
we ran a repeated measures analysis of variance (ANOVA) model with condition (Text
vs. DM) and task number (1, 2, 3) as the main effects. The interaction between condition
and task number, along with the subject effect within the conditions, was accounted for
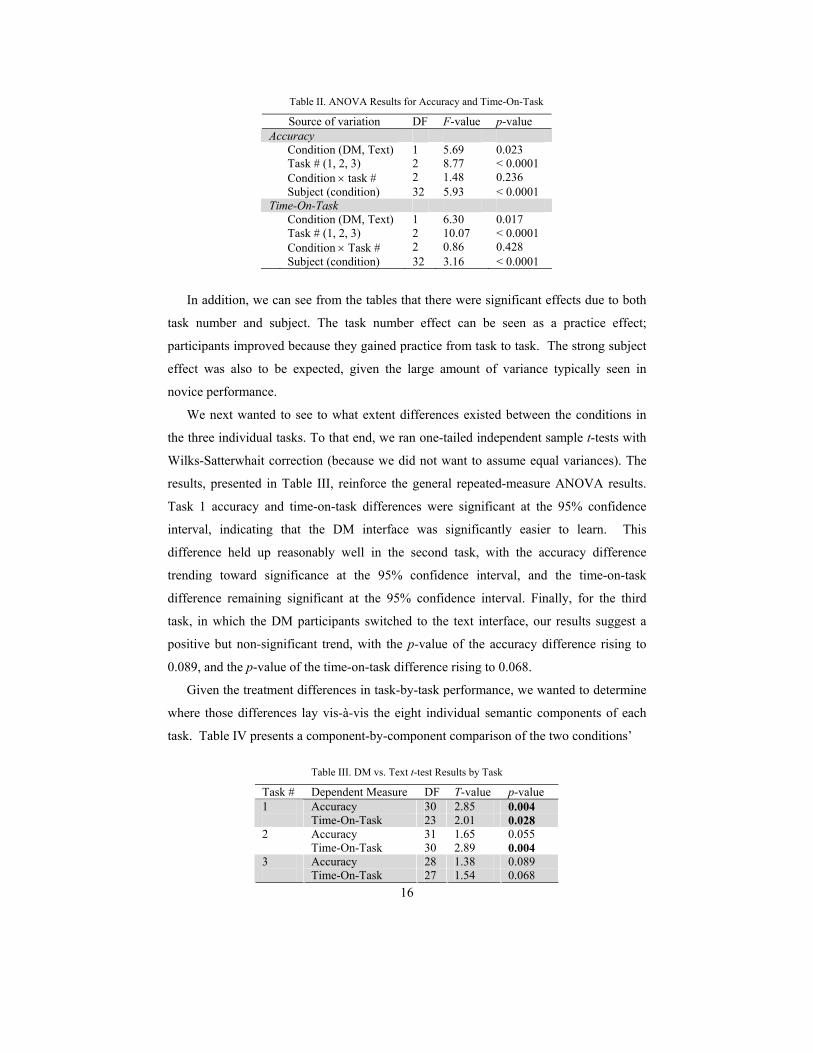
by the statistical model. Table II presents the results of the ANOVA for accuracy and
time-on-task. As predicted by H1, the overall effect of condition on both accuracy and
time-on-task was significant, with the DM condition completing the three tasks in
significantly less time than the Text condition (least square means: DM—17.16 min;
Text—23.07 min), but scoring significantly higher (least square means: DM—6.66 out
of 8; Text—5.24 out of 8).
16
Table II. ANOVA Results for Accuracy and Time-On-Task
DM 0.5 0.51 0.8 0.44 0.8 0.44 8. Correct result Text 0.2 0.44 0.157 0.5 0.51 0.157 0.5 0.51 0.157
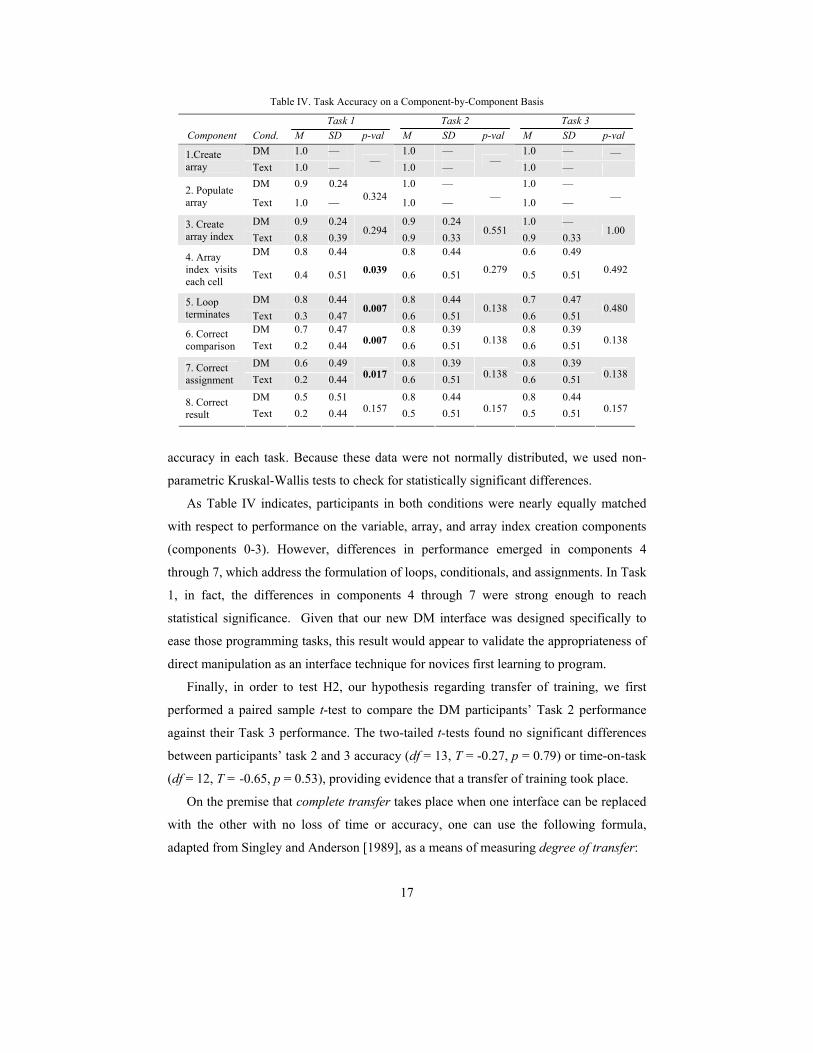
accuracy in each task. Because these data were not normally distributed, we used non-
parametric Kruskal-Wallis tests to check for statistically significant differences.
As Table IV indicates, participants in both conditions were nearly equally matched
with respect to performance on the variable, array, and array index creation components
(components 0-3). However, differences in performance emerged in components 4
through 7, which address the formulation of loops, conditionals, and assignments. In Task
1, in fact, the differences in components 4 through 7 were strong enough to reach
statistical significance. Given that our new DM interface was designed specifically to
ease those programming tasks, this result would appear to validate the appropriateness of
direct manipulation as an interface technique for novices first learning to program.
Finally, in order to test H2, our hypothesis regarding transfer of training, we first
performed a paired sample t-test to compare the DM participants’ Task 2 performance
against their Task 3 performance. The two-tailed t-tests found no significant differences
between participants’ task 2 and 3 accuracy (df = 13, T = -0.27, p = 0.79) or time-on-task
(df = 12, T = -0.65, p = 0.53), providing evidence that a transfer of training took place.
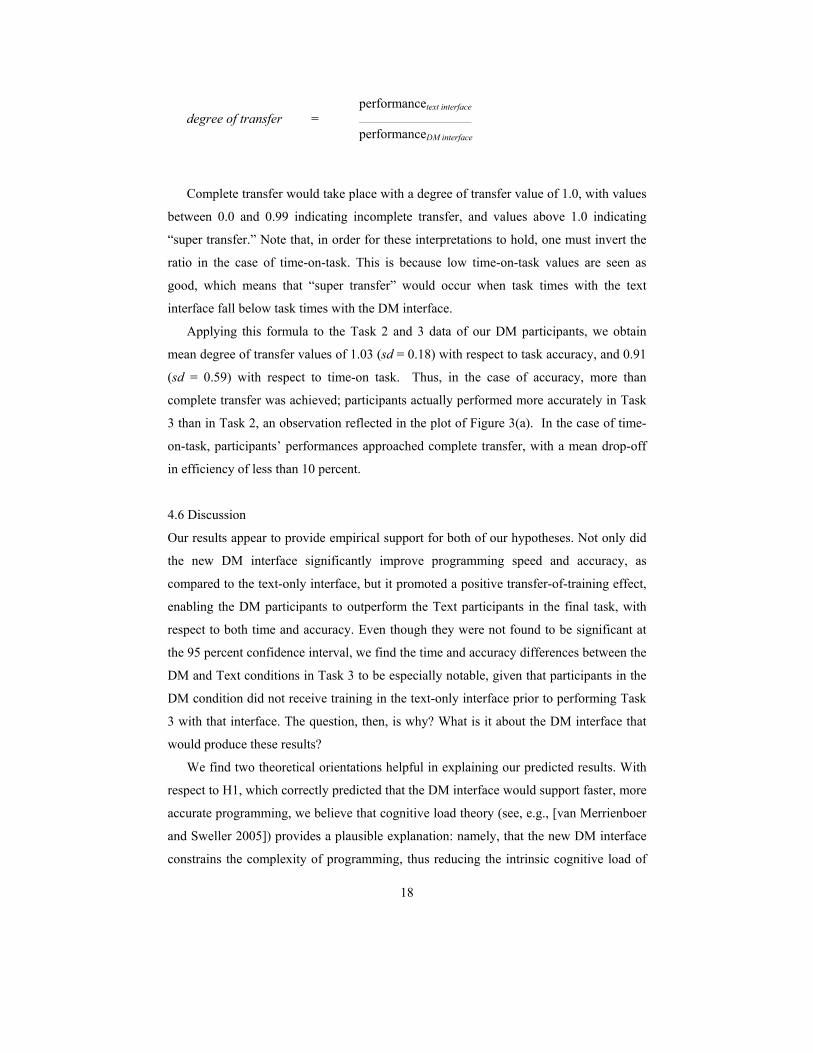
On the premise that complete transfer takes place when one interface can be replaced
with the other with no loss of time or accuracy, one can use the following formula,
adapted from Singley and Anderson [1989], as a means of measuring degree of transfer:
18
performancetext interface degree of transfer = —————————————
performanceDM interface
Complete transfer would take place with a degree of transfer value of 1.0, with values
between 0.0 and 0.99 indicating incomplete transfer, and values above 1.0 indicating
“super transfer.” Note that, in order for these interpretations to hold, one must invert the
ratio in the case of time-on-task. This is because low time-on-task values are seen as
good, which means that “super transfer” would occur when task times with the text
interface fall below task times with the DM interface.
Applying this formula to the Task 2 and 3 data of our DM participants, we obtain
mean degree of transfer values of 1.03 (sd = 0.18) with respect to task accuracy, and 0.91
(sd = 0.59) with respect to time-on task. Thus, in the case of accuracy, more than
complete transfer was achieved; participants actually performed more accurately in Task
3 than in Task 2, an observation reflected in the plot of Figure 3(a). In the case of time-
on-task, participants’ performances approached complete transfer, with a mean drop-off
in efficiency of less than 10 percent.
4.6 Discussion
Our results appear to provide empirical support for both of our hypotheses. Not only did
the new DM interface significantly improve programming speed and accuracy, as
compared to the text-only interface, but it promoted a positive transfer-of-training effect,
enabling the DM participants to outperform the Text participants in the final task, with
respect to both time and accuracy. Even though they were not found to be significant at
the 95 percent confidence interval, we find the time and accuracy differences between the
DM and Text conditions in Task 3 to be especially notable, given that participants in the
DM condition did not receive training in the text-only interface prior to performing Task
3 with that interface. The question, then, is why? What is it about the DM interface that
would produce these results?
We find two theoretical orientations helpful in explaining our predicted results. With
respect to H1, which correctly predicted that the DM interface would support faster, more
accurate programming, we believe that cognitive load theory (see, e.g., [van Merrienboer
and Sweller 2005]) provides a plausible explanation: namely, that the new DM interface
constrains the complexity of programming, thus reducing the intrinsic cognitive load of
19
the programming task. Note that the same conclusion might also be reached by the idea
of directness [Hutchins et al. 1985], which would predict that our new DM interface
reduces the “information processing distance” between a novice’s programming goals
and the interface mechanisms provided to accomplish those goals.
With respect to H2, which predicted a transfer-of-training effect, we believe that dual
coding theory (see, e.g., [Paivio 1983]) provides a possible causal explanation. Dual-
coding theory posits that (a) pictures and words are encoded in different ways in memory;
(b) referential connections can be built between each encoding of a given concept, and (c)
a concept that is dually coded and has referential connections can be remembered more
easily. Because the new DM interface makes continuously visible the textual commands
to which direct manipulation actions give rise, we speculate that users of the new DM
interface built referential connections between pictorial representations (as manifested in
the Animation Window) and textual representations (as manifested in the Script Window)
of their programming plans. According to dual coding theory, this should lead to
improved recall of the commands, and hence the positive transfer-of-training effect we
observed.
5. POST-HOC VIDEO ANALYSIS
Recall that the second research question we posed for this research concerned the
programming processes promoted by the DM and text-only programming interfaces:
RQ2: How might the programming processes promoted by such a direct manipulation interface differ from those promoted by a conventional textual programming interface?
In order to address this question and obtain further insight into the results presented in the
previous section, we conducted a detailed post-hoc video analysis of participants’ task
sessions. This analysis was guided by the following four research questions, which can be
seen as more detailed refinements of RQ2:
RQ2.1: To what extent do participants spend their time focused on productive programming activities in the DM vs. the text-only version of the interface?
RQ2.2: To what extent do participants validate their code’s semantic correctness in the
DM vs. the text-only version of the interface?
RQ2.3: To what extent do participants consult help materials in the DM vs. the text-only version of the interface?
20
RQ2.4: Are there any overall patterns of programming behavior? Do they differ between the DM and text-only versions of the interface?
We regard RQ2.1 as a “bottom line” question regarding the relative productiveness of
participants’ programming processes with each interface. RQ2.2 and RQ2.3 consider
whether the alternative interfaces give rise to alternative activities that might be
considered instrumental to success (validating one’s code for correctness), or indicative
of struggle or frustration (consulting help materials). Finally RQ2.4 aims to capture the
big picture: Are there any notable patterns or qualitative differences in programming
behavior between the two conditions?
Below, we describe the methodology we employed to address these questions. After
that, present the key results of our analysis, and discuss their implications vis-à-vis our
research questions.
5.1 Method
In order to investigate and compare the programming processes of the two treatments,
we employed semantic components analysis, a methodology for studying novice
programming behavior developed in our prior work [Hundhausen et al. 2006]. The idea
behind the methodology, which is an adaptation of sequential analysis [Bakeman and
Gottman 1996], is to classify programmers’ moment-to-moment behaviors with respect
to a model solution to the programming problem they are trying to solve. In addition to
providing an overall qualitative feel for the temporal evolution of a programmer’s code
solution, the methodology facilitates quantitative post-hoc comparisons of the time
participants direct toward valid and invalid solution components, code validation, help
consultation, and other behavioral categories of interest to the researcher.
Because it requires careful review of participants’ moment-to-moment behaviors,
semantic components analysis, like any video analysis technique, proves to be time
intensive: One hour of video requires roughly 2.5 hours of analysis. Therefore, we limited
the sample considered by our post-hoc video analysis to just the Task 1 and Task 3
sessions; Task 2 sessions were not considered. Because it included initial programming
behavior (Task 1), and transitional programming behavior of DM participants when they
switched to the text-only interface (Task 3), we felt that this limited sample would
provide a sufficient basis for addressing our research questions.
The semantic components analysis methodology entails five general steps: (1)
creating a coding system based on model code solutions; (2) making the recordings; (3)
21
coding the recordings; (4) performing quantitative analysis; (5) performing qualitative
analysis. Below, we describe how we performed the first three of these steps, which
placed us in a position to perform the quantitative and qualitative analyses (steps 4 and 5)
presented in Section 5.2.
5.1.1 Creating Coding System Based on Model Solutions. The first step in the
methodology is to develop the coding system to be used as a basis for classifying
participants’ moment-to-moment task behavior. To do this, one first constructs a model
solution to the problems that participants are solving within study tasks. We already did
this in Section 4, where we presented a model solution consisting of eight general
semantic components that could be used to score solutions to all three tasks. In our post-
hoc video analysis, we used that model solution as a basis for creating our coding
categories, with two exceptions:
• Component 8 (“solution produces correct result”) was used to distinguish
solutions that were actually correct from solutions that had all of the correct
components combined with other code that prevented them from working
correctly. Since our video analysis was concerned with moment-to-moment
behavior, and not post-hoc properties of a solution, it was not feasible to include
this component as a basis for classifying participants’ task behavior.
• Although we argue that all three tasks were isomorphic, it turned out that two of
the three tasks (Count Instances and Find Max) needed a storage variable to
keep track of the solution. Creating this storage variable, while not explicitly
part of the model solution we used to score participants’ solutions, constituted a
valid coding activity. We therefore created a semantic component 0 to classify
behavior directed toward the creation of a storage variable.
Thus, in order to address RQ2.1, we defined eight valid semantic components (0
through 7) to classify participants’ coding activities directed toward valid components of
the model solution. This is the kind of coding activity that one would normally consider
to be “productive,” because it contributes to a correct solution.
In addition to classifying behavior directed toward each of the valid components of
our slightly-modified model solution, we defined the following additional coding
categories to capture other significant behaviors relevant to our research questions:
• Editing invalid components—Behaviors directed toward editing code that cannot
be identified as one of the eight valid components we defined. This is the kind of
22
coding activity that one would normally consider to be “unproductive,” because
it does not directly lead to pieces of a correct solution (although it could lead to
insights that ultimately place one on the correct path).
• Validating code—Behaviors directed toward executing code that has already
been written.
• Consulting help—Behaviors directed toward consulting the on-line reference
guide available to participants.
• Other—The catch-all category that identified behaviors not coded into the other
categories. Such behavior is marked by inactivity; the participant does not
appear to be doing anything productive. Note that we did not explicitly code
video segments into this category; rather, all video segments that did not receive
an explicit code automatically fell into this category.
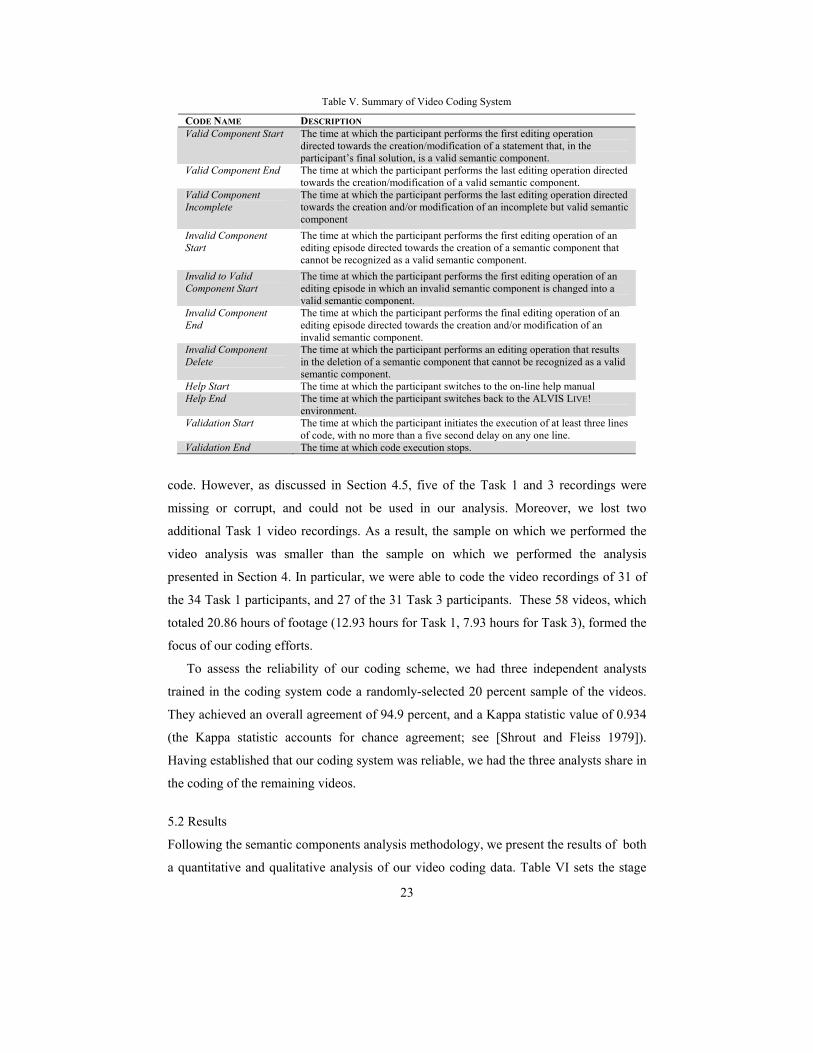
Based on the definitions just presented, Table V summarizes the codes in the coding
system we defined for our analysis. It is important to note that the definitions we provide
here are intended to give a feel for the distinctions made by our coding system; they are
less precise and more concise than the actual definitions we used, which were developed
over several months of collaboratively reviewing the video recordings, and which are
described in greater detail in our coding manual [Hundhausen et al. 2007].
5.1.2 Making the Recordings. The next step in the methodology is to create video
recordings of participants’ programming sessions. As mentioned in Section 4.3,
participants completed the study in groups of 10 to 12. Participants’ computers were
equipped with Morae® Recorder ver. 1.3 [Techsmith Corp. 2007], which captured
lossless recordings of participants’ computer screens as they worked.
Since participants worked in a laboratory setting with multiple computers, they were
asked to work in silence, and audio was not recorded. We note that this was not, in our
view, an ideal state of affairs. We believe that our video analysis of participants’
activities would have been easier and more reliable if we had instructed participants to
think aloud, and then considered participants’ verbalizations of what they were doing in
our analysis (as in, e.g., [Ormerod and Ball 1993]).
5.1.3 Coding the Recordings. With a coding system and video recordings in hand, the
third step in the methodology is to classify behaviors observed in the recordings
according to the established coding system. Given that we limited our sample to only the
Task 1 and Task 3 recordings, we potentially had 65 recordings (34 Task 1, 31 Task 2) to
23
Table V. Summary of Video Coding System
CODE NAME DESCRIPTION Valid Component Start The time at which the participant performs the first editing operation
directed towards the creation/modification of a statement that, in the participant’s final solution, is a valid semantic component.
Valid Component End The time at which the participant performs the last editing operation directed towards the creation/modification of a valid semantic component.
Valid Component Incomplete
The time at which the participant performs the last editing operation directed towards the creation and/or modification of an incomplete but valid semantic component
Invalid Component Start
The time at which the participant performs the first editing operation of an editing episode directed towards the creation of a semantic component that cannot be recognized as a valid semantic component.
Invalid to Valid Component Start
The time at which the participant performs the first editing operation of an editing episode in which an invalid semantic component is changed into a valid semantic component.
Invalid Component End
The time at which the participant performs the final editing operation of an editing episode directed towards the creation and/or modification of an invalid semantic component.
Invalid Component Delete
The time at which the participant performs an editing operation that results in the deletion of a semantic component that cannot be recognized as a valid semantic component.
Help Start The time at which the participant switches to the on-line help manual Help End The time at which the participant switches back to the ALVIS LIVE!
environment. Validation Start The time at which the participant initiates the execution of at least three lines
of code, with no more than a five second delay on any one line. Validation End The time at which code execution stops.
code. However, as discussed in Section 4.5, five of the Task 1 and 3 recordings were
missing or corrupt, and could not be used in our analysis. Moreover, we lost two
additional Task 1 video recordings. As a result, the sample on which we performed the
video analysis was smaller than the sample on which we performed the analysis
presented in Section 4. In particular, we were able to code the video recordings of 31 of
the 34 Task 1 participants, and 27 of the 31 Task 3 participants. These 58 videos, which
totaled 20.86 hours of footage (12.93 hours for Task 1, 7.93 hours for Task 3), formed the
focus of our coding efforts.
To assess the reliability of our coding scheme, we had three independent analysts
trained in the coding system code a randomly-selected 20 percent sample of the videos.
They achieved an overall agreement of 94.9 percent, and a Kappa statistic value of 0.934
(the Kappa statistic accounts for chance agreement; see [Shrout and Fleiss 1979]).
Having established that our coding system was reliable, we had the three analysts share in
the coding of the remaining videos.
5.2 Results
Following the semantic components analysis methodology, we present the results of both
a quantitative and qualitative analysis of our video coding data. Table VI sets the stage
24
for these analyses by presenting the accuracy and time-on-task results of the subset of
participants whose video data we consider in these analyses side-by-side with the
accuracy and time-on-task results of our original sample (see Table III). As seen in this
table, in our smaller video analysis sample, statistically reliable differences existed
between the two conditions with respect to both measures in Task 1. These results mirror
those obtained in Section 4. However, in contrast to those results, we found a
statistically-reliable difference in our video analysis sample with respect to Task 3
accuracy. Thus, while our video sample p-values for all measures were certainly in the
ballpark of those obtained for the original sample, one must clearly exercise caution when
generalizing our video analysis results to our entire sample.
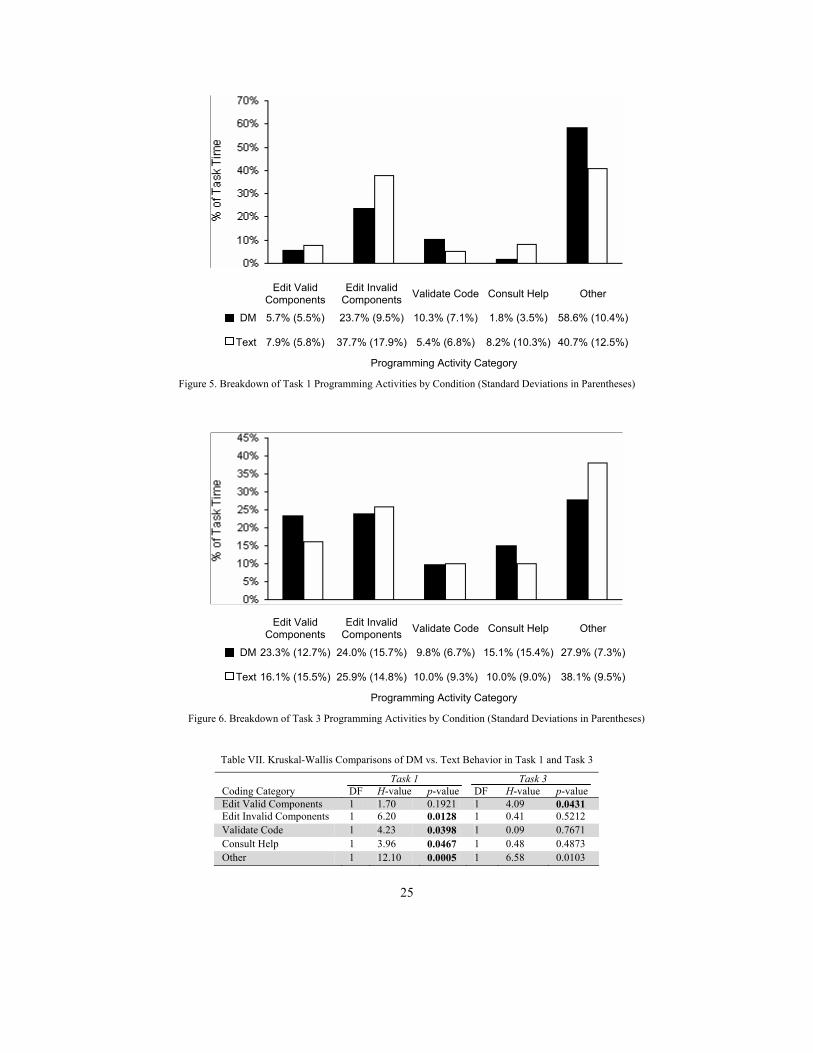
5.2.1 Quantitative Analysis of How Participants Spent Their Time. Figure 5 and
Figure 6 present, for each of the two tasks considered in our analysis, mean percentages
of DM and Text participants’ behaviors coded into each coding category (standard
deviations are in parentheses). Inspection of these graphs suggests notable differences,
especially in Task 1.
To explore these differences further, we employed non-parametric Kruskal-Wallis
tests, since Shapiro-Wilk tests determined that these percentage data were not normally
distributed. Table VII presents the results of Kruskal-Wallis comparisons of the two
conditions’ Task 1 and 3 activities on a category-by-category basis. In this table, bolded
p-values indicate statistically significant differences between the two conditions in a
given category.
These results show statistically reliable differences between the two conditions with
respect to every activity category except “edit valid components.” By combining “edit
valid components” with “edit invalid components” into a single “edit components
category,” we find that the DM participants spent a significantly smaller proportion of
their time editing code (df = 1, H = 9.02, p = 0.003). This indicates that the DM interface
promoted more efficient programming: DM participants spent significantly smaller
proportions of their time not only editing their programs, but also—perhaps more
significantly—creating and fixing mistakes. Table VI. DM vs. Text Time and Accuracy t-test Comparisons in Original Sample vs. Video Analysis Sample
Original Sample Video Analysis Sample Task Dependent Measure DF T-value p-value DF T-value p-value
— 63.0 0.5416 *Parametric paired-sample one-tailed t-tests were used to compare performance across tasks, whereas non-parametric paired-sample Wilcoxon tests were used to compare behavior across tasks
As Table VIII indicates, the Text participants in our video sample benefited from a
learning effect from Task 1 to Task 3, with statistically reliable differences in both
accuracy and time on task. Three process differences appear to have contributed to their
higher performance in Task 3: a higher percentage of time spent editing valid
components; a higher percentage of time spent validating code; and a lower percentage of
time spent editing invalid components.
In contrast, DM participants in our video sample did not benefit from such a strong
learning effect, with differences in accuracy and time on task trending toward, but failing
to reach, statistical significance. Clearly, the fact that DM participants switched to the
text-only interface in Task 3 played a leading role in the diminished learning effect. In
DM participants’ switch from the DM to the Text interface, three significant process
differences stand out: (a) a significant drop in the proportion of inactivity (the “other”
category); (b) a significant increase in the proportion of time dedicated to editing valid
components; and (c) a significant increase in the proportion of time dedicated to
consulting the SALSA Reference Guide.
5.2.2 Qualitative Analysis. Our video analysis methodology enables us to generate
timeline visualizations of participants’ moment-by-moment programming activities. We
now use these visualizations as a basis for a qualitative exploration of patterns of
programming behavior. Because we are interested in exploring how patterns differ by
interface, we limit the scope of this analysis to Task 1.
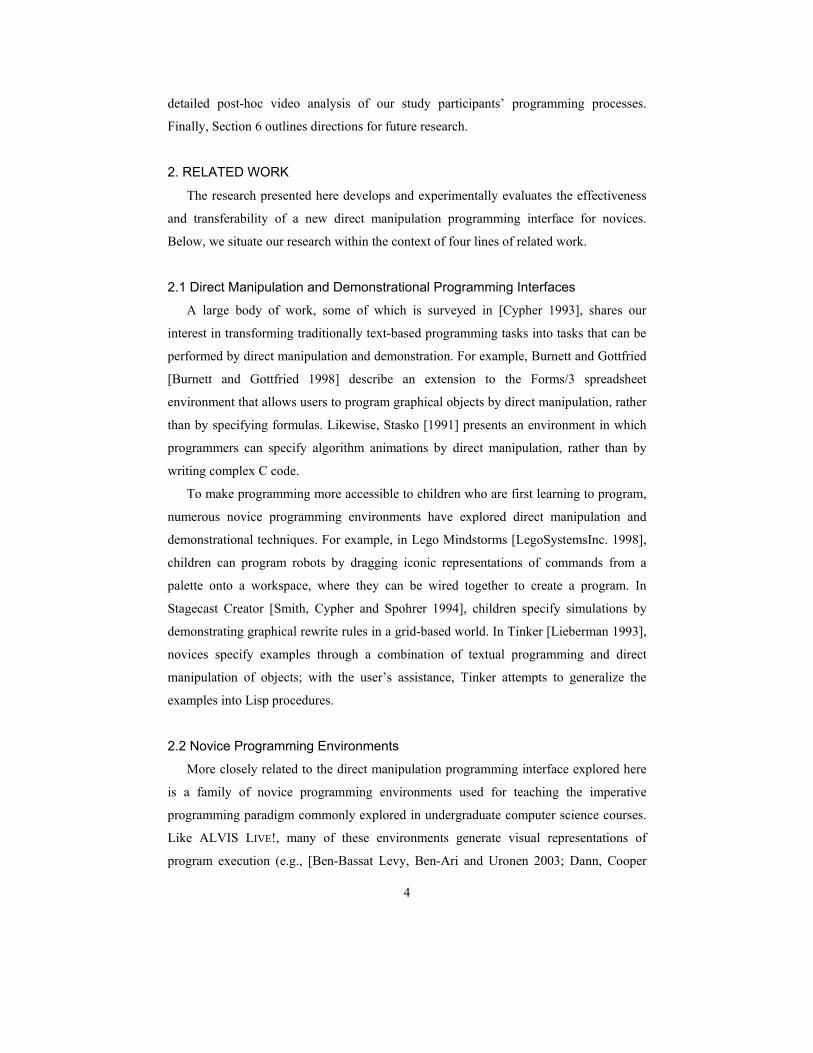
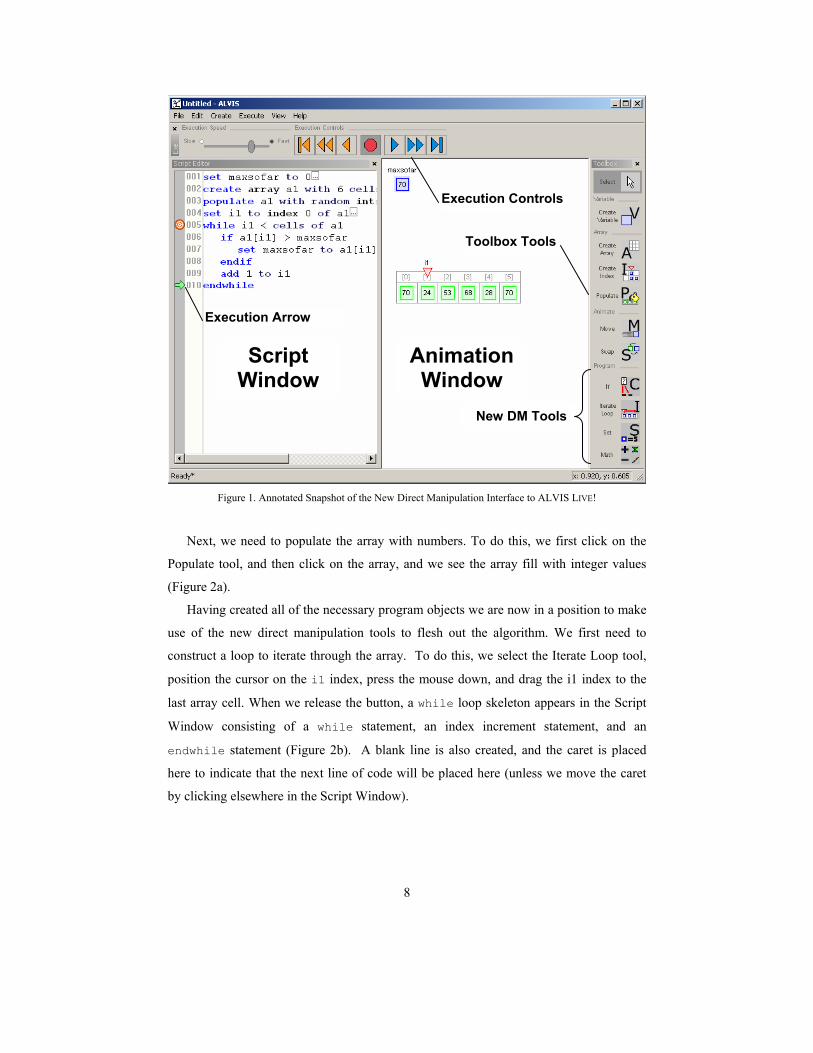
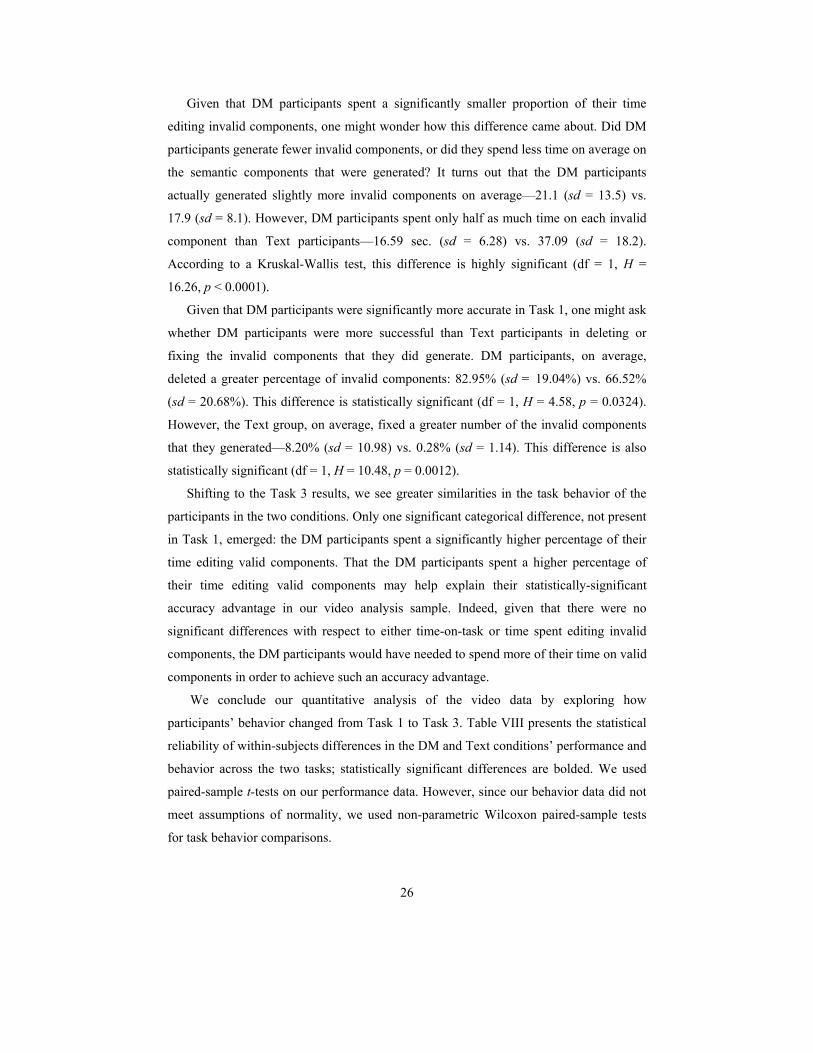
Figure 7 presents a timeline visualization of the Task 1 behavior of E25M11—the
fastest, most accurate Text participant. In this and the other timeline visualizations we
explore below, the x-axis depicts the time, in minutes, of the participant’s session. The y-
28
0 1 2 3 4 5 6 7 8 9 10 11 12 13 14 15
Help consultation
Code validation
Invalid components
7. Exchange items
6. Compare items
5. Loop terminates
4. Visit each cell
3. Create iterator
2. Populate array
1. Create array
0. Create storage var.
Focu
s of
Tas
k Ac
tivity
Time (min) ->
Figure 7. Timeline Visualization of the Highest-Performing Text Participant’s Task 1 Behavior (E25M11)
axis divides the novice’s programming activities into four key categories: (a) episodes
that focus on one of eight valid semantic components (depicted as red bars for invalid
components that evolved into valid components, and green bars for valid components);
(b) episodes focused on semantically-invalid components (depicted as red bars); (c)
episodes in which code is explicitly validated for correctness (depicted as blue bars); and
(d) episodes in which the SALSA Quick Reference Guide is consulted (depicted as gray
bars). The length of each bar denotes the duration of the corresponding activity; spaces
between bars represent periods of inactivity (coded as “other” in our coding system).
Three features of E25M11’s session, visually evident in Figure 7, typify the behavior
of the four Text participants who achieved perfect accuracy. First, E25M11 relied heavily
upon the SALSA Quick Reference Guide, which he consulted frequently throughout the
task session. Second, like most Text participants, E25M11 programmed the first three
semantic components relatively quickly and easily at the beginning of the session, and
then made several missteps (the red bars between minutes 4 and 8). Unlike unsuccessful
participants, however, E25M11’s missteps, coupled with his persistent consultation of the
help materials, ultimately led to a correct solution. Finally, notice how little E25M11
executed his code in order to verify its correctness: we see just one validation episode
near the end of the session. As we saw in the previous section, Text participants spent a
significantly smaller proportion of their time performing validation in Task 1. However,
29
among those 10 participants (6 DM, 4 Text) who achieved perfect accuracy in Task 1, we
find little difference between DM and Text participants, both of whom dedicated roughly
15 percent of their task time to code validation. In this regard, E25M11 was unusual,
dedicating less than one percent of his time to code validation.
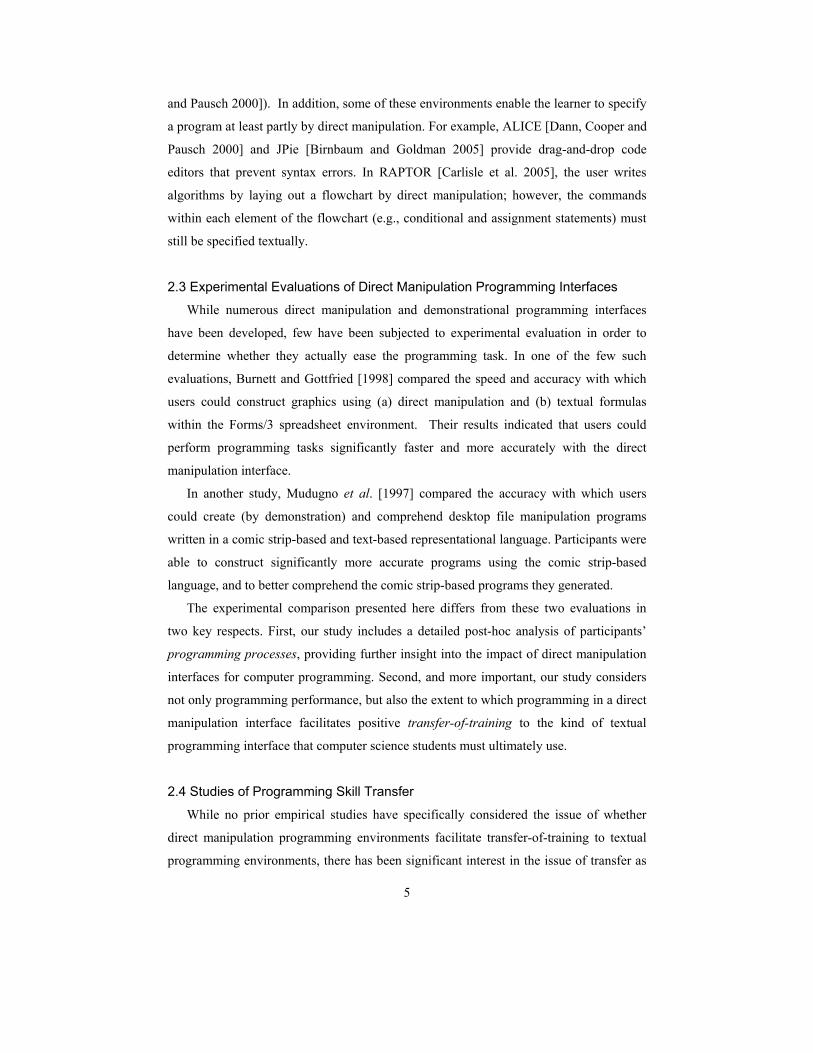
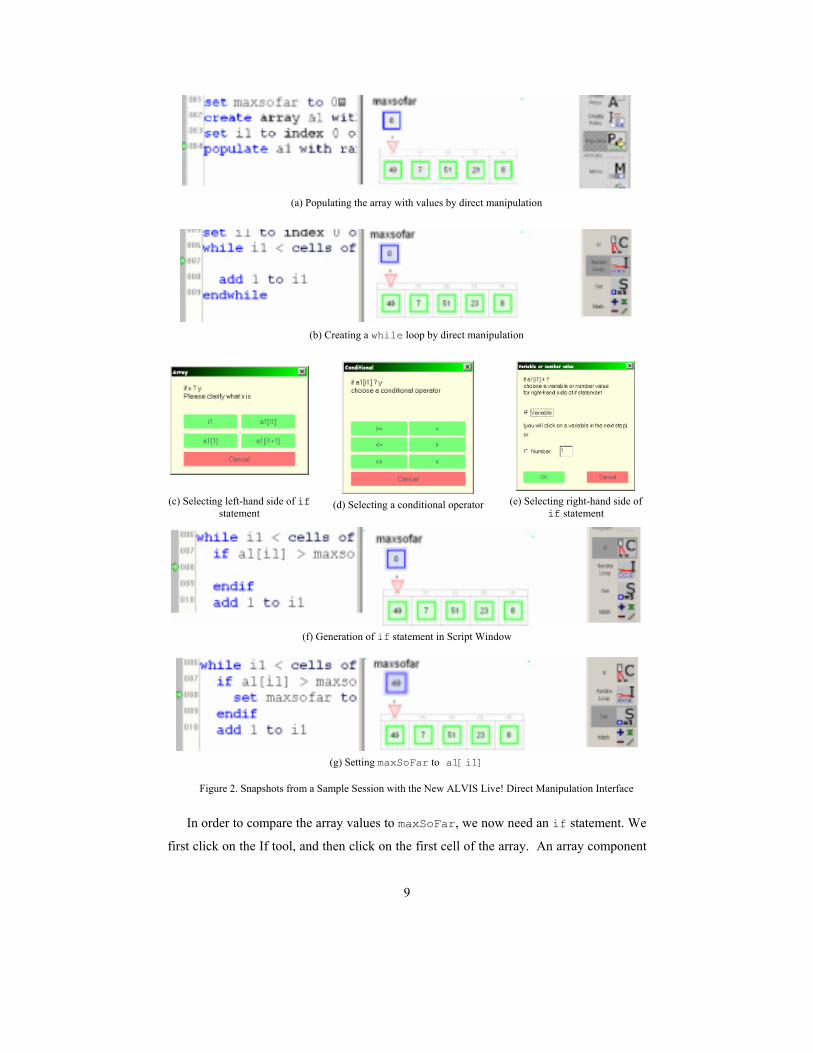
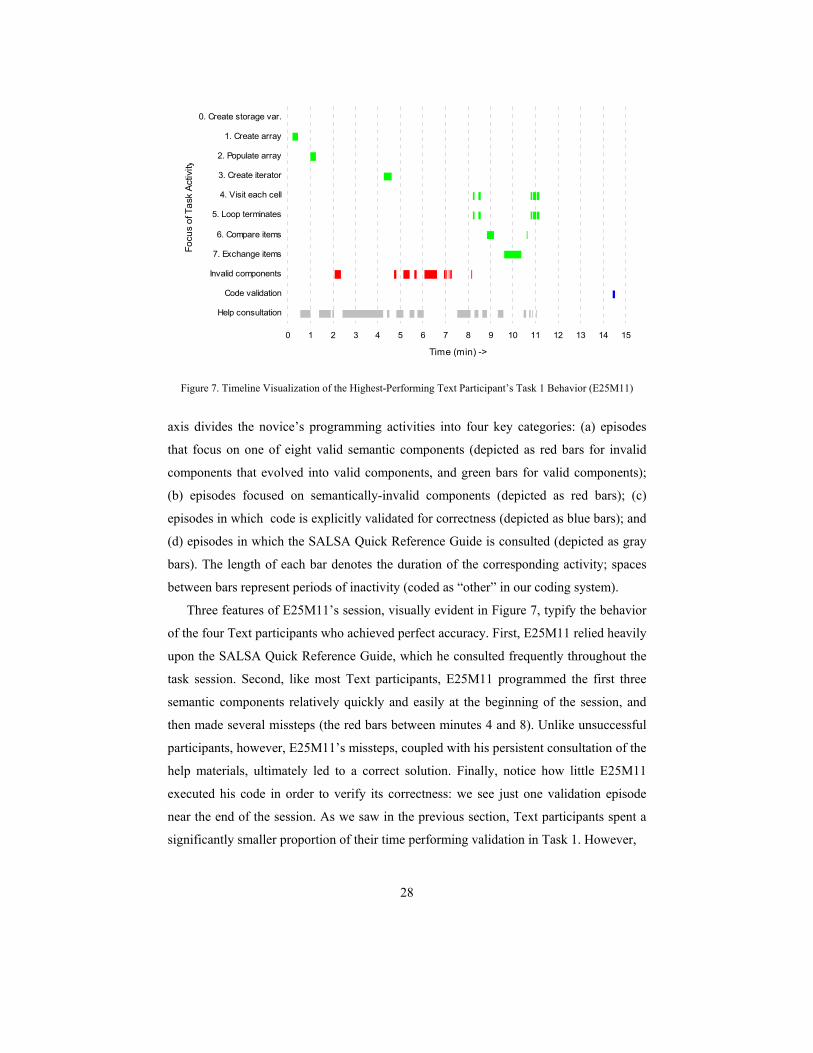
Contrast Figure 7 with Figure 8, which depicts the Task 1 behavior of the fastest,
most accurate DM participant—DM2508. Three features of DM2508’s task behavior are
consistent with the behavior of the six DM participants who achieved perfect accuracy.
First, notice that DM 2508 did not consult the help materials even once. This suggests
that the DM interface itself provided sufficient resources to complete the task. Second,
DM2508 made only two missteps, both of which occurred early on and amounted to just
under 11 percent of his total task time. While DM2508’s percentage of time dedicated to
invalid components was unusually low (the average for the top six DM performers was
24%), it is suggestive of the lower degree of “flailing” evident in the DM sessions.
Finally, notice the sequence of validation episodes near the end of the task session—a
hallmark of high performers in the DM session, who typically spent the tail ends of their
sessions executing their code to ensure that their final solutions worked properly.
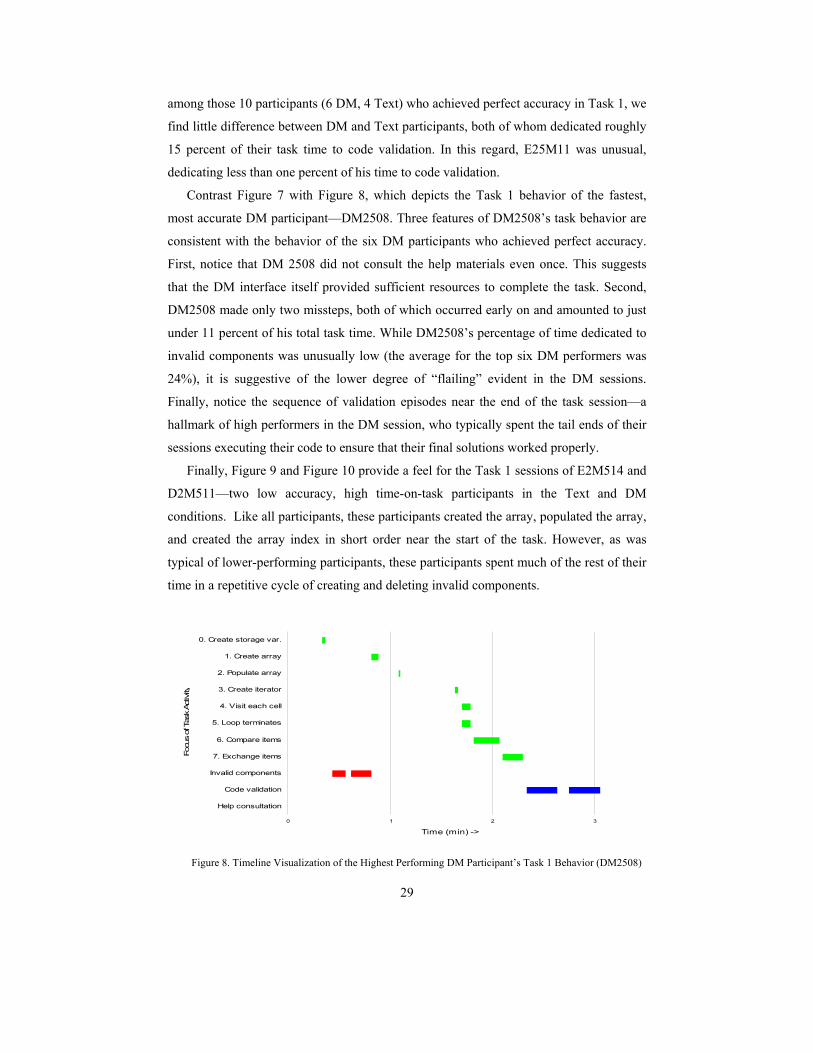
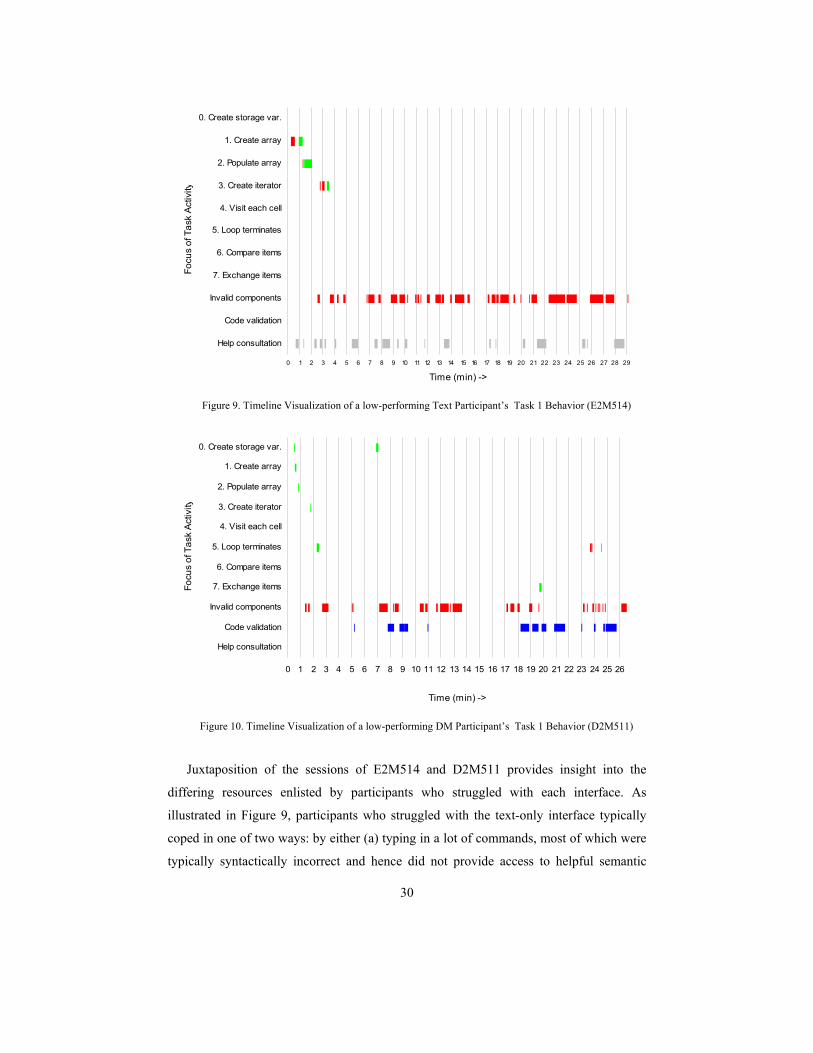
Finally, Figure 9 and Figure 10 provide a feel for the Task 1 sessions of E2M514 and
D2M511—two low accuracy, high time-on-task participants in the Text and DM
conditions. Like all participants, these participants created the array, populated the array,
and created the array index in short order near the start of the task. However, as was
typical of lower-performing participants, these participants spent much of the rest of their
time in a repetitive cycle of creating and deleting invalid components.
0 1 2 3
Help consultation
Code validation
Invalid components
7. Exchange items
6. Compare items
5. Loop terminates
4. Visit each cell
3. Create iterator
2. Populate array
1. Create array
0. Create storage var.
Focu
s of
Tas
k Ac
tivity
Time (min) ->
Figure 8. Timeline Visualization of the Highest Performing DM Participant’s Task 1 Behavior (DM2508)
Figure 10. Timeline Visualization of a low-performing DM Participant’s Task 1 Behavior (D2M511)
Juxtaposition of the sessions of E2M514 and D2M511 provides insight into the
differing resources enlisted by participants who struggled with each interface. As
illustrated in Figure 9, participants who struggled with the text-only interface typically
coped in one of two ways: by either (a) typing in a lot of commands, most of which were
typically syntactically incorrect and hence did not provide access to helpful semantic
31
feedback, or (b) frequently consulting the on-line reference guide. In contrast,
participants who struggled with the DM interface were more successful at generating
syntactically-correct code, even if it was not semantically correct. As a result, DM
participants tended to lean more heavily on code execution, rather than command
generation and help consultation, as a resource for making progress in the task.
5.3 Discussion
Based on the video analyses just presented, we can now provide concise answers to the
four specific research questions posed for the analysis.
RQ2.1: To what extent do participants spend their time focused on productive programming activities in the DM vs. the text-only version of the interface?
The quantitative results for Task 1 showed that, while both interfaces promoted nearly
equal proportions of valid component editing time, the DM interface promoted a
significantly smaller proportion of invalid component editing time. Further exploration of
this difference revealed that, while DM participants actually generated slightly more
invalid semantic components on average, they spent significantly less time on each
invalid component that they did generate (16.6 vs. 37.1 sec). Thus, whereas Text
participants spent substantial amounts of time generating and tweaking invalid semantic
components (8.2 percent of which ultimately evolved into valid components), DM
participants tended to quickly delete the invalid components that they created.
RQ2.2: To what extent do participants validate their code’s semantic correctness in the
DM vs. the text-only version of the interface?
The DM interface promoted a significantly higher percentage of code validation. This
appeared to be the case because the DM interface better enabled DM participants to
generate syntactically-correct code. Such code could actually be executed, thus enabling
DM participants to obtain visual semantic feedback. In contrast, Text participants often
struggled so much to generate syntactically-correct code that they were unable to execute
their code, thus preventing them from receiving visual semantic feedback.
32
RQ2.3: To what extent do participants consult help materials in the DM vs. the text-only version of the interface?
Participants who used the DM interface consulted help significantly less than
participants who used the text-only interface. We believe this was the case because the
DM interface did a better job of preventing errors, constraining programming choices,
and disguising the syntactic details of the programming language—all of which are
widely touted advantages of direct manipulation (see, e.g., [Shneiderman 1983]).
However, it appears that the syntactic details of the language were not completely
disguised. Indeed, the positive transfer of training effect observed in our study suggests
that the DM interface enabled participants to pick up the syntax of the language without
explicitly studying it through the help guide. As our results showed, DM participants
were ultimately able to program with the Text interface at the same level of proficiency at
which they programmed with the DM interface, albeit with a different programming
process that included more frequent help consultation. Thus, our study provides empirical
evidence that a well-designed direct manipulation programming interface can support
learning-by-doing, and at the same time reduce, but perhaps not eliminate, the need for a
language reference guide.
RQ2.4: Are there any overall patterns of programming behavior? Do they differ between
the DM and text-only versions of the interface?
Overall, we found that DM participants relied more heavily on executing their code
than Text participants, who leaned more heavily on the language reference guide. In the
DM condition, a common pattern was a tight edit-execute cycle in which participants
followed bursts of editing with bursts of execution to validate the semantic correctness of
their code. In contrast, we observed much more floundering in the Text condition, in
which a common pattern was a tight edit-help cycle in which participants alternated
between editing invalid components and consulting the help materials.
In sum, based on the characterization of participants’ coding processes that emerged
from our video analyses, we speculate that the reason for the significant outcome
differences observed in our study had to do with the superior constraints provided by the
DM interface. While participants in both the DM and Text conditions were generally
successful at creating the necessary program variables and array (components 1-3), the
creation of the loop, conditional, and assignment components of the solution task
(components 4-7) proved substantially more difficult. While it did not always lead
33
immediately to correct solution components, the DM interface for constructing loops,
conditionals, and assignment statements was able to lead participants to syntactically-
correct code. From there, the contextual visual semantic feedback provided by ALVIS
LIVE! often proved powerful enough to enable DM participants to home in on correct
solutions.
6. SUMMARY AND FUTURE WORK
A substantial amount of research has focused on developing novice programming
environments that lower the barriers to programming by supporting alternative
programming techniques such as direct manipulation and demonstration. Such techniques
have been shown to hold promise in making programming easier to learn; however, little
empirical research has explored whether such techniques actually promote a positive
transfer-of-training effect to textual programming—an effect that would be especially
useful for computer science students, who will ultimately program in text-based
environments.
To address this issue, we have presented a new direct manipulation interface to our
ALVIS LIVE! software, along with an experimental study that furnishes evidence that a
direct manipulation programming interface has the potential to (a) lower the initial
barriers to programming, (b) promote a positive transfer-of-training to textual
programming, and (c) encourage more productive programming processes with less
reliance on on-line help, and more reliance on code execution and semantic feedback. In
providing evidence that direct manipulation can provide a “way in” to textual
programming, our study provides important extensions to prior studies that validated the
benefits of direct manipulation, but failed to explore either a transfer-of-training effect or
the possible impact of direct manipulation on programming processes.
In future research, we plan to pursue two complementary directions. First, while our
study indicated that our new DM interface was an improvement over a text-only
interface, it also shed light on at least three aspects of our DM interface that can be
improved in future work:
1. Lower the viscosity. In our video analysis of DM participants’ task sessions, we
found that the DM interface actually made it difficult for users to edit existing lines
of code; DM participants instead edited lines by deleting them and then regenerating
modified versions. According to cognitive dimensions framework of Green and
Petre [1996], our DM interface can be said to have high viscosity: it is resistant to
34
local changes. In contrast, the text interface had low viscosity, since it made it easy
to alter the individual characters and words of a given command. As a result, a more
common editing strategy with the text-only interface was to tweak a command until
it is correct. We speculate that increasing the viscosity of the DM interface to a level
that approaches that of the text-only interface would improve its usability, since
users would then be able to leverage work that they had already done, rather than
having to start over. In future work, we would like to explore mechanisms whereby a
user can access and modify chunks of existing code via direct manipulation. This
could be as easy as (a) allowing users to double-click on lines of code in the text
editor, (b) recognizing the code chunk to which the line belongs, and (c) bringing up
a modification dialog box that allows the user to inspect and change properties of the
code chunk via dialog box fill-in and direct manipulation.
2. Improve constraints. When defining a loop in our new DM interface, a user can
freely drag an array index anywhere in the Animation Window, even though the
index must ultimately land in an array cell in order to be valid. In this situation, the
fact that the user‘s gesture is unconstrained can lead not only to temporary confusion
on the user’s part over what to do next, but also to gestures with ambiguous
semantics. We believe that imposing additional gestural constraints throughout our
DM interface would greatly improve the learnability and usability of the interface.
Indeed, as Mudugno et al. [1997] learned in their development of a demonstrational
interface with much in common with ALIVS LIVE!, “seemingly small details of the
system can greatly alter the system’s effectiveness” (p. 278).
3. Highlight correspondence between text and visualization. A key feature of the
ALVIS LIVE! interface is the visual semantic feedback it provides in the form of a
dynamic visualization of the code. In the present interface, the relationship between
the code and the visualization is only implicit. Our assumption, as designers, is that
users will automatically “get” that relationship. However, as Stasko et al. [1991]
learned in their early studies of algorithm animation, in order for a user to benefit
from an algorithm visualization, the user must understand the mapping from the code
to the graphics. Clearly, the success of the ALVIS LIVE! interface hinges on its
users’ ability to understand the correspondence between the code and the
visualization. In ongoing work, we are developing a correspondence highlighting
scheme that attempts to make the relationship between the code and the visualization
explicit. When the user selects a line of code, the corresponding representation(s) in
35
the animation window highlight. Conversely, when the user selects an object in the
animation window, the corresponding line(s) of code in the code editor highlight. In
an upcoming study, we will experimentally compare an interface with our new
correspondence highlighting scheme against the old interface.
In a second line of future work, we would like to strengthen and expand upon the
empirical case that direct manipulation programming interfaces can promote positive
transfer-of-training to textual programming. To that end, we plan to build a new version
of ALVIS LIVE! that supports both (a) a greatly-expanded programming domain that
includes procedures and linked structures, and (b) an easy means of plugging in
alternative textual language modules (for, e.g., C and Java), and alternative direct
manipulation programming tools appropriate for those alternative languages. In addition
to allowing us to explore the design space of direct manipulation-to-textual language
mappings, this expanded version of ALVIS LIVE! will form the foundation for a series of
new experimental studies that test hypotheses concerning the transferability of
programming skills from the direct manipulation to the textual programming domain.
Key variables to be explored include (a) amount of practice, (b) relative crypticness of
the target textual language (e.g., the C language is more cryptic than the SALSA
language explored in our study), and (c) programming problem size. The ultimate goal
will be to better understand the extent to which direct manipulation programming
interfaces can be leveraged as a training tool for computer programming.
ACKNOWLEDGMENTS
This article is an expanded version of [Hundhausen et al. 2006], which won Best Paper
Award at the 2006 IEEE Symposium on Visual Languages and Human-Centric
Computing in Brighton, U.K. We are grateful to the reviewers of that paper, and to the
audience members at our presentation, for their helpful comments and encouragement to
take this work further. Dr. Nairanjana Dasgupta of the Department of Statistics at
Washington State University assisted with the statistical analyses of the data. Cole
Nevins served as one of the coders of the video data. Daniel Skarpas contributed to the
design of the video coding system and methodology. This research was funded by the
National Science Foundation under grant nos. 0406485 and 0530708.
36
REFERENCES BAKEMAN, R. AND GOTTMAN, J.M. 1996. Observing Iteraction: An Introduction to Sequential Analysis.
Cambridge University Press, Cambridge, England. BEAUGOUEF, T. AND MASON, J. 2005. Why the high attrition rate for computer science students: Some
thoughts and observations. ACM SIGCSE Bulletin 37, 103-106. BEN-BASSAT LEVY, R., BEN-ARI, M. AND URONEN, P. 2003. The Jeliot 2000 program animation system.
Computers & Education 40, 1-15. BERGIN, S., REILLY, R. AND TRAYNOR, D. 2005. Examining the role of self-regulated learning on
introductory programming performance. In Proc. 2005 ACM International Computing Education Research Workshop ACM Press, New York, 81-86.
BESANA, G. AND DETTORI, L. 2004. Together is better: strengthening the confidence of women in computer science via a learning community. Journal of Computing Sciences in Colleges 19, 130-139.
BIRNBAUM, B. AND GOLDMAN, K. 2005. Achieving Flexibility in Direct-Manipulation Programming Environments by Relaxing the Edit-Time Grammar. In Proceedings 2005 IEEE Symposium on Visual Languages and Human-Centric Computing IEEE Press, Los Alamitos, 251-258.
BURNETT, M. AND GOTTFRIED, H. 1998. Graphical definitions: Expanding spreadsheet languages through direct manipulation and gestures. ACM Transactions on Computer-Human Interaction 5, 1-33.
CARLISLE, M., WILSON, T., HUMPHRIES, J. AND HADFIELD, S. 2005. RAPTOR: A visual programming environment for teaching algorithmic problem solving. In Proc. ACM SIGCSE 2005 Symposium ACM Press, New York, 176-180.
CYPHER, A. 1993. Watch What I Do: Programming by Demonstration The MIT Press, Cambridge, MA. DANN, W., COOPER, S. AND PAUSCH, R. 2000. Making the connection: Programming with animated small
world. In Proc. ITiCSE 2000 ACM Press, New York, 41-44. FARLEY, S. 2006. The design and evaluation of a direct manipulation interface for novice programmers. M.S.
thesis, School of Electrical Engineering and Computer Science, Washington State University, Pullman, WA.
GREEN, T.R.G. AND PETRE, M. 1996. Usability analysis of visual programming environments: A 'cognitive dimensions' framework. Journal of Visual Langauges and Computing 7, 131-174.
GUZDIAL, M. 2004. Introduction to computing and programming in Python: A multimedia approach. Prentice Hall, Upper Saddle River, NJ.
GUZDIAL, M. 2004. Programming environments for novices. In Computer science education research, S. FINCHER AND M. PETRE Eds. Taylor & Francis, London, 128-154.
GUZDIAL, M., HOHMANN, L., KONNEMAN, M., WALTON, C. AND SOLOWAY, E. 1998. Supporting programming and learning-to-program with an integrated CAD and scaffolding workbench. Interactive learning environments 6, 143-179.
HUNDHAUSEN, C.D. AND BROWN, J.L. 2005. What You See Is What You Code: A radically dynamic algorithm visualization development model for novice learners. In Proceedings 2005 IEEE Symposium on Visual Languages and Human-Centric Computing IEEE Computer Society, Los Alamitos, 140-147.
HUNDHAUSEN, C.D. AND BROWN, J.L. 2007. An experimental study of the impact of feedback self-selection on novice programming. Journal of Visual Languages and Computing 18, 537-559.
HUNDHAUSEN, C.D. AND BROWN, J.L. 2007. What You See Is What You Code: A 'Live' Algorithm Development and Visualization Environment for Novice Learners. Journal of Visual Languages and Computing 18, 22-47.
HUNDHAUSEN, C.D. AND BROWN, J.L. 2008. Designing, visualizing, and discussing algorithms within a CS 1 studio experience: an empirical study. Computers & Education 50, 301-326.
HUNDHAUSEN, C.D., BROWN, J.L., FARLEY, S. AND SKARPAS, D. 2006. A methodology for analyzing the temporal evolution of novice programs based on semantic components. In Proceedings of the 2006 ACM International Computing Education Research Workshop ACM Press, New York, 45-56.
HUNDHAUSEN, C.D., FARLEY, S. AND BROWN, J.L. 2006. Can direct manipulation lower the barriers to programming and promote positive transfer to textual programming? An experimental study. In Proceedings IEEE 2006 Symposium on Visual Languages and Human-Centric Computing IEEE, Piscataway, NJ, 157-164.
HUNDHAUSEN, C.D., FARLEY, S. AND BROWN, J.L. 2007. Using Semantic Components Analysis to Study the Temporal Evolution of Computer Code: Video Analysis Manual ver. 2.6. http://eecs.wsu.edu/~veupl/pub/VideoAnalysisManual-v2.6.doc. Accessed 20 December 2007.
HUTCHINS, E.L., HOLLAN, J.D. AND NORMAN, D.A. 1985. Direct manipulation interfaces. Human-Computer Interaction 1, 311-338.
KELLEHER, C. AND PAUSCH, R. 2005. Lowering the barriers to programming: A taxonomy of programming environments and languages for novice programmers. ACM Computing Surveys 37, 83-137.
LEGO SYSTEMS, INC. 1998. Lego Mindstorms Robotics Invention System http://mindstorms.lego.com. LIEBERMAN, H. 1993. Tinker: A programming by demonstration system for beginners. In Watch What I Do:
Programming by Demonstration, C. CYPHER Ed. MIT Press, Cambridge, MA.
37
MUDGNO, F., CORBETT, A. AND MYERS, B. 1997. Graphical representation of programs in a demonstrational visual shell—an empirical evaluation. ACM Transactions on Computer-Human Interaction 4, 276-308.
NORMAN, D. AND DRAPER, S. 1986. User-centered system design. Lawrence Erlbaum Assoc., Mahwah, NJ.
ORMEROD, T.C. AND BALL, L.J. 1993. Does Programming Knowledge or Design Strategy Determine Shifts of Focus in Prolog Programming? In Empirical Studies of Programmers: Fifth Workshop, 162-186.
PAIVIO, A. 1983. The empirical case for dual coding. In Imagery, Memory, and Cognition: Essays in Honor of Allan Paivio, J.C. YUILLE Ed. Lawrence Erlbaum Associates, Hillsdale, NJ.
PALUMBO, D.B. 1990. Programming language/problem-solving research: a review of relevant issues. Review of Educational Research 60, 65-89.
PANE, J.F., MYERS, B.A. AND MILLER, L.B. 2002. Using HCI techniques to design a more usable programming system. In Proceedings IEEE 2002 Symposia on Human Centric Computing Languages and Environments IEEE Computer Society, Los Alamitos, 198-206.
PERKINS, D.N. AND MARTIN, F. 1986. Fragile knowledge and neglected strategies in novice programmers. In Empirical Studies of Programmers Ablex, Norwood, NJ, 213-229.
PIROLLI, P. AND RECKER, M. 1994. Learning strategies and transfer in the domain of programming. Cognition and Instruction 12, 235-275.
SCAFFIDI, C., SHAW, M. AND MYERS, B. 2005. Estimating the Numbers of End Users and End User Programmers. In Proceedings of the 2005 IEEE Symposium on Visual Languages and Human-Centric Computing IEEE Press, Los Alamitos, 207-214.
SCHOLTZ, J. AND WIEDENBECK, S. 1993. An analysis of novice programmers learning a second language. In Empirical Studies of Programmers: Fifth Workshop Ablex, Norwood, NJ, 187-205.
SCHOLZ, J. AND WIEDENBECK, S. 1990. Learning second and subsequent programming languages: a problem of transfer. International Journal of Human-Computer Interaction 2, 51-72.
SHNEIDERMAN, B. 1983. Direct manipulation: a step beyond programming languages. IEEE Computer 16, 57-69.
SHROUT, P.E. AND FLEISS, J.L. 1979. Intraclass correlations: Uses in assessing rater reliability. Psychological Bulletin 36, 420-428.
SINGLEY, M. AND ANDERSON, J.R. 1989. The transfer of cognitive skill. Harvard University Press, Cambridge, MA.
SMITH, D.C., CYPHER, A. AND SPOHRER, J. 1994. KidSim: Programming agents without a programming language. Communications of the ACM 37, 54-67.
SOLOWAY, E., BONAR, J. AND EHRLICH, K. 1983. Cognitive strategies and looping consructs: an empirical study. Communications of the ACM 26.
SOLOWAY, E., EHRLICH, K., BONAR, J. AND GREENSPAN, J. 1984. What do novices know about programming? In Directions in Human-Computer Interaction, A. BADRE AND B. SHNEIDERMAN Eds. Ablex, Norwood, NJ, 27-54.
STASKO, J.T. 1991. Using Direct Manipulation to Build Algorithm Animations by Demonstration. In Proceedings of ACM CHI'91 Conference on Human Factors in Computing Systems ACM Press, New York, 307-314.
TECHSMITH, CORP. 2007. Morae Recorder. http://www.morae.com. Accessed 13 December 2007. VAN MERRIENBOER, J.J.G. AND SWELLER, J. 2005. Cognitive load theory and complex learning: Recent
developments and future directions. Educational Psychology Review 17, 147-177.
38
STATEMENT OF RELATIONSHIP OF THIS SUBMISSION TO PRIOR PAPERS
This TOCHI submission is a greatly expanded version of [Hundhausen et al. 2006],
which won the Best Paper Award at the 2006 IEEE Symposium on Visual Languages and
Human-Centric Computing in Brighton, U.K. Given the positive reception of the paper at
that conference, and given the paper’s strong focus on the human-computer interaction
issues surrounding novice computer programming interfaces, we wanted to communicate
our results to the TOCHI audience, who we thought would especially appreciate an
expanded archival version of the research. In particular, while roughly 50 percent of this
submission’s content is drawn directly from our previous conference paper, this
submission significantly extends and clarifies our results in three key ways:
• We have expanded our review of related work to include past studies of transfer-of-
training within the domain of computer programming.
• We have performed a more rigorous statistical analysis of our results to solidify the
direct manipulation interface’s ability to promote transfer of training.
• We have performed an extensive post-hoc video analysis of participants’ task 1 and
task 3 sessions. In [Hundhausen, Brown, Farley and Skarpas 2006], we introduced
the novel analysis technique we employ in this submission: semantic component
analysis. Thus, a secondary benefit of this submission is that it introduces to the
TOCHI audience a novel HCI sequential data analysis technique that can be used in
analyses of computer programming tasks. The primary benefit of our post-hoc video
analysis, however, is that it significantly expands and clarifies our original results in
three ways:
o by identifying programming process differences promoted by our direct
manipulation interface;
o by suggesting how such process differences could lead to the significant
performance differences we observed; and
o by providing timeline visualizations of how representative participants
approached our study tasks; these timeline visualizations contribute
“gestalt” views of participants’ programming activities, helping to shed
further qualitative light on our quantitative results.