NORTHERN RIVER BASINS STUDY PROJECT REPORT NO. 143 BONAR: A DATABASE FOR BENTHOS OF PEACE, ATHABASCA AND SLAVE RIVER BASINS: USER’S GUIDE ATHABASCA UNIVERSITY LIBRARY 3 1510 00168 6642 QH 91.8 . B4 093 199b Canada Axna Northwest Territories Northern River Basins Study
Transcript
NORTHERN RIVER BASINS STUDY PROJECT REPORT NO. 143
BONAR: A DATABASE FOR BENTHOS OF
PEACE, ATHABASCA AND SLAVE RIVER BASINS:
USER’S GUIDE
ATHABASCA UNIVERSITY LIBRARY
3 1510 00168 6642
QH91.8 . B4 093 199b
Canada Axna NorthwestTerritories
Northern River Basins Study
QH /9 1.8/.B4/093/1996 Bonar : a database for Ouellette, Mark S. J
168664U A I t= U U C
BR O D AR T C a - N o 2 3 -2 2 1
0 * 0 * 9 0
Prepared for the Northern River Basins Study
under Project 5211-D1
by
Mark S. J. Ouellett and Kevin J. CashNational Hydrology Research Institute, Environment Canada
NORTHERN RIVER BASINS STUDY PROJECT REPORT NO. 143
BONAR: A DATABASE FOR BENTHOS OF
PEACE, ATHABASCA AND SLAVE RIVER BASINS:
USER’S GUIDE
Published by the Northern River Basins Study
Edmonton, Alberta April, 1996
OCT 3 1 1396
LIBRARY
CANADIAN CATALOGUING IN PUBLICATION DATA
Ouellette, Mark S. J.
Bonar: a database for benthos of Peace, Athabasca and Slave River Basins : user’s guide
(Northern River Basins Study project report,ISSN 1192-3571 ; no. 143)Includes bibliographical references.ISBN 0-662-24832-5 Cat. no. R71-49/3-143E
1. Benthos -- Alberta - Athabasca River Watershed - Databases - Handbooks, manuals, etc.2. Benthos - Peace River Watershed (B.C. and Alta.)- Databases — Handbooks, manuals, etc.3. Benthos - Slave River Watershed (Alta, and N.W.T.)- Databases - Handbooks, manuals, etc.I. Cash, Kevin J. (Kevin Joseph), 1959-II. Northern River Basins Study (Canada)III. Title.IV. Series.
The Northern River Basins Study was initiated through the "Canada-Alberta-Northwest Territories Agreement Respecting the Peace-Athabasca-Slave River Basin Study, Phase II - Technical Studies" which was signed September 27, 1991. The purpose of the Study is to understand and characterize the cumulative effects of development on the water and aquatic environment of the Study Area by coordinating with existing programs and undertaking appropriate new technical studies.
This publication reports the method and findings of particular work conducted as part of the Northern River Basins Study. As such, the work was governed by a specific terms of reference and is expected to contribute information about the Study Area within the context of the overall study as described by the Study Final Report. This report has been reviewed by the Study Science Advisory Committee in regards to scientific content and has been approved by the Study Board of Directors for public release.
It is explicit in the objectives of the Study to report the results of technical work regularly to the public. This objective is served by distributing project reports to an extensive network of libraries, agencies, organizations and interested individuals and by granting universal permission to reproduce the material.
This report contains referenced data obtained from sources external to the Northern River Basins Study. Individuals interested in using external data must obtain permission to do so from the donor agency.
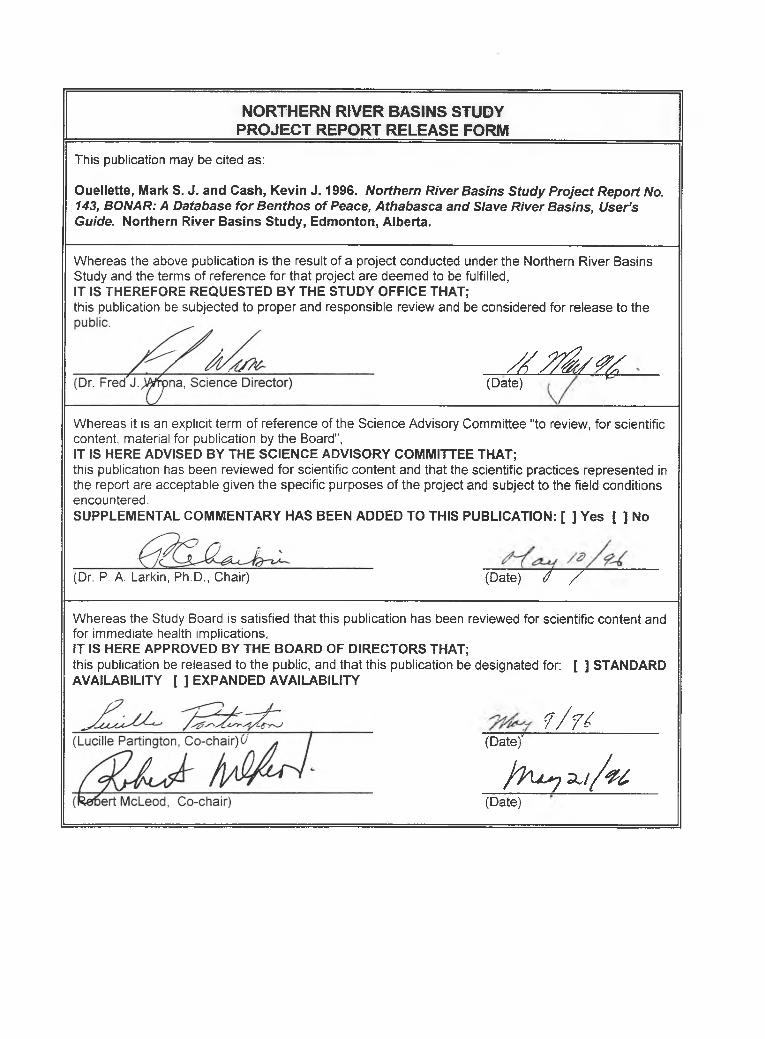
NORTHERN RIVER BASINS STUDY PROJECT REPORT RELEASE FORM
This publication may be cited as:
Ouellette, Mark S. J. and Cash, Kevin J. 1996. Northern River Basins Study Project Report No. 143, BONAR: A Database for Benthos of Peace, Athabasca and Slave River Basins, User’s Guide. Northern River Basins Study, Edmonton, Alberta.
Whereas the above publication is the result of a project conducted under the Northern River Basins Study and the terms of reference for that project are deemed to be fulfilled,IT IS THEREFORE REQUESTED BY THE STUDY OFFICE THAT;this publication be subjected to proper and responsible review and be considered for release to the
(Date)/ / M / ^
Whereas it is an explicit term of reference of the Science Advisory Committee "to review, for scientific content, material for publication by the Board",IT IS HERE ADVISED BY THE SCIENCE ADVISORY COMMITTEE THAT;this publication has been reviewed for scientific content and that the scientific practices represented in the report are acceptable given the specific purposes of the project and subject to the field conditions encountered.SUPPLEMENTAL COMMENTARY HAS BEEN ADDED TO THIS PUBLICATION: [ ] Yes [ ] No
(Dr. P. A. Larkin, Ph.D., Chair) (Date) / /
Whereas the Study Board is satisfied that this publication has been reviewed for scientific content and for immediate health implications,IT IS HERE APPROVED BY THE BOARD OF DIRECTORS THAT;this publication be released to the public, and that this publication be designated for: [ ] STANDARD AVAILABILITY [ ] EXPANDED AVAILABILITY
f/f/(Date/
j h x + j z . i / v t(Date)
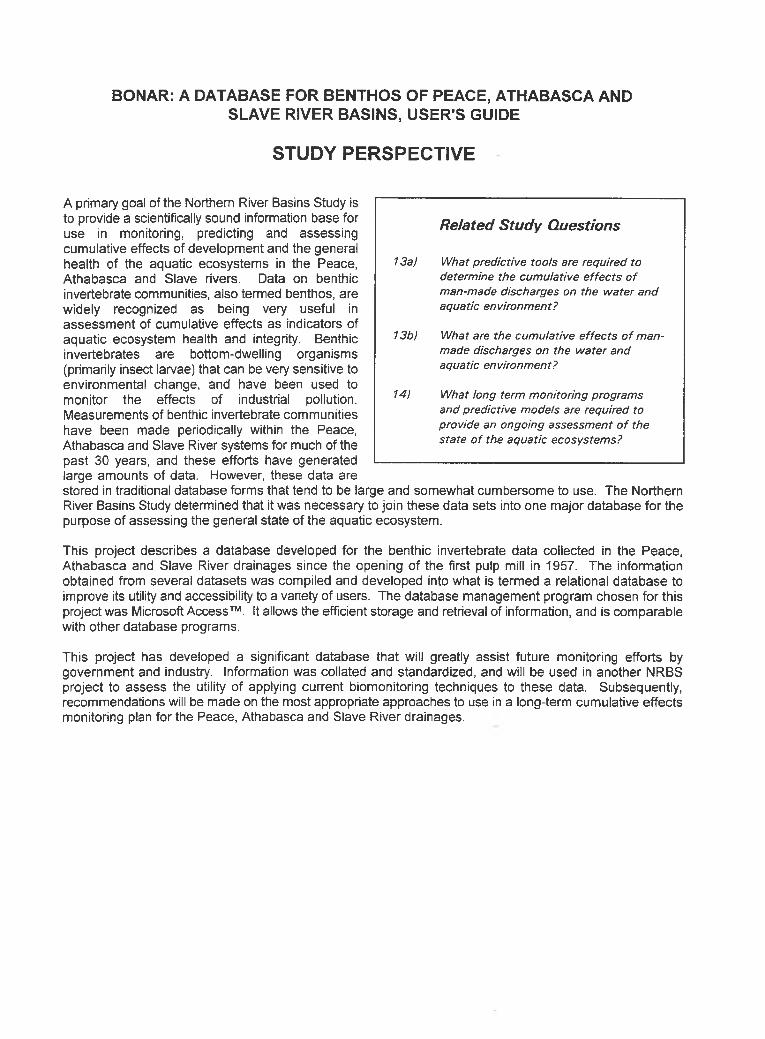
BONAR: A DATABASE FOR BENTHOS OF PEACE, ATHABASCA AND SLAVE RIVER BASINS, USER’S GUIDE
STUDY PERSPECTIVE
A primary goal of the Northern River Basins Study is to provide a scientifically sound information base for use in monitoring, predicting and assessing cumulative effects of development and the general health of the aquatic ecosystems in the Peace,Athabasca and Slave rivers. Data on benthic invertebrate communities, also termed benthos, are widely recognized as being very useful in assessment of cumulative effects as indicators of aquatic ecosystem health and integrity. Benthic invertebrates are bottom-dwelling organisms (primarily insect larvae) that can be very sensitive to environmental change, and have been used to monitor the effects of industrial pollution.Measurements of benthic invertebrate communities have been made periodically within the Peace,Athabasca and Slave River systems for much of the past 30 years, and these efforts have generated large amounts of data. However, these data are stored in traditional database forms that tend to be large and somewhat cumbersome to use. The Northern River Basins Study determined that it was necessary to join these data sets into one major database for the purpose of assessing the general state of the aquatic ecosystem.
This project describes a database developed for the benthic invertebrate data collected in the Peace, Athabasca and Slave River drainages since the opening of the first pulp mill in 1957. The information obtained from several datasets was compiled and developed into what is termed a relational database to improve its utility and accessibility to a variety of users. The database management program chosen for this project was Microsoft Access™. It allows the efficient storage and retrieval of information, and is comparable with other database programs.
This project has developed a significant database that will greatly assist future monitoring efforts by government and industry. Information was collated and standardized, and will be used in another NRBS project to assess the utility of applying current biomonitoring techniques to these data. Subsequently, recommendations will be made on the most appropriate approaches to use in a long-term cumulative effects monitoring plan for the Peace, Athabasca and Slave River drainages.
Related Study Questions
13a) What predictive tools are required to determine the cumulative e ffec ts o f man-made discharges on the w ater and aquatic environment?
13b) W hat are the cum ulative e ffects o f manmade discharges on the w ater and aquatic environment?
14) What long term m onitoring programs and predictive models are required to provide an ongoing assessment o f the state o f the aquatic ecosystems?
Report Summary
On behalf of the NRBS, historical data on macroinvertebrate collections in the Peace, Athabasca and Slave river drainages were assembled, standardized and compiled in a database (for further information, see NRBS Project Report No. 123). This report provides an illustrated description of the database, and instructions for use thereof. The database is in Microsoft Access™, and requires the program to run.
i
Acknowledgments
The authors would like to thank Slave Lake Pulp Corporation, Weldwood of Canada Limited (Hinton), Weyerhaeuser Canada Ltd. (Grande Prairie), Millar Western Pulp Ltd., Alberta Newsprint Company and Alberta Environmental Protection for access to the original data sets. Dr. Garry Scrimgeour (University of Alberta), Sentar Consulting Ltd., Terrestrial & Aquatic Environmental Managers Ltd. (Saskatoon), and EVS Consultants (Vancouver) provided copies of the data. Dr. Anne-Marie Anderson of Alberta Environmental Protection assisted in the identification of data sources. This research was funded by Northern River Basins Study Contract 5211-D1, and by Dr. Fred Wrona of the National Hydrology Research Institute. The document was enhanced by the comments of several reviewers.
11
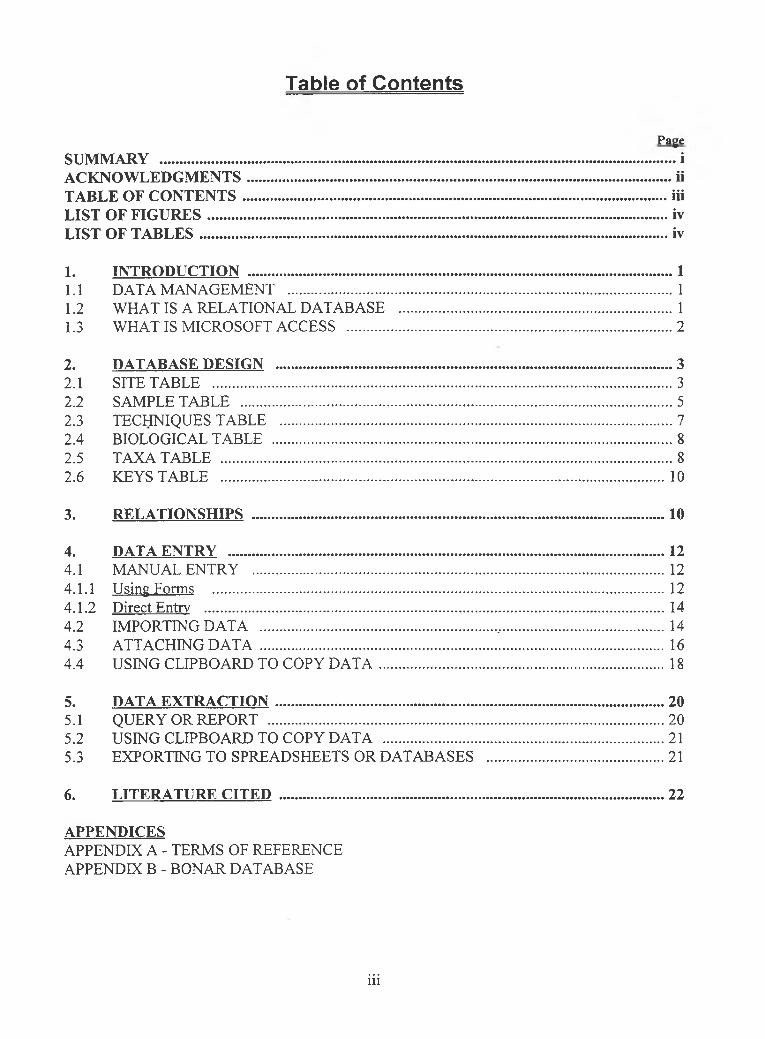
Table of Contents
PageSUMMARY ............................................................. iACKNOWLEDGMENTS..................................................... iiTABLE OF CONTENTS........................................................................................................... iiiLIST OF FIGURES.................................................................................................................... ivLIST OF TABLES...................................................................................................................... iv
1. INTRODUCTION ........................................................................................................... 11.1 DATA MANAGEMENT ................................................................................................. 11.2 WHAT IS A RELATIONAL DATABASE ...................................................................... 11.3 WHAT IS MICROSOFT ACCESS ................................................................................... 2
4. DATA ENTRY .............................................................................................................. 124.1 MANUAL ENTRY ........................................................................................................ 124.1.1 Using Forms .................................................................................................................. 124.1.2 Direct Entry ................................................................................................................. 144.2 IMPORTING DATA ........................................................... 144.3 ATTACHING DATA ...................................................................................................... 164.4 USING CLIPBOARD TO COPY DATA.........................................................................18
5. DATA EXTRACTION .................................................................................................. 205.1 QUERY OR REPORT .................................................................................................... 205.2 USING CLIPBOARD TO COPY DATA .................................. 215.3 EXPORTING TO SPREADSHEETS OR DATABASES ............................................. 21
6. LITERATURE CITED ................................................................................................. 22
APPENDICESAPPENDIX A - TERMS OF REFERENCE APPENDIX B - BONAR DATABASE
iii
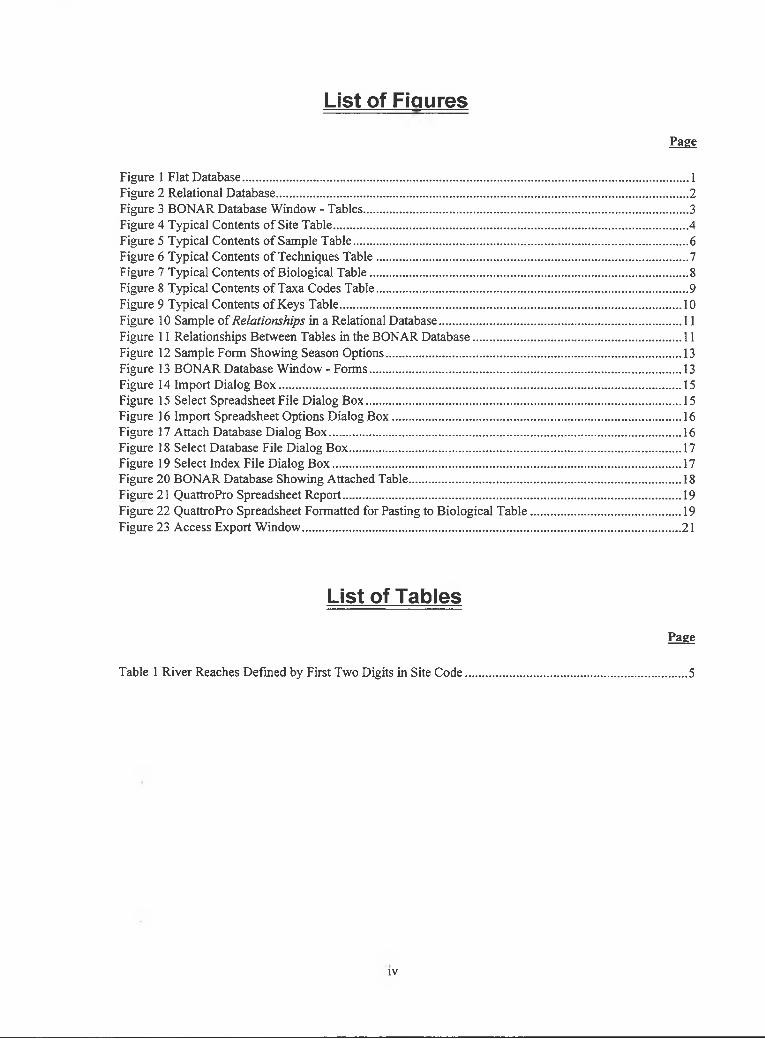
List of Figures
Page
Figure 1 Flat Database......................................................................................................................................1Figure 2 Relational Database...........................................................................................................................2Figure 3 BONAR Database Window - Tables.................................................................................................3Figure 4 Typical Contents of Site Table..........................................................................................................4Figure 5 Typical Contents of Sample Table....................................................................................................6Figure 6 Typical Contents of Techniques Table.............................................................................................7Figure 7 Typical Contents of Biological Table...............................................................................................8Figure 8 Typical Contents of Taxa Codes Table.............................................................................................9Figure 9 Typical Contents of Keys Table...................................................................................................... 10Figure 10 Sample of Relationships in a Relational Database........................................................................ 11Figure 11 Relationships Between Tables in the BONAR Database.............................................................. 11Figure 12 Sample Form Showing Season Options.........................................................................................13Figure 13 BONAR Database Window - Forms............................................................................................. 13Figure 14 Import Dialog Box........................................................................................................................ 15Figure 15 Select Spreadsheet File Dialog Box.............................................................................................. 15Figure 16 Import Spreadsheet Options Dialog Box...................................................................................... 16Figure 17 Attach Database Dialog Box......................................................................................................... 16Figure 18 Select Database File Dialog Box................................................................................................... 17Figure 19 Select Index File Dialog Box........................................................................................................ 17Figure 20 BONAR Database Showing Attached Table................................................................................. 18Figure 21 QuattroPro Spreadsheet Report..................................................................................................... 19Figure 22 QuattroPro Spreadsheet Formatted for Pasting to Biological Table.............................................19Figure 23 Access Export Window................................................................................................................. 21
List of Tables
Page
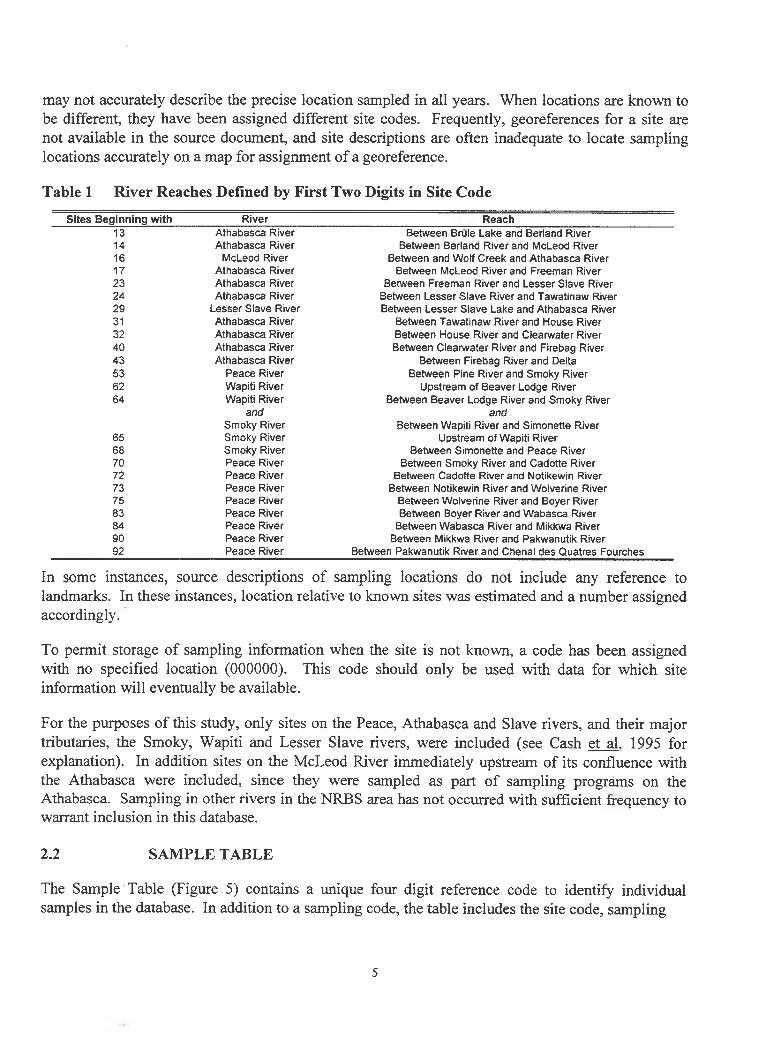
Table 1 River Reaches Defined by First Two Digits in Site Code.................................................................. 5
IV
1. INTRODUCTION
The objective of this document is to describe the database developed for the Northern River Basins Study (NRBS) of benthic invertebrate data collected in the NRBS since the opening of the first pulp mill in the area (1957).
1.1 DATA MANAGEMENT
Monitoring of biological systems usually generates large amounts of data. For any productive use of this data to occur, a system for identifying and extracting specific data points must be available. Standard techniques involve storage of information in spreadsheet files, where the data can be easily manipulated, and from which extracts can be made for analyses. However, when environmental monitoring involves management of very large amounts of data, spreadsheets are no longer an adequate means for storing and manipulating this data. In these instances, data is generally stored in a database.
1.2 WHAT IS A RELATIONAL DATABASE
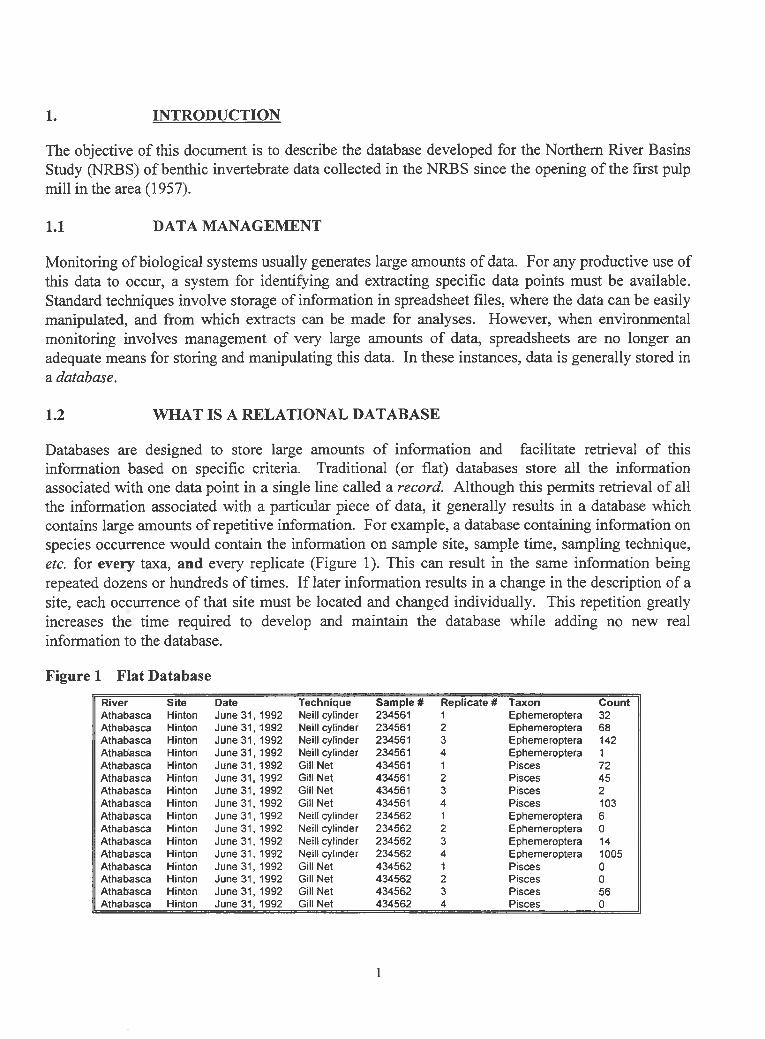
Databases are designed to store large amounts of information and facilitate retrieval of this information based on specific criteria. Traditional (or flat) databases store all the information associated with one data point in a single line called a record. Although this permits retrieval of all the information associated with a particular piece of data, it generally results in a database which contains large amounts of repetitive information. For example, a database containing information on species occurrence would contain the information on sample site, sample time, sampling technique, etc. for every taxa, and every replicate (Figure 1). This can result in the same information being repeated dozens or hundreds of times. If later information results in a change in the description of a site, each occurrence of that site must be located and changed individually. This repetition greatly increases the time required to develop and maintain the database while adding no new real information to the database.
Figure 1 Flat DatabaseRiver Site Date Technique Sam ple # Replicate # Taxon CountAthabasca Hinton June 31, 1992 Neill cylinder 234561 1 Ephemeroptera 32Athabasca Hinton June 31, 1992 Neill cylinder 234561 2 Ephemeroptera 68Athabasca Hinton June 31, 1992 Neill cylinder 234561 3 Ephemeroptera 142Athabasca Hinton June 31, 1992 Neill cylinder 234561 4 Ephemeroptera 1Athabasca Hinton June 31, 1992 Gill Net 434561 1 Pisces 72Athabasca Hinton June 31, 1992 Gill Net 434561 2 Pisces 45Athabasca Hinton June 31, 1992 Gill Net 434561 3 Pisces 2Athabasca Hinton June 31, 1992 Gill Net 434561 4 Pisces 103Athabasca Hinton June 31, 1992 Neill cylinder 234562 1 Ephemeroptera 6Athabasca Hinton June 31, 1992 Neill cylinder 234562 2 Ephemeroptera 0Athabasca Hinton June 31, 1992 Neill cylinder 234562 3 Ephemeroptera 14Athabasca Hinton June 31, 1992 Neill cylinder 234562 4 Ephemeroptera 1005Athabasca Hinton June 31, 1992 Gill Net 434562 1 Pisces 0Athabasca Hinton June 31, 1992 Gill Net 434562 2 Pisces 0Athabasca Hinton June 31, 1992 Gill Net 434562 3 Pisces 56Athabasca Hinton June 31, 1992 Gill Net 434562 4 Pisces 0
1
Traditional databases also tend to be large and somewhat cumbersome to use because of this replication of data. The need to repeat the entry of information also increases the likelihood of data entry errors, and results in increased time to extract information. For most users, databases are employed for data storage, but manipulation and analysis of the data generally occurs in spreadsheet or other programs. The inclusion of all the repeated information means additional “clean-up” time must be spent in the other programs.
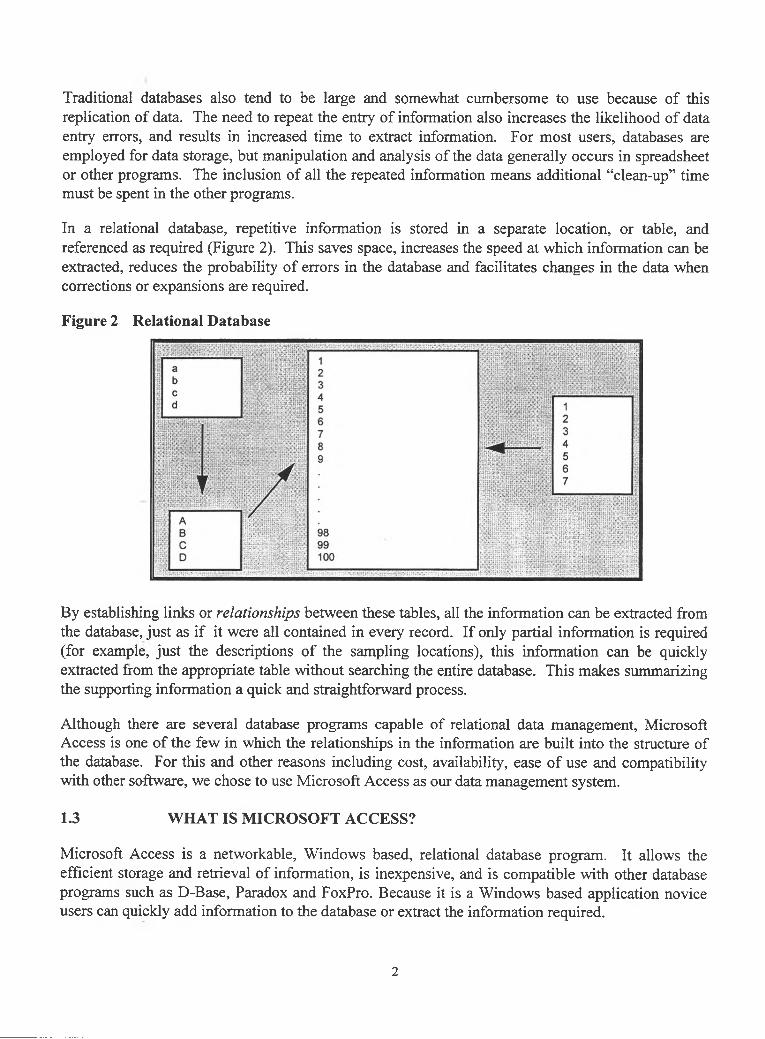
In a relational database, repetitive information is stored in a separate location, or table, and referenced as required (Figure 2). This saves space, increases the speed at which information can be extracted, reduces the probability of errors in the database and facilitates changes in the data when corrections or expansions are required.
Figure 2 Relational Database
By establishing links or relationships between these tables, all the information can be extracted from the database, just as if it were all contained in every record. If only partial information is required (for example, just the descriptions of the sampling locations), this information can be quickly extracted from the appropriate table without searching the entire database. This makes summarizing the supporting information a quick and straightforward process.
Although there are several database programs capable of relational data management, Microsoft Access is one of the few in which the relationships in the information are built into the structure of the database. For this and other reasons including cost, availability, ease of use and compatibility with other software, we chose to use Microsoft Access as our data management system.
1.3 WHAT IS MICROSOFT ACCESS?
Microsoft Access is a networkable, Windows based, relational database program. It allows the efficient storage and retrieval of information, is inexpensive, and is compatible with other database programs such as D-Base, Paradox and FoxPro. Because it is a Windows based application novice users can quickly add information to the database or extract the information required.
2
Microsoft Access can import and export spreadsheet or ASCII files and can import files from other database programs. It can also link directly to data stored in other database programs without importing this data, reading and writing directly to the original file. This assures that users always have access to the most current version of the data, and eliminates the problems associated with multiple copies of the same data.
Entry of data into the database can be facilitated by creating templates (forms) in Access which match the design of existing paper forms. Data can be presented in presentation quality reports, and can be conveniently manipulated for export to other computer packages (such as statistical or graphical programs).
It is not the intention of this document to duplicate material already adequately described in the manuals for Microsoft Access. Consequently, it is advisable for users to have available to them a copy of the Microsoft Access User’s Guide to provide more detailed information on some of the features discussed below, and to expand their use of the database beyond the features discussed in this document.
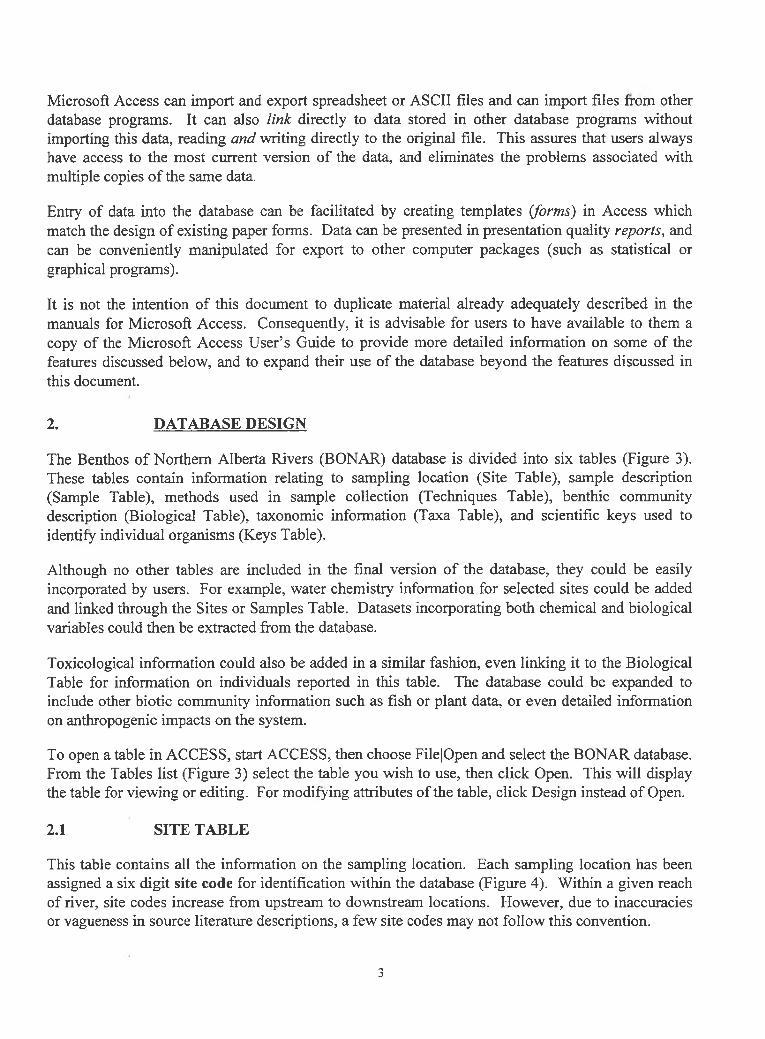
2. DATABASE DESIGN
The Benthos of Northern Alberta Rivers (BONAR) database is divided into six tables (Figure 3). These tables contain information relating to sampling location (Site Table), sample description (Sample Table), methods used in sample collection (Techniques Table), benthic community description (Biological Table), taxonomic information (Taxa Table), and scientific keys used to identify individual organisms (Keys Table).
Although no other tables are included in the final version of the database, they could be easily incorporated by users. For example, water chemistry information for selected sites could be added and linked through the Sites or Samples Table. Datasets incorporating both chemical and biological variables could then be extracted from the database.
Toxicological information could also be added in a similar fashion, even linking it to the Biological Table for information on individuals reported in this table. The database could be expanded to include other biotic community information such as fish or plant data, or even detailed information on anthropogenic impacts on the system.
To open a table in ACCESS, start ACCESS, then choose File|Open and select the BONAR database. From the Tables list (Figure 3) select the table you wish to use, then click Open. This will display the table for viewing or editing. For modifying attributes of the table, click Design instead of Open.
2.1 SITE TABLE
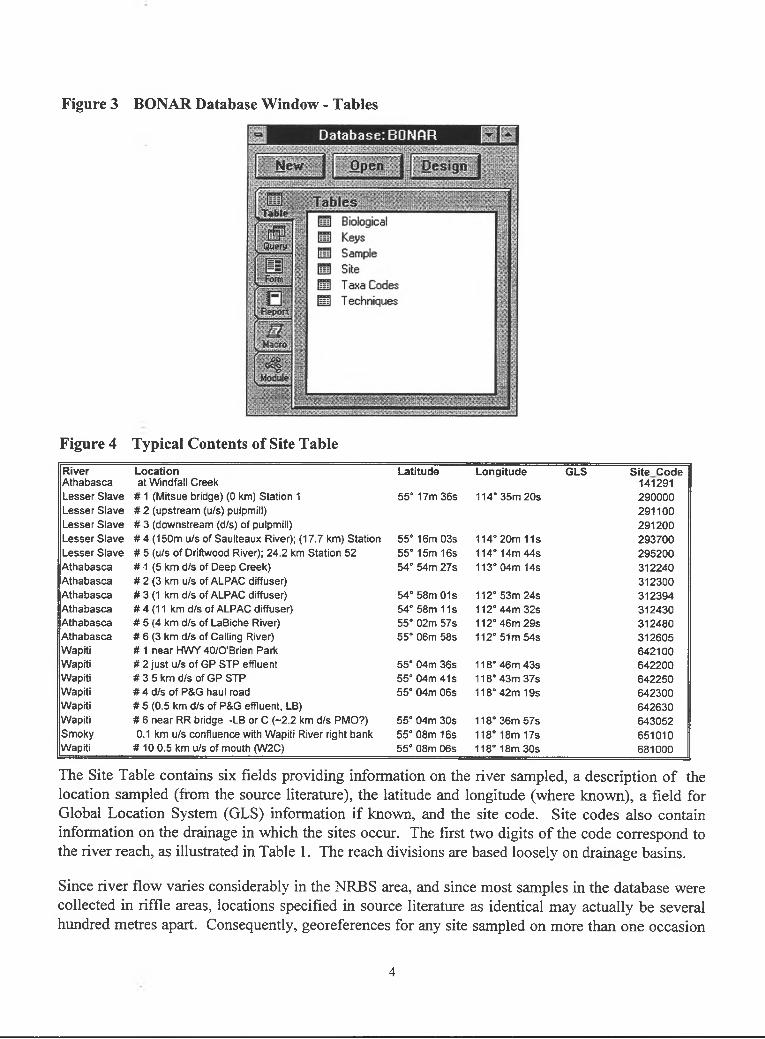
This table contains all the information on the sampling location. Each sampling location has been assigned a six digit site code for identification within the database (Figure 4). Within a given reach of river, site codes increase from upstream to downstream locations. However, due to inaccuracies or vagueness in source literature descriptions, a few site codes may not follow this convention.
3
Figure 3 BONAR Database Window - Tables
BiologicalKeysSampleSiteT axa Codes T echniques
Database: BONfiR
Figure 4 Typical Contents of Site TableR iver Loca tion La titude Long itude GLS S ite CodeAthabasca at W indfall Creek 141291Lesser Slave # 1 (Mitsue bridge) (0 km) Station 1 55° 17m 36s 114° 35m 20s 290000Lesser Slave # 2 (upstream (u/s) pulpmill) 291100Lesser Slave # 3 (downstream (d/s) of pulpmill) 291200Lesser Slave # 4 (150m u/s o f Saulteaux River); (17.7 km) Station 55° 16m 03s 114° 20m 11s 293700Lesser Slave # 5 (u/s o f Driftwood River); 24.2 km Station 52 55° 15m 16s 114° 14m 44s 295200Athabasca # -1 (5 km d/s of Deep Creek) 54° 54m 27s 113° 04m 14s 312240Athabasca # 2 (3 km u/s of ALPAC diffuser) 312300Athabasca # 3 (1 km d/s of ALPAC diffuser) 54° 58m 01s 1 1 2°53m 24s 312394Athabasca # 4 (11 km d/s o f ALPAC diffuser) 54° 58m 11s 112° 44m 32s 312430Athabasca # 5 (4 km d/s of LaBiche River) 55° 02m 57s 112° 46m 29s 312480Athabasca # 6 (3 km d/s of Calling River) 55° 06m 58s 112° 51m 54s 312605Wapiti # 1 near HWY 40/O'Brien Park 642100W apiti # 2 just u/s of GP STP effluent 55° 04m 36s 118° 46m 43s 642200W apiti # 3 5 km d/s of GP STP 55° 04m 41s 118° 43m 37s 642250W apiti # 4 d/s o f P&G haul road 55° 04m 06s 118° 42m 19s 642300W apiti # 5 (0.5 km d/s o f P&G effluent, LB) 642630W apiti # 6 near RR bridge -LB or C (~2.2 km d/s PMO?) 55° 04m 30s 118° 36m 57s 643052Smoky 0.1 km u/s confluence with W apiti River right bank 55° 08m 16s 118° 18m 17s 651010Wapiti # 10 0.5 km u/s of mouth (W2C) 55° 08m 06s 118° 18m 30s 681000
The Site Table contains six fields providing information on the river sampled, a description of the location sampled (from the source literature), the latitude and longitude (where known), a field for Global Location System (GLS) information if known, and the site code. Site codes also contain information on the drainage in which the sites occur. The first two digits of the code correspond to the river reach, as illustrated in Table 1. The reach divisions are based loosely on drainage basins.
Since river flow varies considerably in the NRBS area, and since most samples in the database were collected in riffle areas, locations specified in source literature as identical may actually be several hundred metres apart. Consequently, georeferences for any site sampled on more than one occasion
4
may not accurately describe the precise location sampled in all years. When locations are known to be different, they have been assigned different site codes. Frequently, georeferences for a site are not available in the source document, and site descriptions are often inadequate to locate sampling locations accurately on a map for assignment of a georeference.
Table 1 River Reaches Defined by First Two Digits in Site CodeS ites B e g in n in g w ith R iver Reach
13 Athabasca River Between Brule Lake and Berland River14 Athabasca River Between Berland River and McLeod River16 McLeod River Between and W olf Creek and Athabasca River17 Athabasca River Between McLeod River and Freeman River23 Athabasca River Between Freeman River and Lesser Slave River24 Athabasca River Between Lesser Slave River and Tawatinaw River29 Lesser Slave River Between Lesser Slave Lake and Athabasca River31. Athabasca River Between Tawatinaw River and House River32 Athabasca River Between House River and Clearwater River40 Athabasca River Between Clearwater River and Firebag River43 Athabasca River Between Firebag River and Delta53 Peace River Between Pine River and Smoky River62 W apiti River Upstream o f Beaver Lodge River64 W apiti River Between Beaver Lodge River and Smoky River
and andSmoky River Between W apiti River and Simonette River
65 Smoky River Upstream of W apiti River68 Smoky River Between Simonette and Peace River70. Peace River Between Smoky River and Cadotte River72 Peace River Between Cadotte River and Notikewin River73 Peace River Between Notikewin River and W olverine River75 Peace River Between W olverine River and Boyer River83 Peace River Between Boyer River and W abasca River84 Peace River Between W abasca River and Mikkwa River90 Peace River Between Mikkwa River and Pakwanutik River92 Peace River Between Pakwanutik River and Chenal des Quatres Fourches
In some instances, source descriptions of sampling locations do not include any reference to landmarks. In these instances, location relative to known sites was estimated and a number assigned accordingly.
To permit storage of sampling information when the site is not known, a code has been assigned with no specified location (000000). This code should only be used with data for which site information will eventually be available.
For the purposes of this study, only sites on the Peace, Athabasca and Slave rivers, and their major tributaries, the Smoky, Wapiti and Lesser Slave rivers, were included (see Cash et ah 1995 for explanation). In addition sites on the McLeod River immediately upstream of its confluence with the Athabasca were included, since they were sampled as part of sampling programs on the Athabasca. Sampling in other rivers in the NRBS area has not occurred with sufficient frequency to warrant inclusion in this database.
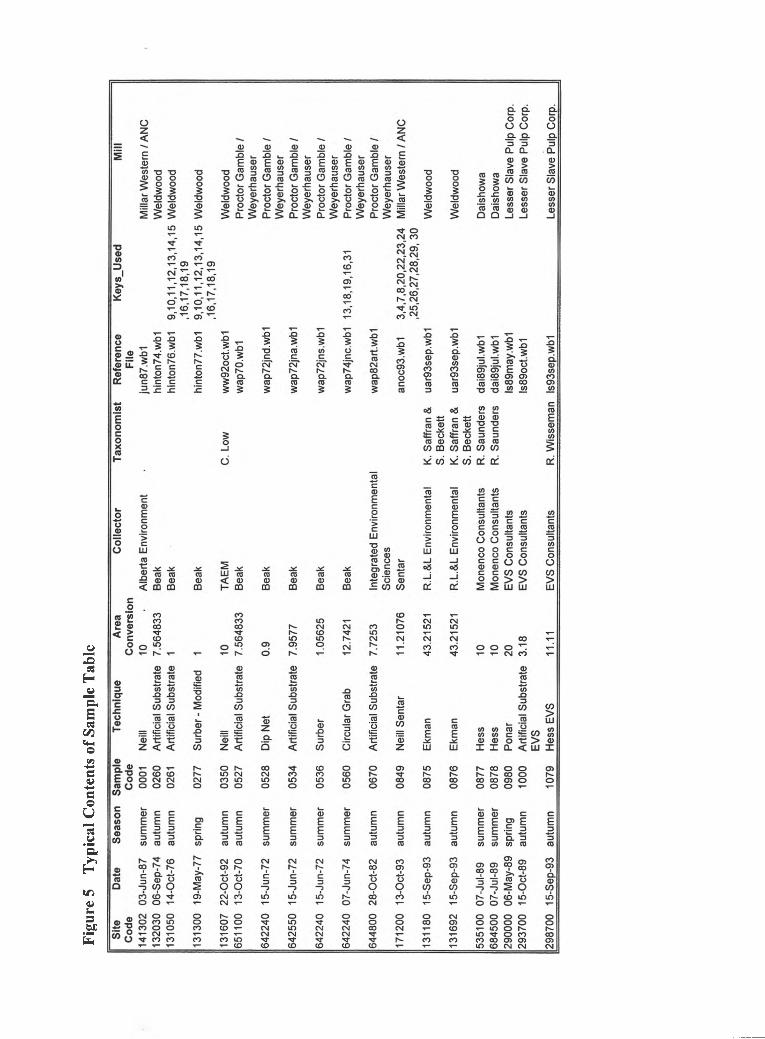
2.2 SAMPLE TABLE
The Sample Table (Figure 5) contains a unique four digit reference code to identify individual samples in the database. In addition to a sampling code, the table includes the site code, sampling
5
Figu
re 5
T
ypic
al C
onte
nts
of S
ampl
e Ta
ble
date and season, collection technique, a conversion factor for converting the values provided in the dataset to density per square metre and, agency that collected the sample. When known, the name of the taxonomist overseeing identification of the animals is also included. For sample data imported from other programs, the name of the source file is also included in this table. A field is provided to identify the taxonomic keys used in identification of the animals in the sample, using the codes assigned in the Keys Table.
To facilitate extraction of information on specific industrial sites, a field is included for identification of the industry around which the samples were collected. For studies which are not focused on a single industrial source, the descriptor “synoptic” has been used.
Because samples collected at unidentified locations have little value, samples must reference a pre- established site in the Site Table (see note under Site Table regarding unspecified locations). There is also a link to the Techniques Table requiring identification of the sampling methodology.
2.3 TECHNIQUES TABLE
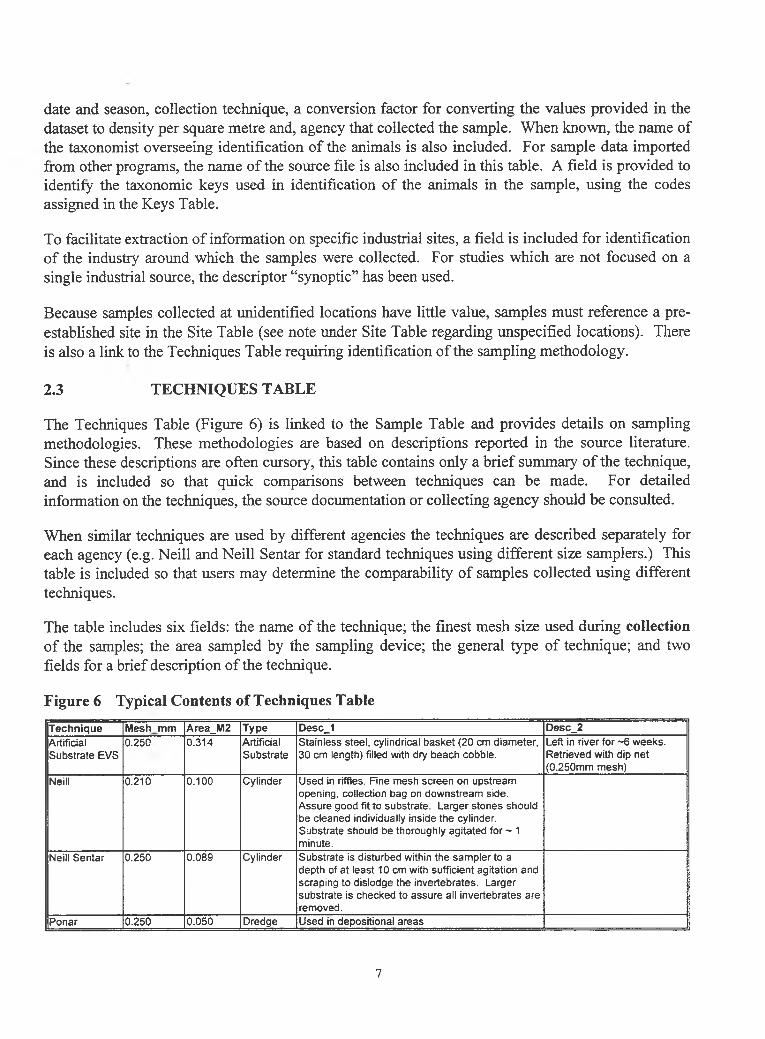
The Techniques Table (Figure 6) is linked to the Sample Table and provides details on sampling methodologies. These methodologies are based on descriptions reported in the source literature. Since these descriptions are often cursory, this table contains only a brief summary of the technique, and is included so that quick comparisons between techniques can be made. For detailed information on the techniques, the source documentation or collecting agency should be consulted.
When similar techniques are used by different agencies the techniques are described separately for each agency (e.g. Neill and Neill Sentar for standard techniques using different size samplers.) This table is included so that users may determine the comparability of samples collected using different techniques.
The table includes six fields: the name of the technique; the finest mesh size used during collection of the samples; the area sampled by the sampling device; the general type of technique; and two fields for a brief description of the technique.
Figure 6 Typical Contents of Techniques Table
Technique M e s h m m Area_M2 Type Desc_1 Desc_2Artificial Substrate EVS
0.250 0.314 ArtificialSubstrate
Stainless steel, cylindrical basket (20 cm diameter, 30 cm length) filled with dry beach cobble.
Left in river for ~6 weeks. Retrieved with dip net (0.250mm mesh)
Neill 0.210 0.100 Cylinder Used in riffles. Fine mesh screen on upstream opening, collection bag on downstream side. Assure good fit to substrate. Larger stones should be cleaned individually inside the cylinder. Substrate should be thoroughly agitated for ~ 1 minute.
Neill Sentar 0.250 0.089 Cylinder Substrate is disturbed within the sampler to a depth of at least 10 cm with sufficient agitation and scraping to dislodge the invertebrates. Larger substrate is checked to assure all invertebrates are removed.
Ponar 0.250 0.050 Dredge Used in depositional areas
7
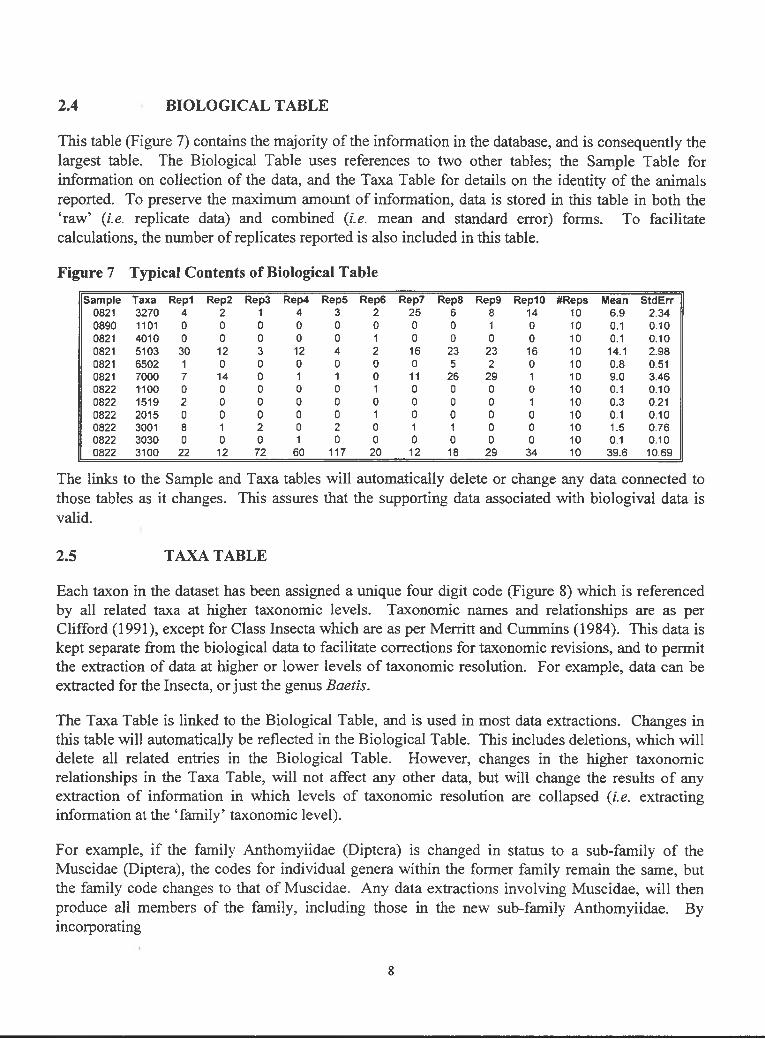
2.4 BIOLOGICAL TABLE
This table (Figure 7) contains the majority of the information in the database, and is consequently the largest table. The Biological Table uses references to two other tables; the Sample Table for information on collection of the data, and the Taxa Table for details on the identity of the animals reported. To preserve the maximum amount of information, data is stored in this table in both the ‘raw’ (i.e. replicate data) and combined (/.e. mean and standard error) forms. To facilitate calculations, the number of replicates reported is also included in this table.
The links to the Sample and Taxa tables will automatically delete or change any data connected to those tables as it changes. This assures that the supporting data associated with biologival data is valid.
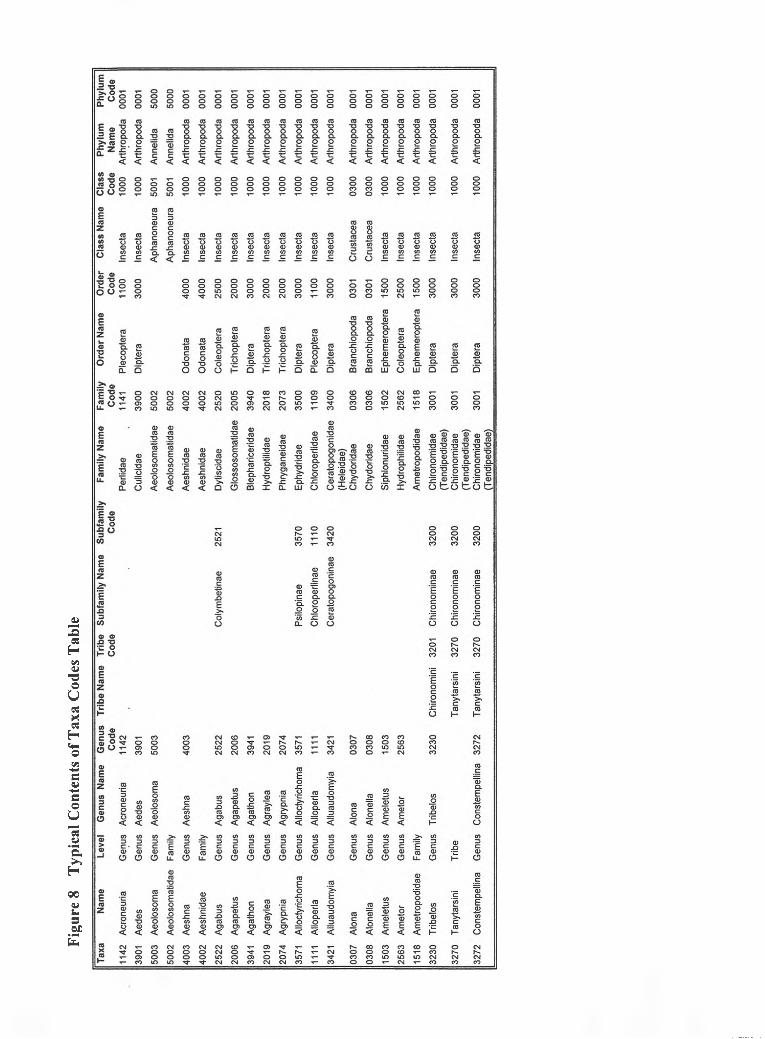
2.5 TAXA TABLE
Each taxon in the dataset has been assigned a unique four digit code (Figure 8) which is referenced by all related taxa at higher taxonomic levels. Taxonomic names and relationships are as per Clifford (1991), except for Class Insecta which are as per Merritt and Cummins (1984). This data is kept separate from the biological data to facilitate corrections for taxonomic revisions, and to permit the extraction of data at higher or lower levels of taxonomic resolution. For example, data can be extracted for the Insecta, or just the genus Baetis.
The Taxa Table is linked to the Biological Table, and is used in most data extractions. Changes in this table will automatically be reflected in the Biological Table. This includes deletions, which will delete all related entries in the Biological Table. However, changes in the higher taxonomic relationships in the Taxa Table, will not affect any other data, but will change the results of any extraction of information in which levels of taxonomic resolution are collapsed (i.e. extracting information at the ‘family’ taxonomic level).
For example, if the family Anthomyiidae (Diptera) is changed in status to a sub-family of the Muscidae (Diptera), the codes for individual genera within the former family remain the same, but the family code changes to that of Muscidae. Any data extractions involving Muscidae, will then produce all members of the family, including those in the new sub-family Anthomyiidae. By incorporating
8
Figu
re 8
Ty
pica
l Con
tent
s of
Tax
a C
odes
Tab
le
the higher level information into a separate table, only one change is needed to accommodate the taxonomic shift.
This table does not represent an absolute classification system. Taxonomic relationships are based on information available at the time of creation of the database. As knowledge of organisms increases, changes in the higher taxonomic relationships may also change. Consequently, the table has been designed to permit easy modification of this information. Should a user wish to employ a different numbering system, a table can be created having both codes, obviating the need to re-code the entire database. A complete list of all taxa and taxa codes included in the database is given in Appendix C of Cash et al, 1995.
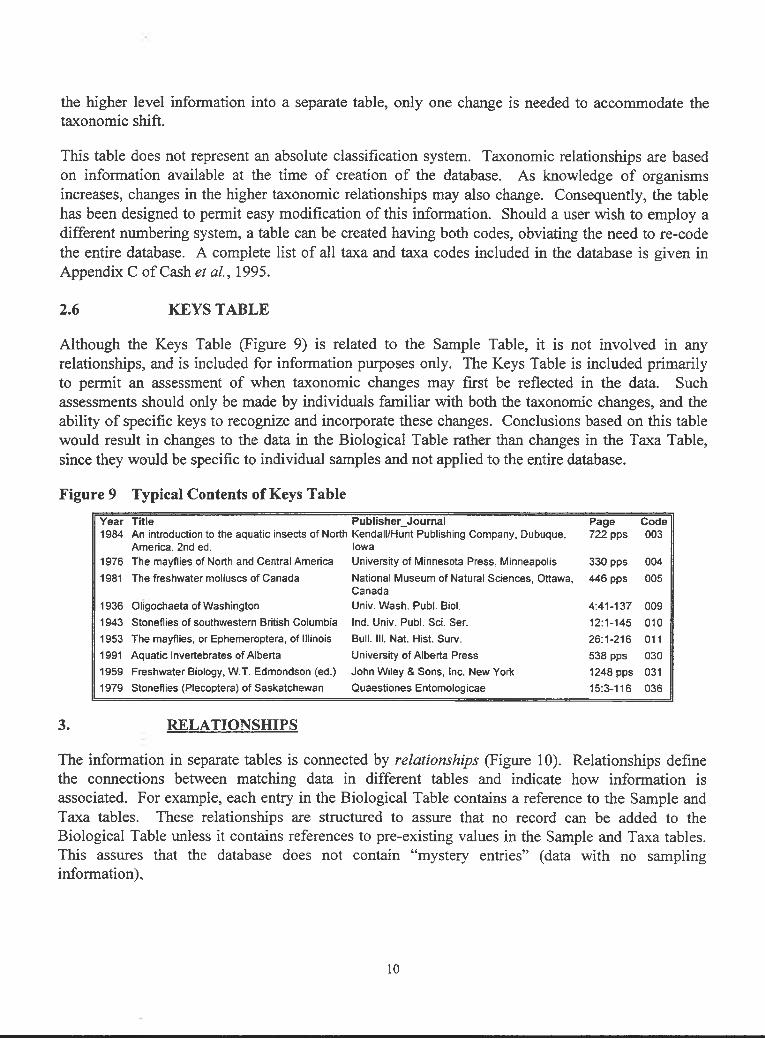
2.6 KEYS TABLE
Although the Keys Table (Figure 9) is related to the Sample Table, it is not involved in any relationships, and is included for information purposes only. The Keys Table is included primarily to permit an assessment of when taxonomic changes may first be reflected in the data. Such assessments should only be made by individuals familiar with both the taxonomic changes, and the ability of specific keys to recognize and incorporate these changes. Conclusions based on this table would result in changes to the data in the Biological Table rather than changes in the Taxa Table, since they would be specific to individual samples and not applied to the entire database.
Figure 9 Typical Contents of Keys TableYear T itle Publisher_Journal Page Code1984 An introduction to the aquatic insects o f North Kendall/Hunt Publishing Company, Dubuque, 722 pps 003
America. 2nd ed. Iowa1976 The mayflies of North and Central America University of Minnesota Press, Minneapolis 330 pps 004
1981 The freshwater molluscs o f Canada National Museum of Natural Sciences, Ottawa, Canada
446 pps 005
1936 Oligochaeta of W ashington Univ. Wash. Publ. Biol. 4:41-137 009
1943 Stoneflies o f southwestern British Columbia Ind. Univ. Publ. Sci. Ser. 12:1-145 010
1953 The mayflies, or Ephemeroptera, o f Illinois Bull. III. Nat. Hist. Surv. 26:1-216 011
1991 Aquatic Invertebrates o f Alberta University o f Alberta Press 538 pps 030
1959 Freshwater Biology, W.T. Edmondson (ed.) John W iley & Sons, Inc. New York 1248 pps 031
1979 Stoneflies (Plecoptera) o f Saskatchewan Quaestiones Entomologicae 15:3-116 036
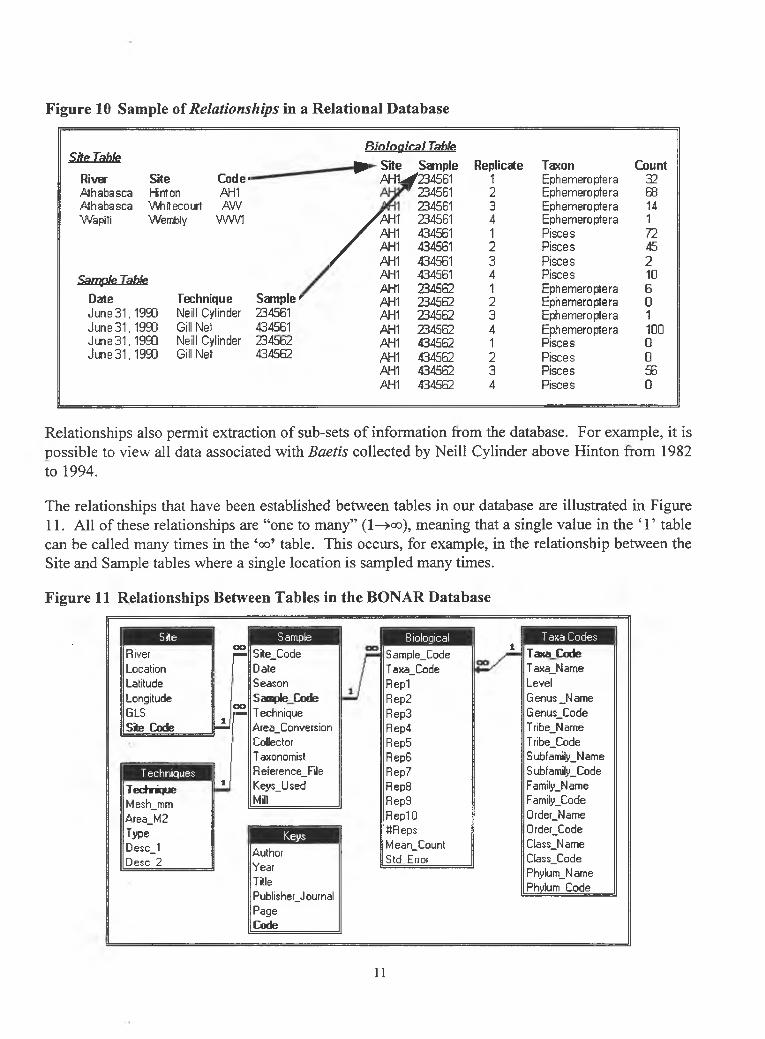
3. RELATIONSHIPS
The information in separate tables is connected by relationships (Figure 10). Relationships define the connections between matching data in different tables and indicate how information is associated. For example, each entry in the Biological Table contains a reference to the Sample and Taxa tables. These relationships are structured to assure that no record can be added to the Biological Table unless it contains references to pre-existing values in the Sample and Taxa tables. This assures that the database does not contain “mystery entries” (data with no sampling information).
10
Figure 10 Sample of Relationships in a Relational Database
Site TableBiological Table
^ Site Sample Replicate Taxon CountRiver Site Code- m u /234561 1 Ephemera ptera 32Athabasca Hinton AH1 r 234561 2 Ephemera ptera 68Athabasca Whitecourt AW 234561 3 Ephemera ptera 14Wapiti Wembly WW1 /m \ 234561 4 Ephemera ptera 1
Relationships also permit extraction of sub-sets of information from the database. For example, it is possible to view all data associated with Baetis collected by Neill Cylinder above Hinton from 1982 to 1994.
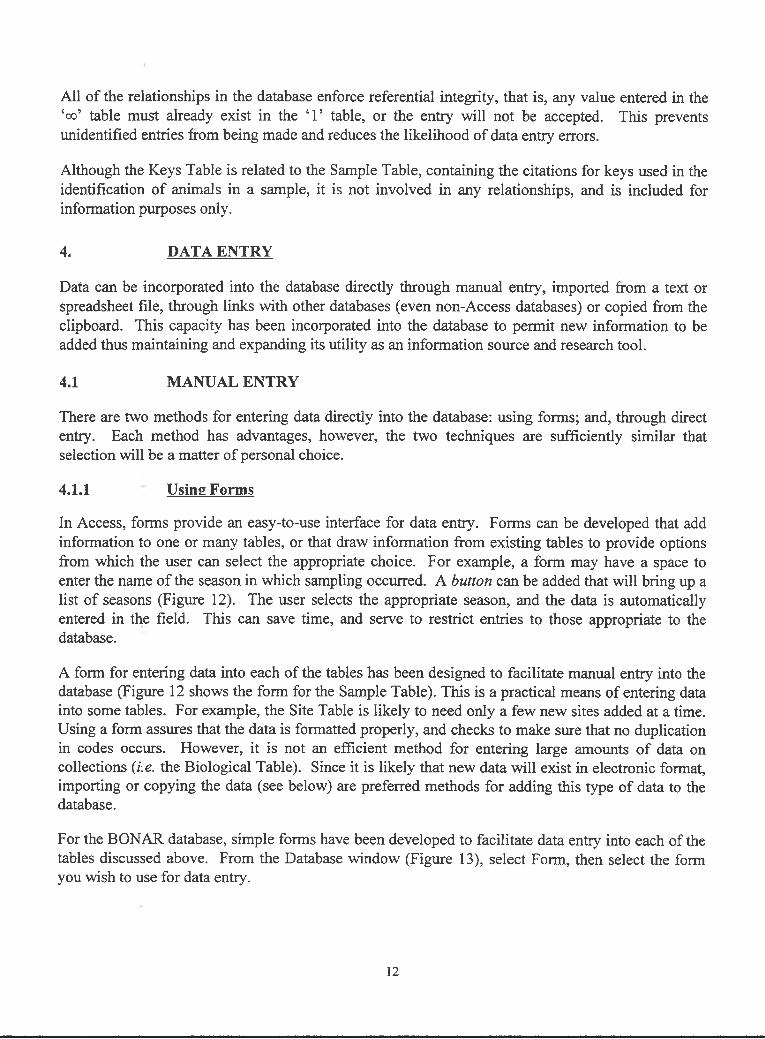
The relationships that have been established between tables in our database are illustrated in Figure11. All of these relationships are “one to many” ( l - » o o ) , meaning that a single value in the 4 T table can be called many times in the ‘oo’ table. This occurs, for example, in the relationship between the Site and Sample tables where a single location is sampled many times.
Figure 11 Relationships Between Tables in the BONAR Database
Site I SampleRiver
(JO
r —Site_Code
Location r DateLatitude SeasonLongitude i Sam pieCodeGLS J GO
J— T echniqueSite Code JJ r Area_Conversion
Collectori T axonomist
T echniques u Reference_File
Technique Keys_Used
M e$h_mm IMill
Area_M2Type KeysDe$c_1 AuthorDesc 2 Year
TitlePublisher_JournalPageCode
Biological T axa Codes
Sample_Code1
TaxaC odeT axa_Code Taxa_NameRep1 LevelRep2 Genus _NameRep3 Genus_CodeRep4 Tribe_NameRep5 T ribe_CodeRepG Subfamily_NameRep7 Subfamily_CodeRep8 Family_NameRep9 Family_CodeRepIO 0rder_NamettReps Order_CodeMean_Count Clas$_NameStd Error Class_Code
Phylum_NamePhylum Code
11
All of the relationships in the database enforce referential integrity, that is, any value entered in the ‘oo’ table must already exist in the ‘1* table, or the entry will not be accepted. This prevents unidentified entries from being made and reduces the likelihood of data entry errors.
Although the Keys Table is related to the Sample Table, containing the citations for keys used in the identification of animals in a sample, it is not involved in any relationships, and is included for information purposes only.
4. DATA ENTRY
Data can be incorporated into the database directly through manual entry, imported from a text or spreadsheet file, through links with other databases (even non-Access databases) or copied from the clipboard. This capacity has been incorporated into the database to permit new information to be added thus maintaining and expanding its utility as an information source and research tool.
4.1 MANUAL ENTRY
There are two methods for entering data directly into the database: using forms; and, through direct entry. Each method has advantages, however, the two techniques are sufficiently similar that selection will be a matter of personal choice.
4.1.1 Using Forms
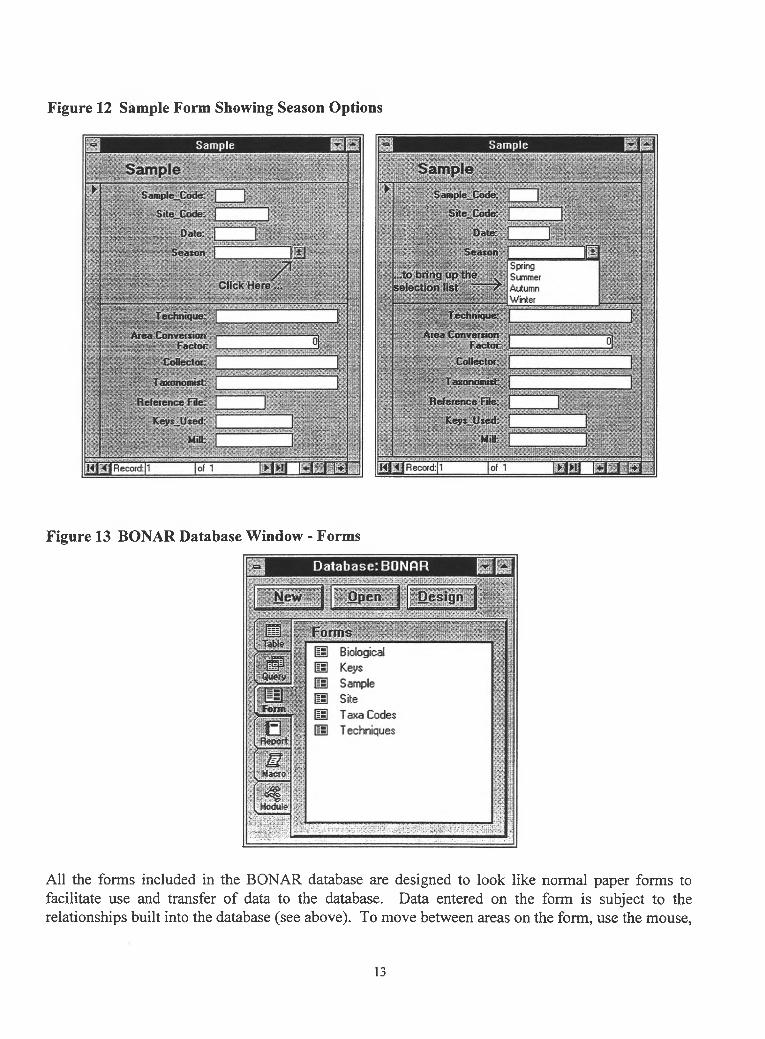
In Access, forms provide an easy-to-use interface for data entry. Forms can be developed that add information to one or many tables, or that draw information from existing tables to provide options from which the user can select the appropriate choice. For example, a form may have a space to enter the name of the season in which sampling occurred. A button can be added that will bring up a list of seasons (Figure 12). The user selects the appropriate season, and the data is automatically entered in the field. This can save time, and serve to restrict entries to those appropriate to the database.
A form for entering data into each of the tables has been designed to facilitate manual entry into the database (Figure 12 shows the form for the Sample Table). This is a practical means of entering data into some tables. For example, the Site Table is likely to need only a few new sites added at a time. Using a form assures that the data is formatted properly, and checks to make sure that no duplication in codes occurs. However, it is not an efficient method for entering large amounts of data on collections (i:e. the Biological Table). Since it is likely that new data will exist in electronic format, importing or copying the data (see below) are preferred methods for adding this type of data to the database.
For the BONAR database, simple forms have been developed to facilitate data entry into each of the tables discussed above. From the Database window (Figure 13), select Form, then select the form you wish to use for data entry.
12
Figure 12 Sample Form Showing Season Options
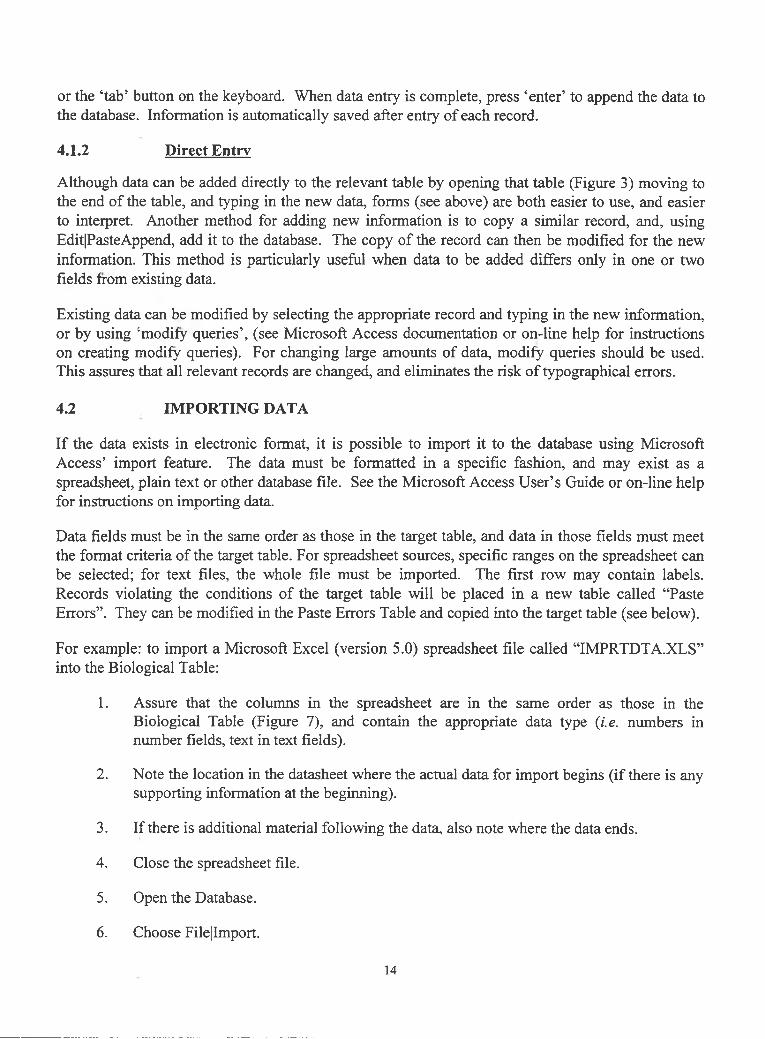
Figure 13 BONAR Database Window - Forms
All the forms included in the BONAR database are designed to look like normal paper forms to facilitate use and transfer of data to the database. Data entered on the form is subject to the relationships built into the database (see above). To move between areas on the form, use the mouse,
13
or the ‘tab’ button on the keyboard. When data entry is complete, press ‘enter’ to append the data to the database. Information is automatically saved after entry of each record.
4.1.2 Direct Entry
Although data can be added directly to the relevant table by opening that table (Figure 3) moving to the end of the table, and typing in the new data, forms (see above) are both easier to use, and easier to interpret. Another method for adding new information is to copy a similar record, and, using Edit|PasteAppend, add it to the database. The copy of the record can then be modified for the new information. This method is particularly useful when data to be added differs only in one or two fields from existing data.
Existing data can be modified by selecting the appropriate record and typing in the new information, or by using ‘modify queries’, (see Microsoft Access documentation or on-line help for instructions on creating modify queries). For changing large amounts of data, modify queries should be used. This assures that all relevant records are changed, and eliminates the risk of typographical errors.
4.2 IMPORTING DATA
If the data exists in electronic format, it is possible to import it to the database using Microsoft Access’ import feature. The data must be formatted in a specific fashion, and may exist as a spreadsheet, plain text or other database file. See the Microsoft Access User’s Guide or on-line help for instructions on importing data.
Data fields must be in the same order as those in the target table, and data in those fields must meet the format criteria of the target table. For spreadsheet sources, specific ranges on the spreadsheet can be selected; for text files, the whole file must be imported. The first row may contain labels. Records violating the conditions of the target table will be placed in a new table called “Paste Errors”. They can be modified in the Paste Errors Table and copied into the target table (see below).
For example: to import a Microsoft Excel (version 5.0) spreadsheet file called “IMPRTDTA.XLS” into the Biological Table:
1. Assure that the columns in the spreadsheet are in the same order as those in theBiological Table (Figure 7), and contain the appropriate data type (i.e. numbers innumber fields, text in text fields).
2. Note the location in the datasheet where the actual data for import begins (if there is any supporting information at the beginning).
3. If there is additional material following the data, also note where the data ends.
4. Close the spreadsheet file.
5. Open the Database.
6. Choose File|Import.
14
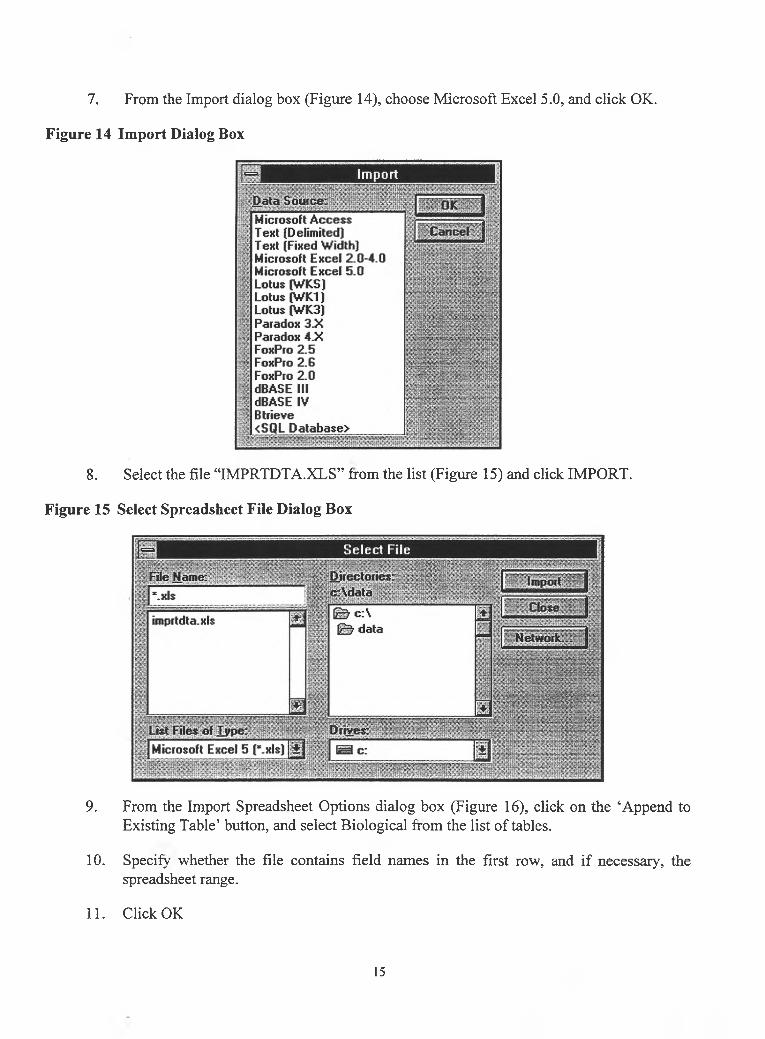
7. From the Import dialog box (Figure 14), choose Microsoft Excel 5.0, and click OK.
Figure 14 Import Dialog Box
8. Select the file “IMPRTDTA.XLS” from the list (Figure 15) and click IMPORT.
Figure 15 Select Spreadsheet File Dialog Box
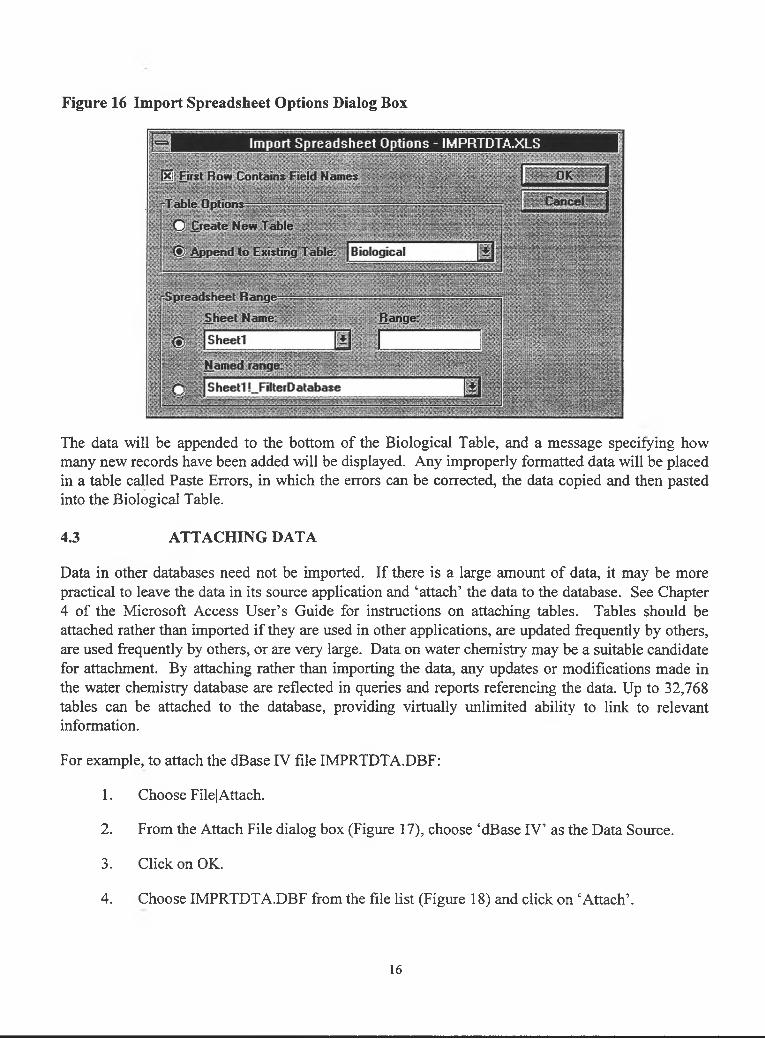
9. From the Import Spreadsheet Options dialog box (Figure 16), click on the ‘Append to Existing Table' button, and select Biological from the list of tables.
10. Specify whether the file contains field names in the first row, and if necessary, the spreadsheet range.
11. Click OK
15
Figure 16 Import Spreadsheet Options Dialog Box
Biological
ipreadsheet Range
Sheet Name:
Import Spreadsheet Options - IMPRTDTA.XLS
| sheen Wmm■
| S heel! !_FilterD at abase
The data will be appended to the bottom of the Biological Table, and a message specifying how many new records have been added will be displayed. Any improperly formatted data will be placed in a table called Paste Errors, in which the errors can be corrected, the data copied and then pasted into the Biological Table.
4.3 ATTACHING DATA
Data in other databases need not be imported. If there is a large amount of data, it may be more practical to leave the data in its source application and ‘attach’ the data to the database. See Chapter 4 of the Microsoft Access User’s Guide for instructions on attaching tables. Tables should be attached rather than imported if they are used in other applications, are updated frequently by others, are used frequently by others, or are very large. Data on water chemistry may be a suitable candidate for attachment. By attaching rather than importing the data, any updates or modifications made in the water chemistry database are reflected in queries and reports referencing the data. Up to 32,768 tables can be attached to the database, providing virtually unlimited ability to link to relevant information.
For example, to attach the dBase IV file IMPRTDTA.DBF:
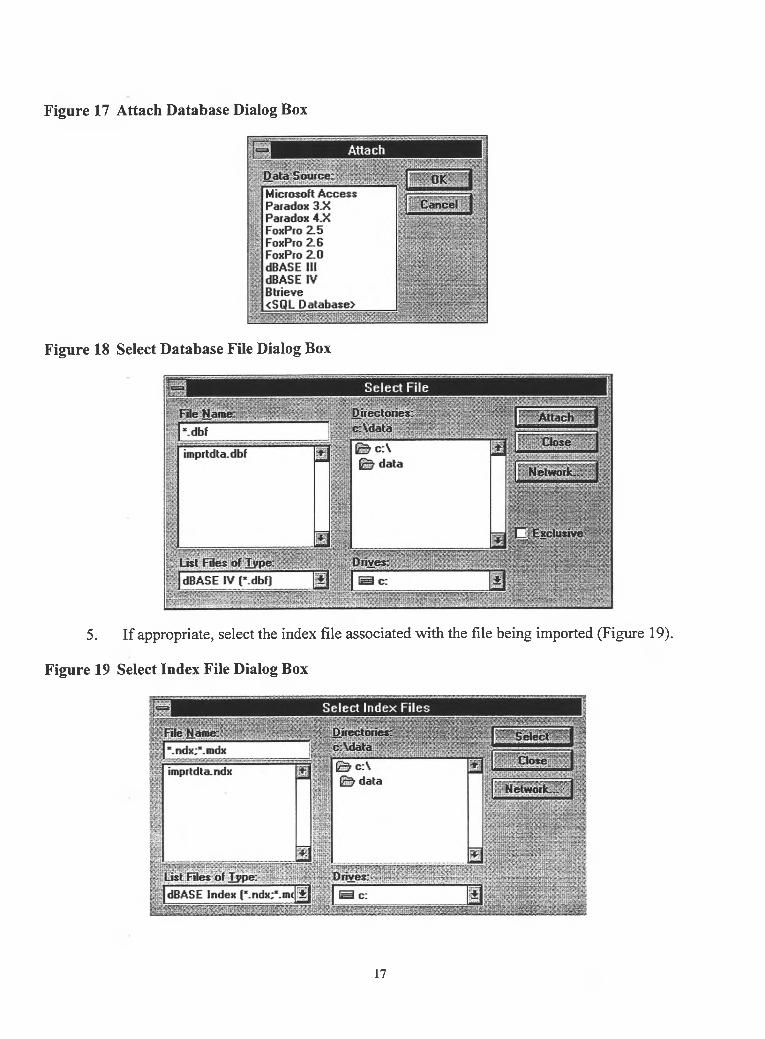
1. Choose File| Attach.
2. From the Attach File dialog box (Figure 17), choose ‘dBase IV’ as the Data Source.
3. Click on OK.
4. Choose IMPRTDTA.DBF from the file list (Figure 18) and click on ‘Attach’.
16
Figure 17 Attach Database Dialog Box
Figure 18 Select Database File Dialog Box
imprtdta.dbfNetwork!
Dr»ve*:,idBASE IV r.dbf]
Select File
5. If appropriate, select the index file associated with the file being imported (Figure 19).
Figure 19 Select Index File Dialog Box
17
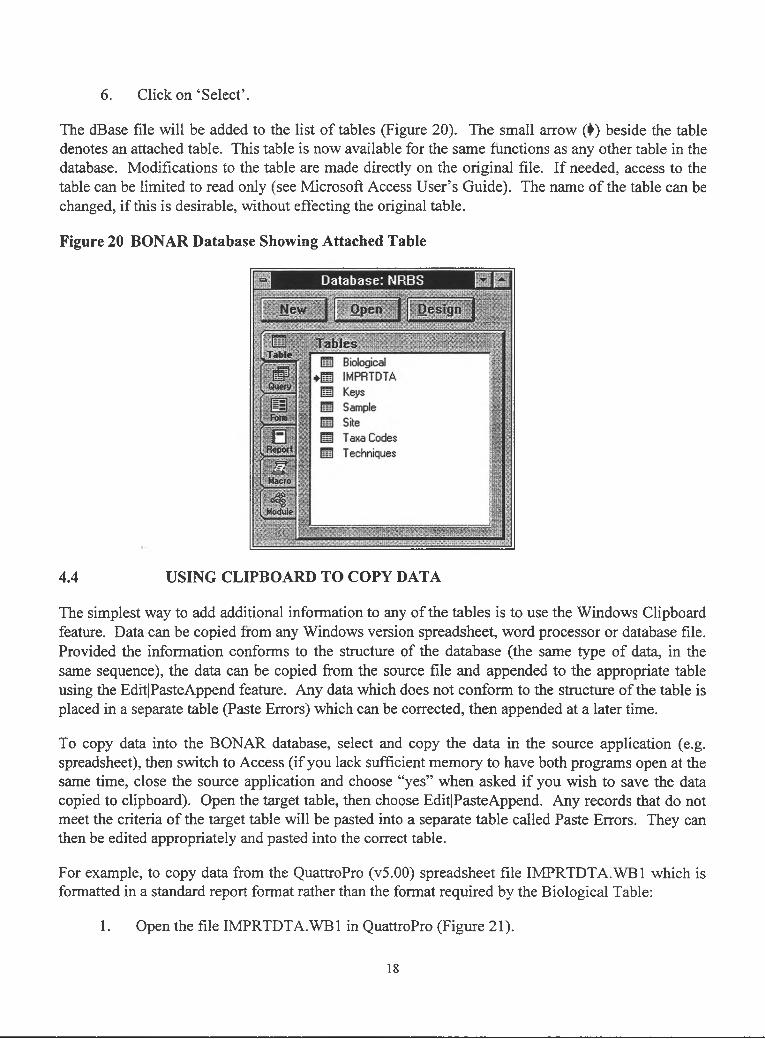
6. Click o n ‘Select’.
The dBase file will be added to the list of tables (Figure 20). The small arrow (f) beside the table denotes an attached table. This table is now available for the same functions as any other table in the database. Modifications to the table are made directly on the original file. If needed, access to the table can be limited to read only (see Microsoft Access User’s Guide). The name of the table can be changed, if this is desirable, without effecting the original table.
Figure 20 BONAR Database Showing Attached Table
New
■ T ab leHI Biological + M IMPRTDTA
H I Keys Hill Sample 101 Site EfU T axa Codes H i T echniques
Module
Database: NRBS
4.4 USING CLIPBOARD TO COPY DATA
The simplest way to add additional information to any of the tables is to use the Windows Clipboard feature. Data can be copied from any Windows version spreadsheet, word processor or database file. Provided the information conforms to the structure of the database (the same type of data, in the same sequence), the data can be copied from the source file and appended to the appropriate table using the Edit| Paste Append feature. Any data which does not conform to the structure of the table is placed in a separate table (Paste Errors) which can be corrected, then appended at a later time.
To copy data into the BONAR database, select and copy the data in the source application (e.g. spreadsheet), then switch to Access (if you lack sufficient memory to have both programs open at the same time, close the source application and choose “yes” when asked if you wish to save the data copied to clipboard). Open the target table, then choose Edit| Paste Append. Any records that do not meet the criteria of the target table will be pasted into a separate table called Paste Errors. They can then be edited appropriately and pasted into the correct table.
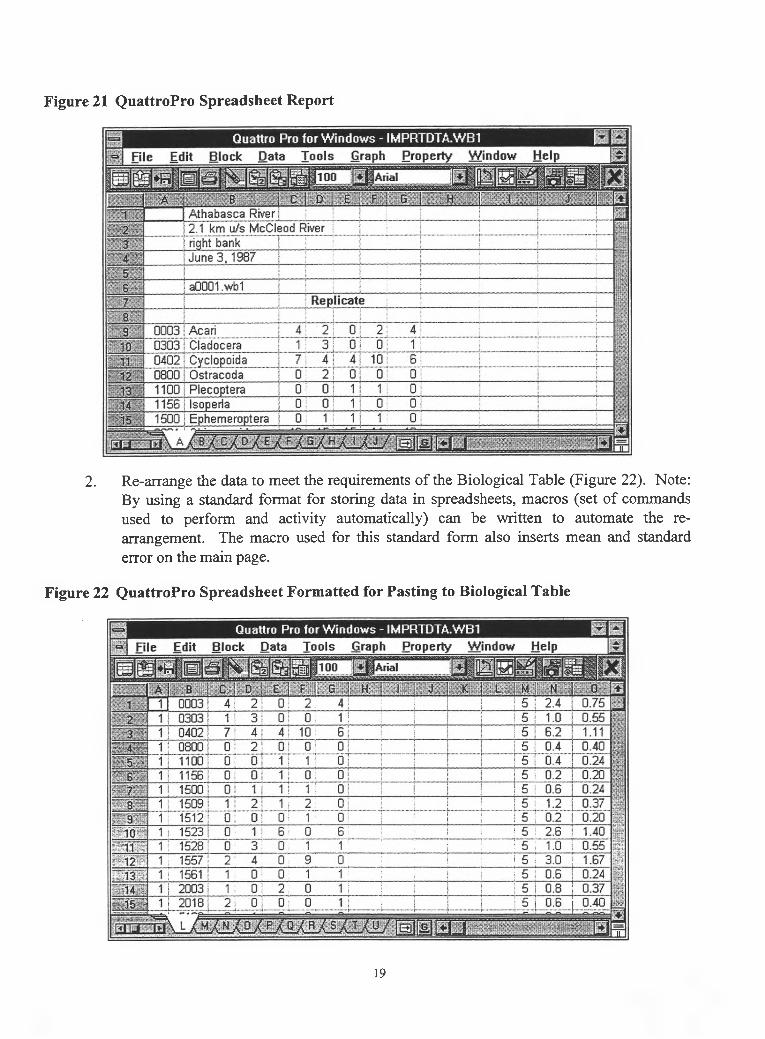
For example, to copy data from the QuattroPro (v5.00) spreadsheet file IMPRTDTA.WB1 which is formatted in a standard report format rather than the format required by the Biological Table:
1. Open the file IMPRTDTA.WB1 in QuattroPro (Figure 21).
18
Figure 21 QuattroPro Spreadsheet Report
2. Re-arrange the data to meet the requirements of the Biological Table (Figure 22). Note: By using a standard format for storing data in spreadsheets, macros (set of commands used to perform and activity automatically) can be written to automate the rearrangement. The macro used for this standard form also inserts mean and standard error on the main page.
Figure 22 QuattroPro Spreadsheet Formatted for Pasting to Biological Table
19
3. Copy the data by selecting the range and choosing Edit|Copy (for QuattroPro).
4. Switch to Access and open the Biological Table.
5. Choose Edit|PasteAppend.
The records will be added to the Biological Table. As with other additions, errors not meeting the criteria of the Table will be placed in a table called Paste Errors. The macro used for this process copies the data to the Clipboard, then deletes the rearranged data, reformats the original data to include means and standard errors, then saves and closes the original file.
Copying data removes the need to create separate files for data, and streamlines the importation process. By using a standard form, or taking the time to modify existing data to a standard format, macros can be used in any spreadsheet and most word processors to automate the procedure. Provided with the BONAR database are macros for QuattroPro version 5.00 to import data from a standard form. The macros are intended for demonstration purposes only, and should be modified or re-written by users to suit their needs and applications.
By using macros and standard forms, files created for other purposes can be conveniently imported to the database, without additional work. It is hoped that this will encourage on-going maintenance of the database.
5. DATA EXTRACTION
Microsoft Access extracts data from a database using queries and reports. Queries and reports permit the extraction of the desired information by examining the appropriate tables and selecting all the information requested. This can include data from multiple tables, and, using attached tables, can include data from other databases. Queries and reports can perform calculations, or can combine the contents of two or more fields in the database to produce information which does not actually exist in the database. For example, all collection data is stored in the database as count information. A field in the sample table specifies the value for converting this to density (per m2).
5.1 QUERY OR REPORT?
The primary instrument for extraction of data is the query. Queries create new tables with the fields requested. These can include calculations or combinations of fields from one or more tables, or simply subsets of the information in a table (e.g. sites in the Lesser Slave River only). Queries should be developed when the extracted information is to be used for further manipulations (e.g. analysis or transfer to a spreadsheet). Queries can generate files which can be opened in spreadsheet or other database applications.
Pre-designed queries for performing a range of data extractions are included with the BONAR database. However, queries are easy to develop, and can be customized to extract any required information, and present this information in any format desired (see Microsoft Access User’s Guide, on-line help, or use the Query Wizard by clicking on ‘New’ while in the Query window).
2 0
Data can also be extracted using reports. These are particularly useful when summary information is required, since records can be grouped and summarized in this format. Reports are presented in a word processor-type format, and are suitable for inclusion in documents, or as stand-alone documents when further data manipulation is not required.
5.2 USING CLIPBOARD TO COPY DATA
Once the required information has been generated, using queries or reports, data can be selected as in any Windows application, copied, and pasted into other applications. The only practical limit to the size of the area that can be copied is the memory available on your computer, and any limits created by the application to which it is being copied.
5.3 EXPORTING TO SPREADSHEETS OR DATABASES
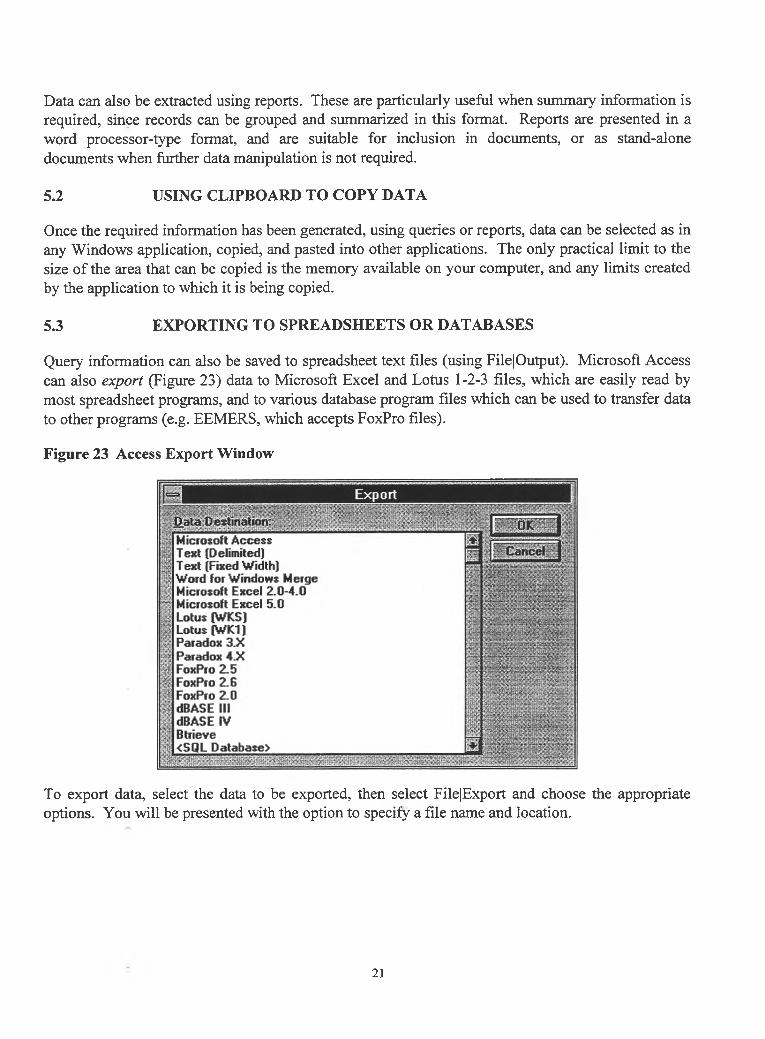
Query information can also be saved to spreadsheet text files (using File|Output). Microsoft Access can also export (Figure 23) data to Microsoft Excel and Lotus 1-2-3 files, which are easily read by most spreadsheet programs, and to various database program files which can be used to transfer data to other programs (e.g. EEMERS, which accepts FoxPro files).
Figure 23 Access Export Window
To export data, select the data to be exported, then select FilejExport and choose the appropriate options. You will be presented with the option to specify a file name and location.
2 1
6. LITERATURE CITED
Cash, K.J., M.S.J. Ouellette and F.J. Wrona. 1995. Northern River Basins macroinvertebrate community structure database. Prepared for the Northern River Basins Study. 85 pp.
Clifford, H.F. 1991. Aquatic Invertebrates of Alberta. University of Alberta Press, Edmonton. 538 pps.
Merritt, R.W. and K. W. Cummins. An Introduction to the Aquatic Insects if North America. Second Edition. Kendall/Hunt Publishing Company, Dubuque. 722 pps.
Microsoft Corporation. 1992. Microsoft Access User's Guide. 717 p.
2 2
NORTHERN RIVER BASINS STUDY
APPENDIX A - TERMS OF REFERENCE
Project 5211-D1: Quantitative Analysis of Benthic Macroinvertebrate and FishCommunity Structure: A Critique and Comparison of Biomonitoring Techniques
I. Background and Objectives
One of the primary objectives of the Northern River Basins Study (NRBS) is to identify long-term monitoring programs and predictive models for providing an ongoing assessment of the state of the aquatic ecosystem (Question 14). Data on benthic invertebrate and/or fish community structure is widely recognized as providing valuable insight into ecosystem health (see Cash 1994) and has been collected periodically within the Peace (including Alberta and B.C.), Athabasca (including Lake Athabasca in Alberta and Saskatchewan) and Slave river systems for much of the past 40 years and more intensively over the last 15 years. Unfortunately, these data sets have not yet been analyzed with the specific objective of assessing the appropriateness of the monitoring data collected, or for the purpose of assessing the general state of the aquatic ecosystem.
The purpose of this project is to apply a variety of biomonitoring (data analysis) techniques (see Cash 1994) to existing macroinvertebrate and fisheries data sets to address the following questions:
(1) Is the data currently being collected within the Peace, Athabasca and Slave river systems of sufficient quality and quantity to permit application of widely used biomonitoring (data analysis) techniques?;
(2) What (if any) additional information is required before these techniques can be successfully applied?
(3) Do current techniques adequately identify and capture changes in benthic invertebrate and/or fish community structure caused by changes in effluent loadings within this system?
(4) What are the strengths and weaknesses of each technique when applied to this data set and are results obtained from the application of different techniques comparable?
(5) Which technique or group of techniques will best fulfil the Northern River Basins Study objective of identifying those monitoring programs necessary for ongoing assessment of cumulative effects and aquatic ecosystem integrity?
This study will compliment work being carried out by the Nutrients Component which is employing univariate and multivariate statistics to test specific hypotheses relating to effluent loadings and subsequent shifts in benthic invertebrate community structure (report being prepared
Page 1 o f7
under NRBS Project 2616-C1; draft project report should be available in August 1994). This study will also provide background information for more direct comparisons of the monitoring program developed for the Peace, Athabasca and Slave River systems with monitoring programs developed for other large river systems.
II. General Requirements
1) Assess the nature and quality of long-term data sets measuring benthic macroinvertebrate community structure (being prepared under NRBS Project 2616-C1) in relation to effluent loadings (see NRBS Projects 2111-A1 [McCubbin & Folke 1993, McCubbin 1993] & Cl, and 2112-B1/C1 [Sentar Consultants Ltd. 1993]) within the Peace, Athabasca and Slave river systems. Data from NRBS projects 2616-C1, 2111-A1, 2111-C1 and 2112-B1/C1 will be supplied to the contractor by the NRBS.
2) Compile into databases existing information on benthic macroinvertebrate and fish community structure on the Peace (including Wapiti-Smoky rivers), Athabasca and Slave River systems. Sources of information are to include government, academic and industry studies carried out in the Peace, Athabasca and Slave river basins (see Wallace and McCart 1984, Paetz 1984, Hildebrand 1990, Swanson 1992), including recent data from Alberta- Pacific Forest Industries Inc. and studies carried out by the Northern River Basins Study (particularly Boag (1993) and R. L. & L. Environmental Services Ltd 1994a; but see also Balagus et al. (1993), Barton and Courtney (1993), R. L. & L. Environmental Services Ltd. (1994b), D. A. Westworth & Associates (1993), Golder Associates Ltd. (1994), Patalas (1993), Dunnigan and Millar (1993)).
3) Assess the feasibility of applying biomonitoring (data analysis) techniques (that make use of benthic macroinvertebrates and/or fish distribution and abundance data) to the data sets described above. The assessment should include the use of multivariate analyses (cluster and ordination analysis) and biotic integrity analysis (e.g., Karr 1991; biotic index approach).
4) Based on the biomonitoring techniques outlined in Cash (1994) identify biomonitoring (data analysis) techniques that could be applied to long-term macroinvertebrate and fisheries data sets from the northern river basins. Where possible, apply currently used biomonitoring (data analysis) techniques to the long-term data sets.
5) Compare and contrast the results obtained when different biomonitoring techniques are applied to the same data sets and provide recommendations as to the most appropriate techniques to be incorporated into a long-term cumulative effects monitoring plan for the Peace, Athabasca and Slave river systems. Clearly outline criteria for the selection and dismissal of various biomonitoring techniques for assessing long-term cumulative effects and ecosystem health in the northern river basins. Where appropriate, relate the selection of appropriate biomonitoring techniques for the northern river basins to biomonitoring techniques employed on other large river systems.
Page 2 o f 7
6) Consult extensively with staff from Alberta Environmental Protection during the review of existing macroinvertebrate databases, the assessment of the feasibility of applying biomonitoring techniques to the macroinvertebrate databases, and the development of a long-term cumulative effects monitoring program. The list of AEP staff to contact includes:
Dr. Anne-Marie Anderson, Technical Services and Monitoring Division (427-5893)Mr. Leigh Noton, Technical Services and Monitoring Division (427-5893)Mr. Ian MacKenzie, Standards and Approvals Division (427-5888)
7) Consult extensively with staff from Alberta Environmental Protection (contact Maurice Drouin, Fish and Wildlife Services - (403) 427-6730) to identify existing fisheries databases and during the review of existing fisheries databases, the assessment of the feasibility of applying biomonitoring techniques to fisheries databases and the development of a long-term cumulative effects monitoring program.
III. Deliverables
1. Two interim progress reports, one to be delivered on November 1, 1994 and the other to be delivered by March 31, 1995.
2. Elctronic copies of the databases used for all analyses, as well as a manual that specifies the data structure and format.
3. A comprehensive draft report to be delivered to the Study Office on or before July 1, 1995, and a final report three weeks following the reciept of reviewers comments.
4. Six to ten 35 mm slides that can be used at public meetings to summarize the project, methods and key findings.
IV. Reporting Requirements
1. Prepare a comprehensive report that identifies existing fish and macroinvertebrate community structure data within the Peace (including Wapiti-Smoky rivers), Athabasca and Slave river systems and outlines the feasibility of applying the various biomonitoring techniques to existing fish and macroinvertebrate community structure information. Where applicable, the report should discuss the results of applying biomonitoring techniques to fish and macroinvertebrate data sets and make recommendations regarding appropriate biomonitoring techniques that could be incorporated into a long-term cumulative effects monitoring plan for the Peace, Slave and Athabasca river systems.
2. Interim progress reports are to be submitted to the Component Coordinator on November 1, 1994 and March 31, 1995.
Page 3 o f 7
3. Electronic copies of the macroinvertebrate and fish databases used for all analyses are to be provided to the Study Office by March 31, 1995. An accompanying manual should also be provided that specifies data structure and format. These data must be in Quattro Pro and FoxPro/dBase IV compatible formats.
4. Ten copies of the draft report are to be submitted to the Component Coordinator by July1,1995.
5. Three weeks after the receipt of review comments on the draft report, the Contractor is to provide the Component Coordinator with two unbound, camera ready originals and ten cerlox bound copies of the final report along with an electronic version.
6. The Contractor is to provide draft and final reports in the style and format outlined in the NRBS document, "A Guide for the Preparation of Reports,” which will be supplied upon execution of the contract.
The final report is to include the following: an acknowledgement section that indicates any local involvement in the project, Report Summary, Table of Contents, List of Tables, List of Figures and an Appendix with the Terms of Reference for this project.
Text for the report should be set up in the following format:
a) Times Roman 12 point (Pro) or Times New Roman (WPWIN60) font.b) Margins; are 1 ” at top and bottom, 7/8" on left and right.c) Headings; in the report body are labelled with hierarchical decimal Arabic numbers.d) Text; is presented with full justification; that is, the text aligns on both left and right
margins.e) Page numbers; are Arabic numerals for the body of the report, centred at the bottom
of each page and bold.
If photographs are to be included in the report text they should be high contrast black and white.All tables and figures in the report should be clearly reproducible by a black and white photocopier.Along with copies of the final report, the Contractor is to supply an electronic version of the report in Word Perfect 5.1 or Word Perfect for Windows Version 6.0 format. Electronic copies of tables, figures and data appendices in the report are also to be submitted to the Component Coordinator along with the final report. These should be submitted in a spreadsheet (Quattro Pro preferred, but also Excel or Lotus) or database (dBase IV) format. Where appropriate, data in tables, figures and appendices should be geo-referenced.
7. All figures and maps are to be delivered in both hard copy (paper) and digital formats. Acceptable formats include: DXF, uncompressed E0 0 , VEC/VEH, Atlas and ISIF. All digital maps must be properly geo-referenced.
Page 4 o f 7
8. All sampling locations presented in report and electronic format should be geo-referenced. This is to include decimal latitudes and longitudes (to six decimal places) and UTM coordinates. The first field for decimal latitudes / longitudes should be latitudes (10 spaces wide). The second field should be longitude (11 spaces wide).
9. The presentation package of 35 mm slides is to comprise of one original and four duplicates of each slide.
V. Contract Administration
This project is being conducted by the Synthesis and Modelling Component of the Northern RiverBasins Study (Component Leader - Dr. Fred Wrona)
The Scientific Authority for this project is:
Dr. Fred WronaChief, Ecosystem Evaluation Division National Hydrology Research Institute 11 Innovation Blvd.Saskatoon, Saskatchewan S7N 3H5phone: (306) 975-6099 fax: (306) 975-6414
Questions of a technical nature should be directed to him.
The Component Coordinator for this project is:
Richard ChabayloNorthern River Basins Study690 Standard Life Centre10405 Jasper AvenueEdmonton, Alberta T5J 3N4phone: (403) 427-1742 fax: (403) 422-3055
Questions of an administrative nature should be directed to him.
VI. Literature Cited
Balagus, P. A. de Vries and J. Green. 1993. Collection of Fish from the Traditional Winter Fishery on the Peace-Athabasca Delta, February 1993. Northern River Basins Study Project Report # 20. Prepared by The Delta Environmental Management Group Ltd.
Barton, B. A. and R. F. Courtney. 1993. Fish and Fish Habitat Database for the Peace, Athabasca and Slave River Basins. Northern River Basins Study Project Report #17. Prepared by Environmental Management Associates, Calgary, Alberta.
Page 5 o f 7
Boag, T. 1993. A General Fish and Riverine Habitat Inventory, Peace and Slave Rivers, April to June 1992. Northern River Basins Study Project Report #9. Prepared by D. A. Westworth & Associates Ltd., Edmonton.
Cash, K. 1994. Review of Individual, Population and Community Level Approaches to Assess and Monitor Aquatic Ecosystem Health (NRBS Project 5201-Cl). Draft report submitted to the Northern River Basins Study. 55 pp.
D. A. Westworth & Associates Ltd. 1993. Construction of the Historical Fish Contaminants Database. Draft Manual and Database submitted to the Northern River Basins Study.
Dunnigan, M. and S. Millar. 1993. Benthos Field Collection, Under-Ice Sampling, Athabasca River, February and March, 1993. Northern River Basins Study Project Report # 21. Prepared by R. L. & L. Environmental Services Ltd.
Golder Associates. 1994. Fish Tagging Along the Athabasca River Near Whitecourt. Draft Report submitted to the Northern River Basins Study.
Hildebrand, L. 1990. Investigations of Fish and Habitat Resources of the Peace River in Alberta. Prepared for: Alberta Environment. Prepared by: R. L. & L. Environmental Services Ltd.
Karr, J.R. 1991. Biological integrity: a long-neglected aspect of water resource management. Ecological Applications 1:66-84.
McCubbin, N. 1993. NORTHDAT: An Effluent Database Management System, Application Description. Northern River Basins Study Project Report #16. Prepared by N. McCubbin Consultants Inc.
McCubbin N. and J. Folke. 1993. A Review of Literature on Pulp and Paper Mill Effluent Characteristics in the Peace and Athabasca River Basins. Northern River Basins Study Project Report #15. Prepared by N. McCubbin Consultants Inc.
Paetz, M. 1984. Fish and fisheries of the Peace River Basin: thier status and environmental requirements. Report prepared for Planning Division, Alberta Environment. 240 pp.
Patalas, J. 1993. Lake Whitefish Spawning Study Below Vermilion Chutes on the Peace River, 1992. Northern River Basins Study Project Report #23. Prepared by R. L. & L. Environmental Services Ltd., Edmonton, Alberta.
R. L. & L. Environmental Services Ltd. 1994a. A General Fish and Riverine Habitat Inventory, Athabasca River, April to May 1992. Northern River Basins Study Project Report #32.
R. L. & L. Environmental Services Ltd. 1994b. Fish and Habitat Inventory - Fall 1993, Athabasca River. Draft report submitted to the Northern River Basins Study.
Page 6 o f 7
Sentar Consultants Ltd. 1993. Municipal and Non-Pulp Mill Dischargers Database Manual. Draft Report and Database submitted to the Northern River Basins Study.
Swanson. S. [ed.]. 1992. Wapiti-Smoky River ecosystem study. Report prepared by Sentar Consultants for Weyerhaeuser Canada and Proctor and Gamble.
Wallace, R. R. and P. J. McCart. 1984. The Fish and Fisheries of the Athabasca River Basin: Their Status and Environmental Requirements. Prepared for: Planning Division, Alberta Environment. 269 pp. + appendices
J-1 l .
e ' . r
Page 7 o f 7
APPENDIX B: BONAR DATABASE
The disk provided in the sleeve as the last page of this report contains the BONAR Database for benthos of the Peace, Athabasca and Slave River basins which is supplied by the author and can be installed on your micro-computer by following the instructions in the User’s Guide (NRBS Project Report No. 143).
The disk contains one self-extracted file, BONAR.EXE, using 746,932 bytes.
There is no warranty expressed or implied for the use of this database; the Northern River Basins Study does not guarantee the accuracy of the data. The NRBS does not assume any liability for actions or consequences resulting from the use of the data; individuals using this data do so entirely at their own risk. The NRBS will not update the data except as deemed necessary for its own purposes.