21
Canada’s Oil Sands April 7, 2014 1

Canada’s Oil Sands
April 7, 2014
1

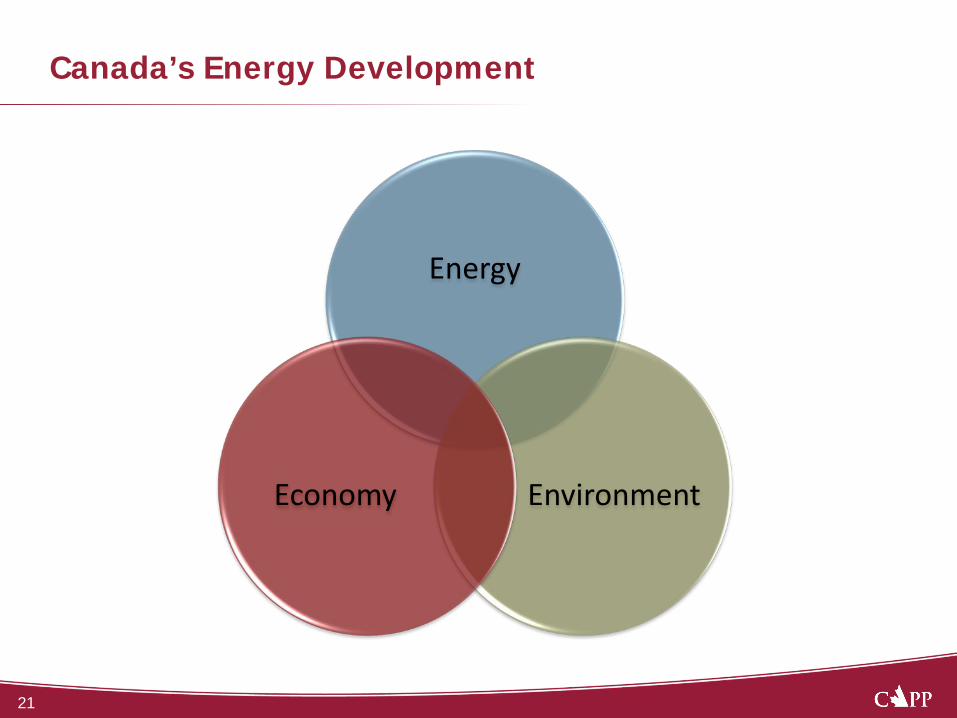
Energy
Environment Economy
Canada’s Energy Development
2

Global Primary Energy Demand
• Population growth • Standard of living
Energy Demand Growth
• Ongoing high reliance on hydrocarbons
• Increasing role for renewables
• Shift to non-conv. oil & natural gas
All Forms of Energy,
Developed Responsibly
• Production • Cost competitiveness • Environmental
performance
Technology - Key Lever
for Sustainable
Growth
Source: International Energy Agency – New Policies Scenario
World Energy Outlook 2011
0
2,000
4,000
6,000
8,000
10,000
12,000
14,000
16,000
18,000
20,000
2011 2020 2025 2030 2035
million tonnes oil equivalent
Other RenewablesBioenergyHydroNuclearNatural GasOilCoal
Source: International Energy Agency World Energy Outlook 2013
Ongoing reliance on fossil fuels (share of energy consumption): 2011: 82% 2035: 76%

Two Methods of Oil Sands Recovery Ph
oto:
Con
ocoP
hillip
s - S
urm
ont
Schematic: Devon - Jackfish
Drilling: 80% of reserves Mining: 20% of reserves

Global Crude Oil Reserves by Country
30 25 243237
48
8092
102
140157
173
266
298
0
50
100
150
200
250
300
Vene
zuel
a
Saud
i Ara
bia
Cana
da
Iran
Iraq
Kuw
ait
Abu
Dha
bi
Russ
ia
Liby
a
Nig
eria
Uni
ted
Stat
es
Kaza
khst
an
Qat
ar
Chin
a
billi
on b
arre
ls
Source: Oil & Gas Journal Dec. 2013 & AER
Restricted (81%)
Open to Private Sector
Oil Sands 53%
Other 47%
World Oil Reserves Open to
Private Sector

Canadian Oil Sands (Bitumen and SCO) & Conventional Production

2012 Canada and U.S. Demand for Crude Oil by Source Thousand Barrels per Day
7

Access to Markets – Pipeline Expansions in Development

WCSB Takeaway vs Supply Forecast

Crude Oil Rail Exports Western Canada vs. North Dakota
10
• Opportunities: • Relatively quick • Flexibility • Less diluent • Use in both
directions
• Challenges: • Recent safety • Higher costs • Limited loading
and tank car availability
Source: Peter’s & Co. Limited = Sept 2013

11
Oil Sands Environmental Performance

12
Joint Oil Sands Monitoring Increased sites (87 to 172) More substances Greater sensitivity Broader geography Standard methodology Publicly available data $50 million per year In addition to required
project monitoring
“… will be one of the most progressive and comprehensive environmental monitoring programs of any industrially-developed region in the world. “

Greenhouse Gas Emissions
GHG emissions from oil sands: Accounted for 0.14% of global GHG
emissions 7.8% of Canada’s GHG emissions 26% reduction in intensity from 1990
Global CO2 Emissions Canada’s 2%
Sources: 1. United Nations Statistics Division (2010 Data) 2. Environment Canada (2011 Data) Note: Global split based on CO2 emissions, Canada’s split based on GHG emissions
Other Oil & Gas4%
Electricity13%
Other Upstream11%
Emission Intensive & Trade Exposed
Industries11%
Agriculture10%
Transportation24%
Oil Sands7.8%
Waste & Others7%
Buildings12%USA
18%
European Union12%
Other26%
China26%
Russian Federation
5%
Australia/New Zealand
1%
India6%
Japan4%
Canada2%

0 100 200 300 400 500 600
North Sea - Forties
Brazil - Tupi
Saudi Arabia - Arab Light
US Barrel Refined in the U.S. (2005)
Iraq - Kirkuk Blend
Cdn Oil Sands: Mining Dilbit (PFT)
Mexico - Maya
Venezuela Bachaquero
US - Mars
Cdn Oil Sands: Low SOR SAGD Dilbit
Iraq-Basra Light
Canadian Oil Sands: SAGD Dilbit
Nigeria - Bonny Light
Cdn Oil Sands: Mining SCO
US -Kern River
Venezuela - Petrozuata
kgCO2e per barrel of refined product
Well-to-tank
Refined productCombustion
Full-cycle GHG Emissions Oil Sands & U.S. Refined Crudes
Source: IHSCERA Oil Sands Dialogue Getting the Numbers Right 2012
+5%
U.S. Barrel Refined in the U.S. (2005)
+2%

Tailings Management
● Alberta law requires all land disturbed by oil sands operations be reclaimed, including tailings ponds
● Oil sands operators are working to meet the thresholds set out by the AER ● Industry and is working to accelerate the reclamation of the resulting tailings
deposits so that they can be incorporated into the final reclaimed landscape.
15
CNRL: CO2 addition
Suncor: TRO Suncor: Pond 1 Reclamation
Syncrude: $1.9 Billion Tailings Centrifuge plant
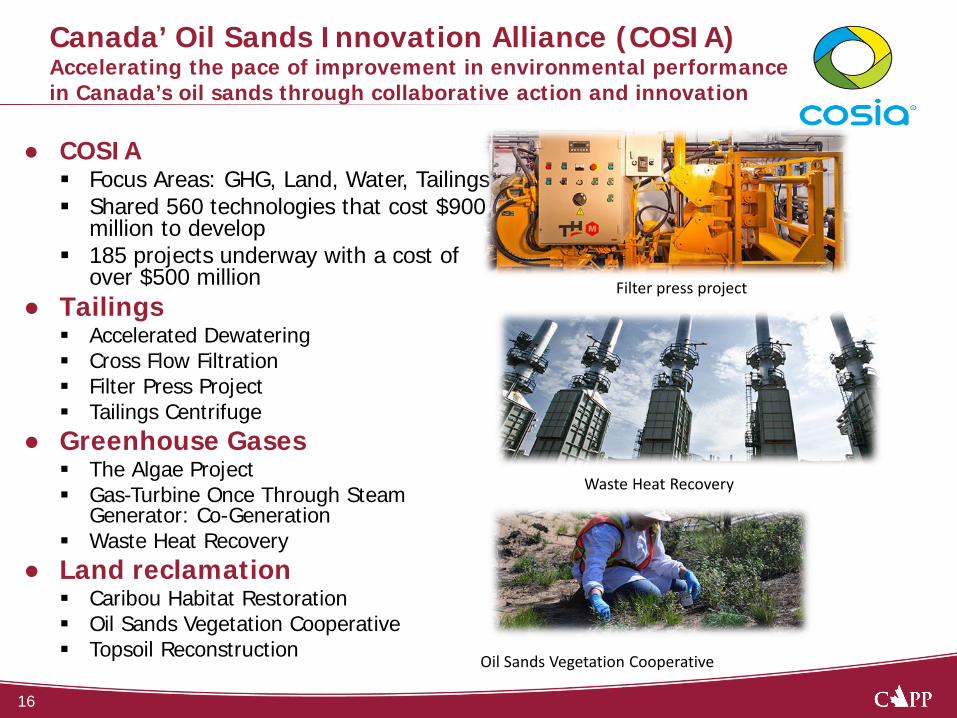
Canada’ Oil Sands Innovation Alliance (COSIA) Accelerating the pace of improvement in environmental performance in Canada’s oil sands through collaborative action and innovation
● COSIA Focus Areas: GHG, Land, Water, Tailings Shared 560 technologies that cost $900
million to develop 185 projects underway with a cost of
over $500 million ● Tailings Accelerated Dewatering Cross Flow Filtration Filter Press Project Tailings Centrifuge
● Greenhouse Gases The Algae Project Gas-Turbine Once Through Steam
Generator: Co-Generation Waste Heat Recovery
● Land reclamation Caribou Habitat Restoration Oil Sands Vegetation Cooperative Topsoil Reconstruction
16
Waste Heat Recovery
Oil Sands Vegetation Cooperative
Filter press project

● Pipeline Integrity & operations
● Rail Safety & response
● Marine Prevention, response and recovery – tankers/ports
Transportation Safety
17

Industry Capital Spending Cdn $billions
Note: Excludes spending on mergers & acquisitions
Western Canada 2012 2013E 2014E $37 $39 $38
East Coast Offshore 2012 2013E 2014E $2.4 $3.0 $3.5
Oil & Gas Investment Spending: 2012: $67 billion 2013: $69 billion (estimate) 2014: $71 billion (estimate)
18
Northern Canada 2012 2013E 2014E $0.1 $0.5 $0.7
Oil Sands 2012 2013E 2014E $27 $27 $29

● Industry will invest $71 billion in Canada in 2014 Largest single private sector investor in Canada
● Payments to governments average about $18 billion per year ● Oil and gas accounts for 20% of value on Toronto Stock Exchange ● Oil and Gas accounts for close to 18% of exports ● Industry employs more than 550,000 in Canada (direct & indirect).
The Oil and Natural Gas Industry A Key Driving Force in the Canadian Economy
Upstream Oil & Gas
Auto Manufacturing
Forestry & Logging
Wheat & Barley Uranium
19

Suppliers across Canada
Energy
Environment Economy
Canada’s Energy Development
21


