13
CANADA REPORT 2016

CANADA REPORT
2016

2
Preamble The 2016 Fire Season can be described as extremely challenging through the first part of the season in May and early June with a prolonged, relatively benign period through late June, July and August The fall of 2015 and winter of 2015 - 2016 were drier and warmer than normal and were followed by an early, warm and dry spring in Western Canada all attributed to the El Niño cycle. By mid June the El Niño had waned and was replaced by a La Niña pattern and more seasonal weather. Prior to the weather pattern change significant wildland fire activity was experienced within Alberta, British Columbia, Manitoba and Ontar-io. 2016 will be characterized as the year that the Horse River Fire occurred. This incident would prove to be the most impactful wildland fire in recent Canadian history burning nearly 590,000 hectares, resulting in the loss of some 2,400 structures and the evacuation of over 85,000 residents from Fort McMurray and surrounding area. Resources from within Alberta, across Canada and internationally were brought to bear to help manage the fire stretching the capabilities of resource exchange support systems. Fire Season The first CIFFC Situation Report was issued on April 20 and noted the persistence of early spring conditions in much of Western Canada. British Columbia identified that the province was experiencing warmer than nor-mal temperatures coupled with notable fire activity in the Northeastern corner of the province. Both Alberta and Saskatchewan were at Agency Preparedness Level (APL) 2. Fire activity was reported to be relatively low elsewhere across the country. By the start of the first week of May fire activity and potential had increased significantly with British Columbia reporting one large Fire (4,000 ha+) and both Alberta and Saskatchewan at APL 3. AB noted a very high to extreme hazard with potential for large fires on the May 2 CIFFC Situation Report. On May 3, CIFFC increased to National Preparedness Level (NPL) 2 and the first sustained action crews in support of the fire activity in Alberta were mobilized from Ontario. By the end of the first week of May, fire activity across much of the country was increasing with British Colum-bia, Saskatchewan, and Manitoba all reporting APL 3, Alberta at APL 4 and CIFFC at NPL 3. AT NPL 3 CIFFC implemented both the Strategic Planning Unit and the Canadian Multi-Agency Coordinating Group. These initiatives, first implemented during the 2015 season, had been refined over the winter as a result of lessons learned the previous summer. The primary role of the Strategic Planning Unit is to forward plan with regards to current resource use, project needs and availability and provide options to member agencies for the acquisition of additional resources. The Strategic Planning Unit also maintains strong linkages with inter-national partners as well as NRCan and other federal agencies. The Canadian Multi-Agency Coordinating Group provides strategic planning and decision making relative to resource availability, priority setting and re-source allocation. In concert, these entities provided significant improvements to CIFFC’s strategic planning role. Resources were being mobilized to Alberta to support the situation while the other agencies experiencing es-calated activity managed with their internal resources. By May 6 a total of 1244 fires had been reported across Canada for 148,469 hectares significantly above the 10 and 20 year averages. Over the next week fire activity and hazards increased in Western Canada. On May 13, Alberta reported an APL of 4 with BC, SK and BC at APL 3, remaining agencies were at APL 2 or 1. During the first two weeks of May, personnel, equipment and airtanker resources requested by Alberta were mobilized from across Canada to help support the Horse River Fire and other campaign fires in the province.
Canada Report 2016

3
Towards the end of the second week in May, Manitoba imported a skimmer tanker group from the Northwest Territories and a sustained action crew from Nova Scotia to help suppression efforts on a pair of stubborn fires along the Manitoba and Ontario border. Ontario imported United States landbased airtankers for an afternoon of quick strike missions on May 10 to provide support action on the southernmost of these border fires. CIFFC increased to a NPL 5 on May 19 as a result of receiving a significant request for suppression resources from Alberta that exceeded domestic availability. CIFFC turned to our international partners to add to the steady stream of Canadian resources being mobilized to Alberta. By the first week of June firefighting staff from the United States, Mexico and South Africa had all joined colleagues from across Canada on the fire lines in Alberta. After an active May long weekend Ontario escalated to APL 5 on May 25 and received personnel and airtanker assistance from their partners within CIFFC. Fortunately, the fire situation stabilized in Ontario by the end of May with out of province personnel returned home by June 5. Although the Horse River Fire continued to be well resourced by Alberta personnel, the requirement for supplementary resources slowly diminished with all outside personnel resources that had been mobilized through CIFFC returned home by June 20. By this time the aforementioned international participants as well as resources from British Columbia, Yukon Territory, Northwest Territories, Saskatchewan, Manitoba, Ontario, Quebec, Newfoundland and Labrador, New Brunswick, Nova Scotia, Prince Edward Island , Parks Canada (and the Canadian Forest Service had all contributed to supporting the province of Alberta. In mid July the Northwest Territories ramped up to respond to fire activity with personnel and airtanker resources from Alberta and Yukon mobilized to assist. This exemplifies the CIFFC model demonstrating the true reciprocal nature of resource sharing. Although Alberta had been a net importer through May and June by the end of July the province was in a position to export personnel and aircraft. Throughout the rest of July most of the fire management agencies were experiencing normal to below normal fire activity and as such British Columbia was able to provide a land based airtanker group to the United States on August 3. By early August NS’s prolonged drought was becoming more severe with both fire danger and fire activity increasing. Airtankers from Quebec and Newfoundland and Labrador were dispatched along with quick strike airtanker support from New Brunswick as a result of requests from Nova Scotia to help manage a fire complex. As well, personnel from New Brunswick, Parks Canada and Prince Edward Island all provided support to Nova Scotia during mid August. Towards the end of August another tanker group was requested by the United States and Alberta was able to supply. By early September both tanker groups were returned to Canada from the United States. As the fire response season wound down across the country the long process of demobilizing and recycling equipment carried on into the fall. Season Summary
The number of fires and hectares burned in 2016 was less than ten year averages. The early start and severity
of the fire season in western Canada was followed by moderating weather patterns and lower activity for the
duration of the season with a few spikes.
During the 2016 Fire Season CIFFC processed 138 Resource Orders resulting in the mobilization of 2077
personnel, 220 pumps and 10,028 lengths of hose along with 5 land based airtankers and 13 skimmer
airtankers. Although not a record breaking year in terms of fire numbers, hectares or resources mobilized the
extreme intensity and timing of the early season activity challenged fire managers at the provincial/territorial and
CIFFC levels.

4
Agency Seasonal Summary Alberta Alberta’s 2016 fire season can be divided into two time periods relating to wildfire danger. Wildfire hazard conditions escalated in mid-April and continued well into May. This elevation was due to early snow melt, higher than normal temperatures, strong winds, and lower than normal relative humidity and rainfall. A more typical weather pattern returned in June, with well received precipitation throughout much of the province reducing hazard conditions for the remainder of the summer. During the fire season, 1,338 wildfires started in Alberta’s Forest Protection Area. This is slightly below the five-year average of 1,418. These wildfires burned over 611,000 hectares, which is twice the 25-year average. However, one wildfire attributed for 96 per cent of the total area burned in 2016. Slightly over 1,200 additional firefighting personnel were brought in from many agencies within Canada, the United States, Mexico and South Africa. The Wildfire Management Branch was successful at containing approximately 97 per cent of wildfire arrivals with the first burning period.
Alberta recorded the third largest wildfire in the province’s history, the Horse River wildfire during the 2016 fire
season. This wildfire started on May 1, burnt almost 590,000 hectares and had a significant negative economic
impact on the province and country. It burned through portions of Fort McMurray and resulted in the
evacuation of close to 90,000 people. Approximately 2,400 homes and other buildings were destroyed as a
result of the wildfire, and it is the most damaging natural disaster experienced in Canada to date. Significant
firefighting resources were deployed to this incident during a period of two months, peaking on June 3 with
approximately 2,000 firefighters, 77 helicopters, 5 air tanker groups and 269 pieces of heavy equipment
engaged in suppression operations.
Manitoba
The spring of 2016 started slow until May 5 when 2 large border fires incidents occurred on the Manitoba/Ontario border at Beresford Lake/Red Lake in the north and Caddy Lake/Kenora area in the south. This resulted in many joint operations between Manitoba and Ontario, including: Command and Control, Values Protection, Heavy Equipment and inter-agency Helicopter IR services. A Manitoba IMT was dispatched to the Beresford fire and Ontario IMT to the Red Lake fire. An Ontario IMT assumed command and control of the Caddy Lake/Kenora fire. History was created with the joint operations efforts and resource sharing between Ontario and Manitoba on border fires and Ontario taking command and control of a border fire. Values protection was a major factor on suppression of the two border fires due to number of cottages and values at risk. Hundreds of personnel from the two agencies including personnel from the Office of the Fire Commissioner and Mutual Aid Fire Departments were involved in the efforts of structure protection. Both large border fires were de-mobilized and scanned by the end of May. The weather pattern from the beginning of June was a continual parade of warm, humid weather followed by major precipitation and wind events. The Caddy Lake fire area in the Whiteshell went from evacuation due to fire to evacuation due to flooding. Precipitation events resulted in some areas recording nearly 200 mm in a 24 hour period.
5
Saskatchewan We had 364 Wildfires with 52 Request for Assistance fires/incidents for a total of 416. There were no evacua-tions or fire related fatalities. The spring of 2016 started with much higher than normal drought codes percentiles. As shown by fire weather conditions, the spring was extremely dry leading to widespread and numerous days of extreme fire danger. Con-ditions gradually abated in June with the arrival of regional precipitation events. Significant precipitation events brought the drought codes down to average or below average values by the end of July.
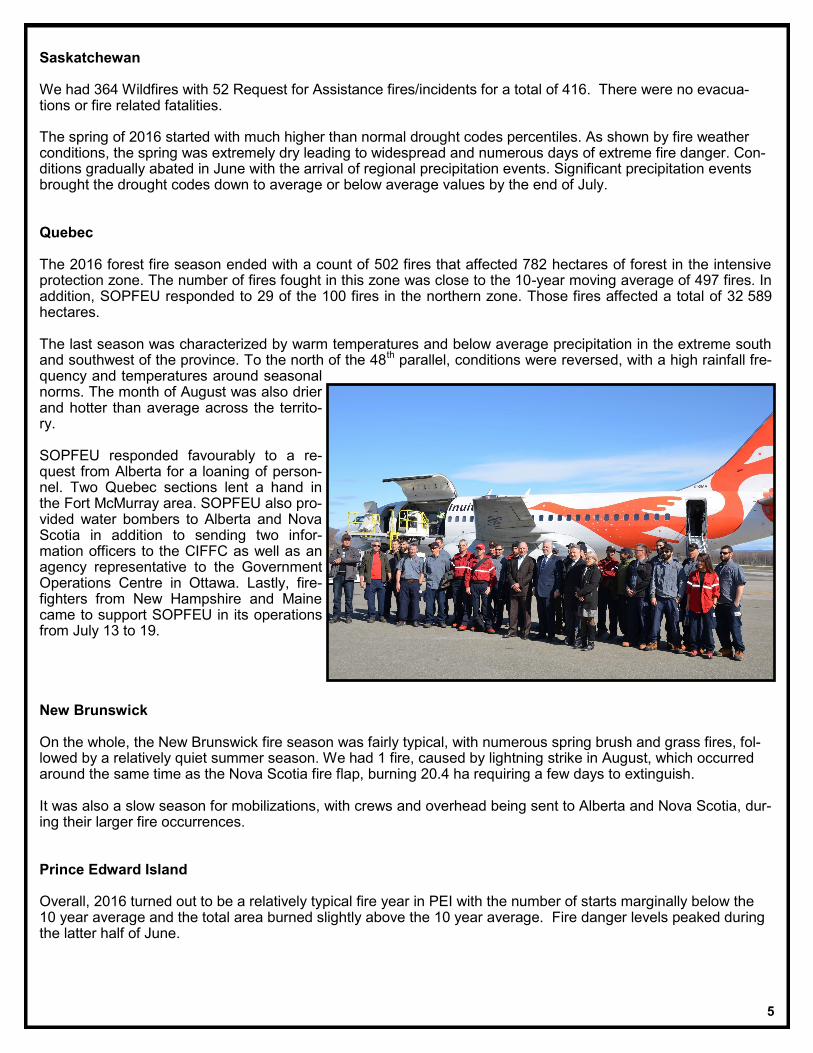
Quebec The 2016 forest fire season ended with a count of 502 fires that affected 782 hectares of forest in the intensive protection zone. The number of fires fought in this zone was close to the 10-year moving average of 497 fires. In addition, SOPFEU responded to 29 of the 100 fires in the northern zone. Those fires affected a total of 32 589 hectares. The last season was characterized by warm temperatures and below average precipitation in the extreme south and southwest of the province. To the north of the 48th parallel, conditions were reversed, with a high rainfall fre-quency and temperatures around seasonal norms. The month of August was also drier and hotter than average across the territo-ry. SOPFEU responded favourably to a re-quest from Alberta for a loaning of person-nel. Two Quebec sections lent a hand in the Fort McMurray area. SOPFEU also pro-vided water bombers to Alberta and Nova Scotia in addition to sending two infor-mation officers to the CIFFC as well as an agency representative to the Government Operations Centre in Ottawa. Lastly, fire-fighters from New Hampshire and Maine came to support SOPFEU in its operations from July 13 to 19. New Brunswick On the whole, the New Brunswick fire season was fairly typical, with numerous spring brush and grass fires, fol-lowed by a relatively quiet summer season. We had 1 fire, caused by lightning strike in August, which occurred around the same time as the Nova Scotia fire flap, burning 20.4 ha requiring a few days to extinguish. It was also a slow season for mobilizations, with crews and overhead being sent to Alberta and Nova Scotia, dur-ing their larger fire occurrences. Prince Edward Island Overall, 2016 turned out to be a relatively typical fire year in PEI with the number of starts marginally below the 10 year average and the total area burned slightly above the 10 year average. Fire danger levels peaked during the latter half of June.

6
Nova Scotia The winter of 2016 was fairly normal for Nova Scotia with regards to snowfalls and temperatures. We had our typical spring fires before green up. In June, we started to get less rainfall, as the summer progressed we were in a drought situation in two of our three regions in the province. Our permit system for domestic burning allows us to restrict burn-ing on any given day that the fire weather indices are not safe to burn. We did that on numerous days this past sum-mer. We also proclaimed a province-wide woods travel ban for two weeks in August. During the month of August, we experienced a higher them normal volume of wildfires and the indices made them very difficult to control and extinguish. As a result, we experienced numerous large wildfires at the same time which developed into a Type 1 complex with numerous events and agencies involved. We had staff from all over our prov-ince involved in this complex and imported resources from other agencies to help us. We were very lucky that no structures or infrastructure was destroyed by these fires. We did have the only highway which crosses that portion of the province closed for over a week. This was a major inconvenience for all concerned but necessary for the safety of all. The drought continued until late October and we extended our fire crews in two of our regions for two more weeks to ensure we were ready for new starts. We were fortunate that all of the starts after August were controlled very quickly and did not develop into another complex.

7
8

9
Statistics As of December 31, 2016 Canadian Fire Management Agencies recorded 5173 fires with an area consumed of 1,499,883.27 hectares for the 2016 Fire Season.
WILDLAND FIRE STATISTICS - 2016 AS OF DECEMBER 31, 2016
FIRES HECTARES
PRESCRIBED
FIRE
Full Modified Total Total
Full Modified Total
Ltg Human Ltg Human Ltg Human Fires Ha
BC 440 531 46 32 486 563 1049 93209 7157 100366 0 0
YT 9 19 20 5 29 24 53 10 21533 21543 0 0
AB 521 845 0 0 521 845 1366 741550.1 0 741550.1 24 2339.48
NT 42 11 128 8 170 19 189 8112.47 246868.4 254980.9 0 0
SK 79 152 92 41 171 193 364 14,289.6 227,318.2 241,607.8 1 6
MB 59 104 37 2 96 106 202 21,491 16,917 38,408 0 0
ON 149 465 24 10 173 475 648 7273.2 75840.0 83113.2 2 3096
QC 78 424 93 7 171 431 602 782 32589 33371 - -
NL 12 68 3 8 15 76 91 10210.3 743.2 10953.5 1 87.0
NB 13 272 0 0 13 272 285 264.8 0 264.8 0 0
NS 11 263 0 0 11 263 274 754.9 0 754.9 0 0
PE 0 7 0 0 0
7 7 19.7 0 19.7 0 0
PC 10 17 15 1 25 18 43 4770.3 769.1 5539.4 15 2965.85
Tot. 1423 3178 458 114 1881 3292 5173 902737.4 597145.9 1499883.27 43 8494.33
National Preparedness Level days
Levels 1 2 3 4 5
No. of days 53 37 16 2 13
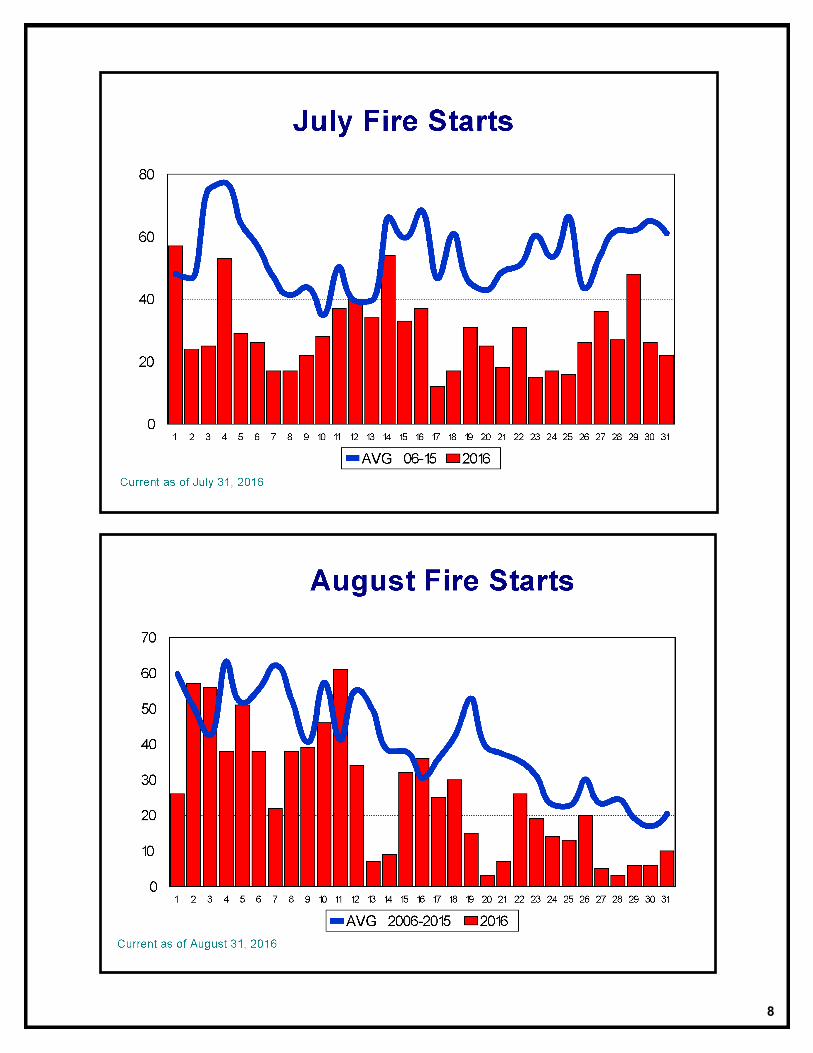
May June July August Fires by Month
934 1060 900 792

10

11
The graph shows Total Person Days for Type 1 personnel mobilized from 2002 to 2016.

12
Wildland Fire Starts
Total Numbers of Fires (Lightning and Human Caused)
2006 2007 2008 2009 2010 2011 2012 2013 2014 2015 Avg. 2016
BC 2,751 1,437 1,817 3,084 1,678 646 1,642 1,854 1,455 1,836 1,733 1,049
YT 80 110 67 118 88 56 126 177 34 184 94 53
AB 1,938 1,164 1,695 1,655 1,837 1,097 1,555 1,214 1,451 1850 1,496 1,366
NT 166 1,353 241 42 224 207 279 248 385 245 340 189
SK 501 370 599 511 571 303 409 429 403 723 442 364
MB 682 364 397 184 583 315 497 494 245 454 401 202
ON 2,281 1,015 338 385 931 1,334 1,615 582 303 668 1,074 648
QC 683 935 222 483 737 329 795 515 292 384 636 602
NL 96 87 139 176 61 53 198 101 124 128 118 91
NB 310 282 168 192 179 81 344 356 178 222 240 285
NS 234 392 247 193 313 116 352 171 171 247 249 274
PE 36 8 3 8 4 4 8 9 4 5 10 7
PC 135 64 103 136 113 67 87 96 81 122 98 43
Total 9,893 7,581 6,036 7,167 7,319 4,608 7,907 6,246 5,126 7,068 6,931 5173

13
Wildland Fire Hectares
2006 2007 2008 2009 2010 2011 2012 2013 2014 2015 Avg. 2016
BC 135,634 28,704 11,939 229,566 331,508 12,357 102,042 17,990 368,785 280,445 151,897 100,366
YT 95,033 41,288 18,845 227,057 146,957 39,091 58,280 179,510 3,160 169,841 97,906 21,543
AB 118,782 105,321 20,644 66,826 83,643 940,596 337,000 21,890 23,120 492,536 221,036 741,550.10
NT 53,398 439,886 353,852 2,057 333,435 406,693 297,618 537,912 3,416,291 646,955 648,810 254,980.90
SK 1,203,722 212,907 1,130,179 37,559 1,734,799 343,720 227,512 312,194 343,430 1,758,376 730,440 241,607.80
MB 166,050 206,924 150,673 2,872 187,494 126,844 216,888 1,115,412 40,333 47,358 226,085 38,408
ON 149,518 40,591 1,314 20,656 14,824 635,373 151,564 43,422 5,386 39,311 110,196 83,113.20
QC 124,176 342.682 1,481 93,972 314,884 12,726 70,086 1,872,842 63,721 5,380 255,961 33,371
NL 3437 10,892 5,140 35,267 1,020 594 225,524 43,076 16,816 3,958 34,572 10,953.50
NB 507 446 143 249 156 45 362 886 112 262 316.8 264.8
NS 1,576 692 2,719 892 463 136 817 301 564 517 868 754.9
PE 51 20 8 3.09 5 6 12 55 4 2 16.609 19.7
PC 2,768 222,134 4,439 38,429 5,912 85,653 273,037 58,377 282,125 458,336 143,121 5,539.40
Total 2,054,652 1,310,148 1,701,376 755,405 3,155,100 2,603,833 1,960,742 4,203,867 4,563,847 3,903,277 2,621,225 1,499,883


