GDPFS in Canada Meteorological Services of Canada, Environment Canada 1.0 Summary of highlights On May 28 2008 at 12 UTC, the Canadian Meteorological Centre's global, had the following changes applied to its data assimilation systems: First, radiance data from 87 infra-red AIRS channels from the AQUA satellite and 7 microwave channels from the SSM/I of the F-13 and F-14 satellites were assimilated by the global and by the regional assimilation systems. Secondly, ocean surface winds from Quickscat's scatterometer, GOES satellite winds from the 3.9 micron channel and supplemental data from AMSUA, AMSUB or MHS near swath edges from the NOAA and AQUA satellites were also assimilated by the global, the regional and the ensemble forecast systems. Further, a new cloud filtering was introduced for the AMSUB and MHS data. In addition, dynamical bias correction of satellite radiances accompanied this new package including the use of version 8 of the fast radiative transfer model RTTOV and, for the global and regional models, the use for the assimilation of radiances of a new vertical interpolator from the RTTOV levels to the GEM levels. Finally AMSUA channel 3 data is no longer assimilated (due to contamination by contribution from the surface). The ensemble system is now making use of the wind profiler data. It also started using the observations 1
Transcript
GDPFS in Canada
Meteorological Services of Canada, Environment Canada
1.0 Summary of highlights
On May 28 2008 at 12 UTC, the Canadian Meteorological Centre's global, had the following changes applied to its data assimilation systems:
First, radiance data from 87 infra-red AIRS channels from the AQUA satellite and 7 microwave channels from the SSM/I of the F-13 and F-14 satellites were assimilated by the global and by the regional assimilation systems.
Secondly, ocean surface winds from Quickscat's scatterometer, GOES satellite winds from the 3.9 micron channel and supplemental data from AMSUA, AMSUB or MHS near swath edges from the NOAA and AQUA satellites were also assimilated by the global, the regional and the ensemble forecast systems. Further, a new cloud filtering was introduced for the AMSUB and MHS data.
In addition, dynamical bias correction of satellite radiances accompanied this new package including the use of version 8 of the fast radiative transfer model RTTOV and, for the global and regional models, the use for the assimilation of radiances of a new vertical interpolator from the RTTOV levels to the GEM levels.
Finally AMSUA channel 3 data is no longer assimilated (due to contamination by contribution from the surface).
The ensemble system is now making use of the wind profiler data. It also started using the observations coming from the first quality control process (background check) instead of waiting for the final variational quality control. This results in a 40-minutes gain in product issuance time with no significant decrease in the forecasts quality.
The national Air Quality Health Index (AQHI) forecast program has been expanded from 15 sites to 26 sites distributed across Canada.
The international collaboration through the North American Ensemble System (NAEFS) continues.
1
The monthly and seasonal forecasting system has been upgraded by running it on 00 and 12UTC data instead of 00UTC only. Forecasts are now produced using 00 and 12UTC runs from the last 5 days instead of using only 00UTC data over the last 10 days. This modification produces a slight improvement in the temperature and precipitation forecasts.
Aside from a small number of minor corrections, no changes were made to the operational NWP models in 2008.
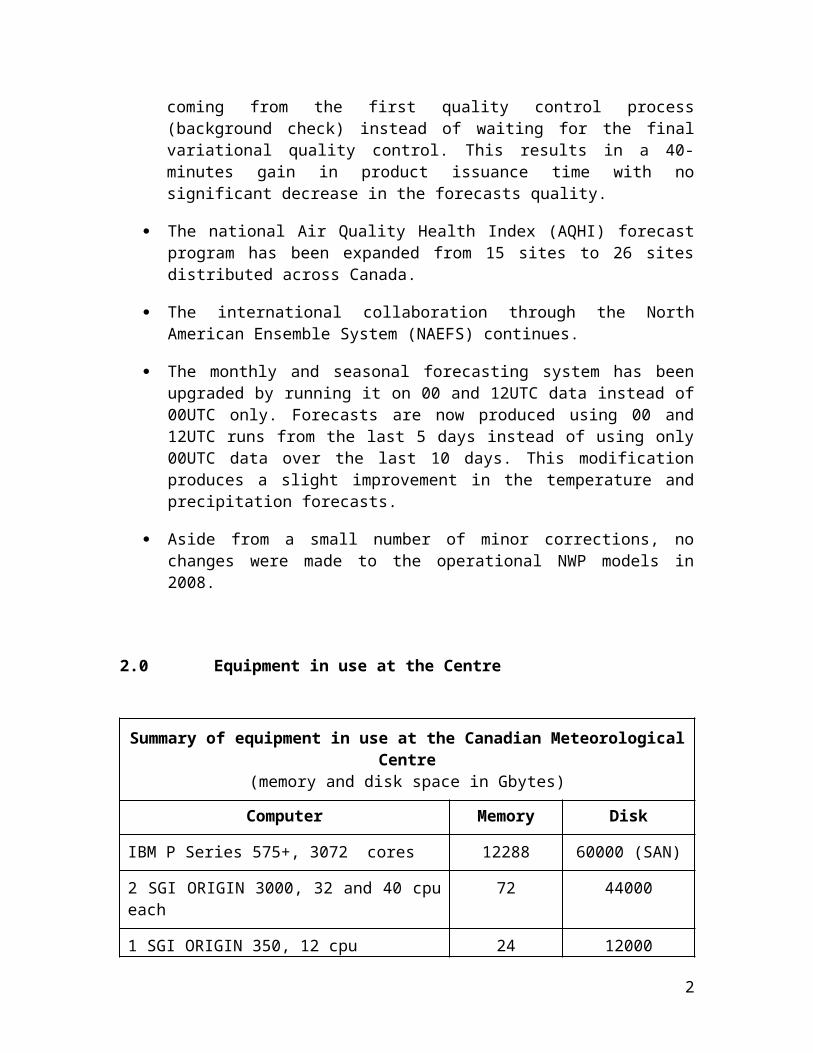
2.0 Equipment in use at the Centre
Summary of equipment in use at the Canadian Meteorological Centre(memory and disk space in Gbytes)
Computer Memory Disk
IBM P Series 575+, 3072 cores 12288 60000 (SAN)
2 SGI ORIGIN 3000, 32 and 40 cpu each 72 44000
1 SGI ORIGIN 350, 12 cpu 24 12000
Hundreds of Dell Power-Edge, 1650/1850/1950/2850/6950 (2 cpu each) with various memory configuration (4-8-16-32-64 GB per) and disk access (local disks, 2x73 or 146GB or 300 GB, or SAN of various capacity and technology (SATA and FC) for over a Petabyte).
2
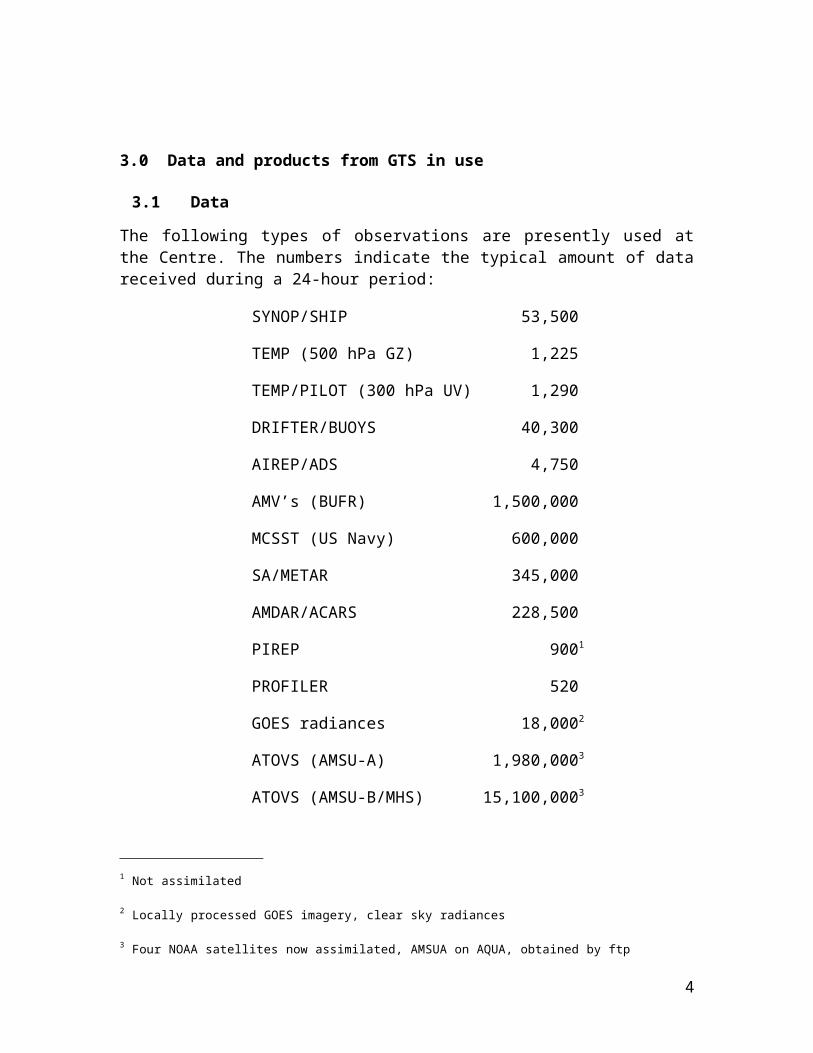
3.0Data and products from GTS in use
3.1 Data
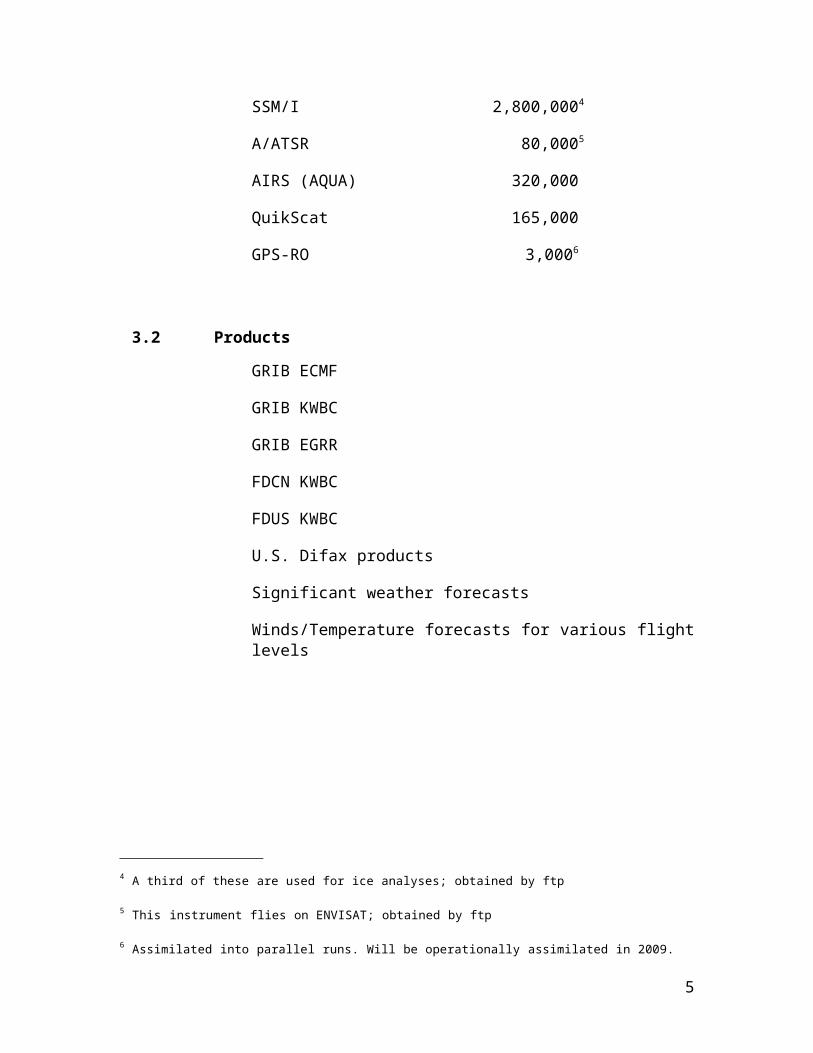
The following types of observations are presently used at the Centre. The numbers indicate the typical amount of data received during a 24-hour period:
3 Four NOAA satellites now assimilated, AMSUA on AQUA, obtained by ftp
4 A third of these are used for ice analyses; obtained by ftp
5 This instrument flies on ENVISAT; obtained by ftp
3
AIRS (AQUA) 320,000
QuikScat 165,000
GPS-RO 3,0006
3.2 Products
GRIB ECMF
GRIB KWBC
GRIB EGRR
FDCN KWBC
FDUS KWBC
U.S. Difax products
Significant weather forecasts
Winds/Temperature forecasts for various flight levels
6 Assimilated into parallel runs. Will be operationally assimilated in 2009.
4
4.0 Forecasting system
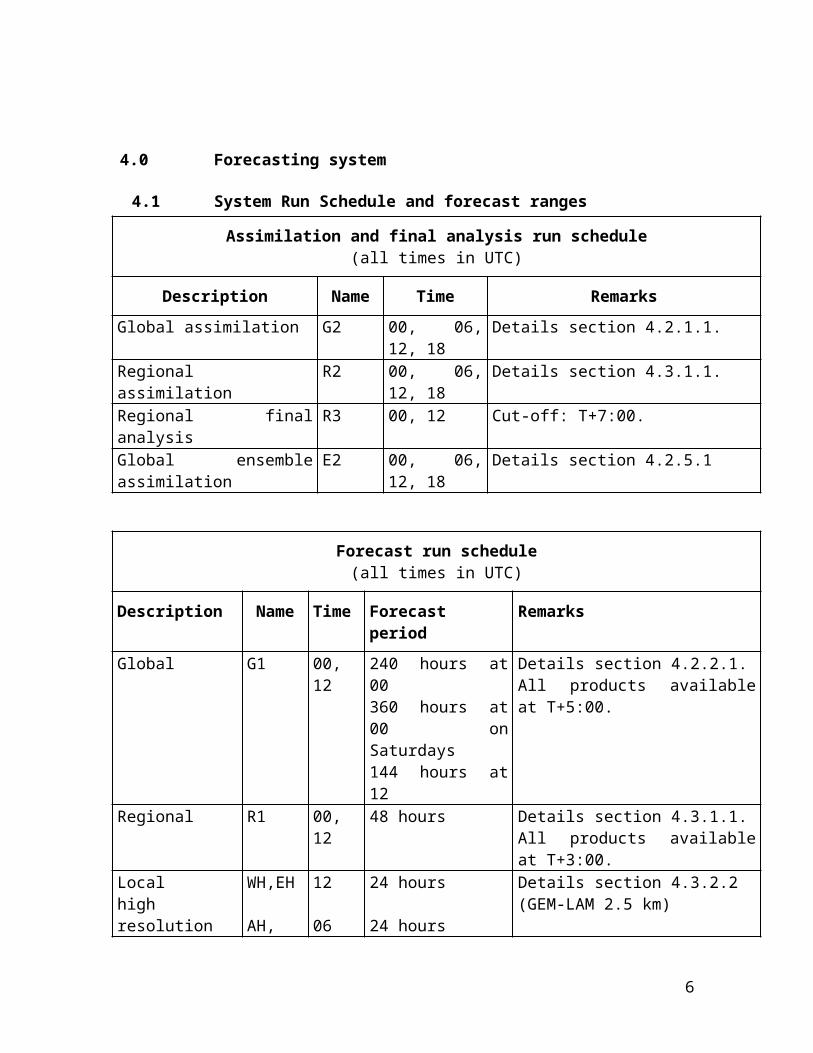
4.1 System Run Schedule and forecast ranges
Assimilation and final analysis run schedule(all times in UTC)
Description Name Time RemarksGlobal assimilation G2 00, 06, 12,
18Details section 4.2.1.1.
Regional assimilation R2 00, 06, 12, 18
Details section 4.3.1.1.
Regional final analysis R3 00, 12 Cut-off: T+7:00.Global ensemble assimilation
E2 00, 06, 12, 18
Details section 4.2.5.1
Forecast run schedule(all times in UTC)
Description Name Time Forecast period RemarksGlobal G1 00, 12 240 hours at 00
360 hours at 00 on Saturdays144 hours at 12
Details section 4.2.2.1.All products available at T+5:00.
Regional R1 00, 12 48 hours Details section 4.3.1.1.All products available at T+3:00.
Localhigh resolution
WH,EH
AH, MH
12
06
24 hours
24 hours
Details section 4.3.2.2(GEM-LAM 2.5 km)
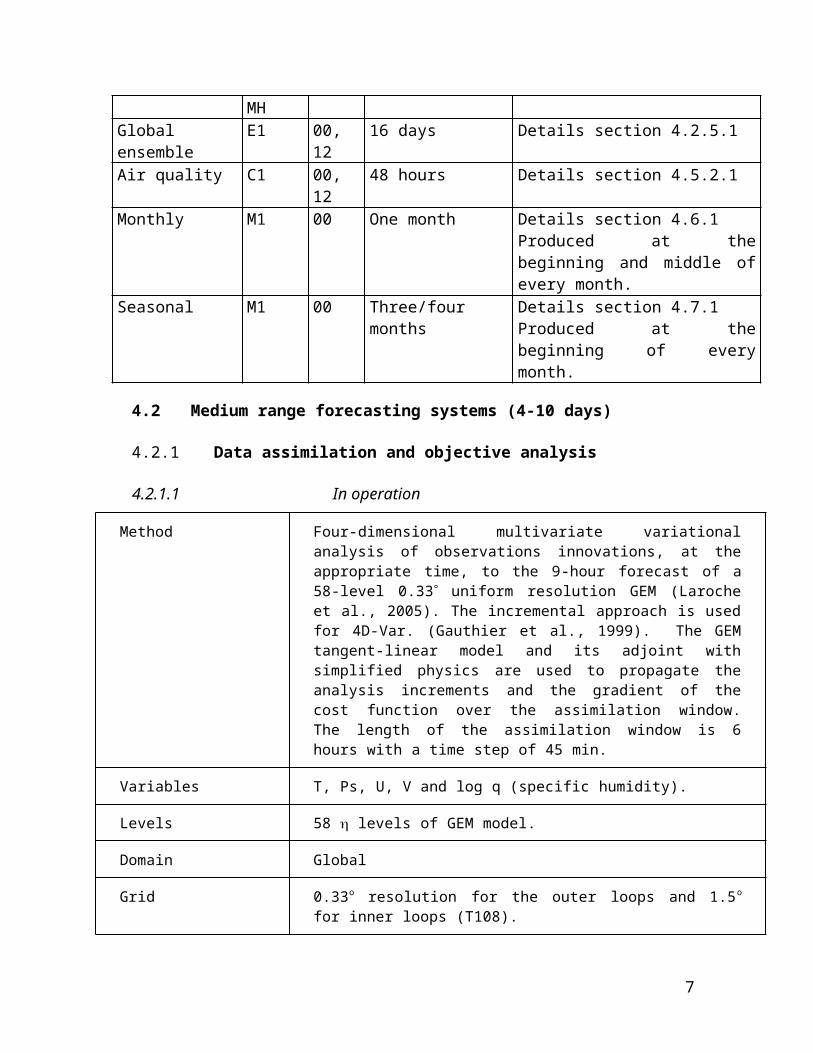
Global ensemble E1 00, 12 16 days Details section 4.2.5.1Air quality C1 00, 12 48 hours Details section 4.5.2.1Monthly M1 00 One month Details section 4.6.1
Produced at the beginning and middle of every month.
Seasonal M1 00 Three/four months Details section 4.7.1Produced at the beginning of every month.
5
4.2 Medium range forecasting systems (4-10 days)
4.2.1 Data assimilation and objective analysis
4.2.1.1 In operation
Method Four-dimensional multivariate variational analysis of observations innovations, at the appropriate time, to the 9-hour forecast of a 58-level 0.33 uniform resolution GEM (Laroche et al., 2005). The incremental approach is used for 4D-Var. (Gauthier et al., 1999). The GEM tangent-linear model and its adjoint with simplified physics are used to propagate the analysis increments and the gradient of the cost function over the assimilation window. The length of the assimilation window is 6 hours with a time step of 45 min.
Variables T, Ps, U, V and log q (specific humidity).
Levels 58 levels of GEM model.
Domain Global
Grid 0.33o resolution for the outer loops and 1.5o for inner loops (T108).
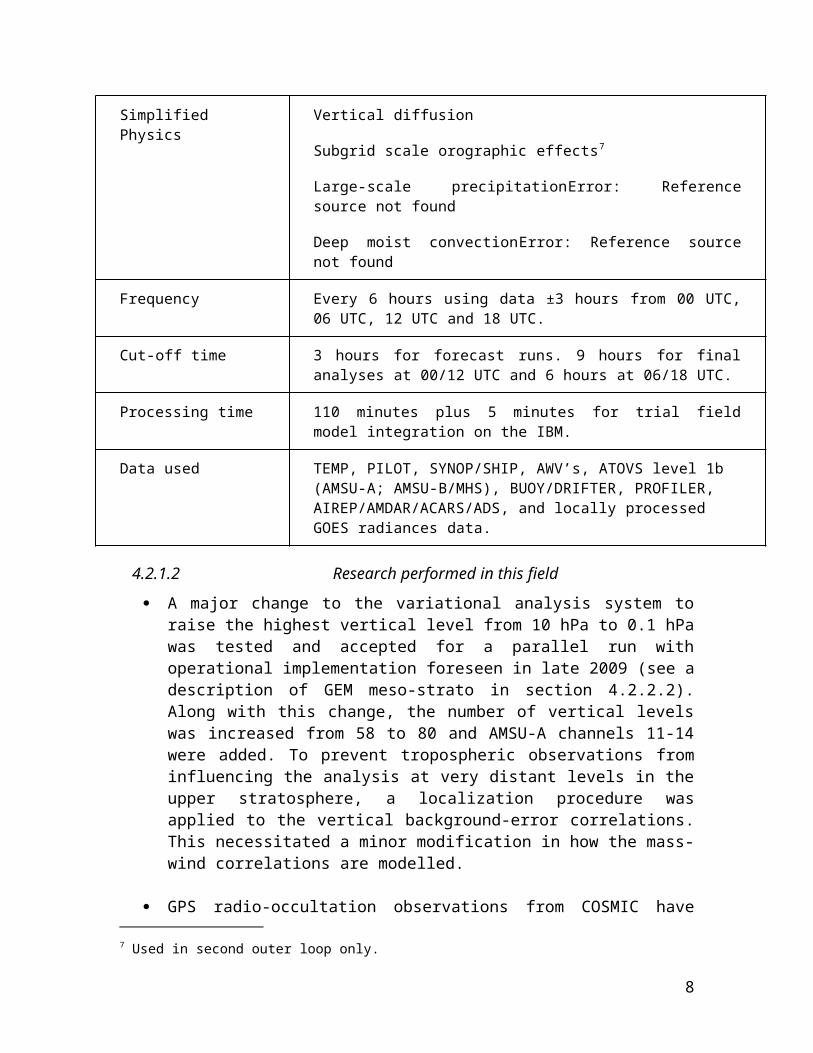
Simplified Physics Vertical diffusion
Subgrid scale orographic effects7
Large-scale precipitationError: Reference source not found
Deep moist convectionError: Reference source not found
Frequency Every 6 hours using data ±3 hours from 00 UTC, 06 UTC, 12 UTC and 18 UTC.
Cut-off time 3 hours for forecast runs. 9 hours for final analyses at 00/12 UTC and 6 hours at 06/18 UTC.
Processing time 110 minutes plus 5 minutes for trial field model integration on the IBM.
Data used TEMP, PILOT, SYNOP/SHIP, AWV’s, ATOVS level 1b (AMSU-A; AMSU-B/MHS), BUOY/DRIFTER, PROFILER, AIREP/AMDAR/ACARS/ADS, and locally processed GOES radiances data.
7 Used in second outer loop only.
6
4.2.1.2 Research performed in this field
A major change to the variational analysis system to raise the highest vertical level from 10 hPa to 0.1 hPa was tested and accepted for a parallel run with operational implementation foreseen in late 2009 (see a description of GEM meso-strato in section 4.2.2.2). Along with this change, the number of vertical levels was increased from 58 to 80 and AMSU-A channels 11-14 were added. To prevent tropospheric observations from influencing the analysis at very distant levels in the upper stratosphere, a localization procedure was applied to the vertical background-error correlations. This necessitated a minor modification in how the mass-wind correlations are modelled.
GPS radio-occultation observations from COSMIC have been assimilated during a parallel implementation during fall 2008. Data from METOP GRAS and GRACE have also been tested and will be included as a minor upgrade by spring of 2009. These data have shown significant impact at all levels, in both summer and winter (Aparicio and Deblonde, 2008, Aparicio et al. 2009). The largest impacts are on temperature for the 500-50 hPa levels. Both bias and standard deviation are positively impacted, and the presence of these data helps control the bias of the upper radiance channels. Positive impact can also be seen in geopotential and winds at jet levels. The impact is particularly large in data-sparse areas, and notably in Antarctica. Tests with the upgraded high-lid (0.1 hPa) model version show that the impact of the assimilation of these data is also positive up to at least 2 hPa. The current operational lid is 10 hPa.
Work on the assimilation of clear sky Infrared radiances from the European hyperspectral infrared vertical sounder IASI (Infrared Atmospheric Sounding Interferometer) is ongoing. The assimilation procedure used was first inspired by AIRS radiance processing. It has been improved to use sub-pixel information resulting from AVHRR radiance cluster analysis. 4D-Var assimilation experiments performed for the beginning of winter 2008 showed a positive impact of IASI clear sky radiances assimilation in the global forecast system, particularly in the southern hemisphere. The next assimilations tests will be performed using the new Meso-Strato GEM model (see section 4.2.2.2). Operational implementation of the assimilation of clear sky IASI radiances is expected in 2009.
A series of observation impact experiments were carried out to assess the impact of the available radiosonde and aircraft data over North America, as well as the impact of the available satellite data over North Pacific (see Laroche and Sarrazin, 2009a,b). It was found that the impact on the accuracy of forecasts over the North American continent is not uniform. The radiosonde and aircraft data together are the main contributors to the forecast skill on short-range forecasts over North America. However, as
7
the effect of the satellite observations over the North Pacific Ocean moves downstream over the continent, their impact on forecasts becomes dominant for forecast lengths greater than 36 h over western North America, and greater than 72 h over the eastern part of the continent. The impact of these satellite observations is more important over the continental United States than over Canada. The separate impact of the aircraft and radiosonde observing networks collocated over southern Canada and the United States is much weaker than their joint impact. For short-range forecasts, the effect of aircraft observations is more important than radiosonde data over the eastern North America. Finally, the quality of the forecasts over the Canadian Arctic heavily relies on the radiosonde network. This work was presented at the 4th WMO Workshop on the impact of various observing systems on Numerical Weather Prediction.
An adjoint-based method was developed to produce an assessment of the impact of the global observing network on the reduction of short-range forecast error in the Meso-Strato Global Forecast System. The adjoint-based method is a 4D extension of the method proposed by Langland and Baker (2004), which depends on short-range forecast sensitivity with respect to observations. The method will be run in real time to assess observation impact of the coming Meso-Strato forecast system expected to be operational in 2009.
8
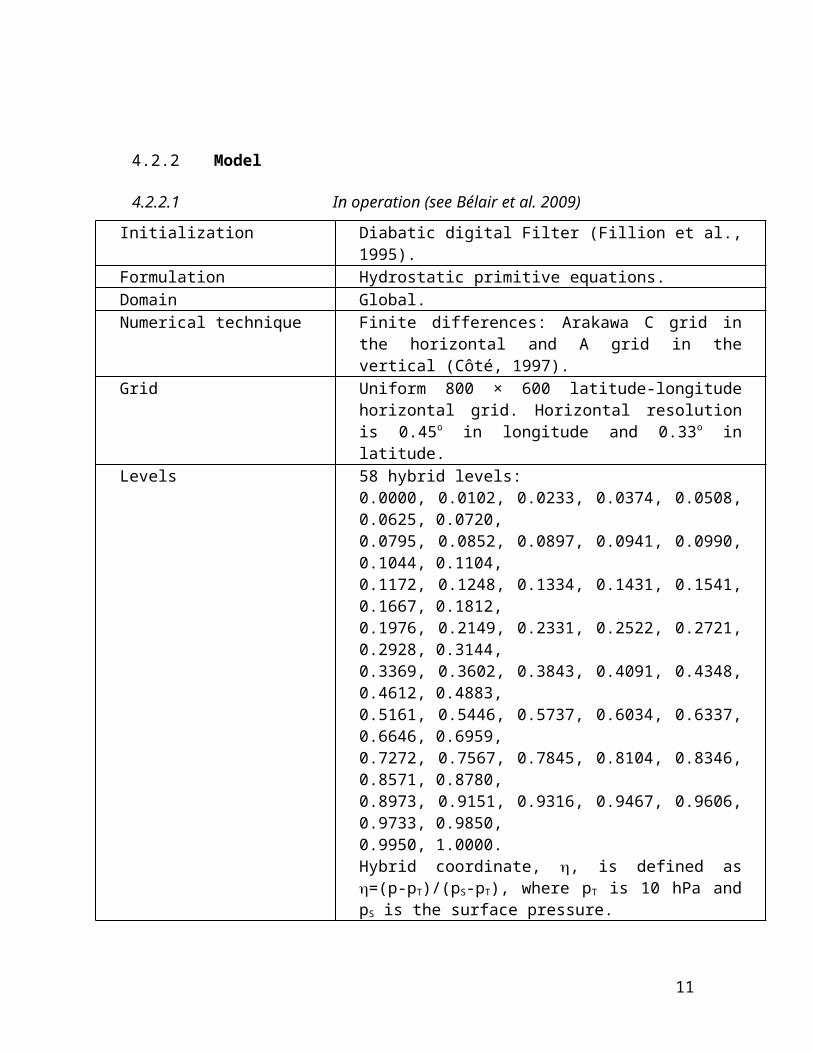
4.2.2 Model
4.2.2.1 In operation (see Bélair et al. 2009)
Initialization Diabatic digital Filter (Fillion et al., 1995).Formulation Hydrostatic primitive equations.Domain Global.Numerical technique Finite differences: Arakawa C grid in the horizontal
and A grid in the vertical (Côté, 1997).Grid Uniform 800 × 600 latitude-longitude horizontal grid.
Horizontal resolution is 0.45o in longitude and 0.33o in latitude.
Levels 58 hybrid levels:0.0000, 0.0102, 0.0233, 0.0374, 0.0508, 0.0625, 0.0720,0.0795, 0.0852, 0.0897, 0.0941, 0.0990, 0.1044, 0.1104,0.1172, 0.1248, 0.1334, 0.1431, 0.1541, 0.1667, 0.1812,0.1976, 0.2149, 0.2331, 0.2522, 0.2721, 0.2928, 0.3144,0.3369, 0.3602, 0.3843, 0.4091, 0.4348, 0.4612, 0.4883,0.5161, 0.5446, 0.5737, 0.6034, 0.6337, 0.6646, 0.6959,0.7272, 0.7567, 0.7845, 0.8104, 0.8346, 0.8571, 0.8780,0.8973, 0.9151, 0.9316, 0.9467, 0.9606, 0.9733, 0.9850,0.9950, 1.0000.Hybrid coordinate, , is defined as =(p-pT)/(pS-pT), where pT is 10 hPa and pS is the surface pressure.
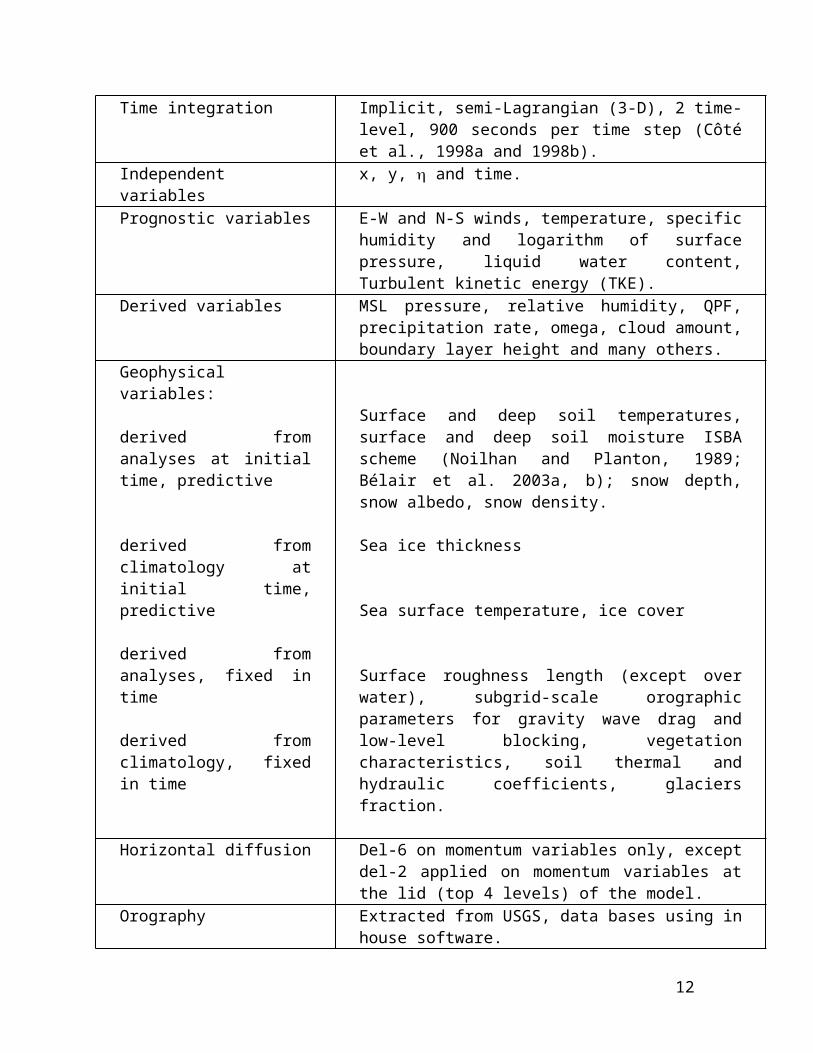
Time integration Implicit, semi-Lagrangian (3-D), 2 time-level, 900 seconds per time step (Côté et al., 1998a and 1998b).
Independent variables x, y, and time.Prognostic variables E-W and N-S winds, temperature, specific humidity
and logarithm of surface pressure, liquid water content, Turbulent kinetic energy (TKE).
Derived variables MSL pressure, relative humidity, QPF, precipitation rate, omega, cloud amount, boundary layer height and many others.
9
Geophysical variables:
derived from analyses at initial time, predictive
derived from climatology at initial time, predictive
derived from analyses, fixed in time
derived from climatology, fixed in time
Surface and deep soil temperatures, surface and deep soil moisture ISBA scheme (Noilhan and Planton, 1989; Bélair et al. 2003a, b); snow depth, snow albedo, snow density.
Sea ice thickness
Sea surface temperature, ice cover
Surface roughness length (except over water), subgrid-scale orographic parameters for gravity wave drag and low-level blocking, vegetation characteristics, soil thermal and hydraulic coefficients, glaciers fraction.
Horizontal diffusion Del-6 on momentum variables only, except del-2 applied on momentum variables at the lid (top 4 levels) of the model.
Orography Extracted from USGS, data bases using in house software.
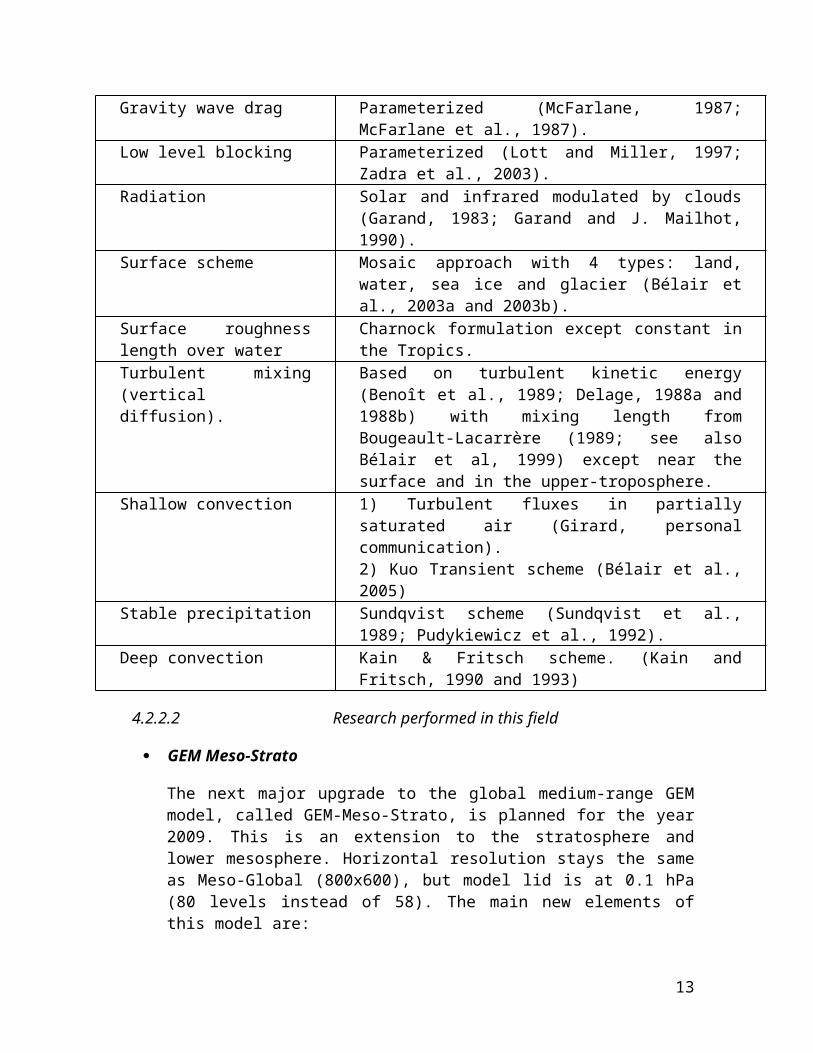
Gravity wave drag Parameterized (McFarlane, 1987; McFarlane et al., 1987).
Low level blocking Parameterized (Lott and Miller, 1997; Zadra et al., 2003).
Radiation Solar and infrared modulated by clouds (Garand, 1983; Garand and J. Mailhot, 1990).
Surface scheme Mosaic approach with 4 types: land, water, sea ice and glacier (Bélair et al., 2003a and 2003b).
Surface roughness length over water
Charnock formulation except constant in the Tropics.
Turbulent mixing (vertical diffusion).
Based on turbulent kinetic energy (Benoît et al., 1989; Delage, 1988a and 1988b) with mixing length from Bougeault-Lacarrère (1989; see also Bélair et al, 1999) except near the surface and in the upper-troposphere.
Shallow convection 1) Turbulent fluxes in partially saturated air (Girard, personal communication).2) Kuo Transient scheme (Bélair et al., 2005)
Stable precipitation Sundqvist scheme (Sundqvist et al., 1989; Pudykiewicz et al., 1992).
10
Deep convection Kain & Fritsch scheme. (Kain and Fritsch, 1990 and 1993)
4.2.2.2 Research performed in this field
GEM Meso-Strato
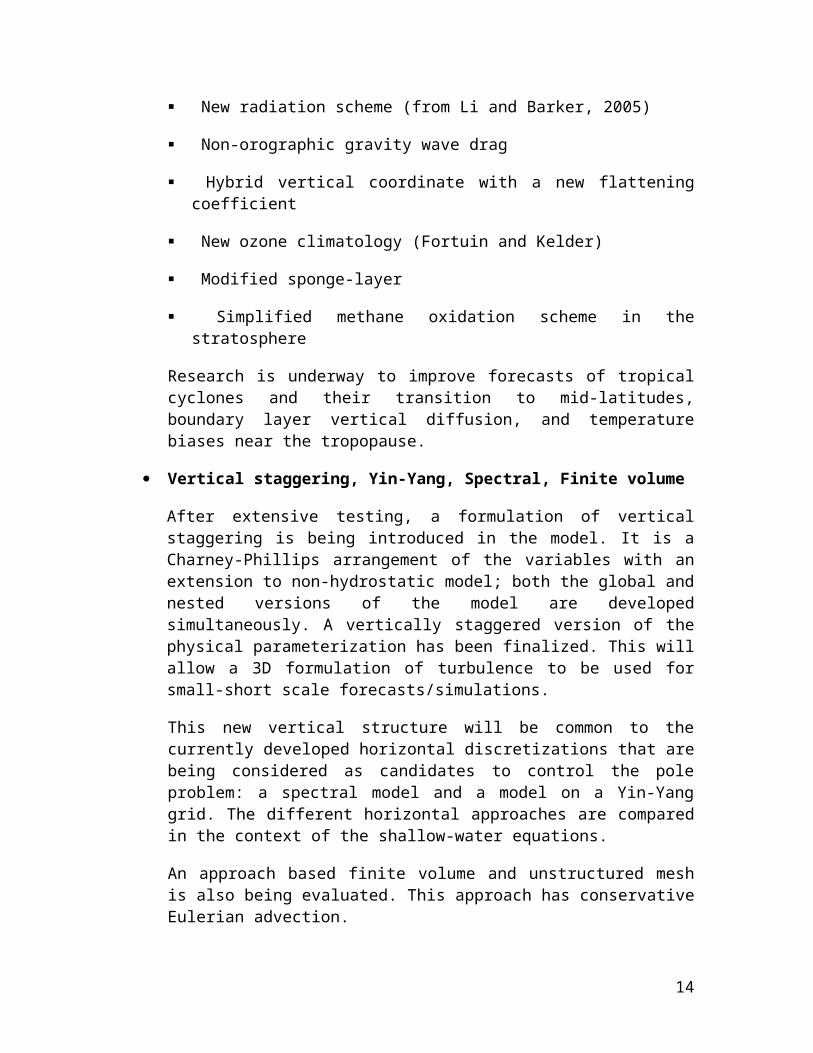
The next major upgrade to the global medium-range GEM model, called GEM-Meso-Strato, is planned for the year 2009. This is an extension to the stratosphere and lower mesosphere. Horizontal resolution stays the same as Meso-Global (800x600), but model lid is at 0.1 hPa (80 levels instead of 58). The main new elements of this model are:
New radiation scheme (from Li and Barker, 2005)
Non-orographic gravity wave drag
Hybrid vertical coordinate with a new flattening coefficient
New ozone climatology (Fortuin and Kelder)
Modified sponge-layer
Simplified methane oxidation scheme in the stratosphere
Research is underway to improve forecasts of tropical cyclones and their transition to mid-latitudes, boundary layer vertical diffusion, and temperature biases near the tropopause.
After extensive testing, a formulation of vertical staggering is being introduced in the model. It is a Charney-Phillips arrangement of the variables with an extension to non-hydrostatic model; both the global and nested versions of the model are developed simultaneously. A vertically staggered version of the physical parameterization has been finalized. This will allow a 3D formulation of turbulence to be used for small-short scale forecasts/simulations.
This new vertical structure will be common to the currently developed horizontal discretizations that are being considered as candidates to control the pole problem: a spectral model and a model on a Yin-Yang grid. The different horizontal approaches are compared in the context of the shallow-water equations.
An approach based finite volume and unstructured mesh is also being evaluated. This approach has conservative Eulerian advection.
11
4.2.3 Operationally available Numerical Weather Prediction (NWP) products
4.2.3.1 Analysis
A series of classic analysis products are available in electronic or chart form (snow depth and snow cover, sea surface temperature, surface MSLP and fronts, upper-air geopotential, winds and temperature at 1000, 850, 700, 500, 250 hPa, etc.).
4.2.3.2 Forecasts
A series of classic forecast products are available in electronic or chart form (MSLP and 1000-500 hPa thickness, 500 hPa geopotential height and absolute vorticity, cumulative precipitation over given periods and vertical velocity, 700 hPa geopotential height and relative humidity). A wide range of bulletins containing spot forecasts for many locations are produced. As well, other specialized products such as precipitation type and probability of precipitation forecasts, temperature and temperature anomaly forecasts are produced.
12
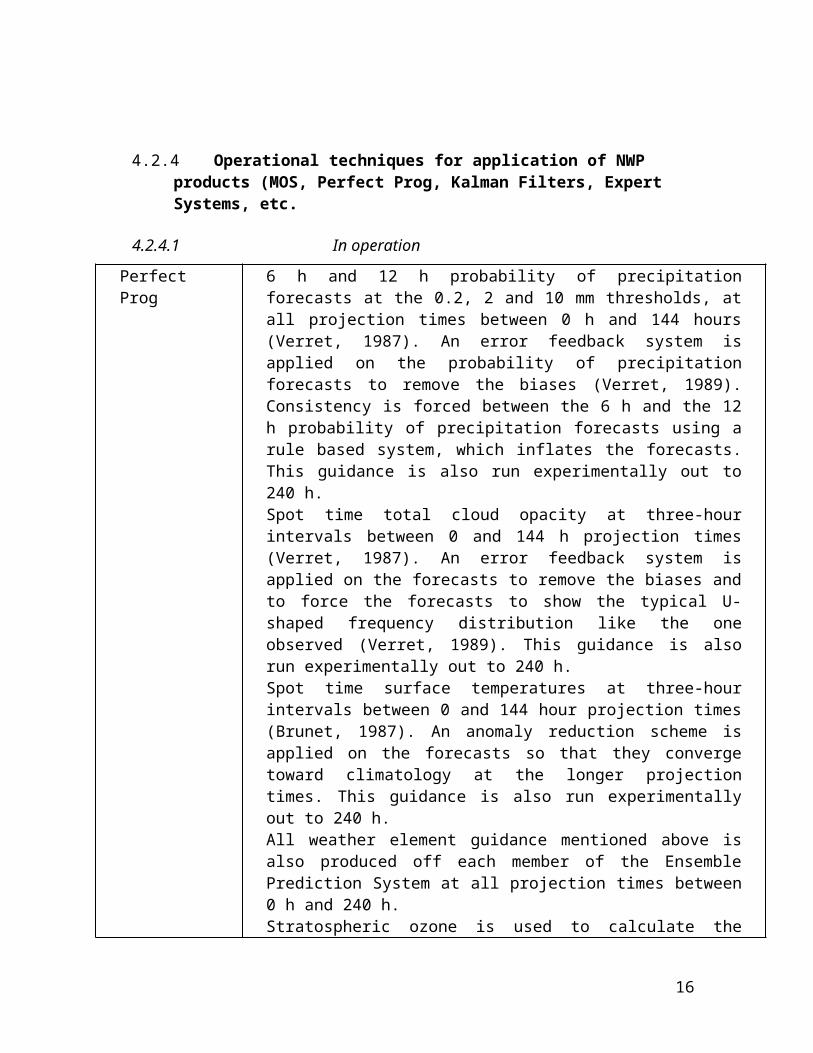
4.2.4 Operational techniques for application of NWP products (MOS, Perfect Prog, Kalman Filters, Expert Systems, etc.
4.2.4.1 In operation
Perfect Prog 6 h and 12 h probability of precipitation forecasts at the 0.2, 2 and 10 mm thresholds, at all projection times between 0 h and 144 hours (Verret, 1987). An error feedback system is applied on the probability of precipitation forecasts to remove the biases (Verret, 1989). Consistency is forced between the 6 h and the 12 h probability of precipitation forecasts using a rule based system, which inflates the forecasts. This guidance is also run experimentally out to 240 h.Spot time total cloud opacity at three-hour intervals between 0 and 144 h projection times (Verret, 1987). An error feedback system is applied on the forecasts to remove the biases and to force the forecasts to show the typical U-shaped frequency distribution like the one observed (Verret, 1989). This guidance is also run experimentally out to 240 h.Spot time surface temperatures at three-hour intervals between 0 and 144 hour projection times (Brunet, 1987). An anomaly reduction scheme is applied on the forecasts so that they converge toward climatology at the longer projection times. This guidance is also run experimentally out to 240 h.All weather element guidance mentioned above is also produced off each member of the Ensemble Prediction System at all projection times between 0 h and 240 h.Stratospheric ozone is used to calculate the Canadian UV Index (Burrows et al., 1994).
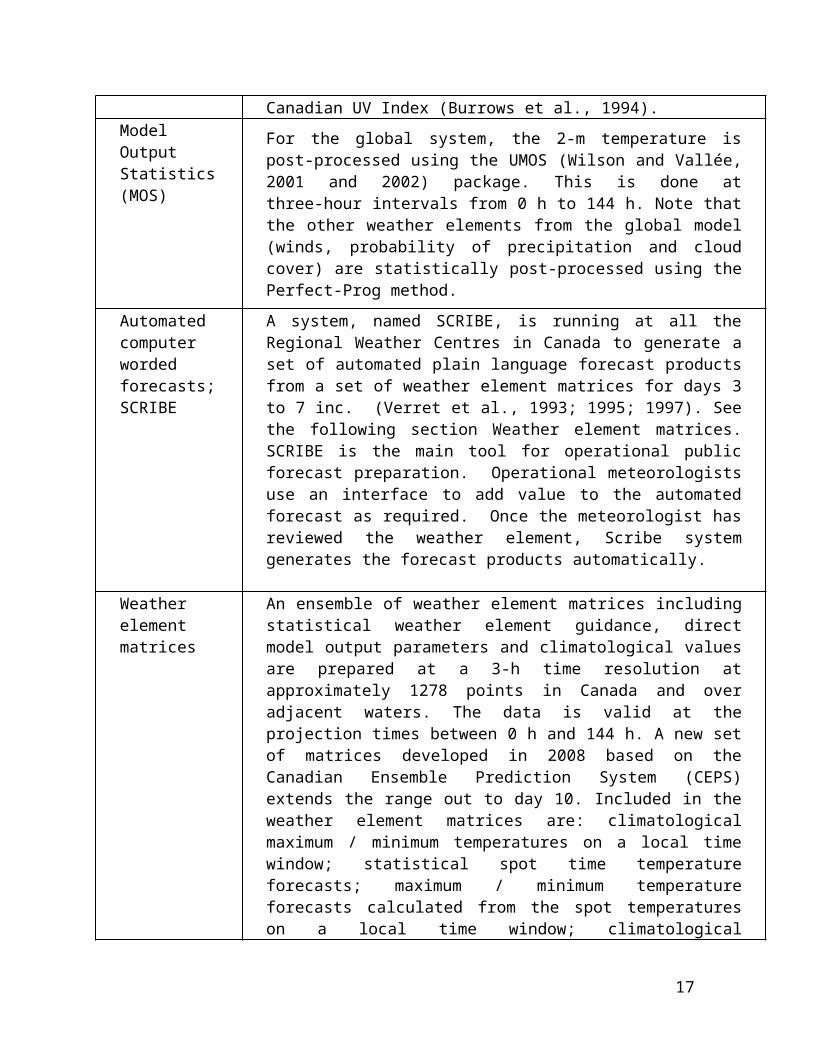
Model Output Statistics (MOS)
For the global system, the 2-m temperature is post-processed using the UMOS (Wilson and Vallée, 2001 and 2002) package. This is done at three-hour intervals from 0 h to 144 h. Note that the other weather elements from the global model (winds, probability of precipitation and cloud cover) are statistically post-processed using the Perfect-Prog method.
Automated computer worded forecasts;SCRIBE
A system, named SCRIBE, is running at all the Regional Weather Centres in Canada to generate a set of automated plain language forecast products from a set of weather element matrices for days 3 to 7 inc. (Verret et al., 1993; 1995; 1997). See the following section Weather element matrices. SCRIBE is the main tool for operational public forecast preparation. Operational meteorologists use an interface to add value to the automated forecast as required. Once the meteorologist has reviewed the
13
weather element, Scribe system generates the forecast products automatically.
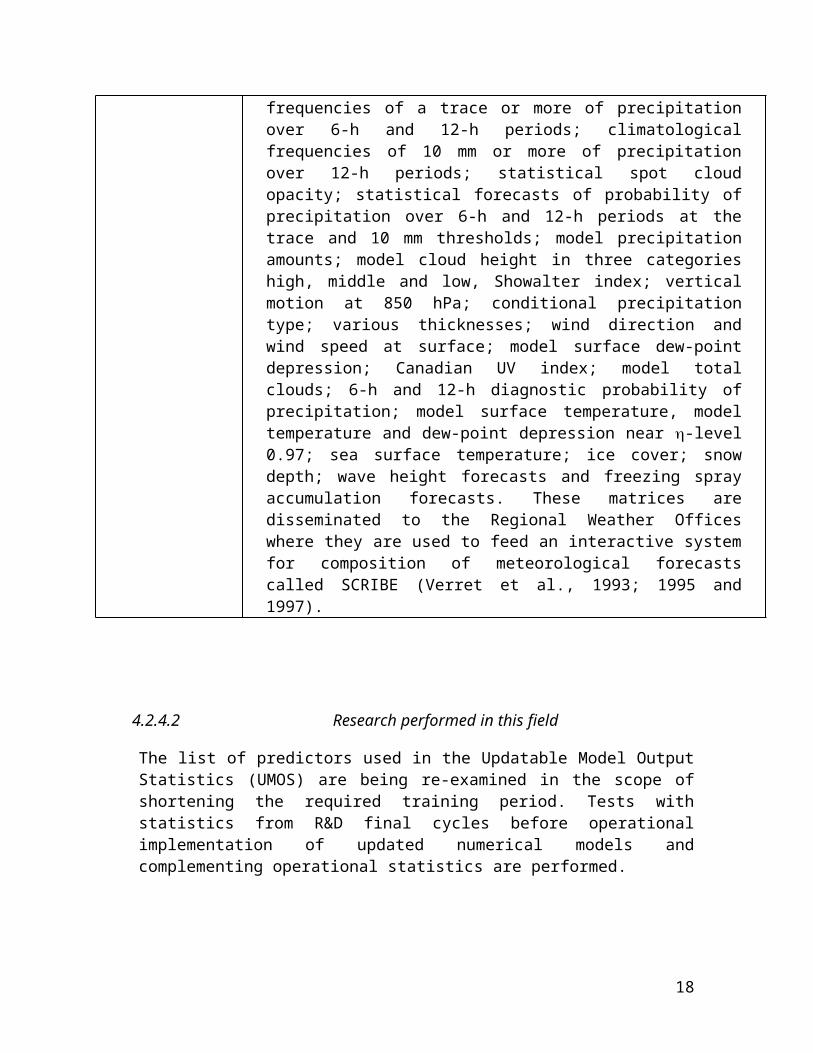
Weather element matrices
An ensemble of weather element matrices including statistical weather element guidance, direct model output parameters and climatological values are prepared at a 3-h time resolution at approximately 1278 points in Canada and over adjacent waters. The data is valid at the projection times between 0 h and 144 h. A new set of matrices developed in 2008 based on the Canadian Ensemble Prediction System (CEPS) extends the range out to day 10. Included in the weather element matrices are: climatological maximum / minimum temperatures on a local time window; statistical spot time temperature forecasts; maximum / minimum temperature forecasts calculated from the spot temperatures on a local time window; climatological frequencies of a trace or more of precipitation over 6-h and 12-h periods; climatological frequencies of 10 mm or more of precipitation over 12-h periods; statistical spot cloud opacity; statistical forecasts of probability of precipitation over 6-h and 12-h periods at the trace and 10 mm thresholds; model precipitation amounts; model cloud height in three categories high, middle and low, Showalter index; vertical motion at 850 hPa; conditional precipitation type; various thicknesses; wind direction and wind speed at surface; model surface dew-point depression; Canadian UV index; model total clouds; 6-h and 12-h diagnostic probability of precipitation; model surface temperature, model temperature and dew-point depression near -level 0.97; sea surface temperature; ice cover; snow depth; wave height forecasts and freezing spray accumulation forecasts. These matrices are disseminated to the Regional Weather Offices where they are used to feed an interactive system for composition of meteorological forecasts called SCRIBE (Verret et al., 1993; 1995 and 1997).
4.2.4.2 Research performed in this field
The list of predictors used in the Updatable Model Output Statistics (UMOS) are being re-examined in the scope of shortening the required training period. Tests with statistics from R&D final cycles before operational implementation of updated numerical models and complementing operational statistics are performed.
14
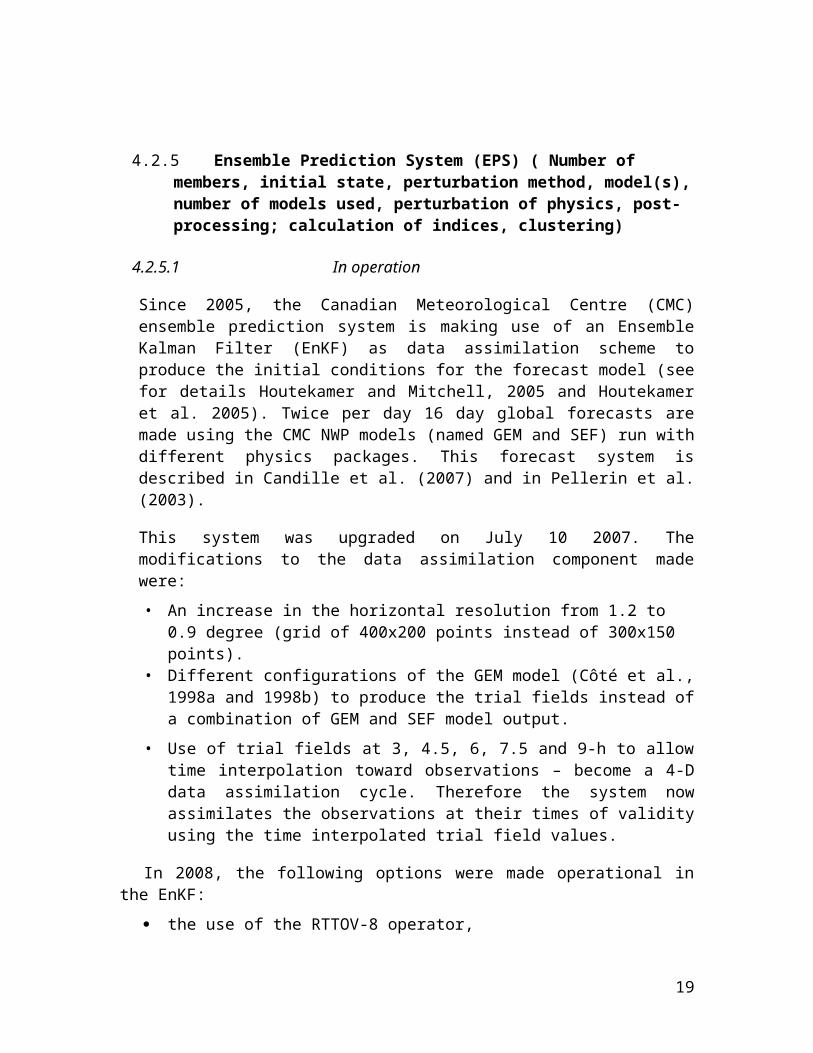
4.2.5 Ensemble Prediction System (EPS) ( Number of members, initial state, perturbation method, model(s), number of models used, perturbation of physics, post-processing; calculation of indices, clustering)
4.2.5.1 In operation
Since 2005, the Canadian Meteorological Centre (CMC) ensemble prediction system is making use of an Ensemble Kalman Filter (EnKF) as data assimilation scheme to produce the initial conditions for the forecast model (see for details Houtekamer and Mitchell, 2005 and Houtekamer et al. 2005). Twice per day 16 day global forecasts are made using the CMC NWP models (named GEM and SEF) run with different physics packages. This forecast system is described in Candille et al. (2007) and in Pellerin et al. (2003).
This system was upgraded on July 10 2007. The modifications to the data assimilation component made were:
• An increase in the horizontal resolution from 1.2 to 0.9 degree (grid of 400x200 points instead of 300x150 points).
• Different configurations of the GEM model (Côté et al., 1998a and 1998b) to produce the trial fields instead of a combination of GEM and SEF model output.
• Use of trial fields at 3, 4.5, 6, 7.5 and 9-h to allow time interpolation toward observations – become a 4-D data assimilation cycle. Therefore the system now assimilates the observations at their times of validity using the time interpolated trial field values.
In 2008, the following options were made operational in the EnKF:
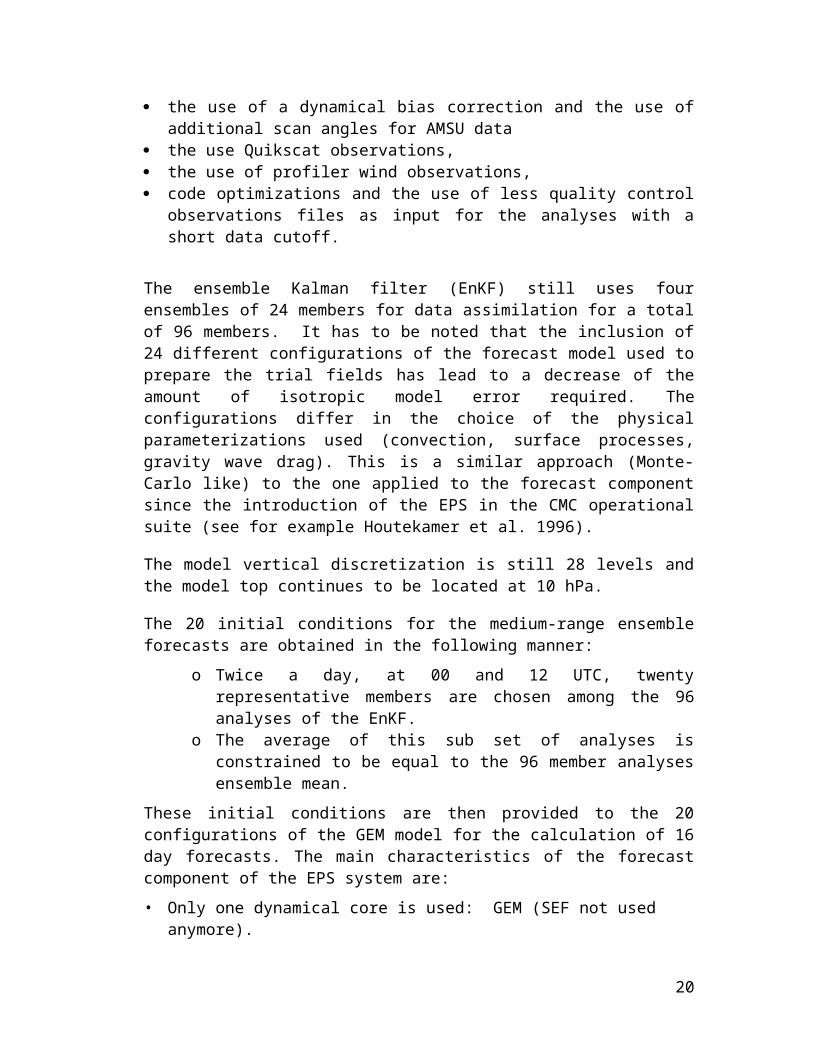
the use of the RTTOV-8 operator, the use of a dynamical bias correction and the use of additional scan
angles for AMSU data the use Quikscat observations, the use of profiler wind observations, code optimizations and the use of less quality control observations files as
input for the analyses with a short data cutoff.
The ensemble Kalman filter (EnKF) still uses four ensembles of 24 members for data assimilation for a total of 96 members. It has to be noted that the inclusion of 24 different configurations of the forecast model used to prepare the trial fields has lead to a decrease of the amount of isotropic model error required. The configurations differ in the choice of the physical parameterizations used (convection, surface processes, gravity wave drag).
15
This is a similar approach (Monte-Carlo like) to the one applied to the forecast component since the introduction of the EPS in the CMC operational suite (see for example Houtekamer et al. 1996).
The model vertical discretization is still 28 levels and the model top continues to be located at 10 hPa.
The 20 initial conditions for the medium-range ensemble forecasts are obtained in the following manner:
o Twice a day, at 00 and 12 UTC, twenty representative members are chosen among the 96 analyses of the EnKF.
o The average of this sub set of analyses is constrained to be equal to the 96 member analyses ensemble mean.
These initial conditions are then provided to the 20 configurations of the GEM model for the calculation of 16 day forecasts. The main characteristics of the forecast component of the EPS system are:
• Only one dynamical core is used: GEM (SEF not used anymore).• Horizontal resolution :0.9 degree (lat-lon) as for the assimilation
component.• Ensemble size: 20• Stochastic perturbations of the physical tendencies inspired from Buizza
et al. (1999) (Markov chains with random number between 0.5 and 1.5 described in Li et al. 2008).
• Stochastic kinetic energy back-scattering parameterization is used as in Shutts (2005).
• The physical parameterization package includes the Kain&Fritsch (1990, 1993) deep convection scheme and the Bougeault&Lacarrère (1989) mixing length formulation.
Using only one dynamical model core (GEM) instead of two (GEM &SEF) has led to a simplification of the forecast system that should decrease the cost of future maintenance. This simplification has also resulted in a more uniform forecast quality between the members.
4.2.5.2 Research performed in this field
In 2008, the following options were tested in the EnKF; the use of GPS-RO observations, the use of 58 model levels, a relaxation of the sequential analysis algorithm with a reduced number of
analysis batches, the use of input observation files coming from the futur deterministic
model (GEM meso-strato; see section 4.2.2.2) which has its model top at 0.1 hPa.
16
The project for the integration of the ensemble forecasts for day 6-7 into the public forecast system is almost completed.
4.2.5.3 Operationally available EPS Products
The following EPS products are available on the web as forecast charts ( http://www.weatheroffice.gc.ca/ensemble/index_e.html ) :
10-day mean temperature anomaly
Spaghetti plots of the 500 hPa heights
Calibrated probability of equivalent precipitation for various thresholds
Accumulated quantity of precipitation
Sea level pressure centres
500-hPa geopotential heights
Also available on the web page is the ensemble spread of trial fields.
The EPS forecasts grids are available in digital format (GRIB1) from a MSC server. Technical details as well as the terms and conditions of utilization of these data are available at this address: http://www.weatheroffice.gc.ca/grib/index_e.html
The Canadian ensemble outputs are used in the North American Ensemble System (NAEFS) project, a joint initiative involving the MSC, the United States National Weather Service (NWS) and the National Meteorological Service of Mexico (NMSM). The following products based on the NAEFS joint ensemble forecasts are available on the official MSC web server (http://weatheroffice.gc.ca/ensemble/index_naefs_e.html):
Temperature anomaly for the second week (day 8 to 14 outlooks). This is a new NCEP/MSC common product.
EPSgrams for more than 300 cities in Canada, Mexico and United States
Ensemble means and standard deviation charts for various gridded fields
Charts of probabilities of occurrence of several weather elements
As mentioned in section 4.2.4.1, the Canadian EPS is used to produced Scribe matrices form day 1 to day 10.
4.3.1 Data assimilation, Objective analysis and initialization
4.3.1.1 In operation
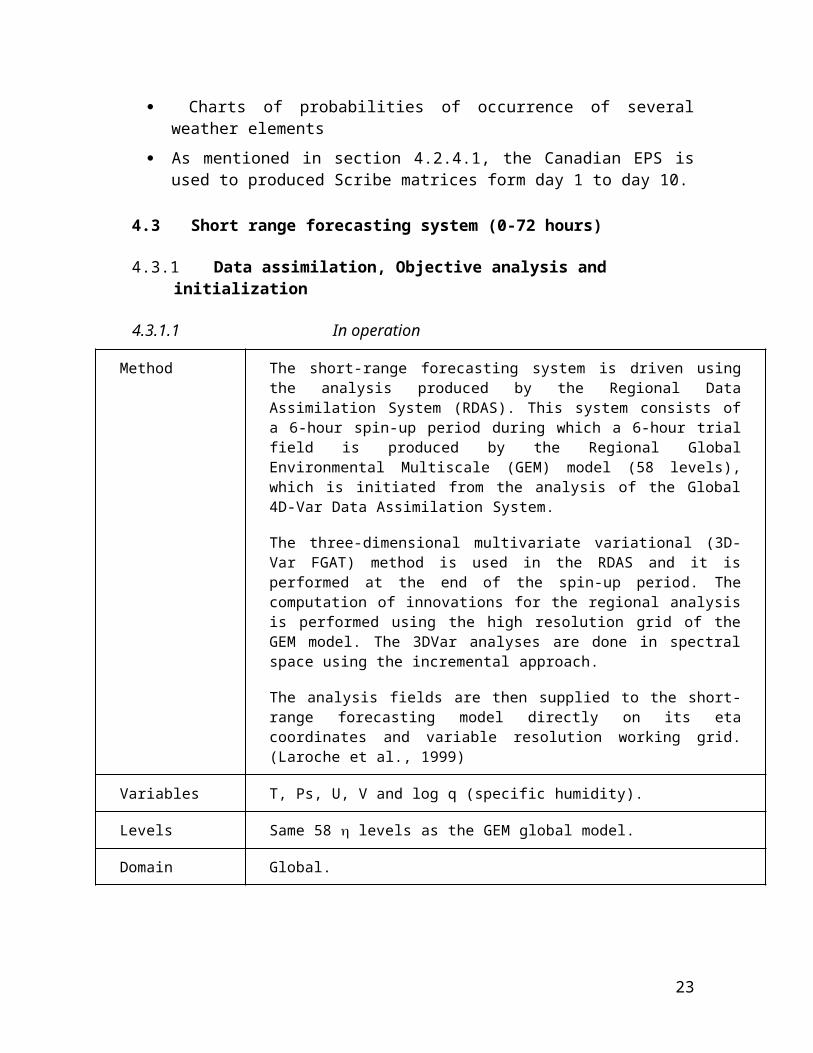
Method The short-range forecasting system is driven using the analysis produced by the Regional Data Assimilation System (RDAS). This system consists of a 6-hour spin-up period during which a 6-hour trial field is produced by the Regional Global Environmental Multiscale (GEM) model (58 levels), which is initiated from the analysis of the Global 4D-Var Data Assimilation System.
The three-dimensional multivariate variational (3D-Var FGAT) method is used in the RDAS and it is performed at the end of the spin-up period. The computation of innovations for the regional analysis is performed using the high resolution grid of the GEM model. The 3DVar analyses are done in spectral space using the incremental approach.
The analysis fields are then supplied to the short-range forecasting model directly on its eta coordinates and variable resolution working grid. (Laroche et al., 1999)
Variables T, Ps, U, V and log q (specific humidity).
Levels Same 58 levels as the GEM global model.
Domain Global.
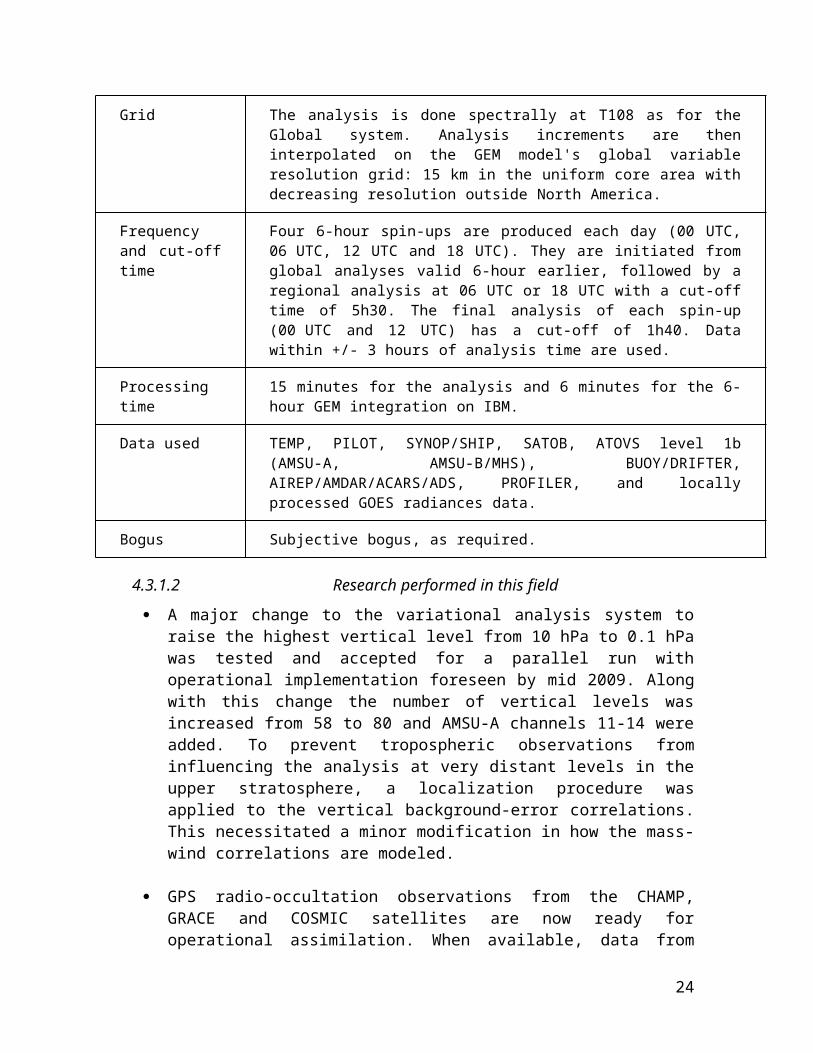
Grid The analysis is done spectrally at T108 as for the Global system. Analysis increments are then interpolated on the GEM model's global variable resolution grid: 15 km in the uniform core area with decreasing resolution outside North America.
Frequency and cut-off time
Four 6-hour spin-ups are produced each day (00 UTC, 06 UTC, 12 UTC and 18 UTC). They are initiated from global analyses valid 6-hour earlier, followed by a regional analysis at 06 UTC or 18 UTC with a cut-off time of 5h30. The final analysis of each spin-up (00 UTC and 12 UTC) has a cut-off of 1h40. Data within +/- 3 hours of analysis time are used.
Processing time
15 minutes for the analysis and 6 minutes for the 6-hour GEM integration on IBM.
Data used TEMP, PILOT, SYNOP/SHIP, SATOB, ATOVS level 1b (AMSU-A, AMSU-B/MHS), BUOY/DRIFTER, AIREP/AMDAR/ACARS/ADS, PROFILER, and locally processed GOES radiances data.
Bogus Subjective bogus, as required.
18
4.3.1.2 Research performed in this field
A major change to the variational analysis system to raise the highest vertical level from 10 hPa to 0.1 hPa was tested and accepted for a parallel run with operational implementation foreseen by mid 2009. Along with this change the number of vertical levels was increased from 58 to 80 and AMSU-A channels 11-14 were added. To prevent tropospheric observations from influencing the analysis at very distant levels in the upper stratosphere, a localization procedure was applied to the vertical background-error correlations. This necessitated a minor modification in how the mass-wind correlations are modeled.
GPS radio-occultation observations from the CHAMP, GRACE and COSMIC satellites are now ready for operational assimilation. When available, data from METOP GRAS will also be included. These data have shown significant impact at all levels, in both summer and winter conditions. The largest impacts are on temperature for the 500-50 hPa levels. Both bias and standard deviation are positively impacted, and the presence of these data helps control the bias of the upper radiance channels. Positive impact can also be seen in geopotential and winds at jet levels. Tests with the upgraded high-lid (0.1 hPa) model version show that the impact of the assimilation of these data is also positive up to at least 2 hPa. This is above the current operational lid of 10 hPa.
Development and test were done for the Regional forecasts to be issued 4 times a day. Operational implementation of additional 54-hour regional forecast runs initiated at 06Z and 18Z is planed for 2009.
A new continental data assimilation system using a limited-area variational analysis (LAM3D) approach is being developed. It is based on the limited area GEM model and uses grid specifications compatible with the model (e.g. horizontal staggering). In the first Operational implementation planed for 2010, LAM3D will run with 55 km horizontal resolution analysis increments. The 4D-Var extension (i.e. LAM4D) has been developed in parallel and uses the same horizontal/vertical resolution. The GEM-LAM forecasting model uses 15 km horizontal resolution with 80 vertical levels including the stratosphere. The specification of background-error statistics were purposely introduced in very close relationship with the current operational analysis system in order to (1) clearly identify strong and weak aspects of the LAM versus Variable-Resolution approach; (2) provide a solid background for further incremental improvements of each analysis components. After extensive evaluations with winter and summer cases, the combined “Lam 3D-Var & GEM-Lam model” system's performance (using conventional scores from radiosondes) equals the current combined “Global Variable Resolution GEM Model & analysis system borrowed from the Global 3D-
19
Var code. The latter uses 15 km resolution uniform central window and 80 vertical levels including the stratosphere (same vertical structure as the LAM system). The 4D-VAR performance at this point is slightly better than the 3D-VAR system in the range 0-24h. Once the new LAM3D analysis system replaces the current operational variable resolution strategy (planned by the end of 2009), the extension to LAM4D is expected the following year (2010). Ground-based GPS data are being assimilated in LAM3D but not in the current operational analysis system.
A new sea-ice analysis system is being developed, based on the 3D-Var approach to data assimilation. The main system has a domain that includes all ice-covered waters surrounding North America extending into the Arctic Ocean, with a horizontal resolution of ~5 km. A persistence forecast from the analysis 12 hours earlier is used as the background state. Retrievals of ice concentration from passive microwave data (AMSR-E and SSM/I) and the subjective analyses produced by the Canadian Ice Service, that heavily depend on RadarSAT images, are assimilated. The same analysis system is also being adapted to provide initial conditions of the ice and ocean variables for the 2-way coupled ice-ocean-atmospheric forecasting system for the Gulf of St Lawrence currently running in experimental mode.
20
4.3.2 Model
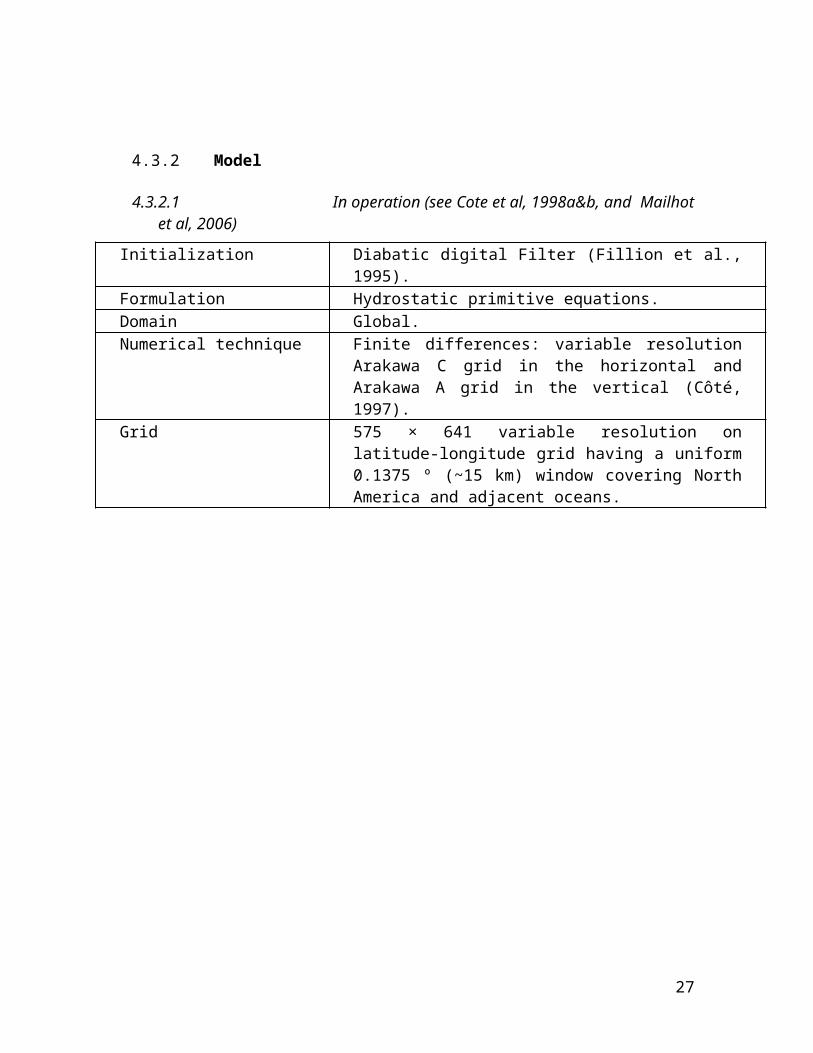
4.3.2.1 In operation (see Cote et al, 1998a&b, and Mailhot et al, 2006)
Initialization Diabatic digital Filter (Fillion et al., 1995).Formulation Hydrostatic primitive equations.Domain Global.Numerical technique Finite differences: variable resolution Arakawa C grid
in the horizontal and Arakawa A grid in the vertical (Côté, 1997).
Grid 575 × 641 variable resolution on latitude-longitude grid having a uniform 0.1375 º (~15 km) window covering North America and adjacent oceans.
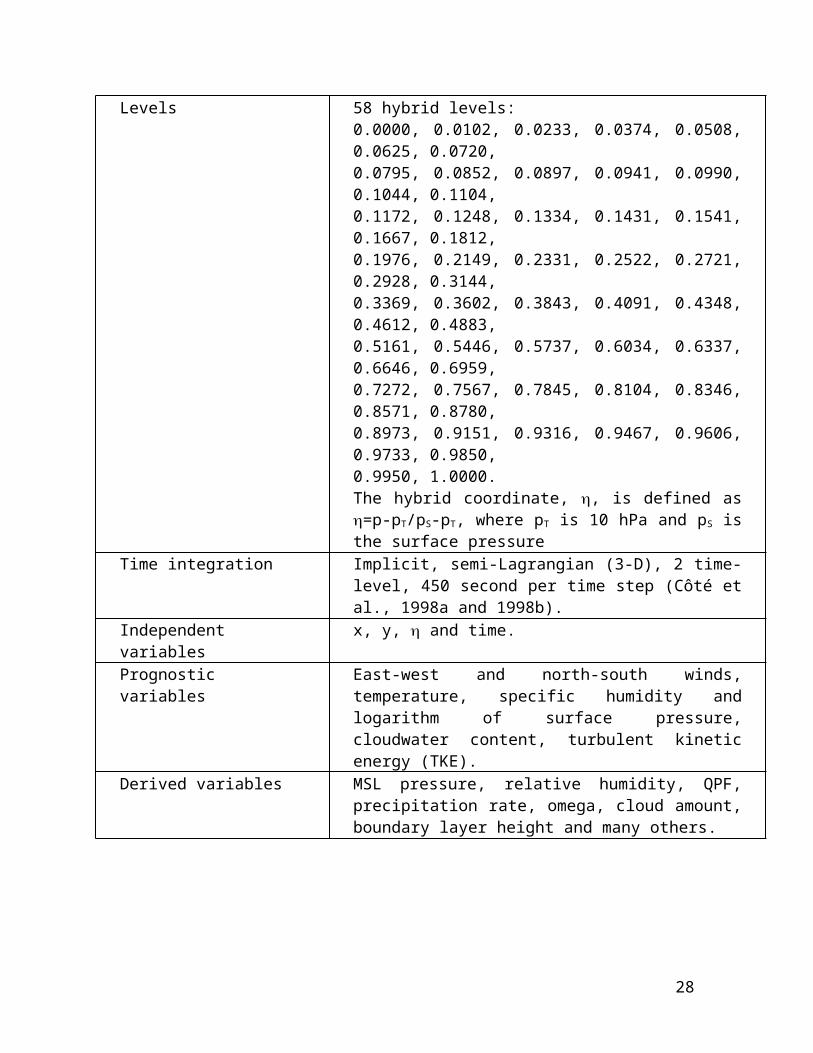
Levels 58 hybrid levels:0.0000, 0.0102, 0.0233, 0.0374, 0.0508, 0.0625, 0.0720,0.0795, 0.0852, 0.0897, 0.0941, 0.0990, 0.1044, 0.1104,0.1172, 0.1248, 0.1334, 0.1431, 0.1541, 0.1667, 0.1812,0.1976, 0.2149, 0.2331, 0.2522, 0.2721, 0.2928, 0.3144,0.3369, 0.3602, 0.3843, 0.4091, 0.4348, 0.4612, 0.4883,0.5161, 0.5446, 0.5737, 0.6034, 0.6337, 0.6646, 0.6959,0.7272, 0.7567, 0.7845, 0.8104, 0.8346, 0.8571, 0.8780,0.8973, 0.9151, 0.9316, 0.9467, 0.9606, 0.9733, 0.9850,0.9950, 1.0000.The hybrid coordinate, , is defined as =p-pT/pS-pT, where pT is 10 hPa and pS is the surface pressure
Time integration Implicit, semi-Lagrangian (3-D), 2 time-level, 450 second per time step (Côté et al., 1998a and 1998b).
Independent variables x, y, and time.Prognostic variables East-west and north-south winds, temperature,
specific humidity and logarithm of surface pressure, cloudwater content, turbulent kinetic energy (TKE).
Derived variables MSL pressure, relative humidity, QPF, precipitation rate, omega, cloud amount, boundary layer height and many others.
21
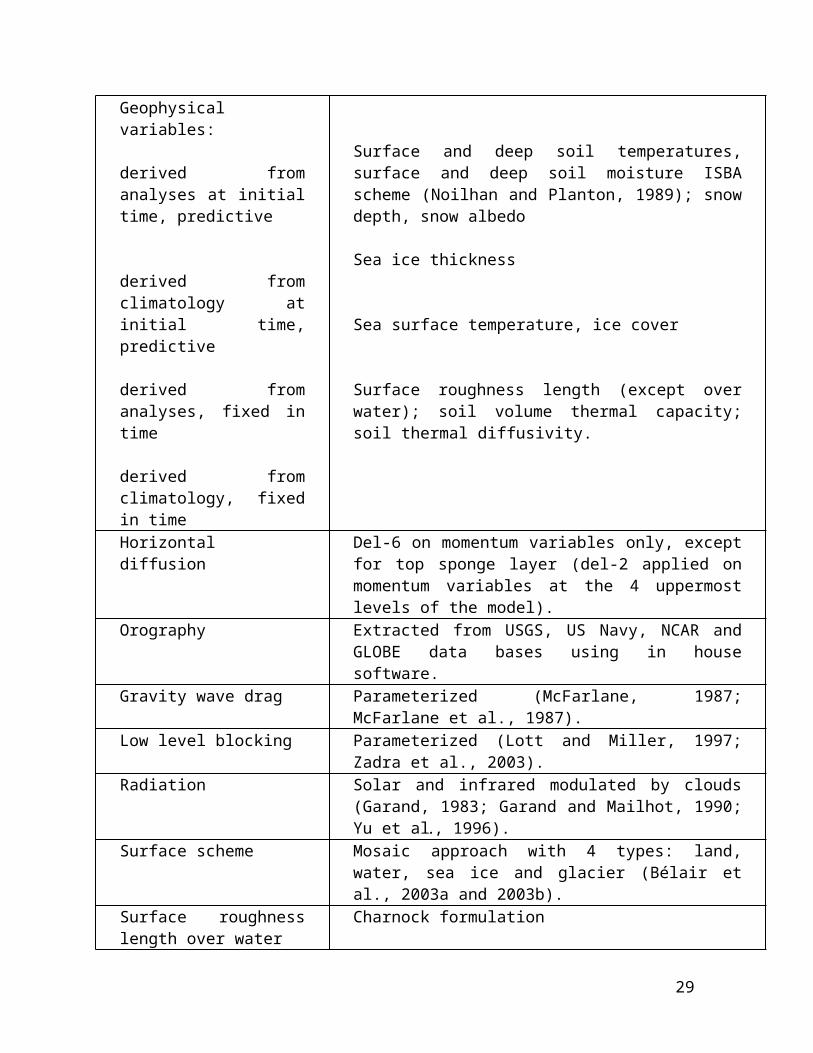
Geophysical variables:
derived from analyses at initial time, predictive
derived from climatology at initial time, predictive
derived from analyses, fixed in time
derived from climatology, fixed in time
Surface and deep soil temperatures, surface and deep soil moisture ISBA scheme (Noilhan and Planton, 1989); snow depth, snow albedo
Horizontal diffusion Del-6 on momentum variables only, except for top sponge layer (del-2 applied on momentum variables at the 4 uppermost levels of the model).
Orography Extracted from USGS, US Navy, NCAR and GLOBE data bases using in house software.
Gravity wave drag Parameterized (McFarlane, 1987; McFarlane et al., 1987).
Low level blocking Parameterized (Lott and Miller, 1997; Zadra et al., 2003).
Radiation Solar and infrared modulated by clouds (Garand, 1983; Garand and Mailhot, 1990; Yu et al., 1996).
Surface scheme Mosaic approach with 4 types: land, water, sea ice and glacier (Bélair et al., 2003a and 2003b).
Surface roughness length over water
Charnock formulation
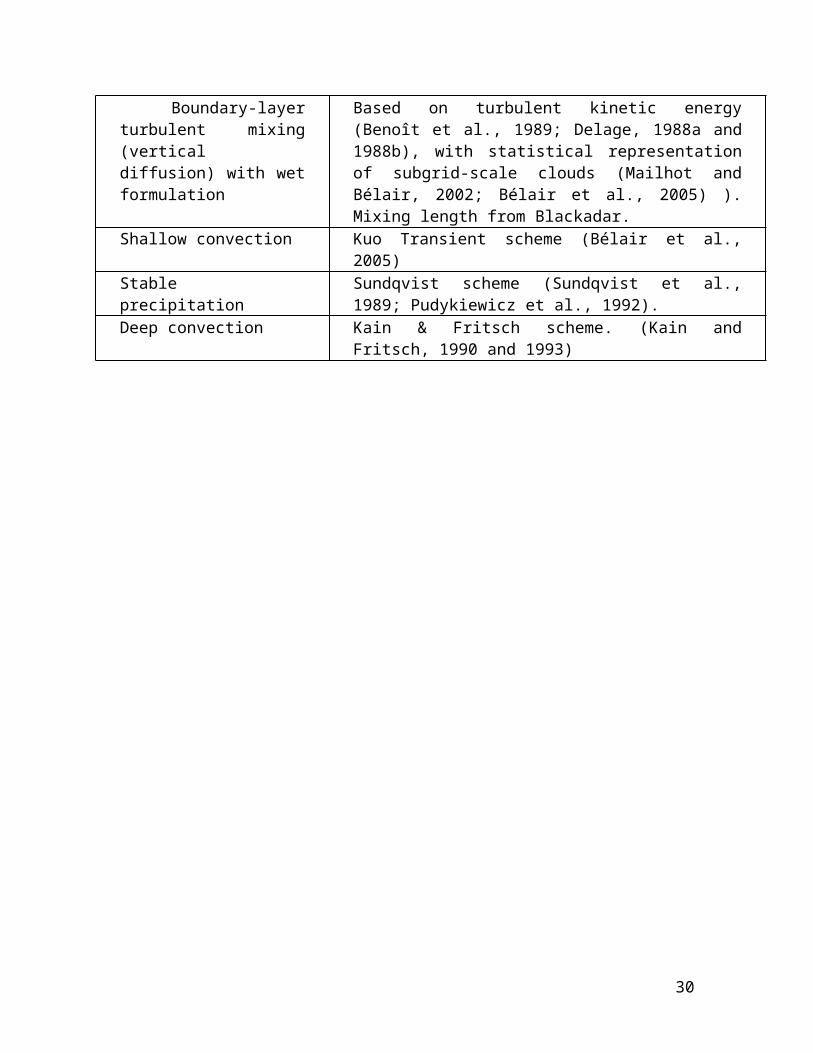
Boundary-layer turbulent mixing (vertical diffusion) with wet formulation
Based on turbulent kinetic energy (Benoît et al., 1989; Delage, 1988a and 1988b), with statistical representation of subgrid-scale clouds (Mailhot and Bélair, 2002; Bélair et al., 2005) ). Mixing length from Blackadar.
Shallow convection Kuo Transient scheme (Bélair et al., 2005)Stable precipitation Sundqvist scheme (Sundqvist et al., 1989;
Pudykiewicz et al., 1992).Deep convection Kain & Fritsch scheme. (Kain and Fritsch, 1990 and
1993)
22
4.3.2.2 Research performed in this field
Regional GEM 15 km (global variable-resolution version of GEM)
The current Regional forecast system (model lid at 10hPa) uses the GEM model with a variable resolution global grid configuration. The uniform resolution portion of the domain covers North-America (north of Mexico) and adjacent oceans. Research and development has been performed to extend this uniform resolution portion of the grid over the arctic regions to include the North Pole as well as most of the Arctic Ocean. This was done as a contribution to the International Polar Year (IPY) effort. Along with the grid change, a new set of geophysical fields has been generated and tested. Research has also been performed to implement a new radiative scheme (same as for the GEM Meso-Strato) in this regional model.
The regional GEM model initial conditions depend on the global medium-range GEM forecast system (see 4.3.1.1). When the global GEM Meso-Strato model becomes operational (model lid at 0.1 hPa), the initial analysis provided to the regional assimilation system will have a modified number and set of vertical levels. The regional model has been adapted to this new reality. A regional Strato model with the same 80 vertical levels with lid at 0.1 hPa as the global model has been developed.
GEM-LAM 2.5 km and 1 km (Limited-Area Model, LAM version of GEM)
A limited-area version of the GEM model (GEM-LAM) at 2.5-km horizontal resolution (58 vertical levels) is used to make experimental operational runs at CMC once a day for 24 hours. In addition to the 2 sub-areas of Canada (southern British Columbia and southern Ontario-Quebec) that have been running since the summer of 2005, 2 windows were added in 2007. The new windows cover the Baffin Island in the Canadian Arctic as part of IPY (International Polar Year) projects, and the Canadian Atlantic region in support of local environmental projects.
The configuration of the LAM model is similar to that of the regional model, except for:
the grid resolution of 2.5 km;
non-hydrostatic formulation;
stable precipitation parameterized with Milbrandt and Yau scheme;
no parameterization of deep convection.
23
The models are initialized from either the 6-hour or the 12-hour forecast of the 00 UTC regional run. The lateral boundary conditions are also provided by the regional model at every hour. Recent updates improved the utility and the performance of the model. The updates were new model outputs (diagnostics of precipitation types, synthetic radar reflectivity) and, more notably, a new nesting strategy that helps to significantly reduce the spin-up time of precipitation. A new double-moment explicit condensation scheme (Milbrandt and Yau, 2005a, b) has been tested.
In the context of providing specialized products for the Vancouver 2010 Winter Olympics, a system based on GEM-LAM at 1 km resolution over British Columbia has been developed. It comprises among other things a double-moment microphysics scheme, and a new radiation scheme (Li and Barker, 2005).
With the arrival of GEM Meso-Strato, a technique allowing GEM-LAM to be piloted from a model with a higher lid is needed. Such a technique is being developed.
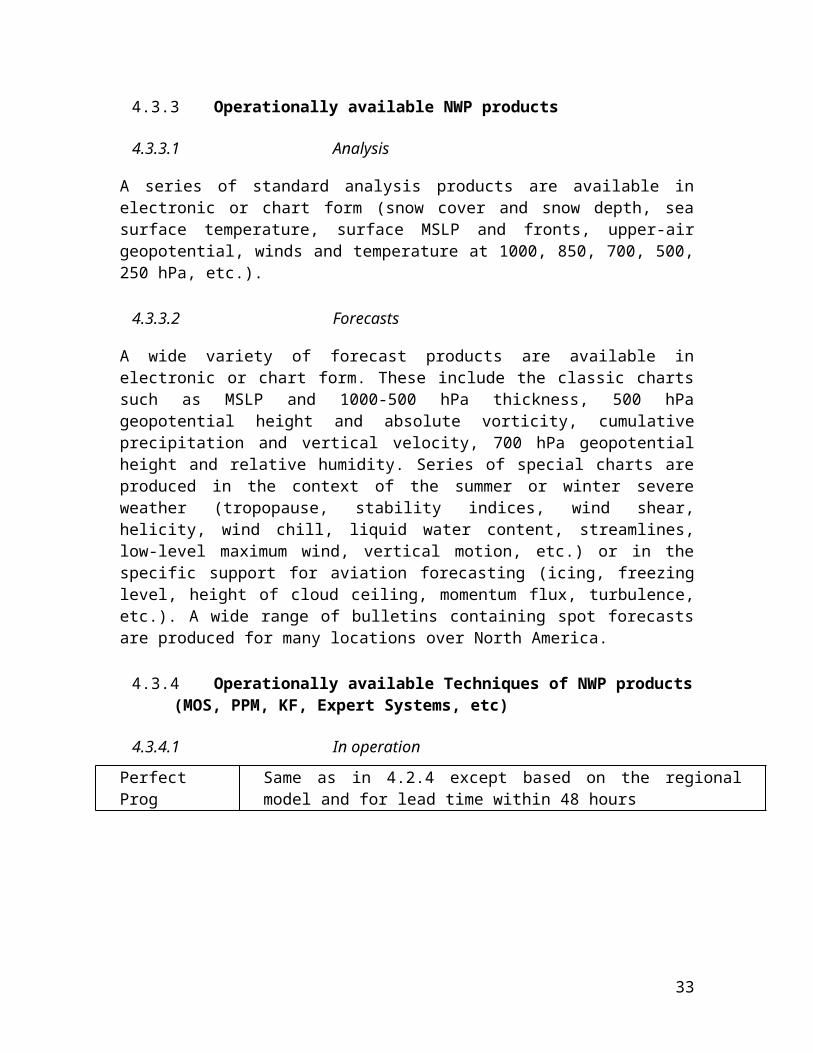
4.3.3 Operationally available NWP products
4.3.3.1 Analysis
A series of standard analysis products are available in electronic or chart form (snow cover and snow depth, sea surface temperature, surface MSLP and fronts, upper-air geopotential, winds and temperature at 1000, 850, 700, 500, 250 hPa, etc.).
4.3.3.2 Forecasts
A wide variety of forecast products are available in electronic or chart form. These include the classic charts such as MSLP and 1000-500 hPa thickness, 500 hPa geopotential height and absolute vorticity, cumulative precipitation and vertical velocity, 700 hPa geopotential height and relative humidity. Series of special charts are produced in the context of the summer or winter severe weather (tropopause, stability indices, wind shear, helicity, wind chill, liquid water content, streamlines, low-level maximum wind, vertical motion, etc.) or in the specific support for aviation forecasting (icing, freezing level, height of cloud ceiling, momentum flux, turbulence, etc.). A wide range of bulletins containing spot forecasts are produced for many locations over North America.
24
4.3.4 Operationally available Techniques of NWP products (MOS, PPM, KF, Expert Systems, etc)
4.3.4.1 In operation
Perfect Prog Same as in 4.2.4 except based on the regional model and for lead time within 48 hours
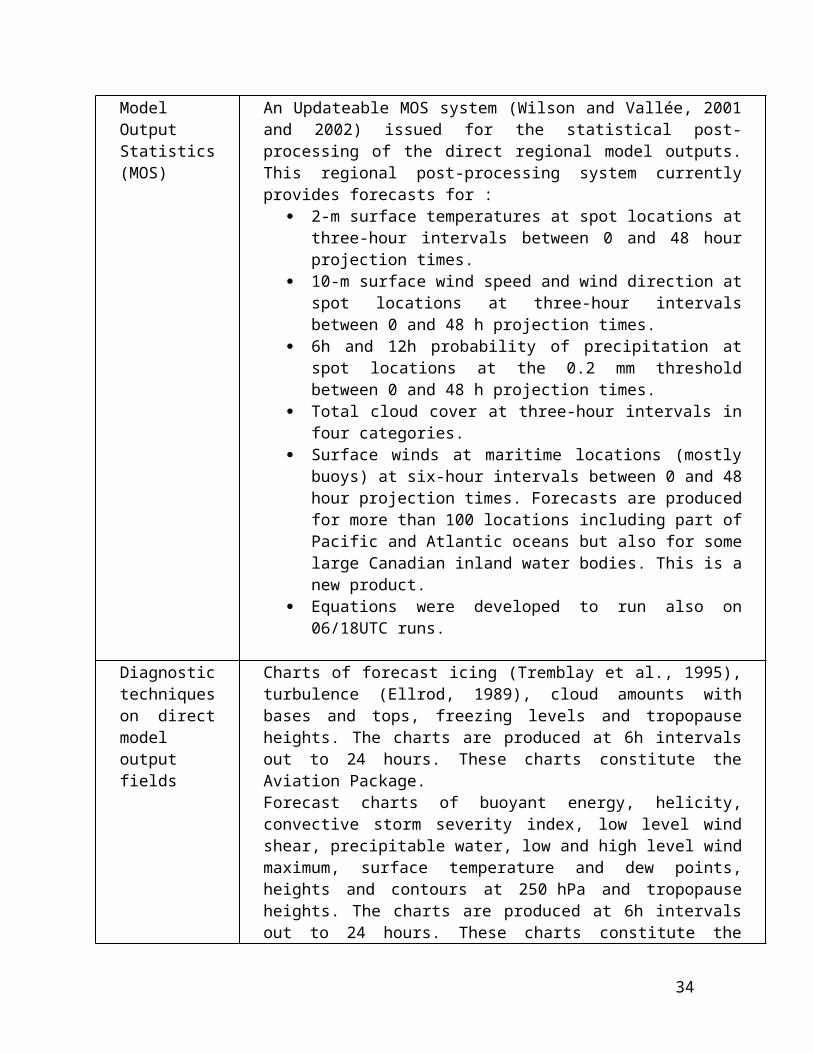
Model Output Statistics (MOS)
An Updateable MOS system (Wilson and Vallée, 2001 and 2002) issued for the statistical post-processing of the direct regional model outputs. This regional post-processing system currently provides forecasts for :
2-m surface temperatures at spot locations at three-hour intervals between 0 and 48 hour projection times.
10-m surface wind speed and wind direction at spot locations at three-hour intervals between 0 and 48 h projection times.
6h and 12h probability of precipitation at spot locations at the 0.2 mm threshold between 0 and 48 h projection times.
Total cloud cover at three-hour intervals in four categories. Surface winds at maritime locations (mostly buoys) at
six-hour intervals between 0 and 48 hour projection times. Forecasts are produced for more than 100 locations including part of Pacific and Atlantic oceans but also for some large Canadian inland water bodies. This is a new product.
Equations were developed to run also on 06/18UTC runs.
Diagnostic techniques on direct model output fields
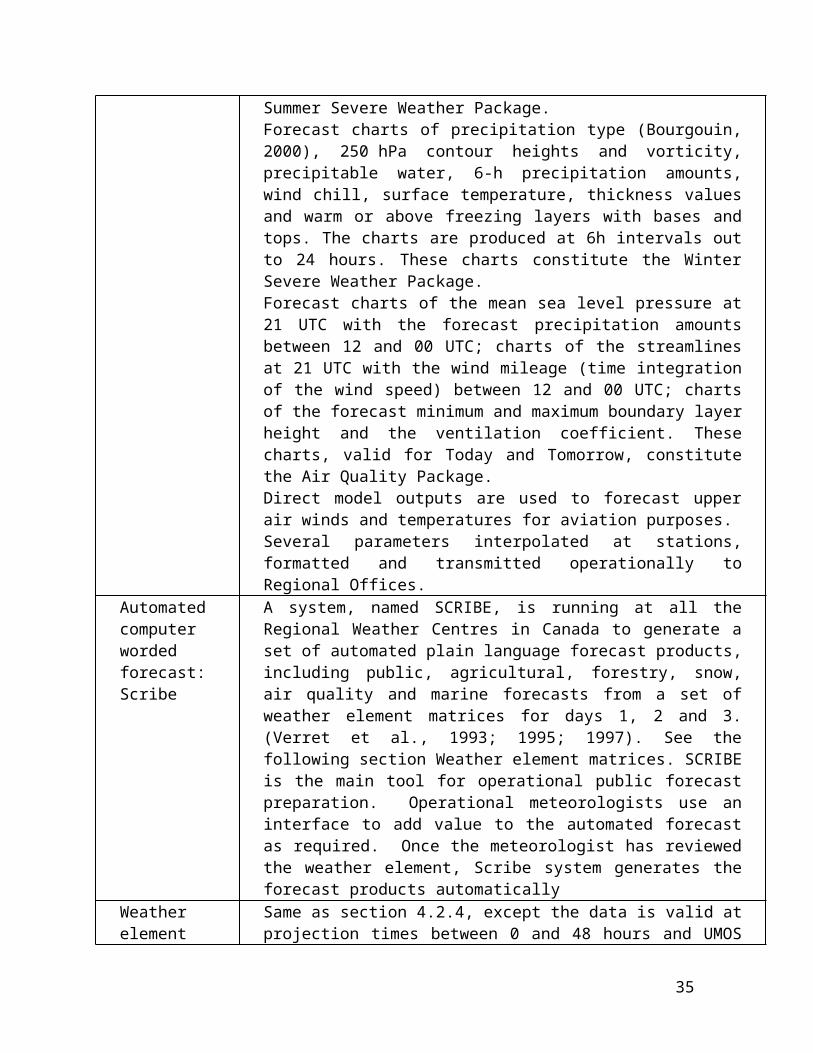
Charts of forecast icing (Tremblay et al., 1995), turbulence (Ellrod, 1989), cloud amounts with bases and tops, freezing levels and tropopause heights. The charts are produced at 6h intervals out to 24 hours. These charts constitute the Aviation Package.Forecast charts of buoyant energy, helicity, convective storm severity index, low level wind shear, precipitable water, low and high level wind maximum, surface temperature and dew points, heights and contours at 250 hPa and tropopause heights. The charts are produced at 6h intervals out to 24 hours. These charts constitute the Summer Severe Weather Package.Forecast charts of precipitation type (Bourgouin, 2000), 250 hPa contour heights and vorticity, precipitable water, 6-h precipitation amounts, wind chill, surface temperature, thickness values and warm or above freezing layers with bases and tops. The charts are produced at 6h intervals out to 24 hours. These charts constitute the Winter Severe Weather Package.Forecast charts of the mean sea level pressure at 21 UTC with the forecast precipitation amounts between 12 and 00 UTC; charts of the streamlines at 21 UTC with the wind mileage (time integration
25
of the wind speed) between 12 and 00 UTC; charts of the forecast minimum and maximum boundary layer height and the ventilation coefficient. These charts, valid for Today and Tomorrow, constitute the Air Quality Package.Direct model outputs are used to forecast upper air winds and temperatures for aviation purposes.Several parameters interpolated at stations, formatted and transmitted operationally to Regional Offices.
Automated computer worded forecast: Scribe
A system, named SCRIBE, is running at all the Regional Weather Centres in Canada to generate a set of automated plain language forecast products, including public, agricultural, forestry, snow, air quality and marine forecasts from a set of weather element matrices for days 1, 2 and 3. (Verret et al., 1993; 1995; 1997). See the following section Weather element matrices. SCRIBE is the main tool for operational public forecast preparation. Operational meteorologists use an interface to add value to the automated forecast as required. Once the meteorologist has reviewed the weather element, Scribe system generates the forecast products automatically
Weather element matrices
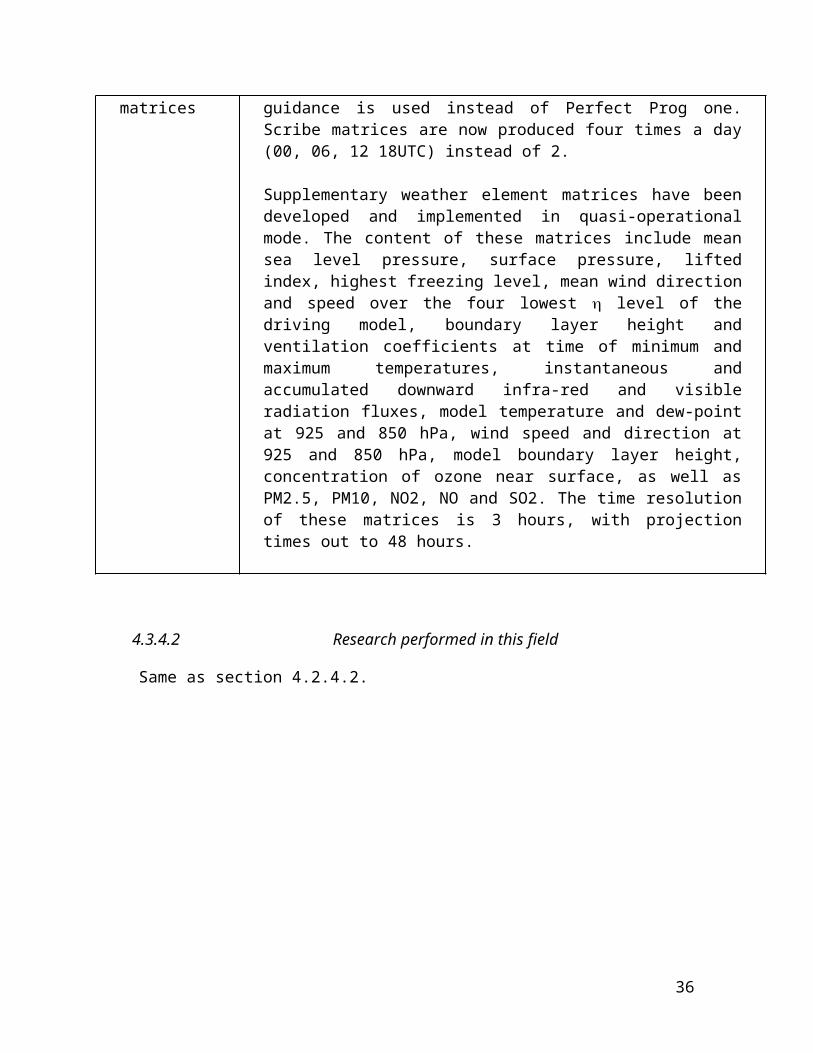
Same as section 4.2.4, except the data is valid at projection times between 0 and 48 hours and UMOS guidance is used instead of Perfect Prog one. Scribe matrices are now produced four times a day (00, 06, 12 18UTC) instead of 2.
Supplementary weather element matrices have been developed and implemented in quasi-operational mode. The content of these matrices include mean sea level pressure, surface pressure, lifted index, highest freezing level, mean wind direction and speed over the four lowest level of the driving model, boundary layer height and ventilation coefficients at time of minimum and maximum temperatures, instantaneous and accumulated downward infra-red and visible radiation fluxes, model temperature and dew-point at 925 and 850 hPa, wind speed and direction at 925 and 850 hPa, model boundary layer height, concentration of ozone near surface, as well as PM2.5, PM10, NO2, NO and SO2. The time resolution of these matrices is 3 hours, with projection times out to 48 hours.
4.3.4.2 Research performed in this field
Same as section 4.2.4.2.
26
4.3.5 Ensemble Prediction System (number of members, initial state, perturbation method, Model(s) and number of models used, perturbation of physics, post processing :calculations of indices, clustering)
4.3.5.1 In operation
No regional ensemble system in operations at this time for short range forecasting.
4.3.5.2 Research performed in this field
In the context of the regional EPS, research on dynamical downscaling of the operational Canadian global ensemble prediction system (CEPS) is under way. Members of this Canadian regional EPS consist of limited-area configurations of the GEM model over a continental, North American domain. Initial conditions are provided by the operational Ensemble Kalman filter, and the lateral boundary conditions are provided by the Global EPS. Research is under way to represent model errors related to surface and precipitation processes.
4.3.5.3 Operationally available EPS Products
No operationally available EPS products for short range forecasting.
4.4 Nowcasting and Very Short-range Forecasting Systems (0-6hrs)
4.4.1 Nowcasting systems
4.4.1.1 In operation
The SCRIBE Weather Forecast Product Expert System is capable of ingesting the latest observations and nowcasting model data to update in real time the Scribe weather elements. This sub-system has been developed to minimize the necessary manual adjustments done by the forecaster to merge the current weather conditions with the forecast.
The Scribe Nowcasting uses surface observations, North American radar mosaic data and lighting data from the Lighting Detection Network. These observations are used to feed short term forecast models. A statistical model called “PubTools” uses the surface observations to forecast the probabilities of occurrences of weather elements. The observed radar reflectivities are projected during the next 6 hours with a vector motion calculated from
27
observed imageries 20 minutes apart. Finally, an algorithm has been developed at CMC to predict the probabilities of thunderstorm occurrences based on the forecast position of the lightning clusters. All these observed and forecast data are processed by rules base system to determine the best sequence of weather elements representing the current observation and short term tendencies.
The first 6 to 9 hours of the Scribe weather elements will thus be influenced by the nowcasting data. Depending on the weather conditions and on how well the model handles these conditions, significant changes can be done to the regular Scribe weather elements. To assess whether these changes contribute to improve the first hours of the forecast or not, objective verifications were performed. For some weather elements results show that in the first 6 hours of the forecast the Probability of Detection has increased and the related False Alarm Ratio has decreased. Other verification scores also indicate an improvement of the short term forecast performance.
4.4.1.2 Research performed in this field
Air quality
The development of the Marine and the Air Quality version of SCRIBE has been completed in 2008. The new Air Quality version is planned to be used in regional weather offices during the summer of 2009. It will allow forecasters to modify different pollutant concentrations (O3, PM25, PM10 and NO2), then to generate an air quality index (AQHI) associated with these concentrations and finally to transmit the AQHI.
Radar QC/QPE Project
Several improvements related to how radar data are quality controlled and used for quantitative precipitation estimation are planned during the next 4-5 years. These include improved quantification of systematic errors, improved identification of ground clutter through climatological ground clutter filters, improved identification of bad data, segregation of bad data from no data, application of dual-polarization analysis (including differential reflectivity, correlation coefficient, differential propagation phase and specific differential phase) for hydrometeor phase estimation, target shape identification and for identification of ground clutter, improved severe weather analysis algorithms, improved correction of attenuation, and others. There will be one radar software development cycle per year for the next several years, at the end of which the Canadian radar network data should be suitable for quantitative precipitation estimation. It will also be more suitable for incorporation into automated nowcasting algorithms for predicting the track of storms and precipitation regions. It has also
28
been proposed that the Canadian radar network be polarized, with anticipated completion in 5-7 years.
Canadian HUB Airport Nowcasting System (CAN-Now)
Researchers are developing an advanced nowcasting system for use at each of the four major Canadian HUB airports including Toronto, Vancouver, Montreal and Calgary. The system is currently being trialed at Pearson airport in Toronto. This system utilizes advanced observations (direct and remote sensing) to make nowcasts out to 6-12 hours of all weather elements that impact on aviation operations including de-icing, runway condition, air traffic control, airline schedule planning, etc. Instrumentation being used includes wind profilers, microwave radiometers, vertical pointing radars, satellites, and surface-based instruments for measuring precipitation, visibility, winds, etc. Weather elements being predicted include temperature, pressure, precipitation, winds, lightning, frost, freezing precipitation, snow, icing aloft, wind shifts, turbulence, ceiling, visibility and convection. Nowcasting algorithms are integrated with numerical model output to assess relative skill and cross over times. The project includes verification of nowcasting and model-based algorithms. This project should continue for another 1-2 years after which operational implementation of high-value algorithms may occur at all of the HUB airports.
Science and Nowcasting for Olympics Weather – Vancouver 2010 (SNOW V10)
Scientists from several countries (led by Canada) have developed a plan to conduct a WMO endorsed World Weather Research Program (WWRP) Research Development Project (RDP) for the Vancouver 2010 Winter Olympic Games. The Science and Nowcasting for Olympics Weather for Vancouver 2010 project (SNOW V10) will focus on science issues and demonstration of leading edge techniques for nowcasting (forecasting from 0 to 6 hours) high impact winter weather phenomena in complex terrain. An extensive observations network has been installed in the mountains around the Whistler region to support this initiative. An advanced nowcasting system will be created by combining observationally-based and modeling systems from several countries. During the 2010 winter Olympics, the project will use this advanced nowcasting system to provide supplementary information on visibility, precipitation, and winds, as well as undertaking an evaluation of the benefits. The information will be provided to Environment Canada operational forecasters in formats that are useful both for forecasting and for client decision making. Techniques developed during this project will be transferred into future nowcasting systems that are used in Canada.
Fog Research And Modeling Project (FRAM)
29
A Fog Research And Modeling (FRAM) project is 1) assessing the state-of-the-art scientific research on fog; 2) developing fog applications to weather forecasting and nowcasting; and 3) assessing future fog R&D activities. Four fog detection and nowcasting techniques have been developed including 1) satellite based detection algorithm; 2) numerical model-based parameterization of visibility 3) conditional persistence climatology and 4) rules-based nowcasting applications for fog. These techniques make extensive use of surface observations of visibility, precipitation, droplet, ice crystal and aerosol particle spectra, and other meteorological parameters taken from a suite of 18 specialized instruments. The measurements are used to better understand the relationships between liquid and ice fog conditions, visibility and precipitation and to develop improved detection and forecasting techniques. These techniques are being evaluated for possible implementation into the operational forecasting/nowcasting program. This project has been expanded to include Arctic ice fog detection and forecasting. Environment Canada researchers participated in a field measurement campaign in Barrow Alaska that was designed to measure characteristics of ice fog conditions. Another field project focused on freezing fog is currently ongoing based out of St. John’s Newfoundland.
Research Support Desk Project (RSD)
A research support desk (RSD) has been set up in close proximity to operational nowcasting/forecasting desks in two forecast regions. The Research Support Desk, located in the operations area, allows research meteorologists to interact with operational forecasters in real time. The RSD uses conceptual models relating to lake breezes, convective initiation and severe thunderstorm development plus high resolution models to come up with an 18 UTC mesoscale prognosis focused on severe weather potential. RSD products are available to all forecasters via an internal web page. The RSD allows scientists to work in close proximity to operational forecasters in order to better understand both the science gaps and the forecasting decision process. This allows scientists to demonstrate and develop improved nowcasting techniques that could be useful to the operational forecasters. During the next three years, the RSDs will continue to be used to test new techniques for nowcasting summer convective weather. They will also be expanded to test winter nowcasting/forecasting methods.
Statistical downscalling
Statistical post-processing using the UMOS package is applied on the GEM-LAM 2.5 km. Almost the same weather element forecasts produced by regional forecast system will be generated, i.e. spot 2-m surface temperature, 10-m surface wind speed and direction, 6-h and 12-h
30
probability of precipitation and total cloud cover. They will be eventually available at hourly intervals.
4.4.2 Models for very short range forecasting
4.4.2.1 In operation
No very short range forecasting system in operations at this time.
4.4.2.2 Research performed in this field
High-resolution modeling for the Vancouver 2010 Winter Olympics
Work has begun in 2007 to develop a high-resolution modeling system to better support the weather forecasting needs of the Vancouver 2010 Winter Olympics. The system includes components for high-resolution LAM models and surface modeling at the micro scales. The first component consists of a cascade of LAM models (2.5-km and 1-km grid sizes) integrated for 16h, twice a day, with several improvements to the numeric (changes to improve the precision and efficiency) and the physics (cloud microphysics, cloud-radiation interactions, radiation on mountain slopes) compared with the system currently operational at the Canadian Meteorological Centre. During the Olympics, this cascade will be supplemented with an “urbanized” LAM window at 250-m resolution over the Vancouver metropolitan urban area, developed as part of the Urban Meteorology Modeling System.
For the second component, several new and original tools are used to adapt and refine predictions near and at the surface. Very high-resolution two-dimensional surface systems, with a 100-m grid length, will cover the Vancouver Olympic areas. Using adaptation methods to improve the forcing from the lower-resolution atmospheric models (1-km LAM), these 2D surface models better represent surface processes, and thus lead to better predictions of snow conditions and near-surface air temperature. Based on a similar strategy, a single-point model has been implemented to better predict surface characteristics at each station of an observing network especially installed for the 2010 events. The main advantage of this single-point system is that surface observations are used as forcing for the land surface models, and can even be assimilated to improve initial conditions of surface variables such as snow depth and surface temperatures.
A quasi-final version of this prototype has been implemented experimentally in December 2008 in time for the Olympics Practicum Forecasting Exercise held during the winter 2009 in Whistler and Vancouver. Work will continue on further refinement of the prototype, and on objective verifications and validation of the
31
system based on the preliminary results from the winter seasons of 2008 and 2009.
4.5 Specialized forecasts (on sea waves, sea ice, tropical cyclones, pollution transport and dispersion, solar ultraviolet (UV) radiation, air quality forecasting, smoke, sand and dust, etc.)
4.5.1 Assimilation of specific data, analysis and initialization (where applicable)
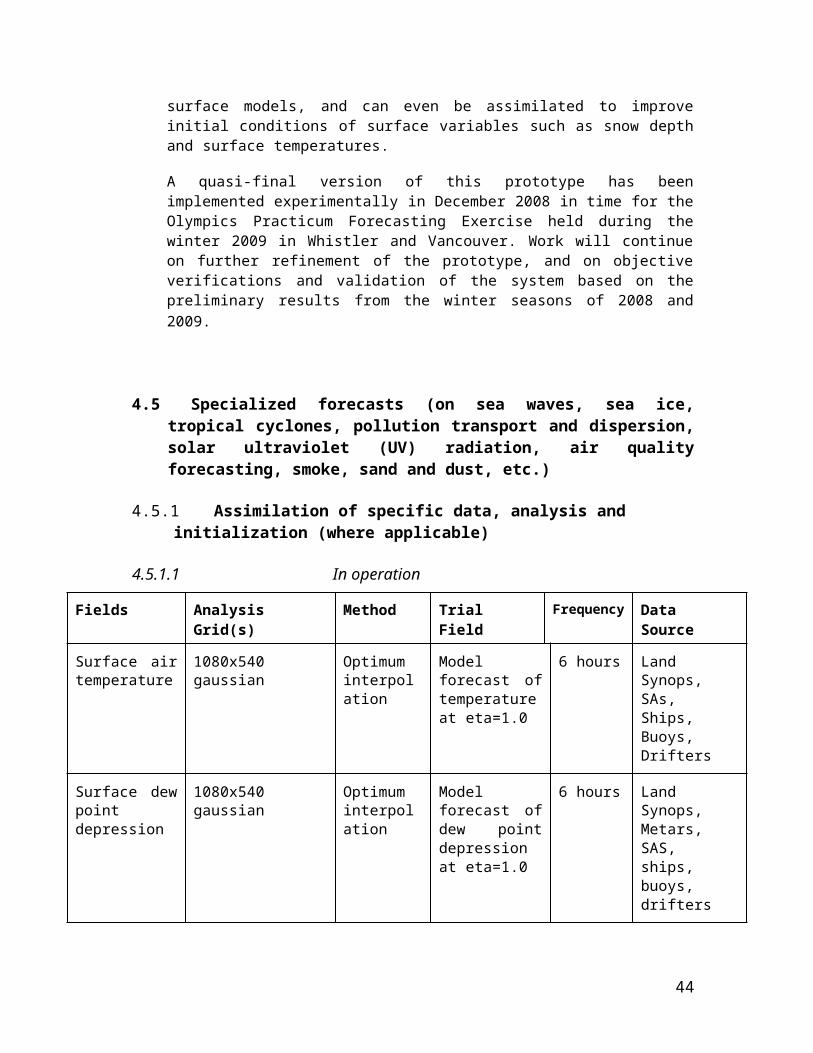
4.5.1.1 In operation
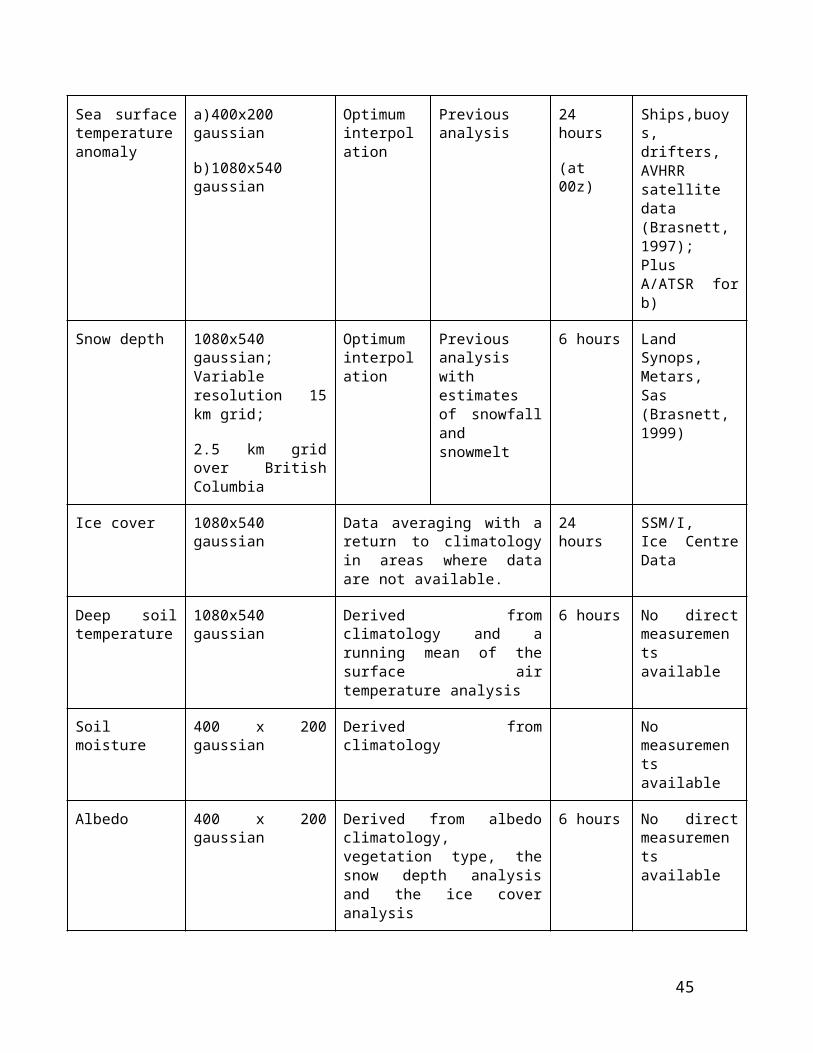
Fields Analysis Grid(s) Method Trial Field Frequency Data Source
Surface air temperature
1080x540 gaussian Optimum interpolation
Model forecast of temperature at eta=1.0
6 hours Land Synops, SAs, Ships, Buoys, Drifters
Surface dew point depression
1080x540 gaussian Optimum interpolation
Model forecast of dew point depression at eta=1.0
6 hours Land Synops, Metars, SAS, ships, buoys, drifters
Sea surface temperature anomaly
a)400x200 gaussian
b)1080x540 gaussian
Optimum interpolation
Previous analysis
24 hours
(at 00z)
Ships,buoys,drifters, AVHRR satellite data (Brasnett, 1997); Plus A/ATSR for b)
Snow depth 1080x540 gaussian; Variable resolution 15 km grid;
2.5 km grid over British Columbia
Optimum interpolation
Previous analysis with estimates of snowfall and snowmelt
6 hours Land Synops, Metars, Sas (Brasnett, 1999)
Ice cover 1080x540 gaussian Data averaging with a return to climatology in areas where data are not available.
24 hours SSM/I, Ice Centre Data
Deep soil temperature
1080x540 gaussian Derived from climatology and a running mean of the surface air temperature analysis
6 hours No direct measurements available
32
Soil moisture 400 x 200 gaussian Derived from climatology No measurements available
Albedo 400 x 200 gaussian Derived from albedo climatology, vegetation type, the snow depth analysis and the ice cover analysis
6 hours No direct measurements available
4.5.1.2 Research performed in this field
CaPA
The most important input for hydrological prediction and land data assimilation systems is generally precipitation. This lead to the development of a Canadian Precipitation Analysis (CaPA). Currently, CaPA uses optimal interpolation to combine a background field obtained from a short-term forecast of the GEM model in its regional configuration (at 15km) with observations of precipitation accumulations. The domain covers all of Canada and most of the continental United States. Observations are obtained by combining the reports from the synoptic observation network with reports from COOP networks (currently only over the US and over the Province of Quebec). A 6h analysis available at synoptic hours and a 24h analysis valid at 12Z are in the process of being implemented operationally at CMC. Research currently focuses on including other sources of observation in the analysis, including observations of clear sky from GOES imagery, ground radar QPE, and lightning observations. Efforts are also devoted to increasing the number of COOP network stations in the analysis and to correcting bias in solid precipitation measurements.
Chemical data assimilation
Over the last several years, the assimilation of surface ozone observations from the AirNow network over North America has been conducted using optimum interpolation and the operational air quality forecast model CHRONOS. The system has been validated against withdrawn observations and ozone sondes during the ICARTT campaign. Objective analysis maps have been produced in experimental mode over the last 5 years, constituting one of the longest record of ozone surface analyses. The objective analysis maps are also planned to become operational next year. Several assimilation cycles (or passes), each with updated error statistics, are used to define the "stabilized or convergent" assimilation system. Research has shown that the assimilation of ozone only has limited predictability skill. An
33
overnight assimilation can improve the daytime forecast only for duration of 6 hours, but a continuous assimilation produces analyses that significantly reduces the bias and reduces the error variance by a factor two. Further reduction can be obtained in continuous assimilation mode, if transport only with no chemistry is accounted in the model, but has virtually no forecast skill.
34
Research performed in assimilation of tracer concentration data analysis and initialization of dispersion models
Research is ongoing to improve the adjoint/inverse modes of the operational dispersion models and on the techniques to utilize the adjoint concentrations (also known as source-receptor sensitivity coefficients), in order to use concentration measurements at short range to reassess often poorly known source terms. This research aims at using radiation monitoring data near nuclear facilities continuously available in real time, together with short range dispersion models in inverse mode to feed re-evaluated source term information to longer range transport model in the event of a serious accident.
4.5.2 Specific Models (as appropriate to 4.5)
4.5.2.1 In operations
Air Quality Model
CHRONOS (Canadian Hemispheric and Regional Ozone and NOx System) is a chemical transport model integrated daily over a domain covering the bulk of North America and adjacent waters (Pudykiewicz et al., 1997). The model is run from 00 and 12 UTC every day of the year to 48 hours. It has a horizontal resolution of 21 km and 24 vertical Gal-Chen levels up to 6 km. The chemical mechanisms used in the simulation include 114 chemical reactions involving 47 chemical species. The advection-diffusion equation in the model is solved using a semi-Lagrangian algorithm. The model simulates dry deposition and wet scavenging of the chemical tracers. The meteorological inputs used in the simulation of atmospheric chemistry are provided by the Canadian operational regional GEM model (see section 4.3). The emissions inventory of chemical species is based on 2000-2001 data and the SMOKE processing system. The emission inventory takes into consideration the day of the week, the season and the various types of emissions which are mobile, non-mobile, major and minor point sources and the biogenic sources. The emissions follow a diurnal cycle. The initial conditions for the different chemical compounds are given by the previous 12 hr forecast.
The current operational outputs from CHRONOS consist of hourly concentrations of tropospheric ozone, PM2.5, PM10, nitrogen dioxide, nitrogen monoxide, and sulphur dioxide. The forecast of PM levels is based on primary PM emissions and the chemical formation of secondary PM (sulphate, nitrate,
35
ammonium and secondary organics). Post-processing is performed on these outputs to provide users with maximum, mean and 3-hourly running mean forecast of tropospheric ozone per 6 hr forecast period. The outputs are available on the web as maps of maximum values for ozone and PM (http://www.weatheroffice.gc.ca/chronos/index_e.html), providing a spatial representation of the chemical variables predicted by CHRONOS. CHRONOS is likely to be decommissioned in 2009 as GEM-MACH new air quality model would be implemented (see section 4.5.2.2).
In 2008, the national Air Quality Health Index (AQHI) forecast program was expanded from 15 sites to 26 sites distributed across Canada. This program, which first began as a pilot project in 2007, provides a means to communicate to the public the level of risk associated with exposure to O3, PM2.5 and NO2 pollution. CHRONOS output as well as processed observations are provided to forecasters. AQHI forecasts are available as alphanumerical point forecasts for a selection of cities across Canada (see: http://www.weatheroffice.gc.ca/airquality/pages/aqhi_locations_e.html).
Ozone and UV index forecasting
The Canadian Global model is used to prepare ozone and UV Index forecast at the 18 hour projection time based on 00 UTC data and at the 30 hour projection time based on 12 UTC data (Burrows et al., 1994). A Perfect Prog statistical method is used for forecasting total ozone, which is then supplemented with an error-feedback procedure. UV Index is calculated from the corrected ozone forecast. Charts of the total ozone forecast and of the UV Index forecast are prepared and transmitted to the Regional Offices. Bulletins giving the forecast UV Index at an ensemble of stations across Canada are also generated. Correction factors have been added to take into account the snow albedo, elevation and Brewer angle response.
Wave forecasting
Sea-state forecasts of 48 to 120 hours over Eastern Pacific, Western Atlantic and 4 Great Lakes (Ontario, Erie, Huron and Superior) are generated twice a day (00 UTC and 12 UTC) by the WAM (WAve Modeling) model (version 4.5). The model is run at a resolution of 0.5º over the Pacific and the Atlantic while a resolution of 0.05º is used over the Great Lakes.
The Pacific version of the wave model which uses the surface level winds from the global model produces forecast up to 120 hours. Two Atlantic versions are in operations. The former uses the regional model wind outputs producing forecast to 48 hours while the later uses the global model winds producing forecast to 120 hour. Finally, wave forecasts up to 48 hour are produced for Lake Superior, Lake Huron, Lake Erie and Lake Ontario.
36
Various parameters are plotted on the wave forecast charts (wave height, swell period, swell height, direction, etc.).
Environmental Emergency Response models
The CMC is able to provide real-time air concentrations and surface deposition estimates of airborne pollutants. These fields are obtained from either an Eulerian 3-D long range atmospheric transport/dispersion/deposition model, named the "CANadian Emergency Response Model" or "CANERM", or from short/long range Lagrangian Stochastic Particle Models: MLDP0, MLCD and MLDP1. Important applications from these models are the estimation of the concentrations of radionuclides and volcanic ash. Based on this operational capability, the CMC is designated by the WMO as a Regional Specialised Meteorological Centre (RSMC) with specialization in Atmospheric Transport Modelling Products for Environmental Emergency Response. In addition, CMC is designated by the International Civil Aviation Organisation (ICAO) as a Volcanic Ash Advisory Centre (VAAC). There has been an increase application of these operational atmospheric transport modeling tools to the dispersion of chemical and biological agents in the context of the response to local environmental emergencies.
CANERM and the Lagrangian Particle Models are "off-line" models. Therefore fields of wind, moisture, temperature and geopotential heights must be provided to them. These are obtained either from the Global or Regional forecasts and objective analysis systems. Please refer to the above sections 4.2 and 4.3 for more information on these NWP products.
Latitude, longitude and time of the release are necessary input parameters. Estimates of intensity and duration of the release are also required. In the case of a nuclear accident and in the absence of actual source data, the standard default values adopted at the WMO’s First International Workshop on Users’ Requirements for the Provision of Atmospheric Transport Model Products for Environmental Emergency Response (September 1993) would be used. These are:
uniform vertical distribution up to 500 m above the ground; uniform emission rate during the first 6 hours; total pollutant release of 1 arbitrary unit; type of radionuclide is Caesium 137.
CANERM (CANadian Emergency Response Model)
CANERM is a fully 3-D Eulerian model for medium and long range transport of pollutants in the atmosphere. A detailed description of the model can be found in Pudykiewicz, 1989. The horizontal and vertical advections in the model are performed using the semi-Lagrangian algorithm of Ritchie, 1987.
37
Diffusion is modelled according to the gradient K-theory. The diffusivities are constant in the free atmosphere but have a vertical profile in the boundary layer which is dependent on the state of the surface layer; the vertical diffusivity within the surface layer is approximated using the relations provided by the analytical theory of the surface layer. CANERM simulates wet and dry scavenging, wet and dry deposition and radioactive decay for selected tracers. Wet scavenging is modelled by a simplified statistical parameterization based on the relative humidity. The source term is modelled according to the concept of a virtual source (expressed as a narrow 3-D Gaussian distribution) to simulate both the release and unresolved sub grid scale mixing. A variety of atmospheric pollutant can be tracked, including radioactive species and volcanic ash.
CANERM can be executed in forecast mode up to day 10, using the operational Global forecast model, and up to 2 days using the operational Regional forecast model. CANERM can also be executed in hindcast mode using Global or Regional objective analyses. The model operates on a polar stereographic grid and can be executed on both Northern and Southern hemispheres.
MLDP0 (Modèle Lagrangien de Dispersion de Particules d’ordre 0)
MLDP0 is a Lagrangian Particle Model described in D’Amours & Malo, 2004. In this model, dispersion is estimated by calculating the trajectories of a very large number of air particles (or parcels). The trajectory calculations are done in two parts: 3-D displacements due to the transport by the synoptic component of the wind, then 3-D displacements due to unresolved turbulent motions. Vertical mixing caused by turbulence is handled through a random displacement equation based on a diffusion coefficient. This coefficient is calculated in terms of a mixing length, stability function, and vertical wind shear. Lateral mixing is modeled according to a first order Langevin stochastic equation for the unresolved components of the horizontal wind (mesoscale fluctuations).
Dry deposition is modeled in term of a deposition velocity. The deposition rate is calculated by assuming that a particle contributes to the total surface deposition flux in proportion to the tracer material it carries when it is found in a layer adjacent to the ground surface. Wet deposition will occur when a particle is presumed to be in a cloud. The tracer removal rate is proportional to the local cloud fraction.
The source is controlled through a sophisticated emission scenario module which is a function of the release rate of each radionuclide over time. For volcanic eruptions, a particle size distribution is used to model the gravitational settling effects in the trajectory calculations according to Stokes’s law. The total released mass can be estimated from an empirical
38
formula derived by Sparks et al., 1997, which is a function of particle density, plume height and effective emission duration.
In MLDP0, tracer concentrations at a given time and location are obtained by assuming that particles carry a certain amount of tracer material. The concentrations are then obtained by calculating the average residence time of the particles, during a given time period, within a given sampling volume, and weighting it according to the material amount carried by the particle.
MLDP0 can be executed in configurations similar to those of CANERM; a global configuration also exists. MLDP0 can be executed in inverse (adjoint) mode. The model has been used extensively in this configuration in the context of the WMO-CTBTO cooperation.
MLCD (Modèle Lagrangien à Courte Distance)
MLCD is a Lagrangian Particle Model described in details in Flesch, et al. 2002, and was developed by the Department of Earth and Atmospheric Sciences of University of Alberta and with the collaboration of the Environmental Emergency Response Section. It is designed to estimate air concentrations and surface depositions of pollutants for very short range (less than ~10 km from the source) emergency problems at the Canadian Meteorological Centre. As in MLDP0, this 3-D Lagrangian dispersion model calculates the trajectories of a very large number of air particles. MLCD is a first order Lagrangian Particle Dispersion Model because the trajectories of the particles are calculated from the velocities increments, while MLDP0 is a zeroth order Lagrangian Particle Dispersion Model since the trajectories of the parcels are updated from the displacements increments.
The Langevin Stochastic Equation is based on the turbulent components of the wind associated to the turbulent kinetic energy (TKE). These fluctuating components, vertical and horizontal are generated from a "user provided" set of wind observations (velocity + direction) time dependant through a "two-layer" model (Flesch and Wilson, 2004). For example, these wind observations can be obtained from a meteorological tower or from detailed real-time forecasts from NWP Global and Regional operational models. Wind profiles can change over time and vary in the vertical, but are horizontally uniform, which represents an important difference with MLDP0 that uses full 3-D meteorological fields.
MLCD can take into account the horizontal diffusion for unresolved scales operating at time scales longer than those associated to the TKE (meanders). The removal processes of radioactive decay, wet scavenging and dry deposition can also be simulated by the model. MLCD can be run in forward or inverse mode. Air concentrations and surface depositions can be calculated over five different types of grids (time-fixed or time-variable, constant or variable horizontal resolution, polar stereographic or cylindrical
39
equidistant) and for specific layers in the atmosphere through a user specified list of vertical levels.
40
MLDP1 (Modèle Lagrangien de Dispersion de Particules d’ordre 1)
A full 3-D first order Lagrangian Particle Model called MLDP1 has been implemented for short range dispersion problems on horizontal domains of 100-200 km, with a time horizon of about 12 hours. This stochastic dispersion model is well described in Flesch, et al. 2004. The fluctuating components of the turbulent wind are obtained by partitioning the TKE calculated in the driving NWP models. MLDP1 is parallelized to run on several nodes on the IBM supercomputer at CMC. It uses both distributed- and shared-memory standards.
4.5.2.2 Research performed in this field
Development of a new air quality forecast model (GEM-MACH)
Work has continued on the development of a more scientifically and technically advanced air quality forecast model to replace the CHRONOS model currently used in operations. The new model, GEM-MACH, is included into the GEM weather forecast model and it integrates, on-line, all the processes related to the formation of ground-level smog. The model takes advantage of the direct 1-way coupling between the meteorological and the chemical processes, and it also benefits from an improved aerosol representation. As well, the input emissions files have been regenerated using more recent inventories (2005 for Canada and the United States). Initial results show small but consistent improvements in the prediction of both gaseous-phase pollutants and particulate matter. GEM-MACH will be implemented into operations, replacing CHRONOS as the operational air quality forecast model, in 2009.
The global coupled atmosphere-ocean-ice system
Environment Canada (EC), Fisheries and Oceans Canada (DFO), and the Department of National Defence (DND) are preparing an operational global coupled atmosphere-ocean-ice data assimilation and prediction system that can ingest in-situ Argo float data and satellite observations such as sea surface height and temperature. With the participation of Mercator-Océan (France), the initial resources of this new inter-agency initiative, called the Canadian Operational Network of Coupled Environmental PredicTion Systems (CONCEPTS), are being directed towards three inter-related activities: 1) an operational activity based on coupling the Canadian atmospheric GEM model with the Mercator system; 2) a research and development (R&D) activity consisting of government and academic research networks to help develop and maintain a Franco-Canadian system in
41
partnership with Mercator-Océan; and 3) a products activity to identify, develop and disseminate relevant products and outputs. Operational activity is being built upon existing EC infrastructure with R&D activity enhanced through a Global Ocean-Atmosphere Prediction and Predictability (GOAPP) research network funded by the Canadian Foundation for Climate and Atmospheric Sciences.
Research activities have been focused on testing and evaluating the performance of global ¼-deg and 1-deg configurations of the Mercator-Océan Nucleus for European Modelling of the Ocean (NEMO) ocean and sea-ice models on EC computers. Progress includes the following developments: 1) using the same input data (forcing and initial conditions), a Mercator-Ocean forecast can be re-produced on EC computers (with differences that can be attributed to machine accuracy); 2) the model’s bulk formulae for calculating surface fluxes have been modified to take outputs from GEM forecasts; 3) a forecast of the ocean state using the GEM forcing, for a 10-day cycle in April 2007, is shown to be of similar quality to the Mercator-Océan forecast that uses forcing provided by the European Centre for Medium-range Weather Forecasts (ECMWF). The GOAPP version of the NEMO model has been tested with climatological surface forcing for multi-year simulations. Initial assessment shows that the model obtains reasonable boundary currents and meso-scale eddy variability, seasonal sea-ice distribution and motions, etc… Improvements in the new version will be merged into the Mercator version.
Work in progress includes coupling the global NEMO with GEM and testing the model performance with higher-frequency (3-hourly) GEM forcing over a period of one year, for which first results are now being evaluated. The ocean data assimilation system from Mercator-Océan is to be installed at CMC in 2009. New ocean data assimilation methods developed by GOAPP are to be available for transfer to the CMC system in 2010-2011.
The regional coupled atmosphere-ocean-ice system
A fully interactive coupled atmosphere-ocean-ice forecasting system for the Gulf of St. Lawrence (GSL) has been installed at the Canadian Meteorological Centre (CMC). The atmospheric component is the Canadian operational GEM model (see section 4.3) with a Limited Area Model (LAM) configuration at 15 km resolution. The oceanic component is the ocean-ice model of the GSL at 5km resolution developed at the Maurice-Lamontagne Institute (IML, Saucier et al. 2003, 2004).
This coupled system has run in an experimental mode since December 2007 and the output forecasts are being compared with those of the current GEM regional operational system for 00-48 hours. This comparison is performed in a quasi-operational mode at the Atlantic Storm Prediction Centre in Halifax
42
and at the Newfoundland & Labrador Weather Centre in Gander for assessing the impacts of atmosphere-ocean-ice interactions on short-term weather forecasts. Assessment indicates that the coupling corrects a cold bias in the surface temperature. There are evidences that this improvement is associated with a better representation of the sea-ice fraction and thickness in the coupled system, compared with the GEM operational system. Differences in the low cloud cover are also seen in the results, especially in cases of cloud streamers formation. These differences are being further evaluated with satellite imagery.
The coupled forecasts show slight differences in wind speed and direction, especially over the water. There is also a slight enhancement of the precipitation in the coupled run, especially in upslope flow areas. Investigation is ongoing to better understand the effect of the coupling on the low level atmosphere. The system is planned to be operational during fall 2009. It is planned that the GSL system code will be unified with the GEM-NEMO code in the future.
Wave modelling research
The wave modelling research is being conducted under three projects: 1) a project entitled “An ensemble modeling system for winds and waves” funded by the Program of Energy Research and Development (PERD), 2) a project entitled “Development of Probabilistic forecast tools for search and rescue” funded by the Search And Rescue New Initiatives Fund (SAR-NIF), and 3) a project entitled “Wave forecasting research and development for DND” funded by the Department of National Defence (DND). These projects address research and development or operational applications related to the WAM model that is used for operational wave forecasting at the Canadian Meteorological Centre (CMC).
Specific achievements in the PERD project in 2008 include:
Providing an enhanced WAM4.5 version to the National Laboratory for Marine and Coastal Meteorology, Halifax, for merging with the version already provided to the Quebec region which now includes time-dependent currents and ice coverage and thickness.
A coarse grid with resolution 0.5 degree and a nested fine grid with resolution 0.1 degree of the enhanced WAM4.5 were implemented in an experimental mode in the northwest Atlantic and northeast Pacific basins for a 3-month period from August-October 2007. Validation of the model outputs against observations is still in progress. This validation would be done in collaboration with the National Laboratory for Marine and Coastal Meteorology to determine the model configuration of the WAM4.5
43
versions with and without time-dependent currents and ice coverage and thickness in any operational implementation by CMC.
Conversion of the enhanced WAM4.5 to run in a coupled mode based on the current coupling strategy “GOSSIP2” and using multiple processors on the IBM and LINUX cluster machines.
Publication of a paper and acceptance of second paper for publication in the refereed journal Atmosphere-Ocean.
One objective of the SAR-NIF project is to develop and evaluate ensemble wave forecasts. Ensembles of coarse-resolution global WAM forecasts and high-resolution east-coast WAM forecasts are being generated automatically on a daily basis. Hind-casting WAM forecasts using archived ensemble prediction system winds is also on-going. Forecasts of the joint probability of wind speed and direction are being obtained as two-dimensional probability density functions and displayed as polar plots for specific locations. Comprehensive time-series of observations available from a global buoy network have been produced for the latter half of 2007 and raw ensemble outputs are being verified (e.g., rank histograms, postage plots of individual member forecast time-series compared against corresponding observations).
Another objective of the SAR-NIF project is the development of probabilistic models for search areas. This development is being steered by preliminary results from verification of the target locations and the probabilistic forecasts against the available observational data. This has involved conceptualizing the coast guard CANSARP-Scientific algorithm (in the presence of leeway drift) as a modified centered (2-dimensional) histogram model which is true only in the case of non-intersecting individual particle search areas. This supplies a framework for the incorporation of the ensemble wind forecasts into the CANSARP-Scientific model, for which algorithms are being developed. Progress in this objective will accelerate due to the addition of a postdoctoral fellow to the project in early 2009.
Within the DND project, the National Laboratory for Marine and Coastal Meteorology is working on the verification of the wave model for three new domains 1) The Arctic 2) Gulf of St. Lawrence and 3) Hudson Bay. Also, two additional daily runs of the WAM model have been introduced to bring it to four times per day in step with the new CMC regional implementation. The plan is to implement these new windows at CMC in the near future. A two phase approach is being taken to implement a modified version for the Gulf of St. Lawrence. The first phase is to introduce the new domains without modifying the WAM model code underneath. During the second phase time-dependant currents and new ice modules will be introduced. This code will also be merged with modifications provided by the PERD project as
44
mentioned above. The merged version is to be further tested and validated for implementation at CMC. It is expected that this will be completed by the autumn of 2009.
High resolution land surface prediction
Several new models and approaches are currently being examined to better predict surface or near-surface conditions over land. An external land surface modeling system has been developed and is now integrated at grid sizes much smaller than that of the atmospheric models. This increased resolution allows better exploitation of geophysical information on orography, land use / land cover, and water fractional coverage. Adaptation, or downscaling, of atmospheric forcing (precipitation, temperature, humidity, winds) is used to more realistically drive the surface processes. The success of this approach has been demonstrated in mountainous regions (as a prototype is prepared for the 2010 Vancouver Winter Olympic Games).
Improvement or inclusions of several aspects of land surface modeling are currently being tested. For instance, the very complex SNTHERM snow model has been coupled with a simple sea-ice model. Optimal configurations of this model are being sought. Also, the PIEKTUK blowing snow has been implemented in GEM (and can be used in the external land surface system). Development of the land surface schemes ISBA (Canadian version) and CLASS is ongoing. This high resolution land surface system is being used for several applications, including meteorological predictions in cities and surface hydrological predictions (soil moisture, snow on ground, runoff and drainage)
4.5.3 Specific products operationally available
Upon receiving a request for a nuclear or radiological support from an appropriate WMO Member Country Delegated Authority, the CMC will provide the following standard set of basic products:
three dimensional trajectories starting at 500, 1500 and 3000 m above the ground, with particle locations indicated at synoptic hours;
time integrated pollutant concentration within the 500 m layer above the ground, in units/m3, for each of the three time periods. The duration of the first time period is between 12 and 24 hours starting at release time. For a release before 12 UTC, it ends at 00 UTC; for a release after 12 UTC, it ends at 12 UTC the next day. The second time period is the 24 hours following the first time period. The third time period is the 24 hours following the second time period;
total deposition (wet and dry) in units/m2 from the release time to the end of the third time period.
45
The standard set of products was agreed upon at the First International Workshop on Users’ Requirements for the Provision of Atmospheric Transport Model Products for Environmental Emergency Response. The CMC can also provide charts of air concentration estimates for many levels in the atmosphere as well as total surface deposition estimates at various time intervals. All the products can be transmitted in real time during environmental emergencies.
4.6 Extended range forecasts (10-30 days) (Models, Ensembles, Methodology)
4.6.1.1 In operation
Monthly temperature forecasts based on numerical weather prediction techniques are issued at the beginning and mid-month of every month. The current system uses 4 different models: the GEM, the atmospheric general circulation model of second and third generation (AGCM2 and AGCM3 (T63L32) respectively) of the Canadian Climate Centre for modelling and analysis (CCCma) (McFarlane et al. 2005), and the Spectral aux Éléments Finis (SEF - T95xL27) model, developed at RPN (Ritchie, 1991; Ritchie and Beaudoin, 1994). The hindcast period, commonly referred to as HFP2 (Historical Forecast Project, second generation), is 1969-2004. This system involving four models (an ensemble of 40 members) became operational in December 2007. An upgrade was introduced in 2008 to run the system on 00 and 12UTC data over the last 5 days instead of using only 00UTC runs over the last 10 days. This modification brought a small but statistically significant improvement.
In an operational context, the four models use the same initial operational analyses. SST anomalies observed over the previous 30 days are added to climatological values over the period; snow is a prognostic variable for models GEM-CLIM, AGCM2 and AGCM3, while SEF relaxes snow towards climatology in the middle of the first month.
Direct model surface temperature outputs ensemble means are averaged over the 30-day period and subtracted from model climatology obtained from a 30-year hindcast period (see section 4.7). The final deterministic forecasts are generated from the average of the four normalized model ensemble means. These temperature anomalies are then normalised by the model standard deviation multiplied by 0.43 (to get equiprobable classes) and categorised in above, below and normal categories. Charts are produced, showing above normal, below normal and near normal temperature categories.
46
4.6.2 Research performed in this field
Extended range weather forecasts
The Madden-Julian Oscillation (MJO) is one of the most important processes that affect extended range weather forecasts (10-30 days). Several studies have been conducted to improve our understanding of tropical-extratropical interactions associated with the MJO and to assess the forecast skill of the MJO in our numerical models (Lin et al. 2007a; 2008b). Numerical experiments have been performed to investigate the atmospheric transient response to tropical thermal forcing that resembles El Niño and La Niña (Lin et al. 2007b). Such a study could help to clarify several important aspects of the extratropical response to the tropical forcing, especially the nonlinearity in the response, and thus provided important information for numerical model validations and extended range forecasts.
Also on the intraseasonal time scale, the setup and decay processes of the North Atlantic Oscillation (NAO) and how the characteristics of the NAO events are influenced by the choice of its definitions have been investigated (Jia et al. 2007).
It has been estimated that initial conditions still play a significant role for extended range forecasts. This is why a new system based on the medium-range global EPS is being studied for extended range forecasts up to 35 days. Initial conditions of the EPS are superior to the current operational approach.
4.6.3 Operationally available EPS Products
Deterministic forecast of monthly temperature anomaly is available on the Internet (Web address http://weatheroffice.ec.gc.ca/saisons/index_e.html).
47
4.7 Long range forecasts (30 days up to two years) (Models, Ensembles Methodology)
4.7.1 In Operation
Season 1 forecasts (zero month lead time)
Season 1 forecasts are produced using a numerical approach (Derome et al., 2001). The approach is identical to the one described in section 4.6 for monthly forecasts. Charts are similar to those used in monthly forecasts: 3 categories separated using the 0.43 standard deviation of observed climatology. The temperature and precipitation forecasts are produced using direct model outputs. The four ensemble means of forecasts are subtracted from their respective models’ climatologies, and normalised by models’ standard deviations. These normalised forecasts are then added, divided by four and used to produce a chart, categorised in 3 categories, using the 0.43 value for separation. Skill charts of temperature and precipitation, as obtained over the 35 years of historical runs (26 years before December 2007), are shown for each of the 4 seasonal forecasts periods.
The probabilistic forecasts are done by counting members in each of the three possible forecast categories: below normal, near normal and above normal. The probabilistic forecasts are not calibrated but a reliability diagram with error bars is provided with each forecast.
Seasonal forecasts (1 month lead time)
Seasonal forecasts with 1 month of lead time are produced using an identical approach to the seasonal forecast described in the precedent section. Four-month model runs are first generated and then employed to issue monthly forecasts, seasonal with zero month lead time forecasts, and seasonal with 1 month lead time forecasts. We select different slices of the runs to calculate the corresponding anomaly. Seasonal forecasts with 1 month of lead time are generated for twelve three-month seasons and are issued on the first day of each month, the forecasts being valid for the three months after the current month.
Season 2, 3 and 4 forecasts
Seasonal forecasts with lead times of 3, 6 and 9 months are produced, using a Canonical Correlation Analysis technique (Shabbar and Barnston, 1996). The technique uses the SST anomalies observed over the last year to predict temperature and precipitation anomalies at Canadian
48
stations (51 for temperatures, 69 for precipitation) for the following 3 seasons. Charts of above, normal and below temperature and precipitation are produced. These are accompanied by skill charts, as obtained from cross-validation over a 40-year period. Seasonal forecast for seasons 2, 3 and 4 are available for the main four seasons of the year (winter: December, January, February; spring: March, April, May; summer: June, July, August and fall: September, October, November).
4.7.1.1 Research performed in this field
Seasonal forecast
A statistical approach to correct the ensemble forecasts was formulated based on the regression of the model's leading forced singular value decomposition (SVD) patterns and the observed seasonal mean precipitation. Significant improvement in seasonal forecast skill for Canadian precipitation was achieved, especially over southern prairies and a large area of Quebec-Ontario (Lin et al. 2008a).
Additional post-processing strategies have been evaluated in retrospective forecasts using four global atmospheric models which form the basis for the current Canadian operational system. Several methods of combining multimodel output to produce deterministic and probabilistic forecasts of near surface air temperature, 500-hPa geopotential height, and 700-hPa temperature for 0-month and 1-month leads were considered. This work is described in Kharin et al. "Skill assessment of seasonal hindcasts from the Canadian Historical Forecast Project" (CHFP, to be submitted). Boer and Hamilton (2008) investigate the influence of the QBO on extratropical predictive skill in HFP2 results. The state of the QBO may be predicted with considerable skill for many months. The study indicates that taking account of the QBO could provide additional, although modest, skill centred in the region of the NAO.
A related analysis of HFP2 data (Boer, 2008) indicates that the long term trends seen in reanalysis data for the 30 years period covered by HFP2 is weak in the forecasts themselves. One hypothesis is that the lack of explicit greenhouse gas forcing in the forecast models is a cause, even though the HFP2 two-tier forecasts include this information implicitly in the SSTs and in the initial conditions. It is apparently possible to improve forecast skill over regions of Eurasia by introducing the observed trend in the forecasts but not, unfortunately, over North America. A lack of GHG forcing might be expected to have a larger effect on the coupled CHFP forecasts than on the HFP2 forecasts. In the latter case, some effects of GHG forcing are contained implicitly in the SSTs while this is not the case
49
for the coupled forecasts. We expect to include GHG, and perhaps other external forcing agents, in forthcoming CHFP calculations.
The influence of tropical Pacific forcing on the Arctic Oscillation (AO) was analyzed (Jia et al. 2008). The AO has important contribution for the Northern Hemisphere climate variability on seasonal and interannual time scales. Through data analysis and numerical modelling, evidence was shown for the tropical connection of the AO variability, which could be valuable for model evaluations and long-range predictions.
Predictability studies have also been performed for seasonal forecasts in a more theoretical frame work. Tang et al. (2007) proposed a predictability measure for seasonal prediction of the Arctic Oscillation (AO). In Tang et al. (2008), different measures for climate predictability were compared, based on the El Niño-Southern Oscillation (ENSO) and AO predictions by two coupled models and two atmospheric circulation models.
As an initial step toward developing a coupled seasonal forecast system, a 30-year set (1972-2001) of 10-member ensemble retrospective forecasts has been produced. These forecasts, based on the CGCM3.1(T63) climate model, used very simple methods for initialization (nudging to observed SST) and ensemble generation (starting from successive daily atmospheric states). With forecasts of 12 months duration commencing 1 Mar, 1 Jun, 1 Sep and 1 Dec, this entailed 1200 years of coupled model integration. This forecast set, known as the Coupled Historical Forecast Project, version 1 (CHFP1), has provided a development platform for analysis tools and data management, as well as a baseline against which the skill of subsequent forecast system versions can be compared. Forecast system development efforts underway include improved physical parameterizations and numerics in the ocean and atmospheric model components, increased vertical resolution in the ocean component, improved initialization incorporating oceanic, atmospheric and land-surface data assimilation, and time-dependent radiative forcing due to evolving greenhouse gas concentrations, etc.
4.7.1.2 Operationally available Products
Deterministic and probabilistic products of seasonal forecast with zero and 1 month lead time are available on the Internet. (Web address http://weatheroffice.ec.gc.ca/saisons/index_e.html).
Charts and model output grids for the season 1 are available in real time on Internet at the following site (username and password available on demand):
The forecast digital data are on a 2.5 degrees grid in GRIB1 format. Monthly means of surface air temperature, precipitation, 500 hPb heights, 850 hPa temperature and mean sea level pressure are available for each of the 40 models runs used to prepare the official forecast. Also, hindcast data are available for the models as well as climatological fields. Please read the information file named README.txt in the directories to get more detailed information.
In addition of the regular four seasons (winter, spring, summer and autumn), the seasonal forecasts are also generated for the other three-month periods for a total of 12 seasonal forecasts per year. They are issued on the first day of each month of the year and valid for the following three months.
Deterministic forecast of temperature and precipitation anomalies for season 2, 3 and 4 are available on the Internet (Web address http://weatheroffice.ec.gc.ca/saisons/index_e.html).
5.0 Verification of prognostic products
5.1 Annual verification summary
Objective verification of the operational numerical models is carried out continuously at the CMC. S1 skill scores, biases and root mean square errors are produced for the Canadian verification area. A monthly verification summary is produced and distributed to our clients.
A verification system following the WMO/CBS recommendations was implemented in 1987. Results are routinely exchanged with the other participating NWP centres. The table on the following page is a summary of the CMC verification scores for 2008 according to the recommended format. Since 1994, CMC has exchanged these verification scores electronically with other NWP centres, which has allowed a more comprehensive comparison of NWP models from the various centres.
In August, CMC updated the radiosonde lists used for verification against observations to the latest lists published by the lead Centre, ECMWF. The previous lists dated from 2005 and since that time the number of radiosondes has increased substantially, particularly over Asia, the Tropics and parts of the Southern Hemisphere. Tests conducted prior to implementation of the new lists indicated that verification scores were strongly affected, generally toward reduced errors, for those areas where the number of radiosondes increased.
51
Verification summary - 2008
Canadian Meteorological Centre
Global Environmental Multiscale (GEM) Model (33 km, L58)
S. Hemisphere RMSE (m) GZ 500 hPaRMSVE (m/s) Wind 250
13.6 6.3
15.26.5
27.310.4
32.010.8
45.015.7
56.616.2
52
hPa
5.2 Research performed in this field
USTAT
The objectives of this project are: the improvement the verification of atmospheric and environmental models, to facilitate the visualization of data (models, observations, errors) and to allow monitoring in near real-time individual forecasts and their verifications. The surface weather elements forecasts will be validated against the network of hourly and synoptic observations. Eventually, we will also incorporate radar and satellite observations. Each observation will be subject to a comprehensive quality control. This system will have the ability of evaluating several forecasting models, including probabilistic ones. The display component will be also developed.
In 2008 a first prototype system USTAT was made available to the Meteorological Research Division. Early results have led to several interesting findings on the diurnal temperature cycle of our models.
The bootstrap method for confidence interval estimation to verification of global and regional ensemble forecasts has been developed (Candille et al., 2007).
6.0Plans for the future (next 4 years)
6.1 Development of the GDPFS (in the next year)
6.1.1 Major changes in the operational DPFS which are expecting in this year
Development for the regional and the Global forecasting systems
Improved forecasts of tropical cyclones and TC transitions.
Better treatment of the connection between the atmosphere and the surface.
Improved boundary layer scheme.
Improved treatment of cloud/radiation feedbacks, especially in the UTLS region.
Charney-Phillips vertical staggering.
53
Improved horizontal discretization.
The next version of the Global GEM model will have 80 levels and a model lid at 0.1 hpa. This will allow many more satellite radiance data to be assimilated.
We will incorporate AMSUA, MHS, ASCAT and GRAS data from the MetOp Satellite, as well as increased vertical resolution from radiosonde and aircraft. AMSU-A from Metop will also be implemented in 2009. Also an extended coverage of 6.7 micron radiances from geostationary satellites (Clear Sky Radiances (CSR) from METEOSAT (2 satellites) MTSAT, and GOES (2 satellites) will be implemented. A comprehensive package including these CSR data, IASI radiances and SSMI/S radiances will be evaluated for implementation.
IASI radiances. Reception of IASI data has been secured through a link with NESDIS in the form of 616 channels (out of 8461). The IASI data processing and assimilation procedures will follow a very similar path to that used for AIRS. The available sub-pixel AVHRR information that comes along with the IASI data files will be considered for quality control. A first set of 128 channels was selected for assimilation in the current (operational) GEM model. Good results were obtained, especially in southern hemisphere, during 4D-Var assimilation experiments performed for winter 2008. The model lid will be raised from 10 hPa to 0.1 hPa in 2009. This will allow the assimilation of higher peaking channels than would be possible otherwise.
GPS (radio-occultation and ground-based). A project for a prototype ground-based GPS meteorological network in Canada (for about 100 sites) has been proposed. So far, capital funds have been obtained to purchase processing software and data servers for data processing. This project would also need staff but the financial resources currently have not been identified within Environment Canada. In the mean time, ground based GPS observations at about 30 stations in Canada are being processed in an ad-hoc manner. Assimilation tests (for a summer and winter test period) of the NOAA ground-based GPS meteorological network have been completed in the regional MSC weather forecasting model (Macpherson et al. 2008). The largest impact has been found to be in the summer over the central US where 24-48 h forecasts of precipitation are improved.
GPS (radio occultation reflections). A project for the analysis of sea surface reflections observed during GPS radio occultations was initiated. It receives funding from the Canadian Space Agency (CSA) through the GRIP program (Government-Related Initiatives Program). The objective is to extract geophysical information relevant to the low troposphere, with potential applications to meteorological data assimilation.
A three year research project, funded by the Search and Rescue New Initiatives Fund, “Enhancement of ocean surface wind and ocean current analyses and forecast through data assimilation into operational models” started in 2008. The primary goals of this project is to improve the accuracy of sea surface wind analyses and forecasts by developing better capacity for the MSC to assimilate satellite-based radar data, including those from QuikSCAT, ASCAT and RADARSAT, as well as to demonstrate
54
the positive impact that these improvements will bring to projecting drift of search objects using CANSARP (Canadian search and rescue planning) which is a computer modeling tool. As a first step, the acquisition, monitoring and implementation of the ASCAT wind products from KNMI were performed. We showed that the quality of these data is as good as that from the QuikSCAT platform. The operational implementation of these ASCAT data is foreseen in spring 2009 in the global and regional forecast systems and in the EPS.
The use of flow-dependent background-error covariances in the variational analysis system that are estimated from the ensemble Kalman filter background ensembles will be tested for operational implementation. This is motivated by the very positive impacts obtained from an evaluation of the same approach as part of a project to compare the EnKF and 4D-Var data assimilation systems. The tests will be performed with the stratospheric versions of the 4D-Var and EnKF systems (with the highest level at 0.1 hPa).
A 4D-Var LAM system is under development and should become operational in the next 2 years.
The next version of the global GEM model will allow for a hybrid vertical coordinate with vertical staggering of variables. The variational assimilation system will be adapted to run with this model. These changes are expected to be operational on a 1-year timeframe.
A project funded by CSA (GRIP program) aims at assimilating in real time ozone and aerosol optical depths in the operational GEM analysis system. Simplified ozone chemistry has already been implemented. Ozone data will come from GOME-2 retrievals of total ozone, plus ozone sensitive radiances from AIRS and IASI. For the aerosols, total optical depth will be assimilated, with assumptions for the separation into one of five possible aerosol types.
Developments of the global ensemble forecast system (EPS)
It will be attempted to improve the stratospheric dynamics. A new version of the GEM model, with staggered vertical levels, will be evaluated for use in the ensemble prediction system (EPS). Another option is to raise the top of the model beyond 10 hPa. Here the EPS developments will be guided by the related GEM-Strato project.
In 2009, the use of additional data types in the EnKF data-assimilation cycle will be investigated. The focus will be on supporting the higher model lid. We will thus attempt to assimilate additional radiance channels.
It will be investigated how to best account for model error in the stratosphere.
A set of new products are under development on the EPS outputs. Bayesian Model Averaging (Raftery et al., 2005) is used to generate probability density
55
function for temperatures. Results with Bayesian Model Averaging are available in Wilson et al. (2005).
A project for the integration of the NAEFS ensemble forecasts for day 6-7 into the public forecast system has been initiated. Currently, only Canadian EPS members are used to forecast day 6 and 7.
We plan to implement a calibration scheme for the NAEFS probabilistic products.
Developments of the global ensemble forecast system (Seasonal)
In 2009, we will test new calibration schemes with the goal of implanting one of them.
We also plan to test and implement a new statistical post-processing scheme to improve seasonal precipitation forecasts.
We also plan to test the production of monthly forecasts using multi-realisation from a single model started with different initial conditions. This new approach will required the production of a hindcast.
A new Canonical Correlation Analysis (CCA) system will be implemented for forecasts in the range from 3 to 12 months.
Over the next few years, we aim at implementing a fully-coupled AGCM-OGCM operational seasonal forecast system.
Development of the statistical products and other products
There is a plan to expend the UMOS set of guidance to include dew point temperature, blowing snow, probability of precipitation amounts, and types will be continued.
The development of an upgraded Perfect Prog to forecast the probability of precipitation will be put on hold. Instead, we want to test a sampling technique.
Statistical post-processing using the UMOS package on CHRONOS model output was extended to NO2 in addition to ground level ozone (O3) and particulate matter (PM 2.5)
56
Assimilation of Radarsat synthetic aperture radar (SAR) surface observations into GEM-LAM
Experiments assimilating SAR normalized radar cross section, which is a high-resolution proxy for marine wind information, are underway using a limited-area version of GEM. Offline studies have explored the information content of these observations and their potential error bias in a 2D-variational approach (Choisnard and Laroche 2008). Cross-validation of SAR observational error has also been performed using buoy observations (Danielson et al. 2008). A two-year project funded by the Canadian Space Agency (CSA) under its Government Related Initiatives Program (GRIP) will explore the impact of SAR wind information on analyses and forecasts of GEM at resolutions of 2.5km and 15km. Impacts of assimilating SAR backscatter will be gauged in part with respect to the impact of assimilating lower resolution scatterometer winds. The results of this project are expected to feed into the Search and Rescue New Initiatives Fund (SR-NIF) project on enhancements of ocean surface wind and ocean current analyses and forecasts.
6.1.2 Major changes in the operational DPFS which are envisaged within the next 4 years
CaLDAS
Development of an improved land surface data assimilation system is ongoing. The new system, called the Canadian Land Data Assimilation System (CaLDAS), will assimilate a larger amount of data using more advanced techniques. For soil moisture, remote sensing data from ESA’s Soil Moisture and Ocean Salinity (SMOS) mission and from NASA’s Soil Moisture Active and Passive (SMAP) is being examined. This data will be assimilated in conjunction with near-surface air characteristics (temperature, humidity), which is available on an hourly basis, compared with a return period of 1 to 3 days for SMOS / SMAP data. For snow, a new project is now underway to use space-based high-resolution optical information (e.g., from MODIS) to specify snow fractional coverage and microwave information (e.g., AMSR-E or SSM/I) to retrieve snow water equivalent will be examined. Finally, work is also underway to improve the first guess for the assimilation of leaf area index (LAI). The Biome-BGC model, predicting the evolution of ecosystems including fluxes of water, energy, carbon, and nitrogen, is used for the evolution of vegetation. Results from Biome-BGC will be provided in a simple LAI assimilation system developed a few years ago at Environment Canada.
57
Polar-GEM and TAWEPI
TAWEPI (Thorpex Arctic Weather and Environmental Prediction Initiative) is a project led by researchers of the Meteorological Research Division of Environment Canada. TAWEPI is part of the THORPEX-IPY cluster (Nordeng et al. 2007) and is partly funded by the Government of Canada Program for International Polar Year (IPY). It includes modelling projects and data assimilation studies aiming to enhance weather forecasting capabilities in polar regions, and to improve our understanding of the Arctic and its influence on world weather. The primary objective of the TAWEPI initiative is to develop and validate a regional Numerical Weather Prediction (NWP) model over the Arctic during the IPY observation period. The proposed model, called Polar-GEM, will have a 15-km resolution focused over the Arctic basin and surrounding regions. TAWEPI's research activities started in April 2007 and the first steps in the development of the Polar-GEM model have been taken. A state-of-the-art sea-ice model is being adjusted to improve the sea-ice representation in the domain of the Polar-GEM. High-resolution sea-ice concentration analyses have recently become available and are being tested in the framework of the Polar-GEM system. A multi-layer snow model, describing processes over the various types of surfaces on the Arctic environment, such as sea-ice, tundra, glaciers and ice caps, is currently being implemented in Polar-GEM. Using a stratospheric extension of the GEM model, preliminary analyses of the stratosphere are being generated for the IPY period, including estimates of the ozone field, which will lead to an improved understanding of polar processes in the atmosphere. Related research activities, both planned and ongoing, include an improved representation of high-latitude clouds, validation and assimilation of satellite data from polar orbiting satellites, and sensitivity studies based on singular vectors in the Arctic.
High-resolution modeling for the Vancouver 2010 Winter Olympics
Work has begun in 2007 to develop a high-resolution modeling system to better support the weather forecasting needs of the Vancouver 2010 Winter Olympics. The system includes components for high-resolution LAM models and surface modeling at the micro scales. The first component consists of a cascade of LAM models (2.5-km and 1-km grid sizes) integrated for 16h, twice a day, with several improvements to the numeric (changes to improve the precision and efficiency) and the physics (cloud microphysics, cloud-radiation interactions, radiation on mountain slopes) compared with the system currently operational at the Canadian Meteorological Centre. During the Olympics, this cascade will be supplemented with an “urbanized” LAM window at 250-m resolution over the Vancouver metropolitan urban area, developed as part of the Urban Meteorology Modeling System.
For the second component, several new and original tools are used to adapt and refine predictions near and at the surface. Very high-resolution two-dimensional surface systems, with 100-m a grid size, will cover the Vancouver Olympic areas.
58
Using adaptation methods to improve the forcing from the lower-resolution atmospheric models (1-km LAM), these 2D surface models better represent surface processes, and thus lead to better predictions of snow conditions and near-surface air temperature. Based on a similar strategy, a single-point model has been implemented to better predict surface characteristics at each station of an observing network especially installed for the 2010 events. The main advantage of this single-point system is that surface observations are used as forcing for the land surface models, and can even be assimilated to improve initial conditions of surface variables such as snow depth and surface temperatures.
A quasi-final version of this prototype has been implemented experimentally in December 2008 in time for the Olympics Practicum Forecasting Exercise held during the winter 2009 in Whistler and Vancouver. Work will continue on further refinement of the prototype, and on objective verifications and validation of the system, based on the preliminary results from the winter seasons of 2008 and 2009.
6.2 Planned Research Activities in NWP, Nowcasting and Long-range Forecasting
6.2.1 Planned Research activities in NWP
6.2.1.1 Data assimilation
Cloudy infrared radianceA methodology to assimilate cloudy infrared radiances was demonstrated in a 1D-var context and is well adapted to hyperspectral sensors such as AIRS and IASI (Heilliette and Garand, 2007). This methodology was implemented in the 3D-var assimilation system, with cloud parameters estimated within the global minimization problem. Assimilation tests with real AIRS radiances are being carried out. First results were slightly negative, an indication that more stringent quality control procedures are required. Positive results obtained at the ECMWF (McNally 2008) using a similar but less sophisticated approach suggest that it is possible to get a positive impact using this approach by restraining the assimilation of cloud-affected radiances to near overcast situations. Furthermore, enhancements in the cloud detection and characterization procedure used in AIRS and IASI quality control, resulting from research done in the International Polar Year context, are expected to improve our cloudy radiances assimilation system. In the case of IASI radiances, the use of sub-pixel information provided by the AVHRR imager (using the cluster radiance analysis included with level 1.c data) will help to select homogeneous field of views for which our simplified cloud modeling is more likely to succeed.
Aerosol Climatology
A new aerosol climatology, 3D and including five species, was developed in 2007. The aerosol optical depths are used as input to the radiation package of Li and Barker in a GEM-strato configuration (top at 0.1 hPa). Optical properties were revised accordingly (several spectral bands). Comparisons were made between the ECMWF
59
EC, and AEROCOM climatologies in terms of aerosol forcings in climate runs. Independent satellite data from CERES (optical depths and forcings) were used in the evaluation. It is planned to implement the new EC climatology in 2009, with interaction with the newly implemented Li and Barker radiation scheme.
Remote sensing: Limb sounding wind measurement for the Stratospheric Wind Interferometer For Transport Studies (SWIFT) instrument
A fast forward operator for the CSA CHINOOK SWIFT instrument (provides stratospheric winds and ozone) is being developed to enable assimilation of observations in near real time in the event that these will indeed be made available in near real time by either the CSA and/or ESA.
Data assimilation for the short range forecasting: the Limited Area Model 4D-var assimilation (LAM4D)
Regional Continental domain: Following the operational implementation of the new LAM3D-Var analysis system at CMC (cf. sec. 4.3.1.2), further R&D work is planned. The first part will be the introduction of Fillion et al.’s (2007) diabatic tangent linear normal mode balancing scheme. This is expected to improve substantially the low-level vertical velocity driven by dynamical and moist-physical processes in order to improve data assimilation of precipitation related data and improve large-scale cloud coverage and precipitation forecasts (0-24h). An identical (dry) version of this scheme was designed and implemented with benefits in the GSI analysis system at NCEP in 2007 (Kleist et al. 2009). This approach will also benefit numerically of the vertical staggering introduced in the GEM model as soon as work is finalized on migrating the VAR unified (Global & LAM) analysis code to vertical staggering directly in the analysis. This work is planned to be finalized by the end of 2010 and represents the second important step of development. Third, the 4D-VAR scheme is expected to be delivered soon after the aforementioned two steps together with horizontal resolution analysis increments increase. Fourth, the benefits of specification of a flow-dependent background error covariance matrix using ensemble of forecasts (global) (e.g. Buehner 2005) for the Regional Mesoscale context will be examined.
Local domains: In research mode, the LAM3D analysis system will be applied to a Local-2.5 km resolution for the Vancouver area, Canada for the winter Olympic Games configuration (see Mailhot et al. contribution with GEM-LAM, this document). Both 3D and 4D-Var approaches will be tested for this domain.
Intercomparison of the 4D-Var and ensemble Kalman filter (EnKF) dataAn intercomparison of the 4D-Var and ensemble Kalman filter (EnKF) data assimilation systems is being conducted in the context of producing global deterministic numerical weather forecasts. The configurations of the EnKF and 4D-Var are modified to eliminate as many of the differences between the systems as possible. Also, use of the EnKF ensembles is being evaluated for specifying flow-dependent background-error covariances in 4D-Var. A new approach, called the Ensemble-4D-Var (En-4D-Var), is also being evaluated. This variational data
60
assimilation approach uses 4D flow-dependent background-error covariances estimated from EnKF ensembles to produce a 4D analysis without the need of tangent-linear or adjoint models. Preliminary results show that forecasts of similar quality are obtained by using either the standard 4D-Var analysis or the EnKF ensemble mean analysis. Also, the use of the EnKF flow-dependent error covariances in the 4D-Var leads to significantly improved medium-range forecasts in the southern hemisphere as compared with using covariances similar to those used operationally.
Sea-ice analysisResearch is being conducted to develop a variational data assimilation system for producing analyses of sea ice conditions and for initializing coupled models that include sea ice. The use of a simple radiative transfer model will be evaluated for directly assimilating observed passive microwave radiances and compared with assimilating retrieved ice parameters using, for example, ECICE. The direct assimilation of higher resolution observations from AVHRR and RadarSAT-2 will also be investigated.
A new method was developed to retrieve ice types and their concentrations (along with total ice concentration). The plan is to assimilate these retrievable parameters into the sea ice data assimilation system, which is being developed in the Atmospheric Science and Technology Directorate (ASTD) jointly with the Canadian Ice Service (CIS). The method employs an optimization technique to account for inequality constraints (i.e. ice concentration results cannot be lower than 0% or higher than 100%). This is a main advantage over previous methods. The method can be used with any set of remote sensing data, hence its importance as an evaluation tool to decide on which satellite radiometric observations can be assimilated. Applications of the method were conducted in the operational marine area of the Gulf of St. Lawrence and the entire Arctic basin
Chemical data assimilation
Research continues into data assimilation for climate applications. The ultimate goal is to understand climate model deficiencies, and to better understand the process of data assimilation. Previous work with a 3D-variational assimilation with a climate model which includes interactive chemistry, radiation and dynamics, the Canadian Middle Atmosphere Model, has demonstrated the vertical transfer of information from the troposphere to the mesosphere through waves which propagate upward during 6-h forecasts in the assimilation cycle. More recently, Nezlin et al. (2009) have demonstrated that assimilation of data from below the mesosphere can define large scales in the mesosphere (Nezlin et al, 2009) but not intermediate or smaller scales (higher than wavenunmber 10),. Thus there is value in performing data assimilation with a forecast model that has realistic mesospheric dynamics even when mesospheric observations are not assimilated. Since the mesosphere is partially slaved to the lower atmosphere by information propagating up from below, the predictability of the mesosphere determines the extent to which mesospheric
61
observations can constrain aspects of models such as parameters in Gravity Wave Drag schemes.
62
PCW mission
CSA is proposing with EC as main user/partner the Polar Communications and Weather mission. This mission will provide seamless communications and satellite imagery over the entire region 50-90 N from two satellites in HEO 12-h orbits. Phase 0 was completed in the fall of 2008. Funding was secured for Phase A to end late 2011. The mission is planned for 2016. The main meteorological payload is an advanced imager similar to those planned for the next generation of GEO satellites (MTG, GOES-R). Additional payloads will be considered in Phase A as well as international partnerships.
6.2.1.2 Modeling
The grid-point and spectral discretizations of the shallow-water equations were developed and will be compared at high-resolution with the Yin-Yang grid.
Research is planned to update the radiative transfer scheme: the use of global maps of band dependent surface emissivity and albedo, improved parameterization of effective radius for ice crystals, vertically varying trace gases climatologies. Research is planned to test the production and use of an ozone analysis (replacing a climatology). Research is also planned to improve the cloud physics scheme, in particular we plan to develop and test a multi-moment microphysical scheme for meso-scale resolutions. Other aspects of the model which will warrant major research efforts are the vertical diffusion and the shallow convection.
Urban meteorology modeling system
In the context of the CRTI (CBRN - Chemical, Biological, Radiological, and Nuclear - Research and Technology Initiative) project, the Meteorological Service of Canada (MSC) has recently developed an “urbanized” version of the LAM model with an urban surface scheme (the Town Energy Balance – TEB) to better represent the effects of large cities for reliable prediction of flows and dispersion in the complex urbanized environments of populated North American cities (Mailhot et al., 2006).
The development of such a prototype (with grid-size resolutions going down to about 250m) involved several aspects: 1) extension of turbulent diffusion scheme to 3D turbulence, 2) inclusion of urban processes with the Town Energy Balance (TEB) urban canopy scheme, 3) generation of new land covers characterizing urban types (Lemonsu et al., 2008b), and 4) specification of anthropogenic heat fluxes for use in TEB. Two urban field campaigns were held in Montreal (MUSE - Montréal Urban Snow Experiments - Bélair et al., 2006; Lemonsu et al., 2008a) to examine urban surface energy budgets during Canadian winters. Validation of the urban modeling
63
system is underway using detailed observations from the Oklahoma City Joint Urban 2003 and MUSE urban field campaigns.
During March 2007, a prototype of this “urbanized” system, consisting of a cascade of 2.5-km, 1-km and 250-m grid sizes LAM windows, has been running experimentally on a weekly basis for the Montreal and Vancouver metropolitan urban areas, including tracers representing point releases and dispersion of passive substances. Tests over Montreal and Vancouver resulted in quite realistic flow circulations in complex terrain. This “urbanized” system will be run on a daily basis during the period of the Vancouver 2010 Olympic Games
A second phase of this CRTI project has started in September 2008, with the objectives to further improve the urban prototype and prepare its transfer to CMC operations. The urban meteorology modeling system will benefit from the Environmental Prediction in Canadian Cities (EPiCC) Network dealing with urban meteorology and remote sensing in Canada. This network will provide urban measurements in the Montreal and Vancouver areas on a continuous basis for a period of two years, together with remotely-sensed data for land cover and urban structures, which will allow validating model aspects which have not been tested extensively so far.
Hydrological PredictionWhile runoff is predicted by most operational numerical weather prediction systems, including CMC's NWP system, this field is typically not used for operational hydrological forecasting. This is partly because it requires a tight coupling of NWP models and hydrological models, through a shared land-surface scheme. In collaboration with the Meteorological Service of Canada, with the Water Survey of Canada, and with provincial agencies which are responsible for streamflow forecasting in Canada, RPN has been working on such a coupled atmospheric/land-surface/hydrological modelling system called MESH. MESH has been implemented with success on a number of watersheds across Canada, including the Laurentian Great Lakes system. It has been used to perform a diagnostic evaluation of the daily water balance of the Great Lakes as part of the International Upper Great Lakes Study, and an ensemble hydrological forecasting system has been built in which MESH is forced by the global ensemble prediction system and produces a 15 day outlook for the net basin supply of the Great Lakes. This system contributes to the HEPEX (hydrological ensemble prediction experiment) Great Lakes test bed project.
6.2.1.1 Planned Research activities in Nowcasting
Radar QC/QPE Project
64
Several improvements related to how radar data are quality controlled and used for quantitative precipitation estimation are planned during the next 4-5 years. These include improved quantification of systematic errors, improved identification of ground clutter through climatological ground clutter filters, improved identification of bad data, segregation of bad data from no data, application of dual-polarization analysis (including differential reflectivity, correlation coefficient, differential propagation phase and specific differential phase) for hydrometeor phase estimation, target shape identification and for identification of ground clutter, improved severe weather analysis algorithms, improved correction of attenuation, and others. There will be one radar software development cycle per year for the next several years, at the end of which the Canadian radar network data should be suitable for quantitative precipitation estimation. It will also be more suitable for incorporation into automated nowcasting algorithms for predicting the track of storms and precipitation regions. It has also been proposed that the Canadian radar network be polarized, with anticipated completion in 5-7 years.
Canadian HUB Airport Nowcasting System (CAN-Now)
Researchers are developing an advanced nowcasting system for use at each of the four major Canadian HUB airports including Toronto, Vancouver, Montreal and Calgary. The system is currently being trialed at Pearson airport in Toronto. This system utilizes advanced observations (direct and remote sensing) to make nowcasts out to 6-12 hours of all weather elements that impact on aviation operations including de-icing, runway condition, air traffic control, airline schedule planning, etc. Instrumentation being used includes wind profilers, microwave radiometers, vertical pointing radars, satellites, and surface-based instruments for measuring precipitation, visibility, winds, etc. Weather elements being predicted include temperature, pressure, precipitation, winds, lightning, frost, freezing precipitation, snow, icing aloft, wind shifts, turbulence, ceiling, visibility and convection. Nowcasting algorithms are integrated with numerical model output to assess relative skill and cross over times. The project includes verification of nowcasting and model-based algorithms. This project should continue for another 1-2 years after which operational implementation of high-value algorithms may occur at all of the HUB airports.
Science and Nowcasting for Olympics Weather – Vancouver 2010 (SNOW V10)
Scientists from several countries (led by Canada) have developed a plan to conduct a WMO endorsed World Weather Research Program (WWRP) Research Development Project (RDP) for the Vancouver 2010 Winter Olympic Games. The Science and Nowcasting for Olympics Weather for Vancouver 2010 project (SNOW V10) will focus on science issues and demonstration of leading edge techniques for nowcasting (forecasting from 0 to 6 hours) high impact winter weather phenomena in complex terrain. An extensive observations network has been installed in the mountains around the Whistler region to support this initiative. An advanced nowcasting system will be created by combining observationally-based and modeling systems from several countries. During the 2010 winter Olympics, the project will use this advanced
65
nowcasting system to provide supplementary information on visibility, precipitation, and winds, as well as undertaking an evaluation of the benefits. The information will be provided to Environment Canada operational forecasters in formats that are useful both for forecasting and for client decision making. Techniques developed during this project will be transferred into future nowcasting systems that are used in Canada.
Fog Research And Modeling Project (FRAM)
A Fog Research And Modeling (FRAM) project is 1) assessing the state of art scientific research on fog; 2) developing fog applications to weather forecasting and nowcasting; and 3) assessing future fog R&D activities. Four fog detection and nowcasting techniques have been developed including 1) satellite based detection algorithm; 2) numerical model-based parameterization of visibility 3) conditional persistence climatology and 4) rules-based nowcasting applications for fog. These techniques make extensive use of surface observations of visibility, precipitation, droplet, ice crystal and aerosol particle spectra, and other meteorological parameters taken from a suite of 18 specialized instruments. The measurements are used to better understand the relationships between liquid and ice fog conditions, visibility and precipitation and to develop improved detection and forecasting techniques. These techniques are being evaluated for possible implementation into the operational forecasting/nowcasting program. This project has been expanded to include Arctic ice fog detection and forecasting. Environment Canada researchers participated in a field measurement campaign in Barrow Alaska that was designed to measure characteristics of ice fog conditions. Another field project focused on freezing fog is currently ongoing based out of St. John’s Newfoundland.
Research Support Desk Project (RSD)
A research support desk (RSD) has been set up in close proximity to operational nowcasting/forecasting desks in two forecast regions. The Research Support Desk, located in the operations area, allows research meteorologists to interact with operational forecasters in real time. The RSD uses conceptual models relating to lake breezes, convective initiation and severe thunderstorm development plus high resolution models to come up with an 18 UTC mesoscale prognosis focused on severe weather potential. RSD products are available to all forecasters via an internal web page. The RSD allows scientists to work in close proximity to operational forecasters in order to better understand both the science gaps and the forecasting decision process. This allows scientists to demonstrate and develop improved nowcasting techniques that could be useful to the operational forecasters. During the next three years, the RSDs will continue to be used to test new techniques for nowcasting summer convective weather. They will also be expanded to test winter nowcasting/forecasting methods.
6.2.2 Planned Research Activities in Long range Forecasting
Improvement of monthly forecasting
66
Monthly forecasts of surface air temperature anomaly are issued twice a month at CMC that are based on the output of the seasonal forecasting system for the first month of integrations. The current CMC monthly forecast procedure has significant shortcomings. The most serious problem is the 12-hour lag used to initialize the ensemble members. For each of the 10 members, the integration starts from 1 to 5 days before the forecast. That means that some members have lost a large part of its skill even before the start of forecast. The loss of skill coming from the initial condition is likely to have a significant influence on the monthly mean forecast. An improved monthly forecasting system is to be sought that takes into account contributions from both the initial condition and SST anomaly.
Tropical-extratropical interactions
Improved long-range predictions of weather in the extratropics require an enhanced understanding of the tropical-extratropical interactions. On the one hand, it is of scientific and practical importance to understand how the tropical convection influences the middle- and high latitude weather. Conversely, an improved knowledge of the role of the extratropical eddies on tropical systems will help to simulate and predict tropical low-frequency variability, which in turn provides a useful signal for the extratropical weather.
The tropical convective activities associated with the MJO excite Rossby waves that propagate to the extratropical latitudes and influence the Canadian weather. The objective of this study is to identify possible links between extreme weather conditions in Canada and tropical organized convections. For example, heavy precipitation in British Columbia can be related to an intensified low pressure system in the northeast Pacific which can be a result of deepening of the Aleutian low by a tropical forcing associated with the MJO. What is the mechanism and how it is represented in a dynamical model is crucial to improve extended range forecasts of those extreme weather systems.
Stratosphere influence
Besides the tropics, another important source of skill for extended weather forecasts may come from the stratosphere. An interesting aspect is the downward propagation of the AO signal from the stratosphere, which may influence the AO variability and weather conditions on the ground up to two months after. It is planned that an assessment is done for GEM-strato and its impact on weather predictions beyond 10 days.
Improvement of seasonal forecasting
Improving seasonal forecast skill represents one of our ongoing efforts. On the one hand, the air-sea coupled general circulation models are being developed, that will eventually replace the current seasonal forecast models (see the next paragraph and 4.7.2). On the other hand, more studies are to be conducted on improving our understanding of the atmospheric processes that control the atmospheric variability on
67
a seasonal time scale, especially those related to surface air temperature and precipitation anomalies in Canada. More studies on post-processing techniques are to be explored that would provide an efficient way to improve seasonal forecast skill. Novel approaches to improve the forecast skill without dramatically increasing computation are also planned to be tested.
Environment Canada (EC), Fisheries and Oceans Canada (DFO), and the Department of National Defence (DND) are implementing an operational global coupled atmosphere-ocean-ice data assimilation and prediction system that can ingest in-situ Argo float data and satellite observations such as sea surface height and temperature. With the participation of Mercator-Ocean (France), the initial resources of this new inter-agency initiative, called the Canadian Operational Network of Coupled Environmental PredicTion Systems (CONCEPTS), are being directed towards three inter-related activities: 1) an operational activity based on coupling the Canadian atmospheric GEM model with the Mercator system; 2) a research and development (R&D) activity consisting of government and academic research networks to develop and maintain a system tailored to Canadian needs in the longer term; and 3) a products activity to identify, develop and disseminate relevant products and outputs. Operational activity is being built upon existing EC infrastructure with R&D activity enhanced through a Global Ocean-Atmosphere Prediction and Predictability (GOAPP) research network funded by the Canadian Foundation for Climate and Atmospheric Sciences. As mentioned above, the one-tier coupled forecast system that emerges from this activity is expected to eventually replace the current seasonal forecast models.
GEM-LAM for climate applications
At RPN, running the GEM model in climate mode has become standard procedure in model development (e.g. generation of model climatology; evaluation of model stability; impact of changes in physical parameterizations and in grid configurations; etc.). A library of subroutines and scripts, adapted for climate simulations/diagnostics and named GEMCLIM, was created to centralize the access to and the management of the code required to run the GEM model in climate mode. The automation of diagnostics in GEMCLIM facilitates the participation of GEM users in various projects and collaborations. According to the plans of the Canadian Regional Climate Modelling and Diagnostics (CRCMD) Network, GEMCLIM will provide the dynamical core for the next Canadian Regional Climate model, CRCM5 (Zadra et al. 2008). A recent version of GEMCLIM model has been installed at Université du Québec à Montréal (UQAM) and at the Ouranos consortium. Preliminary tests were performed and the output from GEMCLIM simulations is providing material for research projects of collaborators, research assistants, post-docs and students. Various climate-like simulations of the GEM model have been used in (inter-)comparison projects such as ICTS (Inter-Continental Transferability Study) and GPCI (GCSS/WGNE Pacific Cross-section Intercomparison), SHEBA (Surface Heat Budget of the Arctic Ocean). The CCCma physics package is currently being installed in GEMCLIM.
68
7.0References
Aparicio, J., and G. Deblonde, 2007: Impact of the assimilation of CHAMP refractivity profiles on Environment Canada global forecasts. Monthly Weather Review, 136(1), 257-275.
Aparicio, J., G. Deblonde, L. Garand and S. Laroche, 2009: The signature of the atmospheric compressibility factor in COSMIC< CHAMP and GRACE radio occultation data. To appear in JGR Atmos.
Balsamo, G., J.-F. Mahfouf, S. Bélair and G. Deblonde, 2006: A global root-zone soil moisture analysis using simulated L-band brightness temperature in preparation for the Hydros satellite mission. Journal of Hydrometeorology, 7 (5), 1126-1146.
Bélair, S., J. Mailhot, A. Lemonsu, M. Benjamin, F. Chagnon, G. Morneau, and R. Hogue, 2006: The Montréal Urban Snow Experiments (MUSE). IAUC (International Association for Urban Climate) Newsletter, 16, 9-10. (Available online at http://www.urban-climate.org)
Bélair, S., J. Mailhot, J.W. Strapp, J.I. MacPherson, 1999: An examination of local versus nonlocal aspects of a TKE-based boundary layer scheme in clear convective conditions. J. Appl. Met., 38, 1499-1518.
Bélair, S., L.-P. Crevier, J. Mailhot, B. Bilodeau, and Y. Delage, 2003a: Operational implementation of the ISBA land surface scheme in the Canadian regional weather forecast model. Part I: Warm season results. J. Hydromet., 4, 352-370.
Bélair, S., R. Brown, J. Mailhot, B. Bilodeau, and L.-P. Crevier, 2003b: Operational implementation of the ISBA land surface scheme in the Canadian regional weather forecast model. Part II: Cold season results. J. Hydromet., 4, 371-386.
Bélair, S., J. Mailhot, C. Girard, and P. Vaillancourt, 2005: Boundary-layer and shallow cumulus clouds in a medium-range forecast of a large-scale weather system. Mon.Wea. Rev., 133, 1938-1960.
Bélair, S., J. Mailhot, A. Lemonsu, M. Benjamin, F. Chagnon, G. Morneau, and R. Hogue, 2006: The Montréal Urban Snow Experiments (MUSE). IAUC (International Association for Urban Climate) Newsletter, 16, 9-10. (Available online at http://www.urban-climate.org)
Bélair, S., M. Roch, A-M. Leduc, P.A. Vaillancourt, S. Laroche, and J. Mailhot, 2009: Medium-range quantitative precipitation forecasts from Canada’s new 33-km deterministic global operational system. Wea. Forecasting, In press.
Boer, G.J. and K. Hamilton, 2008: QBO influence on extratropical predictive skill. Climate Dynamics. doi:10.1007/s00382-008-0379-5
Boer, G.J., 2008: Climate trends in seasonal forecasts. Submitted to Atmos-Ocean.
Bougeault, P., and P. Lacarrère, 1989: Parameterization of orography-induced turbulence in a mesobeta-scale model. Mon. Wea. Rev., 117-1872-1890.
Bouttier, F., J.-F. Mahfouf and J. Noilhan, 1993: Sequential asimilation of soil moisture from atmospheric low-level parameters. Part I: Sensitivity and calibration studies. J. Appl. Meteor., 32, 1335-1351.
Brasnett, B. 1997: A global analysis of sea surface temperature for numerical weather prediction. J. Atmos. Oceanic Technol., 14, 925-937.
Brasnett, B. 1999: A global analysis of Snow Depth for Numerical Weather Prediction. J. Appl. Meteor., 38, 726-740.
Benoît, R., J. Côté and J. Mailhot, 1989: Inclusion of a TKE boundary layer parameterization in the Canadian regional finite-element model. Mon. Wea. Rev., 117, 1726-1750.
Bourgouin, P., 2000: A Method to Determine Precipitation Types. Wea. Forecasting, 15, 583-592.
Brunet, N. and N. Yacowar, 1982 : Forecasts of maximum and minimum temperatures by statistical methods. CMC Technical Document, No. 18.
Brunet, N., 1987 : Development of a perfect prog system for spot time temperature forecasts. CMC Technical Document, No. 30.
Buehner, M., 2005: Ensemble-derived stationary and flow-dependent background error covariances: Evaluation in a quasi-operational setting for NWP. QJRMS, 131, 1013-1044.
Buehner, M., P. Gauthier and Z. Liu, 2005: Evaluation of new estimates of background and observation error covariances for variational assimilation. Quart. J. Roy. Meteor. Soc., 131, 3373-3383.
Buizza R., M. Miller, and T. N. Palmer, 1999: Stochastic representation of model uncertainties in the ECMWF ensemble prediction system. Quart. J. Roy. Meteor. Soc., 125, 2887–2908.
Burlaud, C., G. Deblonde, and J.-F. Mahfouf, 2007: Simulations of satellite passive microwave observations in rainy atmospheres at the Meteorological Service of Canada. IEEE Trans. on Geoscience and Remote Sensing. In Press.
Burrows, R. B., M. Vallée, D. I. Wardle, J. B. Kerr, L. J. Wilson and D. W. Tarasick, 1994 : The Canadian operational procedure for forecasting total ozone and UV radiation. Met. Apps., 1, 247-265.
Candille, G., C. Côté, P.L. Houtekamer and G. Pellerin, 2007, Verification of an ensemble prediction system against observations, Mon. Wea. Rev., In press.
Choisnard J., S. Laroche (2008), Properties of variational data assimilation for synthetic aperture radar wind retrieval, J. Geophys. Res., 113, C05006, doi:10.1029/2007JC004534
70
Côté, J., 1997: Variable Resolution Techniques for Weather Prediction. Meteorology and Atmospheric Physics, 63, 31-38.
Côté, J., S. Gravel, A. Méthot, A. Patoine, M. Roch and A. Staniforth, 1998a: The Operational CMC-MRB Global Environmental Multiscale (GEM) Model: Part I - Design Considerations and Formulation, Mon. Wea. Rev., 126, 1373-1395.
Côté, J., J.-G. Desmarais, S. Gravel, A. Méthot, A. Patoine, M. Roch and A. Staniforth, 1998b: The Operational CMC-MRB Global Environmental Multiscale (GEM) Model: Part II - Results, Mon. Wea. Rev., 126, 1397-1418.
Danielson R. E., M. Dowd, H. Ritchie (2008), Objective analysis of marine winds with the benefit of the Radarsat-1 synthetic aperture radar: A nonlinear regression framework, J. Geophys. Res., 113, C05019, doi:10.1029/2007JC004413.
D’Amours, R. and A. Malo, 2004: A Zeroth Order Lagrangian Particle Dispersion Model: MLDP0, Internal Report, Canadian Meteorological Centre, Environmental Emergency Response Section, 18 pp.
Deardorff, J. W., 1978: Efficient prediction of ground surface temperature and moisture with inclusion of a layer of vegetation. J. Geophy. Res., 83, 1889-1903.
Deblonde, G., J.-F. Mahfouf, B. Bilodeau, and D. Anselmo, 2006: One-dimensional variational assimilation of SSM/I observations in rainy atmospheres at MSC, Monthly Weather Review, 135, 152-172.
Delage, Y., 1988a: The position of the lowest levels in the boundary layer of atmospheric circulation models. Atmos.-Ocean, 26, 329-340.
Delage, Y., 1988b: A parameterization of the stable atmospheric boundary layer. Boundary-Layer Meteor., 43, 365-381.
Derome, J., G. Brunet, A. Plante, N. Gagnon, G. J. Boer, F. W. Zwiers, S. J. Lambert, J. Sheng and H. Ritchie, 2001: Seasonal Predictions Based on Two Dynamical Models, Atmos. Ocean , 39, 485-501.
Ellrod, G. P., 1989: An index for clear air turbulence based on horizontal deformation and vertical wind shear. Preprints of the Third International Conference on the Aviation Weather System, Anaheim, California.
Fillion, L., H. L. Mitchell, H. Ritchie and A. Staniforth, 1995: The impact of a digital filter finalization technique in a global data assimilation system, Tellus, 47A, 304-323
Fillion, L., M. Tanguay, E. Lapalme, B. Denis, Z. Liu, N. Ek, M. Desgagne, V. Lee and S. Pellerin, 2007: Case Dependent Implicit Normal Mode Balance Operators. Workshop Proceedings: ECMWF Workshop on Flow-dependent Aspects of Data Assimilation. 11-13 June 2007. [ECMWF, Shinfield Park, Reading, Berkshire, RG2 9AX, England]. http://www.ecmwf.int/publications
Flesch, T. K., J. D. Wilson and B. P. Crenna, , 2002: MLCD: A Short-Range Atmospheric Dispersion Model for Emergency Response, Contract Report to the Canadian
71
Meteorological Centre by Department of Earth and Atmospheric Sciences, University of Alberta.
Flesch, T. K., R. D'Amours, C. J. Mooney and J. D. Wilson, , 2004: MLDP: A Long-Range Lagrangian Stochastic Dispersion Model, Internal report in collaboration with the Canadian Meteorological Centre and the Department of Earth and Atmospheric Sciences from University of Alberta.
Garand, L., 1983: Some improvements and complements to the infrared emissivity algorithm including a parameterization of the absorption in the continuum region, J. Atmos. Sci., 40, 230-244.
Garand, L., and J. Mailhot, 1990: The influence of infrared radiation on numerical weather forecasts. Preprints 7th Conference on Atmospheric Radiation, July 23-27, 1990, San Francisco, California.
Gauthier, P., C. Charette, L. Fillion, P. Koclas and S. Laroche 1999: Implementation of a 3D Variational Data Assimilation System at the Canadian Meteorological Centre. Part I: The Global Analysis, Atmos.-Ocean, 37, 103-156.
Gauthier, P., M. Tanguay, S. Laroche, S. Pellerin, and J. Morneau, 2007. Extension of 3D-Var to 4D-Var: Implementation of 4D-Var at the Meteorological Service of Canada. Mon.Wea.Rev.,135, 2339-2354.
Heilliette, S., and L. Garand, 2007, A practical approach for the assimilation of cloudy infrared radiances and its evaluation using AIRS simulated obervations, Atmosphere-Ocean, 45 (4), pp 211-225.Houtekamer, P.L., Lefaivre L., Derome J., Ritchie H. and Mitchell, H.L., 1996: A system
simulation approach to ensemble prediction, Mon. Wea. Rev., 124, 1225-1242.
Houtekamer, P. L., Herschel L. Mitchell, Gerard Pellerin, Mark Buehner, Martin Charron, Lubos Spacek, and Bjarne Hansen, 2005: Atmospheric Data Assimilation with an Ensemble Kalman Filter: Results with Real Observations, Mon. Wea. Rev., 133, pages 604-620.
Jia, X., J. Derome, and H. Lin, 2007, Comparison of the life cycles of the NAO using different definitions. Journal of Climate, 20, 5992-6011.
Jia, X., H. Lin, and J. Derome, 2008, The influence of tropical Pacific forcing on the Arctic Oscillation. Climate Dynamics, in press.
Kain, J. S. and J. M. Fritsch, 1990: A one-dimensional entraining / detraining plume model and its application in convective parameterization. J. Atmos. Sci., 47, 2784-2802.
Kain, J. S. and J. M. Fritsch, 1993: Convective parameterization for mesoscale models: The Kain-Fritsch scheme. The representation of cumulus convection in numerical models. Meteor. Monogr., 27, Amer. Meteor. Soc., 165-170.
72
Kharin et al., 2008: Skill assessment of seasonal hindcasts from the Canadian Historical Forecast Project (to be submitted).
Kleist, D.T., Parrish, D.F., Derber, J.C., Treadon, R., Errico, R.M., Yang, R. Mon. Wea. Rev. 2008 early online release, posted January 2008 DOI: 10.1175/2008MWR2623.1
Kong F. and M.K. Yau, 1997: An explicit approach to microphysics in MC2. Atmos.-Ocean, 35, 257-291.
Kouwen, N., 2006: WATFLOOD / WATROUTE Hydrological Model Routing & Flow Forecasting System. Department of Civil Engineering, University of Waterloo, Waterloo, Ontario, Canada. First Edition: March 1986, Last Revision: Nov. 2006.
Kuo, H. L., 1974: Further studies on the parameterization of the influence of cumulus convection on large-scale flow. J. Atmos. Sci., 31, 1232-1240.
Langland, R.H., and N. Baker, 2004: Estimation of observation impact using the NRL atmospheric variational data assimilation adjoint system. Tellus, 56, 189-201.
Laroche, S., P. Gauthier, J. St.James and J. Morneau, 1999: Implementation of a 3D Variational Data Assimilation System at the Canadian Meteorological Centre. Part II: The Regional Analysis, Atmos.-Ocean, 37, 281-307.
Laroche, S, P. Gauthier, M. Tanguay, S. Pellerin and J. Morneau, 2005: Evaluation of the operational 4D-Var at the Meteorological Service of Canada, Preprint of the 21st Conference on Numerical Weather Prediction. 1-5 August, 2005, Washington, DC.
Laroche, S., P. Gauthier, M. Tanguay, S. Pellerin and J. Morneau, 2007: Impact of the different components of 4D-Var on the global forecast system of the Meteorological Service of Canada. Mon. Wea. Rev., 135, 2355-2364.
Laroche, S. and R. Sarrazin, 2009a: Impact study with observations assimilated over North America and the North Pacific Ocean on the MSC global forecast system. Part I: Contribution of radiosonde, aircraft and satellite data. Submitted to Atmosphere-Ocean.
Laroche, S. and R. Sarrazin, 2009b: Impact study with observations assimilated over North America and the North Pacific Ocean on the MSC global forecast system. Part II: Sensitivity experiments. Submitted to Atmosphere-Ocean.
Lemonsu, A., S. Bélair, J. Mailhot, M. Benjamin, F. Chagnon, G. Morneau, B. Harvey, J. Voogt, and M. Jean, 2008a: Overview and first results of the Montréal Urban Snow Experiments (MUSE) 2005. J. Appl. Meteor., 47, 59-75.
Lemonsu, A., A. Leroux, S. Bélair, S. Trudel, and J. Mailhot, 2008b: A general methodology of urban cover classification for atmospheric modelling. J. Appl. Meteor., (submitted).
Li, J. and H. W. Barker, 2005: A radiation algorithm with correlated k-distribution. Part I: local thermal equilibrium. J. Atmos. Sci., 62, 286-309.
73
Li, X., M. Charron, L. Spacek, and G. Candille, 2008: A regional ensemble prediction system based on moist targeted singular vectors and stochastic parameter perturbations. Mon. Wea. Rev., 136, 443–462
Lott, F., and M. Miller, 1997: A new sub-grid scale orographic drag parameterization; its testing in the ECMWF model. Quart. J. Roy. Meteor. Soc., 123, 101-127.
Lin, H ., G. B runet and J. Derome, 2007a, Intra seasonal variability in a dry atmospheric model. J. Atmos. Sci., 64, 2422-2441.
Lin, H., J. Derome and G. Brunet, 2007b, The nonlinear transient atmospheric response to tropical forcing. Journal of Climate, 20, 5642-5665.
Lin, H., G. Brunet and J. Derome, 2008a, Seasonal forecasts of Canadian winter precipitation by post-processing GCM integrations. Mon. Wea. Rev., 136, 769-783.
Lin, H., G. Brunet, and J. Derome, 2008b, Forecast skill of the Madden-Julian Oscillation in two Canadian atmospheric models. Monthly Weather Review, in press.
Macpherson, S.R., G. Deblonde, J.M. Aparicio and B. Casati. 2008. Impact of NOAA ground-based GPS observations on the Canadian regional analysis and forecast system. Monthly Weather Review. 136(7),2727-2746.
Mailhot, J., S. Bélair, A. Lemonsu, L. Tong, A. Leroux, N. Benbouta, and R. Hogue, 2006: Urban modeling at the Meteorological Service of Canada. IAUC (International Association for Urban Climate) Newsletter, 17, 13-16. (Available online at http://www.urban-climate.org)
Mailhot, J. et al, 2006: The 15-km Version of the Canadian Regional Forecast System. Atmos.-Ocean, 44, 133-149.
Mailhot, J., and S. Bélair, 2002: An examination of a unified cloudiness-turbulence scheme with various types of cloudy boundary layers. Preprints, 15th Symposium on Boundary Layer and Turbulence, 15-19 July, 2002, Wageningen, Netherlands, 215-218.
McNally, A.P. "ECMWF Update: AIRS and IASI”. Data AIRS science meeting. October 14-17 2008, Pasadena, Ca
Milbrandt, J. A. and M. K. Yau, 2005a: A multimoment bulk microphysics parameterization. Part I: Analysis of the role of the spectral shape parameter. J. Atmos. Sci., 62, 3051-3064.
Milbrandt, J. A. and M. K. Yau, 2005b: A multimoment bulk microphysics parameterization. Part II: A proposed three-moment closure and scheme description. J. Atmos. Sci., 62, 3065-3081.
McFarlane, N.A., 1987 : The effect of orographically excited gravity wave drag on the general circulation of the lower stratosphere and troposhere. J. Atmos. Sci., 44, 1775-1800.
74
McFarlane, N.A., C. Girard and D.W. Shantz, 1987 : Reduction of systematic errors in NWP and General Circulation models by parameterized gravity wave drag. Short and Medium-Range Numerical Weather Prediction, Collection of Papers Presented at the WMO/IUGG NWP Symposium, 4-8 August 1986, Tokyo, 713-728.
McFarlane, N.A., G. J. Boer, J.-P. Blanchet and M. Lazare, 1992: The Canadian Climate Centre second generation circulation model and its equilibrium climate. J. Climate, 5, 1013-1044.
McFarlane, N.A., J. F. Scinocca, M. Lazare, R. Harvey, D. Verseghy, and J. Li, 2005: The CCCma third generation atmospheric general circulation model. CCCma Internal Rep., 25 pp.
Milbrandt, J.A. and M.K. Yau, 2005a: A multimoment bulk microphysics parameterization. Part I: Analysis of the role of the spectral shape parameter. J. Atmos. Sci., 62,3051-3064.
Milbrandt, J.A. and M.K. Yau, 2005b: A multimoment bulk microphysics parameterization. Part II: A proposed three-moment closure and scheme description. J. Atmos. Sci., 62,3051-3064.
Noilhan, J. and S. Planton, 1989: A simple parameterization of land surface processes for meteorological models. Mon. Wea. Rev., 117, 536-549
Pellerin G., L. Lefaivre, P.L. Houtekamer, and C. Girard, 2003: Increasing the horizontal resolution of ensemble forecasts at CMC. Nonlinear Proc. Geophys., 10, 463-488
Polavarapu, S., T. G. Shepherd, Y. Rochon and S. Ren, 2005: Some challenges of middle atmosphere data assimilation. Q. J. Roy. Meteor. Soc., 131, 3513-3527.
Pudykiewicz, J. 1989: Simulation of the Chernobyl dispersion with a 3-D hemispheric tracer model. Tellus, 41B, 391-412.
Pudykiewicz, J., R. Benoit, and J. Mailhot, 1992: Inclusion and verification of a predictive cloud water scheme in a regional weather prediction model. Mon. Wea. Rev., 120, 612-626.
Pudykiewicz, J. A. and A. Kallaur, 1997: Semi-Lagrangian modelling of tropospheric ozone. Tellus, 49B, 231-248.
Raftery, A.E., T. Gneiting, F. Balabdaoui and M. Polokowski, 2005: Using a Bayesian Model Averaging to Calibrate Forecast Ensembles. Monthly Weather Review, 133, 1155-1174.
Ritchie, H., 1987: Semi-Lagrangian advection on a Gaussian grid. Mon. Wea. Rev., 115, 608-619.
Ritchie, H., 1991: Application of the semi-Lagrangian method to a multilevel spectral primitive-equation model. Quart. J. Roy. Meteor. Soc., 117, 91-106.
Ritchie, H., and C. Beaudoin, 1994: Approximation and sensitivity experiments with a baraclinic semi-Lagrangian spectral model. Mon. Wea. Rev., 122, 2391-2399.
75
Shabbar, A. and A. G. Barnston, 1996: Skill of Seasonal Climate Forecasts in Canada Using Canonical Correlation Analysis. Mon. Wea. Rev., 124, 2370-2385.
Shutts, G. 2005: A kinetic energy backscatter algorithm for use in ensemble prediction systems, Q.J.R.Meteorol. Soc. 131, 3079-310
Soulis, E.D., K.R. Snelgrove, N. Kouwen, F. Seglenieks and D. Verseghy, 2000: Towards Closing the Vertical Water Balance in Canadian Atmospheric Models: Coupling of the Land Surface Scheme CLASS with the Distributed Hydrological Model WATFLOOD. Atmosphere-Ocean 38(1):251-269.
Sparks, R. S. J., M. I. Bursik, S. N. Carey, J. S. Gilbert, L. S. Glaze, H. Sigurdsson, A. W. Woods, 1997: Volcanic Plumes, John Wiley and Sons, New York, 574 pp.
Sundqvist, H., E. Berge and J. E. Kristjansson, 1989: Condensation and cloud parameterization studies with a mesoscale numerical weather prediction model. Mon. Wea. Rev., 117, 1641-1657.
T.E. Nordeng, G. Brunet and J. Caughey, 2007: Improvements of weather forecasts in polar regions, WMO Bulletin, 56 (4), 250-256.
Tang Y., H. Lin, J. Derome, and M. K. Tippett, 2007, A predictability measure applied to seasonal predictions for the Arctic Oscillation. Journal of Climate, 20, 4733-4750.
Tang, Y., H. Lin, and A. M. Moore, 2008, Measuring the potential predictability of ensemble climate predictions. J. Geophys. Res., 113, D04108, doi:10.1029/2007JD008804.
Tremblay A., A. Glazer, W. Szyrmer, G. Isaac and I. Zawadzki, 1995: Forecasting of supercooled clouds. Mon. Wea. Rev., 123, 2098-2113.
Verret, R., 1987: Development of a perfect prog system for forecast of probability of precipitation and sky cover. CMC Technical Document, 29, 28 pp.
Verret, R., 1988: Postprocessing of statistical weather elements forecasts. CMC Monthly Review, 7, 5, 2-16.
Verret R., 1989: A statistical forecasting system with auto-correction error feedback. Preprints, 11th Conference on Probability and Statistics, Oct. 1989, Monterey, California, 88-92.
Verret, R., G. Babin, D. Vigneux, R. Parent and J. Marcoux, 1993: SCRIBE: An Interactive System for Composition of Meteorological Forecasts. Preprints, 13th AMS Conference on Weather Analysis and Forecasting, August 2-6, 1993, Vienna, Virginia, 213-216.
Verret, R., G. Babin, D. Vigneux, J. Marcoux, J. Boulais, R. Parent, S. Payer and F. Petrucci, 1995: SCRIBE an interactive system for composition of meteorological forecasts. Preprints 11th International Conference on Interactive Information and Processing Systems for Meteorology, Oceanography and Hydrology, January 15-20, 1995, Dallas, Texas, 56-61.
76
Verret, R., D. Vigneux, J. Marcoux, R. Parent, F. Petrucci, C. Landry, L. Pelletier and G. Hardy, 1997: SCRIBE 3.0 a product generator. Preprints 13th International Conference on Interactive Information and Processing Systems for Meteorology, Oceanography and Hydrology, February 2-7, 1997, Long Beach, California, 392-395.
Verret R., A. Bergeron, L. Lefaivre and A. Plante, 1998: Surface temperature anomaly forecasts over periods ranging from five to ninety days. Preprints 14th Conference on Probability and Statistics in the Atmospheric Sciences, January 11-16, 1998, Phoenix, Arizona.
Wilson, L. J. and M. Vallée, 2001: The Canadian Updateable Model Output Statistics (UMOS) System: Design and Development Tests, Wea. Forecasting, 17, 206–222.
Wilson, L. J. and M. Vallée, 2002: The Canadian Updateable Model Output Statistics (UMOS) System: Validation against Perfect Prog, Wea. Forecasting, 18, 288–302.
Wilson L. J., A. J. Raftery, S. Beauregard and R. Verret, 2005: Calibrated Surface Temperature Forecasts from the Canadian Ensemble Prediction System Using Bayesian Model Averaging. Submitted to Monthly Weather Review.
Yingxin Gu, S. Bélair, J.-F. Mahfouf, and G. Deblonde, 2006: A simple data assimilation technique for vegetation leaf area index using MODIS data. Remote Sensing of Environment, 104, 283-296.
Yu, W., L. Garand and A. Dastoor, 1997: Evaluation of model clouds and radiation at 100 km scale using GOES data, Tellus, 49A, 246-262.
Zadra, A., M. Roch, S. Laroche and M. Charron, 2003: The Subgrid scale Orographic Blocking Parameterization of the GEM Model, Atmos. Ocean, 41, 151-170.
Zadra, A., D. Caya, J. Côté, B. Dugas, C. Jones, R. Laprise, K. Winger and L.-P. Caron, 2008: The next Canadian Regional Climate Model. To appear in Physics in Canada, Special Issue on Fast Computing.