Canada’s most international bank Annual and special meeting of shareholders April 9, 2015 YOUR VOTE IS IMPORTANT Please take some time to read this management proxy circular for important information about the business of the meeting and to learn more about Scotiabank. Management proxy circular
Transcript
Canada’s most international bank
Annual and special meeting of shareholders
April 9, 2015
YOUR VOTE IS IMPORTANT
Please take some time to read this management proxy circular for important information about the business of the meeting and to learn more about Scotiabank.
Managementproxy circular
Scotiabank welcomed its first customersover 180 years ago.
Now we have more than 21 millioncustomers in over 55 countries and weare Canada’s most international bank.
Notice of annual and specialmeeting of common shareholdersof The Bank of Nova ScotiaWHEN WHERE
Thursday, April 9, 2015 Shaw Centre9:30 a.m. (local time) 55 Colonel By Drive
Ottawa, Ontario K1N 9J2
AT THE MEETING YOU WILL BE ASKED TO:1. Receive our financial statements for the year ended October 31, 2014 and the
auditors’ report on the statements2. Elect directors3. Appoint auditors4. Confirm, by special resolution, an amendment to By-law No. 1 regarding directors’
compensation (see the management proxy circular for the special resolution)5. Confirm administrative amendments to By-law No. 1 (see the management proxy
circular for the ordinary resolution)6. Vote on an advisory resolution on our approach to executive compensation7. Vote on the shareholder proposals set out in Appendix A to the management
proxy circular8. Consider any other business that may properly come before the meeting
You can read about each item of business beginning on page 4 of the managementproxy circular, which describes the meeting, who can vote and how to vote.
Holders of common shares on February 10, 2015, the record date, are eligible to voteat the meeting (subject to Bank Act (Canada) restrictions). There were 1,209,613,110common shares outstanding on this date.
By order of the board,
Deborah M. AlexanderExecutive Vice President, General Counsel and Secretary
Toronto, Ontario, Canada
February 10, 2015
YOUR VOTE ISIMPORTANT
As a Scotiabankshareholder, it is importantto vote your shares atthe upcoming meeting.Detailed voting instructionsfor registered and non-registered shareholdersbegin on page 8 of themanagement proxy circular.
If you cannot attend themeeting, you shouldcomplete, sign and returnyour proxy or votinginstruction form to voteyour shares. Your votemust be received byour transfer agent,Computershare TrustCompany of Canada, by5 p.m. (Eastern) onApril 8, 2015.
We will have livecoverage of the meetingon the investor relationssection of our website(www.scotiabank.com).
Welcome to our 183rdshareholder meeting
Thomas O’NeillChairman of Scotiabank’s Board of Directors
Brian PorterPresident and Chief Executive Officer
Dear fellow shareholders,
Please join us at Scotiabank’s annual and special meeting in Ottawa on April 9, 2015. We will becovering several important items of business, so please take some time to read this managementproxy circular and vote your shares.
FOCUS ON SHAREHOLDER VALUE
Your board and management worked hard this year as the bank increased its focus on customers,leadership and being better organized to serve customers, while reducing structural costs. Theseare important steps to becoming an even better bank because they drive stronger growth andhave the greatest impact on shareholder value.
EFFECTIVE GOVERNANCE
Effective governance plays a critical role in the proper functioning of the banking sector and theglobal economy. The World Economic Forum continues to recognize Canada’s banks as thesoundest in the world, a recognition that we take seriously.
Good governance also underpins strong corporate performance – you can read about the bank’s2014 performance and how that affected decisions on executive pay beginning on page 41.
STRONG LEADERSHIP
Strong leadership is key to building on our solid foundation, and this year we re-shapedour management team to make sure the bank has the right people in the right positionsto lead our future growth. We also affirmed our commitment to diversity by enhancingour leadership pool.
We believe that a strong board must be independent and have the right balance ofqualified people by gender, age, background and geography. More than 30% of thisyear’s nominated directors are women.
We welcome two new directors who add tremendous value: Nora Aufreiter has extensiveindustry knowledge acquired through a long career in international managementconsulting with consumer-facing industries, and William Fatt brings extensiveinternational, finance, investment and capital markets experience. C.J. Chen,David Dodge and John Kerr are retiring from the board after many years of valuableservice. The board and the bank have greatly benefited from their service as directors, andwe thank C.J., David and John for their contributions and insights.
MOVING AHEAD
The board and management are excited about Scotiabank’s future and we thank you, ourshareholders, for your confidence and continued support.
We look forward to seeing you at our meeting on April 9.
You have received this management proxy circularbecause you owned Scotiabank common shares as ofthe close of business on February 10, 2015 (the recorddate), and are entitled to vote at our annual andspecial meeting.
Management is soliciting your proxy for the shareholdermeeting on April 9, 2015.
This document tells you about the meeting, governance andexecutive compensation at Scotiabank. We have organizedit into three sections to make it easy to find what you arelooking for, and to help you vote with confidence.
We pay the cost of proxy solicitation for all registered andnon-registered shareholders. We are soliciting proxies mainlyby mail, but you may also be contacted by phone or inperson by employees of Scotiabank or Computershare TrustCompany of Canada, our transfer agent. We mayalso engage solicitation agents at a nominal cost.
Unless indicated otherwise, information in this managementproxy circular (circular) is as of February 5, 2015 and all dollaramounts are in Canadian dollars.
1ABOUT THE
MEETINGRead about the items of
business and howto vote your shares
2GOVERNANCELearn about our
governance practicesand our board
3EXECUTIVE
COMPENSATIONFind out what we paid
our senior executivesfor 2014 and why
In this document:
• we, us, our, the bankand Scotiabank meanThe Bank of Nova Scotia
• you and your meanholders of our commonshares
• common shares andshares mean the bank’scommon shares
FOR MORE INFORMATION
You can find financial information about Scotiabank in our 2014 financial statements andmanagement’s discussion and analysis (MD&A). Financial information and other informationabout Scotiabank, including our annual information form (AIF) and quarterly financialstatements are available on our website (www.scotiabank.com), SEDAR (www.sedar.com), oron the U.S. Securities and Exchange Commission (SEC) website (www.sec.gov).
Copies of these documents, this circular and any document incorporated by reference, areavailable for free by writing to our Secretary at:
Secretary of The Bank of Nova ScotiaScotia Plaza, 44 King Street WestToronto, OntarioCanada M5H 1H1
You can also communicate with our board of directors by writing to the Chairman ofthe Board at the same address.
Management proxy circular 3
1 About the meeting
Business of the meeting
1. RECEIVE FINANCIAL STATEMENTS
Our consolidated financial statements and MD&A for the year ended October 31, 2014,together with the auditors’ report on those statements, will be presented at the meeting. Youwill find these documents in our annual report which is available on our website.
2. ELECT DIRECTORS
You will elect 13 directors to serve on our board until the close of the next annual meetingor until their successors are elected or appointed. You can find information about eachnominated director beginning on page 11 and our majority voting policy on page 12.
The boardrecommends you vote
foreach
nominated director
The boardrecommends you vote
forKPMG LLP
as our independent auditors
3. APPOINT AUDITORS
You will vote on appointing the independent auditors. The board has assessed theperformance and independence of KPMG LLP (KPMG) and recommends that KPMG bere-appointed as the shareholders’ auditors until the close of the next annual meeting. KPMGhas served continuously as one of our auditors since 1992, and as our sole auditor sinceMarch 2006. A representative of KPMG has been invited to the meeting.
Auditors’ fees
The table below lists the services KPMG provides and the fees we paid to them for the fiscalyears ended October 31, 2014 and 2013. The audit and conduct review committee canpre-approve services as long as they are within the scope of the policies and proceduresapproved by the committee.
$ millions 2014 2013
Audit services $24.6 $24.4Audit services generally relate to the statutory audits and review of financial statements, regulatoryrequired attestation reports, as well as services associated with registration statements, prospectuses,periodic reports and other documents filed with securities regulatory bodies or other documents issued inconnection with securities offerings.
Audit-related services 0.6 1.2Audit-related services include attest services required by regulatory bodies not directly linked to thefinancial statements, review of controls and procedures related to regulatory reporting, audits ofemployee benefit plans, special attest services not required by statute or regulation, but requested by aparty to a specific transaction, independent review of risk processes, consultation and training onaccounting and financial reporting and review of internal controls of the general ledger implemented athead office.
Tax services outside of the audit scope – 0.1Tax services outside of the audit scope relate primarily to specified review procedures required by local taxauthorities, attestation on tax returns of certain subsidiaries as required by local tax authorities, andreview to determine compliance with an agreement with the tax authorities.
Other non-audit services 0.7 0.4Other non-audit services are primarily for the review and translation of English language financialstatements into other languages and other services.
Total $25.9 $26.1
4 Scotiabank
ABO
UT
THE
MEETIN
G
4. CONFIRM, BY SPECIAL RESOLUTION, AN AMENDMENT TO BY-LAW NO. 1REGARDING DIRECTORS’ COMPENSATION
The Bank Act (Canada) (Bank Act) requires that our by-laws fix the maximum amount ofcompensation that can be paid to all directors for their services during a specific period.Section 3.13 of By-law No.1 fixed that amount at $3,500,000 in each fiscal year. Thisamount was confirmed by shareholders at our annual meeting on March 2, 2004.
The board has approved an amendment to Section 3.13 of By-law No. 1 to increase themaximum amount that can be paid to directors in each fiscal year to $5,000,000. If ourcommon shareholders confirm this special resolution, this amendment will take effect onMay 1, 2015.
Directors’ duties and responsibilities continue to expand and evolve with the growth andcomplexity of our business and the evolving regulatory environment. The proposed increaserecognizes that directors are spending an increasing amount of time on our affairs and thattheir duties as directors require a substantial commitment. Although the currentcompensation limit is adequate to accommodate the current number of directors and theproposed increases in retainers, the new maximum provides more flexibility in the boardsuccession process by allowing us to appoint new directors to the board before others retire.
In connection with the proposed increase in total director compensation, we are proposing anew flat fee structure for directors that caps fees and is simpler, more transparent and easierto administer (you can read about the proposed fee structure on page 21). The new feestructure will take effect on May 1, 2015 if shareholders confirm this special resolution.
You will be asked to vote on the following resolution:
Resolved, as a special resolution, that the amendment of Section 3.13 of By-law No. 1 todelete the reference to $3,500,000 and replace it with $5,000,000, is confirmed.
If passed, Section 3.13 will read as follows:
“3.13 Compensation – For each financial year, a sum not exceeding $5,000,000 may betaken by the Board from the funds of the Bank as remuneration for their services asDirectors, and the Directors may from time to time apportion the same among themselvesin such manner as they shall think fit. The Directors shall also be entitled to be reimbursedfor travelling and other expenses properly incurred by them in attending meetings of theBoard, or any Committee of the Board, or of Shareholders.”
The boardrecommends you vote
forthe confirmation of
an amendment toBy-law No. 1
The full text of our by-laws is available on SEDAR (www.sedar.com).
5. CONFIRM ADMINISTRATIVE AMENDMENTS TO BY-LAW No. 1
On January 27, 2015, the board passed a resolution amending certain provisions of thebank’s by-laws. These amendments are part of our continual review of best governancepractices.
Each of these proposed by-law changes require the confirmation of our commonshareholders by ordinary resolution. The changes to the by-laws are to: (1) increase theminimum quorum requirement for meetings of shareholders to shareholders representingat least 25% of the shares entitled to vote; (2) increase the minimum quorumrequirement for meetings of the board to a majority of directors; and (3) remove theChairman’s second or casting vote on tie votes at meetings of the board.
You will be asked to vote on the following resolution:
“Resolved, that the following amendments to By-law No. 1 of the bank are confirmed:
1. Section 2.03 of By-law No. 1 is amended by deleting the reference to ‘10%’ andreplacing it with ‘25%’, so that Section 2.03 shall read as follows:
The boardrecommends you vote
forthe confirmation of
the administrativeamendments to
By-law No. 1
Management proxy circular 5
‘2.03 Quorum – At any meeting of Shareholders, the holders, present in person orrepresented by proxyholders of at least 25% of the outstanding shares of the Bankentitled to be voted at the meeting shall constitute a quorum for the transaction ofbusiness. However, where the provisions relating to a class or series of shares otherwiseprovide for the quorum for meetings of the holders thereof, such provisions shall applyto meetings of such Shareholders.’
2. Section 3.07 of By-law No. 1 is amended by changing the words ‘5 Directors.’ to‘a majority of Directors.’, so that Section 3.07 shall read as follows:
‘3.07 Quorum – Subject to the Act, a quorum for the transaction of business at anymeeting of the Board shall consist of a majority of Directors.’
3. Section 3.08 of By-law No. 1 is amended by adding the word ‘not’ before the words‘be entitled’, so that Section 3.08 shall read as follows:
‘3.08 Board procedure – Subject to the Act, the Board shall have the power to regulateits procedure and shall designate a chair to preside at meetings of Directors. In the eventof an equality of votes on any question at a meeting of the Board, the chair of themeeting shall not be entitled to a second or casting vote.’”
The full text of our by-laws is available on SEDAR (www.sedar.com).
6. ADVISORY VOTE ON OUR APPROACH TO EXECUTIVE COMPENSATION
You can have a “say on pay” by participating in an advisory vote on our approach toexecutive compensation.
We have held this advisory vote every year since 2010 to give shareholders theopportunity to provide the board with important feedback. Last year, 93.7% voted forour approach to executive compensation, and shareholder support has been 92.6% orhigher each year.
Please see the human resources committee chair’s letter on page 41 for an overview ofexecutive compensation at Scotiabank in 2014. Our executive compensation programsupports our goal of delivering strong, consistent and predictable results to shareholdersover the longer term. Our practices meet the model policy on “say on pay” for boards ofdirectors developed by the Canadian Coalition for Good Governance (CCGG).
You will be asked to vote on the following advisory resolution:
Resolved, on an advisory basis and not to diminish the role and responsibilities of theBoard of Directors, that the shareholders accept the approach to executive compensationdisclosed in this management proxy circular delivered in advance of the 2015 annual andspecial meeting of shareholders of the Bank.
The boardrecommends you vote
forour approach to
executive compensation
This is an advisory vote, which means the results are not binding on the board. Thehuman resources committee and the board will, however, review the results whenconsidering future executive compensation decisions. If a significant number of sharesare voted against the advisory resolution, the human resources committee will reviewour approach to executive compensation in the context of any specific shareholderconcerns that have been identified and may make recommendations to the board. Wewill disclose the committee’s review process and the outcome of its review within sixmonths of the shareholder meeting and in any case not later than our next managementproxy circular.
The human resources committee and the board welcome questions and commentsabout executive compensation at Scotiabank. We maintain an open dialogue withshareholders, and consider all feedback. See the back cover for our contactinformation.
6 Scotiabank
ABO
UT
THE
MEETIN
G
7. SHAREHOLDER PROPOSALS
This year you will be asked to consider two proposals. You can read the proposals andthe board’s reasons for opposing them in Appendix A beginning on page 82.
The boardrecommends you voteagainst each proposal
The deadline for submitting proposals to be considered at next year’s annual meeting isNovember 11, 2015. Proposals should be sent to the Secretary of The Bank of NovaScotia, Scotia Plaza, 44 King Street West, Toronto, Ontario, Canada M5H 1H1.
SHAREHOLDER APPROVAL
Each of the items you are being asked to vote on requires the approval of a majority ofvotes cast in person or by proxy at the meeting, other than the:• election of directors, which is subject to our majority voting policy (see page 26)• confirmation of an amendment to By-law No. 1 regarding directors’ compensation,
which requires approval by at least two-thirds of the votes cast in person or by proxyat the meeting.
You (or your proxyholder) can vote as you wish on any other items of business properlybrought before the meeting (or a reconvened meeting if there is an adjournment). As ofthe date of this circular, we are not aware of other matters that will be brought beforethe meeting.
Management does not contemplate that any nominated director will be unable to serveas a director. If, however, it does occur for any reason during or prior to the meeting,the individuals named in your proxy form or voting instruction form as your proxyholdercan vote for another nominee at their discretion.
Management proxy circular 7
Information about voting
WHO CAN VOTE
You are entitled to one vote per common share held on February 10, 2015, the record date.
Shares beneficially owned by the following entities and persons cannot be voted (except incircumstances approved by the Minister of Finance):• the Government of Canada or any of its agencies• the government of a province or any of its agencies• the government of a foreign country or any political subdivision of a foreign country or any
of its agencies• any person who has acquired more than 10% of any class of shares of the bank.
Also, if a person, or an entity controlled by a person, beneficially owns shares that in total are morethan 20% of the eligible votes that may be cast, that person or entity may not vote any of the shares(unless permitted by the Minister of Finance).
Our directors and officers are not aware of any person or entity who beneficially owns, directly orindirectly, or exercises control or direction over, more than 10% of any class of our outstanding shares,as of the record date.
HOW TO VOTE
How you vote depends on whether you are a non-registered (beneficial) or registered shareholder. Youare a beneficial shareholder if the shares you own are registered for you in the name of anintermediary. You are a registered shareholder if the shares you own are registered directly in yourname. Your name will appear on your share certificate or a statement from a direct registration systemconfirming your shareholdings. You can vote in person or you can appoint someone to attend themeeting and vote your shares for you (called voting by proxy). Please read these instructions carefully.
Outstandingcommon shares
1,209,613,128 onFebruary 5, 2015,the date of this circular
Your intermediary has sent you a voting instructionform with this package. We may not have recordsof your shareholdings as a non-registeredshareholder, so you must follow the instructionsfrom your intermediary to vote.
We have sent you a proxy form with this package.A proxy is a document that authorizes someone elseto attend the meeting and vote for you.
If you want to come tothe meeting and votein person
Follow the instructions on the voting instructionform.
In most cases, you will simply print your name in thespace provided for appointing a proxyholder andreturn the voting instruction form as instructed byyour intermediary. Your intermediary may also allowyou to do this online. Do not complete the votingsection of the voting instruction form, because youwill be voting at the meeting.
If the voting instruction form does not provide aspace for appointing a proxyholder, you may haveto indicate on the voting instruction form that youwish to attend the meeting. Follow the instructionson the voting instruction form to make this request,and your intermediary will send you a legal proxythat you must return to our transfer agent,Computershare Trust Company of Canada(Computershare).
Please register with Computershare when you arriveat the meeting.
Do not complete the proxy form or return it to us.Simply bring it with you to the meeting.
Please register with Computershare when you arriveat the meeting.
If you do not plan to attendthe meeting
Complete the voting instruction form and return itto your intermediary.
You can either mark your voting instructions on thevoting instruction form or you can appoint anotherperson (called a proxyholder) to attend the meetingand vote your shares for you.
Complete the proxy form and return it toComputershare.
You can either mark your voting instructions on theproxy form or you can appoint another person(called a proxyholder) to attend the meeting andvote your shares for you.
Returning the form The voting instruction form tells you how to returnit to your intermediary.
Remember that your intermediary must receive yourvoting instructions in sufficient time to act on them,generally one day before the proxy deadline below.
Computershare must receive your votinginstructions from your intermediary by no later thanthe proxy deadline, which is 5 p.m. (Eastern) onApril 8, 2015.
The enclosed proxy form tells you how to submityour voting instructions.
Computershare must receive your proxy, includingany amended proxy, by no later than the proxydeadline which is 5 p.m. (Eastern) on April 8, 2015.
You may return your proxy in one of the followingways:• by mail, in the envelope provided• by fax, to 1 (866) 249-7775 (if faxing within
Canada and the United States) or(416) 263-9524 (other countries)
• using the internet. Go to www.investorvote.comand follow the instructions online.
Changing your mind If you have provided voting instructions to yourintermediary and change your mind about how youwant to vote, or you decide to attend the meetingand vote in person, contact your intermediary tofind out what to do.
If your intermediary gives you the option of usingthe internet to provide your voting instructions, youcan also use the internet to change yourinstructions, as long as your intermediary receivesthe new instructions in enough time to act on thembefore the proxy deadline. Contact yourintermediary to confirm the deadline.
If you want to revoke your proxy, you must deliver asigned written notice specifying your instructions toone of the following:• our Secretary, by 5 p.m. (Eastern) on the last
business day before the meeting (or anyadjourned meeting reconvenes).Deliver to: The Bank of Nova Scotia ExecutiveOffices, 44 King Street West, Toronto, Ontario,Canada M5H 1H1Attention: Deborah M. Alexander, ExecutiveVice President, General Counsel and Secretary,Fax: (416) 866-5090
• Craig Thompson, Senior Vice President, AtlanticRegion, by 5 p.m. (Eastern) on the last businessday before the meeting (or any adjournedmeeting reconvenes).Deliver to: The Bank of Nova Scotia Head Office,1709 Hollis Street, Halifax, Nova Scotia, CanadaB3J 1W1Fax: 1 (877) 841-9920
• the Chairman of the meeting, before themeeting starts or any adjourned meetingreconvenes.
You can also revoke your proxy in any other waypermitted by law. You can change your votinginstructions by voting again using the internet orfax. Your voting instructions must be received byComputershare by the proxy deadline noted above,or by voting in person at the meeting.
Management proxy circular 9
How to vote by proxy
Appointing your proxyholderYour proxy form or voting instruction form names Thomas O’Neill or Brian Porter, each a director of thebank, as your proxyholder. You have the right to appoint someone else to represent you at themeeting. Simply print the person’s name in the blank space on the form or, if voting using theinternet, follow the instructions online. Your proxyholder does not have to be a shareholder of thebank. Your proxyholder must attend the meeting to vote for you.
We reserve the right to accept late proxies and to waive or extend the proxy deadline with or withoutnotice, but are under no obligation to accept or reject a late proxy.
How your proxyholder will voteYour proxyholder must vote according to the instructions you provided on your proxy form or votinginstruction form (for directors and the appointment of auditors, you may either vote for or withholdand for all other matters, except the shareholder proposals, you may vote for or against. Forshareholder proposals, you may either vote for, against or abstain). If you did not specify how youwant to vote, your proxyholder can vote your shares as he or she wishes. Your proxyholder willalso decide how to vote on any amendment or variation to any item of business in the notice ofmeeting or any new matters that are properly brought before the meeting, or any postponement oradjournment.
If you properly complete and return your proxy form or voting instruction form, but do notappoint a different proxyholder, and do not specify how you want to vote, Thomas O’Neill orBrian Porter will vote for you as follows:• for the election of the nominated directors to the board• for the appointment of the shareholders’ auditors• for the confirmation, by special resolution, of the amendment to By-law No. 1 regarding
directors’ compensation• for the confirmation of the administrative amendments to By-law No. 1• for the advisory resolution on our approach to executive compensation• against the shareholder proposals (see Appendix A beginning on page 82).
CONFIDENTIALITY
To keep voting confidential, Computershare counts all proxies. Computershare only discusses proxieswith us when legally necessary, when a shareholder clearly intends to communicate with management,or when there is a proxy contest.
VOTING RESULTS
We will file the voting results (including details about the percentage of support received for each itemof business) with securities regulators after the meeting and also post the results on our website.
QUESTIONS?
Please contact Computershare with any questions. See the back cover for their contact information.
10 Scotiabank
ABO
UT
THE
MEETIN
G
About the nominated directors
This year 13 directors are proposed for election to our board.
The director profiles, starting on the next page, tell you about each director’s skills,experience and other important information to consider, including how much equity theyown in Scotiabank and any other public company boards they sit on.
Just as important are the skills these directors have as a group. They have been selectedbased on their collective ability to contribute to the broad range of issues the boardconsiders when overseeing our business and affairs. You can learn more about ourexpectations for directors and how the board functions beginning on page 25.
INDEPENDENCE
12 of our 13 nominated directors are independent, and none of these directors have everserved as an executive of the bank. Having an independent board is one of the ways wemake sure the board is able to operate independently of management and make decisionsin the best interests of Scotiabank and our shareholders. Brian Porter is not independentbecause of his role as the bank’s President and Chief Executive Officer (President and CEO).
DIVERSITY
Each director has a wealth of experience in leadership and strategy development. Thecombination and diversity of their skills, experience, location and gender are key (you canread more about diversity on page 27).
Key skills and experience
12 of our 13nominated
directors areindependent
Accounting/Audit
Capital markets
23%
62%
Finance
Financial services
Governance
Human resources
Public policy
Risk management
54%
38%
62%
77%
85%
62%
Corporate social responsibility
38%
Geographic mix
Canada 69%U.S. 23%International 8%
Gender
Male 62%Female 38%
TENURE AND TERM LIMITS
Balancing the combination of longer serving directors with newer directors makessure the board has the insight of experience while also being exposed to freshperspectives. Our average board tenure is 6.2 years (you can read more abouttenure and term limits on page 32).
Tenure
0-5 years 54%6-10 years 23%11-15 years 15%
8%16-20 years
Management proxy circular 11
MAJORITY VOTING POLICY
A nominated director who receives more withheld than for votes must offer to resign from the boardfollowing the annual meeting. We introduced this policy in 2005 and it applies to all uncontestedelections (elections where the number of nominated directors is the same as the number of directors tobe elected). You can read about our majority voting policy on page 26.
DIRECTOR PROFILES
Each nominated director has provided the information about the Scotiabank shares they own orexercise control or direction over. This information, and the details about the director deferred shareunits (DDSUs) they hold, is as of October 31, 2014 unless otherwise indicated. The value of commonshares and DDSUs is calculated using $69.02 (the closing price of our common shares on the TorontoStock Exchange (TSX) on October 31, 2014) for 2014, and $63.39 (the closing price of our commonshares on the TSX on October 31, 2013) for 2013. The share ownership guidelines were amended infiscal 2014 and directors are required to hold $500,000 in Scotiabank equity (previously, therequirement was $450,000). We are proposing to raise this requirement to $600,000 in 2015 – youcan read more about share ownership on page 22. The multiples in the profiles below are based onthe ownership requirement in place for that year.
The attendance figures reflect the number of board and committee meetings held in fiscal 2014 andeach nominee’s attendance for the time they served as a director.
We have strengthenedour director shareownership requirements.See page 22 for details.
Thomas C. O’NeillToronto, Ontario, Canada
Director since 2008
Age 69
Not eligible forre-election in April 2019
Attended 2014annual meeting —received 96.9% votes for
Thomas O’Neill is Chairman of the Board of Scotiabank. He is the retiredChair of the Board of PwC Consulting. Mr. O’Neill was formerly ChiefExecutive Officer of PwC Consulting, Chief Operating Officer ofPricewaterhouseCoopers LLP, Global, Chief Executive Officer ofPricewaterhouseCoopers LLP, Canada, and Chair of the Board and ChiefExecutive Officer of Price Waterhouse Canada. He holds a Bachelor ofCommerce from Queen’s University and is a chartered accountant and aFellow of the Institute of Chartered Accountants of Ontario (CPA Ontario).In September 2013, Mr. O’Neill received the ICAO Award of OutstandingMerit from CPA Ontario, which is CPA Ontario’s highest honour.
Independent
Key skills and experienceAccounting/Audit
FinanceFinancial services
GovernanceRisk management
Designated auditcommittee financial expert
OVERALL BOARD AND COMMITTEE ATTENDANCE: 34 of 34 / 100%
Meeting attendance Committees Meeting attendance
Board (Chairman) 5 of 5 / 100% Audit and conduct review (chair) 4 of 4 / 100%Board 4 of 4 / 100% Audit and conduct review 3 of 3 / 100%
Corporate governance 2 of 2 / 100%Executive and risk 11 of 11 / 100%Human resources 5 of 5 / 100%
EQUITY OWNERSHIP Totalcommon shares
and DDSUsValue of
DDSUs
Value ofcommon shares
and DDSUs
Total value as amultiple of equityownership targetYear
Appointed to the board afterthe 2014 annual meeting
Nora Aufreiter is a corporate director and a former director and leader ofMcKinsey & Company’s Toronto office, an international managementconsulting firm. Throughout her 27 year career at McKinsey & Company,she worked extensively in Canada, the United States and internationallyserving her clients in consumer-facing industries, including retail, consumerand financial services, energy and the public sector. Ms. Aufreiter holds aB.A. (Honours) in business administration from the Ivey Business School atWestern University and an M.B.A. from Harvard Business School.
Independent
Key skills and experienceCapital markets
FinanceFinancial services
GovernanceHuman resources
OVERALL BOARD AND COMMITTEE ATTENDANCE: 5 of 5 / 100%
Meeting attendance Committees Meeting attendance
Board 3 of 3 / 100% Audit and conduct review 2 of 2 / 100%
EQUITY OWNERSHIP Totalcommon shares
and DDSUsValue of
DDSUs
Value ofcommon shares
and DDSUs
Total value as amultiple of equityownership targetYear
Commonshares DDSUs
2014 780 517 1,297 $35,683 $89,519 0.18x
OTHER PUBLIC COMPANY DIRECTORSHIPSDURING THE PAST FIVE YEARS Current board committee memberships
The Kroger Co. (2014 – present) Financial policy | Public responsibility
Guillermo E. BabatzMexico City, Mexico
Director since 2014
Age 46
Not eligible forre-election in April 2029
Attended 2014annual meeting —received 98.9% votes for
Guillermo Babatz is the Managing Partner of Atik Capital, S.C., an advisoryfirm that specializes in structuring financial solutions for its clients.Previously, he was the Executive Chairman of Comisión Nacional Bancaria yde Valores in Mexico from July 2007 to December 2012. Mr. Babatz holdsa B.A. (Economics) from the Instituto Tecnológico Autónomo de México(ITAM) in Mexico City, and a Ph.D. in Economics from Harvard University.
Independent
Key skills and experienceCapital markets
FinanceFinancial services
Public policyRisk management
Designated auditcommittee financial expert
OVERALL BOARD AND COMMITTEE ATTENDANCE: 18 of 18 / 100%
Meeting attendance Committees Meeting attendance
Board 8 of 8 / 100% Audit and conduct review 3 of 3 / 100%Executive and risk 7 of 7 / 100%
EQUITY OWNERSHIP Totalcommon shares
and DDSUsValue of
DDSUs
Value ofcommon shares
and DDSUs
Total value as amultiple of equityownership targetYear
Commonshares DDSUs
2014 0 1,114 1,114 $76,888 $76,888 0.15x
OTHER PUBLIC COMPANY DIRECTORSHIPSDURING THE PAST FIVE YEARS Current board committee memberships
Fibra MTY, S.A.P.I. de C.V. (2015 – present) Investment
Management proxy circular 13
Ronald A. BrennemanCalgary, Alberta, Canada
Director since 2000
Age 68
Not eligible forre-election in April 2017
Attended 2014annual meeting —received 96.3% votes for
Ronald Brenneman is a corporate director and was Executive Vice-Chairmanof Suncor Energy Inc. (an integrated energy company) from August 2009until February 2010. He was President and Chief Executive Officer ofPetro-Canada from January 2000 until August 2009. Mr. Brenneman holdsa B.Sc. (in chemical engineering) from the University of Toronto and aM.Sc. (in control systems) from the University of Manchester.
Independent
Key skills and experienceCapital markets
FinanceGovernance
Human resourcesRisk management
OVERALL BOARD AND COMMITTEE ATTENDANCE: 28 of 29 / 97%
Meeting attendance Committees Meeting attendance
Board 9 of 9 / 100% Executive and risk (chair) 9 of 10 / 90%Executive and risk 1 of 1 /100%Human resources 9 of 9 / 100%
EQUITY OWNERSHIP Totalcommon shares
and DDSUsValue of
DDSUs
Value ofcommon shares
and DDSUs
Total value as amultiple of equityownership targetYear
OTHER PUBLIC COMPANY DIRECTORSHIPSDURING THE PAST FIVE YEARS Current board committee memberships
BCE Inc. (2003 – present) Management resources and compensation (chair) | Pension fund
WestJet Airlines Ltd. (2009 – present) People and compensation | Safety, health and environment
Ithaca Energy Inc. (2010 – present) Corporate governance | Remuneration | Reserves
Charles H. Dallara, Ph.DOak Hill, Virginia, U.S.A.
Director since 2013
Age 66
Not eligible forre-election in April 2024
Did not attend the 2014annual meeting —received 98.7% votes for
Charles Dallara is the Executive Vice Chairman of the Board of Directors ofPartners Group Holding AG and Chairman of the Americas, based in NewYork. He has 38 years of industry experience. Prior to joining the PartnersGroup in 2013, he was the Managing Director and Chief Executive Officerof the Institute of International Finance from 1993 to 2013. Previously, hewas a Managing Director at J.P. Morgan & Co. In addition, Dr. Dallara hasheld senior positions in the U.S. Department of the Treasury and with theIMF. He holds a B.A. (Economics) from the University of South Carolina, aMaster of Arts, a Master of Arts in Law and Diplomacy and a Ph.D. fromthe Fletcher School of Law and Diplomacy at Tufts University.
Independent
Key skills and experienceCorporate social responsibility
Financial servicesGovernancePublic policy
Risk management
OVERALL BOARD AND COMMITTEE ATTENDANCE: 18 of 18 / 100%
Meeting attendance Committees Meeting attendance
Board 9 of 9 / 100% Audit and conduct review 7 of 7 / 100%Corporate governance 2 of 2 / 100%
EQUITY OWNERSHIP Totalcommon shares
and DDSUsValue of
DDSUs
Value ofcommon shares
and DDSUs
Total value as amultiple of equityownership targetYear
OTHER PUBLIC COMPANY DIRECTORSHIPSDURING THE PAST FIVE YEARS Current board committee memberships
Partners Group Holding AG (2013 – present) Markets
14 Scotiabank
ABO
UT
THE
MEETIN
G
N. Ashleigh EverettWinnipeg, Manitoba, Canada
Director since 1997
Age 58
Not eligible forre-election in April 2021
Attended 2014annual meeting —received 98.6% votes for
Ashleigh Everett is President, Corporate Secretary and a director of RoyalCanadian Securities Limited whose principal businesses include DomoGasoline Corporation (a gasoline retailer), Royal Canadian PropertiesLimited (a real estate and property development company), and L’Eau-1Inc. (a water purification company). Ms. Everett received her B.A. fromQueen’s University and her M.B.A. from the Ivey Business School atWestern University.
Independent
Key skills and experienceCorporate social responsibility
FinanceFinancial services
GovernanceHuman resources
OVERALL BOARD AND COMMITTEE ATTENDANCE: 26 of 26 / 100%
Meeting attendance Committees Meeting attendance
Board 9 of 9 / 100% Corporate governance (chair) 6 of 6 / 100%Executive and risk 11 of 11 / 100%
OTHER PUBLIC COMPANY DIRECTORSHIPSDURING THE PAST FIVE YEARS Current board committee memberships
Manitoba Telecom Services Inc. (1997 – present) Governance & nominating (chair) | Human resources & compensation
Ms. Everett was a director and officer of Tereve Holdings Ltd. prior to April 2005. It filed for protection under theCompanies’ Creditors Arrangement Act (Canada) in August 2005.
William R. FattToronto, Ontario, Canada
Director since January 2015
Age 63
Not eligible forre-election in April 2025
Appointed to the board afterthe 2014 annual meeting
William Fatt is the Chairman and Chief Executive Officer of FRHI Hotels &Resorts, which operates hotels around the world. Mr. Fatt has over 30years of finance, investment, capital markets and international experience.He is currently a member of the board of directors of The Jim PattisonGroup Inc. He has a B.A. (Economics) from York University.
Independent
Key skills and experienceCapital markets
FinanceGovernance
Human resourcesRisk management
OVERALL BOARD AND COMMITTEE ATTENDANCE: N/A
Meeting attendance Committees Meeting attendance
Board — — —
EQUITY OWNERSHIP Totalcommon shares
and DDSUsValue of
DDSUs
Value ofcommon shares
and DDSUs1
Total value as amultiple of equityownership targetYear
Commonshares DDSUs
2015 9,411 n/a 9,411 n/a $574,636 1.1x
OTHER PUBLIC COMPANY DIRECTORSHIPSDURING THE PAST FIVE YEARS Current board committee memberships
— —
1. The value of Mr. Fatt’s common shares is as of January 30, 2015. The closing price of our common shares on the TSX on this datewas $61.06.
Management proxy circular 15
Brian J. PorterToronto, Ontario, Canada
Director since 2013
Age 56
Eligible for re-electionwhile President and CEO
Attended 2014annual meeting —received 98.9% votes for
Brian Porter is President and CEO of Scotiabank. He joined Scotiabank in1981, and has progressed through a series of increasingly senior positionsacross the bank, including executive roles with Global Banking & Markets,Global Risk Management, Group Treasury and International Banking.Mr. Porter served as the bank’s Chief Risk Officer from 2005 to 2008, asGroup Head of Risk and Treasury from 2008 to 2010 and as Group Headof International Banking from 2010 to 2012. He was appointed Presidentof Scotiabank in November 2012, and was elected to the board ofdirectors in April 2013. He assumed the role of CEO on November 1, 2013.
Mr. Porter earned a Bachelor of Commerce from Dalhousie University, andwas awarded an Honorary Doctor of Laws (LLD) from Dalhousie Universityin 2008. He is a graduate of the Advanced Management Program at theHarvard Business School.
Not independent
Key skills and experienceCapital markets
FinanceFinancial services
Public policyRisk management
OVERALL BOARD AND COMMITTEE ATTENDANCE: 9 of 9 / 100%
Meeting attendance Committees Meeting attendance
Board 9 of 9 / 100% — —
EQUITY OWNERSHIP Totalcommon shares
and DSUsValue of
DSUs
Value ofcommon shares
and DSUs
Total value as amultiple of equityownership target1Year
1. Mr. Porter has a share ownership requirement of seven times his base salary and he exceeds the requirement.
Aaron W. RegentToronto, Ontario, Canada
Director since 2013
Age 49
Not eligible forre-election in April 2028
Attended 2014annual meeting —received 98.9% votes for
Aaron Regent is the Founding Partner of Magris Resources Inc. andChairman and Chief Executive Officer of Niobec Inc. He was President andChief Executive Officer of Barrick Gold Corporation from January 2009 toJune 2012. Previously, Mr. Regent was Senior Managing Partner ofBrookfield Asset Management and Co-Chief Executive Officer of theBrookfield Infrastructure Group, an asset management company, andPresident and Chief Executive Officer of Falconbridge Limited. Mr. Regentholds a B.A. from the University of Western Ontario and is a member ofCPA Ontario.
Independent
Key skills and experienceAccounting/Audit
Capital marketsCorporate social responsibility
FinanceHuman resources
Designated auditcommittee financial expert
OVERALL BOARD AND COMMITTEE ATTENDANCE: 24 of 25 / 96%
Meeting attendance Committees Meeting attendance
Board 8 of 9 / 89% Audit and conduct review 7 of 7 / 100%Corporate governance 4 of 4 / 100%Human resources 5 of 5 / 100%
EQUITY OWNERSHIP Totalcommon shares
and DDSUsValue of
DDSUs
Value ofcommon shares
and DDSUs
Total value as amultiple of equityownership targetYear
OTHER PUBLIC COMPANY DIRECTORSHIPSDURING THE PAST FIVE YEARS Current board committee memberships
Barrick Gold Corporation (2009 – 2012) —
African Barrick Gold Plc (2009 – 2012) —
16 Scotiabank
ABO
UT
THE
MEETIN
G
Indira V. Samarasekera,O.C., Ph.D.Edmonton, Alberta, Canada
Director since 2008
Age 62
Not eligible forre-election in April 2021
Attended 2014annual meeting —received 96.5% votes for
Indira Samarasekera is President and Vice-Chancellor of the University ofAlberta and former Vice President, Research at the University of BritishColumbia (2000-2005). Dr. Samarasekera holds a B.Sc. (in mechanicalengineering) from the University of Ceylon (Sri Lanka), a M.Sc. (inmechanical engineering) from the University of California, as a HayesFulbright Scholar, and a Ph.D. (in metallurgical engineering) from theUniversity of British Columbia. She is an Officer of the Order of Canada. In2014, she was named a Foreign Associate of the U.S. National Academy ofEngineering, one of the profession’s highest distinctions.
Independent
Key skills and experienceCorporate social responsibility
FinanceGovernance
Human resourcesPublic policy
OVERALL BOARD AND COMMITTEE ATTENDANCE: 24 of 24 / 100%
Meeting attendance Committees Meeting attendance
Board 9 of 9 / 100% Corporate governance 6 of 6 / 100%Human resources 9 of 9 / 100%
EQUITY OWNERSHIP Totalcommon shares
and DDSUsValue of
DDSUs
Value ofcommon shares
and DDSUs
Total value as amultiple of equityownership targetYear
OTHER PUBLIC COMPANY DIRECTORSHIPSDURING THE PAST FIVE YEARS Current board committee memberships
Magna International Inc. (2014 – present) Corporate governance, compensation and nominating
Susan L. SegalNew York, New York, U.S.A.
Director since 2011
Age 62
Not eligible forre-election in April 2023
Attended 2014annual meeting —received 98.1% votes for
Susan Segal was elected President and Chief Executive Officer of theAmericas Society and Council of the Americas in August 2003. Previously,she was a banker for over 25 years with JPM Chase and its predecessorbanks. Ms. Segal received a B.A. from Sarah Lawrence College and anM.B.A. from Columbia University. In 1999, she was awarded the Order ofBernardo O’Higgins, Grado de Gran Oficial in Chile. In 2009, PresidentAlvaro Uribe of Colombia honored her with the Cruz de San Carlos awardand in September 2012, Mexican President Calderón awarded her with theAguila Azteca, the highest award given to a foreigner.
Independent
Key skills and experienceCapital markets
Financial servicesGovernancePublic policy
Risk management
OVERALL BOARD AND COMMITTEE ATTENDANCE: 22 of 22 / 100%
Meeting attendance Committees Meeting attendance
Board 9 of 9 / 100% Audit and conduct review 7 of 7 / 100%Corporate governance 6 of 6 / 100%
EQUITY OWNERSHIP Totalcommon shares
and DDSUsValue of
DDSUs
Value ofcommon shares
and DDSUs
Total value as amultiple of equityownership targetYear
OTHER PUBLIC COMPANY DIRECTORSHIPSDURING THE PAST FIVE YEARS Current board committee memberships
MercadoLibre, Inc. (2012 – present) Audit
Management proxy circular 17
Paul D. SobeyChance Harbour,Pictou County,Nova Scotia, Canada
Director since 1999
Age 57
Not eligible forre-election in April 2021
Attended 2014annual meeting —received 97.7% votes for
Paul Sobey is a corporate director and the former President and ChiefExecutive Officer of Empire Company Limited, a food distributor, realestate and investment company, having served from July 1998 toDecember 2013. Mr. Sobey received his Bachelor of Commerce fromDalhousie University, attended the Harvard University Business School,Advanced Management Program in 1996 and is a chartered accountant.He is a Fellow of the Institute of Chartered Accountants of Nova Scotia.
Independent
Key skills and experienceAccounting/Audit
Capital marketsFinance
GovernanceRisk management
Designated auditcommittee financial expert
OVERALL BOARD AND COMMITTEE ATTENDANCE: 27 of 27 / 100%
Meeting attendance Committees Meeting attendance
Board 9 of 9 / 100% Audit and conduct review (chair) 3 of 3 / 100%Audit and conduct review 4 of 4 / 100%Corporate governance 4 of 4 / 100%Executive and risk 7 of 7 / 100%
EQUITY OWNERSHIP Totalcommon shares
and DDSUsValue of
DDSUs
Value ofcommon shares
and DDSUs
Total value as amultiple of equityownership targetYear
OTHER PUBLIC COMPANY DIRECTORSHIPSDURING THE PAST FIVE YEARS Current board committee memberships
Crombie Real Estate Investment Trust (Trustee) (2006 – present) Human resources
Empire Company Limited (1993 – present) Corporate governance
Barbara S. ThomasBelleair, Florida, U.S.A.
Director since 2004
Age 65
Not eligible forre-election in April 2020
Attended 2014annual meeting —received 96.6% votes for
Barbara Thomas is a corporate director, following retirement from a broadcareer in brand management and consumer goods. Ms. Thomas was adirector and Interim Chief Executive Officer of Ocean Spray Company andserved as a director of Blue Cross Blue Shield of Florida, Spectrum Brands,Inc. and The Dial Corporation. Ms. Thomas received her B.A. from theUniversity of Michigan and attended the Total Quality ManagementProgram at Washington University.
Independent
Key skills and experienceCorporate social responsibility
FinanceFinancial services
GovernanceHuman resources
OVERALL BOARD AND COMMITTEE ATTENDANCE: 23 of 24 / 96%
Meeting attendance Committees Meeting attendance
Board 9 of 9 / 100% Audit and conduct review 4 of 5 / 80%Corporate governance 1 of 1 / 100%Human resources 9 of 9 / 100%
EQUITY OWNERSHIP Totalcommon shares
and DDSUsValue of
DDSUs
Value ofcommon shares
and DDSUs
Total value as amultiple of equityownership targetYear
OTHER PUBLIC COMPANY DIRECTORSHIPSDURING THE PAST FIVE YEARS Current board committee memberships
— —
Ms. Thomas was a director of Spectrum Brands, Inc. prior to September 2, 2009. It filed for bankruptcy protection underChapter 11 of the U.S. Bankruptcy Code in February 2009.
18 Scotiabank
ABO
UT
THE
MEETIN
G
Meeting attendance
The table below shows the number of board and committee meetings held in fiscal 2014 and theoverall meeting attendance of the relevant members for that period, including directors who are notstanding for re-election (see below).
Independent board members met in camera without management present at every board meeting infiscal 2014. There were also 16 meetings with regulators, shareholders or shareholder representativegroups, which are not shown in the table. You can find the details about each director’s meetingattendance in the director profiles beginning on page 12.
The table below shows the meeting attendance in fiscal 2014 of directors not standing for re-election.C.J. Chen, David Dodge and John Kerr are retiring from the board on April 9, 2015. Richard Waughretired from the board and the bank on January 31, 2014, and John Mayberry retired from the boardon April 8, 2014.
Meetings Attendance
C.J. ChenBoard 9 of 9 100%Corporate governance committee 5 of 6 83%
David DodgeBoard 9 of 9 100%Executive and risk committee 11 of 11 100%
John KerrBoard 9 of 9 100%Executive and risk committee 10 of 11 91%Human resources committee (chair) 9 of 9 100%
John MayberryBoard (Chairman) 4 of 4 100%Audit and conduct review committee 3 of 4 75%Corporate governance committee 4 of 4 100%Executive and risk committee 4 of 4 100%Human resources committee 4 of 4 100%
Richard WaughBoard 1 of 2 50%
Management proxy circular 19
Director compensation
Our director compensation program is designed to attract and retain qualified individuals and alignthe interests of our directors and shareholders.
The corporate governance committee benchmarks compensation against a comparator group ofCanada’s largest financial institutions (Bank of Montreal, CIBC, Royal Bank of Canada andTD Bank).
The committee reviews director compensation every year to make sure our program remainscompetitive with the market, so we can continue to attract and retain qualified professionals toour board. The committee also considers the risks, responsibilities, time commitment, work load,complexity of issues and decision-making, and the skills required when reviewing thecompensation program.
PROGRAM ELEMENTS
The table below shows our fee schedule for fiscal 2014.
Mr. Porter does not receive fees for serving as a director because he is compensated in his role asPresident and CEO. Our non-executive Chairman receives only the chair retainer and attendance feesfor meetings with regulators, shareholders or shareholder representative groups.
($)
Annual board retainersChairman of the Board ($100,000 must be taken in common shares or DDSUs) 350,000All other directors ($100,000 must be taken in common shares or DDSUs) 130,000
Annual committee retainersCommittee chairs• Audit and conduct review committee 40,000• Executive and risk committee 25,000• Human resources committee 25,000• Corporate governance committee 20,000
Committee members• Audit and conduct review committee 6,000• Other committees 3,000
Attendance fees• Board and committee meetings 2,000• Other meetings (regulators, shareholders or shareholder representative groups) 2,000
Directors must take $100,000 of their board retainer in either bank common shares (by participatingin the directors’ share purchase plan) or DDSUs. Remaining fees can be taken in cash, common sharesor DDSUs. None of the directors currently participates in the directors’ share purchase plan.
Directors are reimbursed for travel and other expenses they incur when they attend meetings orconduct bank business. Directors do not participate in the bank’s pension plans or any othercompensation plans. We stopped granting stock options to directors in 2004 and there are nooutstanding options under the director stock option plan.
About DDSUs
DDSUs are notional units that have the same value as our common shares, and therefore have thesame upside and downside risk.
Directors can redeem their DDSUs for cash only when they leave the board. Their redemption value isequal to the market value of our common shares at the time of redemption.
DDSUs earn dividend equivalents at the same rate as dividends are paid on our common shares, butdo not give the holder voting or other shareholder rights.
20 Scotiabank
ABO
UT
THE
MEETIN
G
2014 DIRECTOR COMPENSATION TABLE
The table below shows the fees paid to directors in fiscal 2014.
Mr. Porter was appointed President and CEO on November 1, 2013. He does not receive fees for serving as a director. Mr. Waughretired from the board on January 31, 2014, and he did not receive fees for serving as a director.
1. Committee meeting attendance fees include the payment of $2,000 in thefirst quarter of 2014 to members of the corporate governance committeeentitled to vote on a circular resolution in October 2013.
2. Mr. Brenneman, Dr. Dallara, Mr. Kerr, Mr. Mayberry, Mr. O’Neill and Mr. Sobeyattended one or more meetings with regulators, shareholders or shareholderrepresentative groups in fiscal 2014.
3. Ms. Aufreiter was appointed to the board and the audit and conduct reviewcommittee on August 25, 2014.
4. Mr. Babatz was appointed to the board on January 28, 2014, and the auditand conduct review committee and executive and risk committee on April 8,2014. He attended one executive and risk committee meeting by invitationand received an attendance fee.
5. Mr. Chen earned US$16,500 in fees in fiscal 2014 for serving as a director ofThe Bank of Nova Scotia Asia Limited (C$18,592 based on the October 31,2014 exchange rate of 1.12679).
6. Dr. Dallara was appointed to the corporate governance committee on April 8,2014. He attended one corporate governance committee meeting byinvitation and three human resources committee meetings by invitation andreceived attendance fees.
7. Mr. Mayberry retired from the board on April 8, 2014. He was given a gift onhis retirement valued at approximately $1,486. In his capacity as Chairman,Mr. Mayberry had the use of a parking space, valued at $2,699. A $10,000charitable donation was made in honour of Mr. Mayberry’s retirement.Mr. Mayberry did not receive any financial benefit from this donation.
8. Mr. O’Neill was appointed Chairman of the Board on April 8, 2014. He wasappointed a member of the audit and conduct review committee (previouslyhe was the chair of the committee) and appointed to the corporategovernance committee and human resources committee on April 8, 2014. Heattended three corporate governance committee meetings and one humanresources committee meeting by invitation before he was appointed amember and received attendance fees. Before he was appointed Chairman ofthe Board, Mr. O’Neill also received attendance fees for attending four auditand conduct review committee meetings and four executive and riskcommittee meetings as a member of those committees. Mr. O’Neill had theuse of a parking space, valued at $3,779.
9. Mr. Regent was appointed to the human resources committee and left thecorporate governance committee on April 8, 2014. He attended four humanresources committee meetings by invitation and received attendance fees.
10. Mr. Sobey was appointed to the executive and risk committee, was appointedchair of the audit and conduct review committee (previously he was a memberof the committee) and left the corporate governance committee on April 8,2014. He attended one executive and risk committee meeting by invitation andreceived an attendance fee.
11. Ms. Thomas was appointed to the corporate governance committee and leftthe audit and conduct review committee on August 25, 2014.
NEW FOR 2015
In October 2014, the corporate governance committee recommended, and the board approved, anincrease in director compensation and a new, simplified flat fee structure for 2015. The new feestructure will take effect on May 1, 2015, subject to shareholders confirming the amendment toBy-law No. 1 to increase the maximum amount that may be paid to directors in any year (you canread about the amendment on page 5).
The increase takes into consideration the increasing demands made of directors, including theincrease in general expectations, the growth and complexity of our business, and meetings withregulators and stakeholders. These factors are in addition to the considerations discussed in our moregeneral approach to director compensation.
Our new director feestructure reinforcesdirector engagementand caps director fees,regardless of thenumber of meetingsheld during the year.
The new fee structure is simple, transparent and easy to administer. Instead of receiving a boardretainer, committee retainers and attendance fees, directors will receive a single, annual boardretainer. Directors will be required to take $120,000 of the new retainer in common shares orDDSUs, instead of $100,000. The Chairman’s retainer will continue to be higher than the retainer forother directors, and the committee chairs will continue to receive an additional chair retainer torecognize their additional responsibilities in these leadership roles.
Management proxy circular 21
The table below shows the new fee structure. No other fees will be paid.
Annual board retainers
Chairman of the Board ($120,000 must be taken in common shares or DDSUs) $400,000All other directors ($120,000 must be taken in common shares or DDSUs) $200,000
Annual committee chair retainers
audit and conduct review committee | executive and risk committee | human resources committee $ 50,000corporate governance committee $ 25,000
Director share ownership
We believe it is important for our directors to have a significant stake in the bank and to aligntheir interests with those of other shareholders.
Directors are required to hold $500,000 in common shares and/or DDSUs, which is five timesthe portion of the board retainer which must be taken in equity. They must maintain theirequity investment while serving on the board. Directors who join the board after July 1, 2014are also expected to own at least $50,000 in common shares within six months of joining theboard (unless there are unique or exceptional circumstances). This applies to Ms. Aufreiter andMr. Fatt, and they both met the requirement.
Directors are not allowed to monetize or hedge their economic interest in Scotiabank securitiesas DDSUs are not transferable and the use of short sales, calls or puts on the bank’s securities isprohibited under the Bank Act.
The table below shows the current guideline, and proposed changes for 2015.
All directors have metthe current ownershipguideline, exceptMs. Aufreiter,Mr. Babatz, andDr. Dallara whorecently joined theboard. These directorsare accumulatingequity in accordancewith our requirements.
As President and CEO,Mr. Porter has anownership requirementof seven times his basesalary and he exceedsthis requirement.
Current share ownership guideline New share ownership guideline(as of May 1, 2015)
Directors who join the board after July 1, 2014are expected to own at least $50,000 in commonshares within six months of joining the board(unless there are unique or exceptionalcircumstances).
Same
Directors must own $500,000 in common sharesand/or DDSUs. Directors have five years fromNovember 1, 2013 (or their date of appointment)to meet the guideline.
Directors must own $600,000 in common sharesand/or DDSUs. Directors have five years to meetthe guideline.
Directors are required to take at least $100,000of their annual board retainer in common sharesor DDSUs, even after they meet the shareownership guideline.
Directors will be required to take at least$120,000 of their annual board retainer incommon shares or DDSUs, even after they meetthe share ownership guideline.
This change will take effect on May 1, 2015,subject to shareholders confirming the proposedamendment to By-law No. 1 increasing themaximum amount that may be paid to directors inany year (you can read about the amendment onpage 5).
22 Scotiabank
GO
VERN
AN
CE
2 Governance
We believe good corporate governance is an essential foundation forstrong performance, and fundamental to our success: it provides properoversight and accountability, strengthens internal and external relationships,builds trust with our stakeholders and promotes the long-term interestsof shareholders.
This section discusses how governance works atScotiabank, our board and its priorities, and what weexpect from our directors.
A solid foundation of openness, integrity andaccountability is key to maintaining strong, enduringrelationships with our diverse stakeholders —shareholders, customers, employees and the broadercommunity.
Oversight and accountability are the cornerstones of good governance. Shareholders electthe board to supervise the management of our business and affairs. The image belowshows the reporting relationships between our shareholders, the board and its fourcommittees, and management. The board approves formal mandates for the board,each committee and members of executive management. These mandates set out the keyresponsibilities and accountabilities for each role.
REPORTREPORT
ELECT
APPOINT APPOINT
REPORT
APPOINT
APPOINT APPOINT
BOARD OFDIRECTORS
Corporategovernancecommittee
SHAREHOLDERS
MANAGEMENT
Executive and riskcommitee
Global riskmanagement
Human resourcescommittee
Independentadvisor
Shareholders’auditors
Audit and conductreview committee
FinanceGlobal compliance
Internal audit
Management proxy circular 23
Important things to know
WE ARE HIGHLY REGULATED
Our corporate governance policies and practices are regulatedby the Office of the Superintendent of Financial Institutions(OSFI), the Bank Act, the Canadian Securities Administrators(CSA), the SEC, and the two stock exchanges where ourcommon shares are traded – the TSX and the New York StockExchange (NYSE).
WE ARE COMMITTED TO BEST PRACTICES
Our corporate governance practices meet or exceed thestandards set out in the Bank Act, and the guidelines and rulesof OSFI, CSA, TSX and the NYSE and SEC that apply to us.
Although we are not required to comply with most of theNYSE corporate governance rules that apply to U.S. domesticissuers, we meet or exceed these rules in all significantrespects, except as summarized in the corporate governancesection of our website.
The corporate governance committee reviews our corporategovernance policies every year against changing regulationsand emerging best practices. The board approves ourcorporate governance policies annually including any changesthat enhance our policies and standards.
New in 2014 and 2015
• In 2014, we strengthened our equity ownershiprequirements by raising the minimum amount ofcompensation directors must take in common shares orDDSUs each year, and requiring a minimum holding ofcommon shares for new directors within six months ofjoining the board (see page 22 for details).
• We are introducing a simplified, flat fee structure fordirector compensation, reinforcing director engagementand capping director fees, regardless of the number ofmeetings held during the year (see page 21 for details).
• The corporate governance committee has engaged anindependent external advisor to facilitate the boardassessment process in 2015 (see page 36 for details).
WHAT WE DO
š 12 of the 13 nominated directors are independent
š Board committees are 100% independent
š We have had a separate Chairman and CEO since 2004
š We have individual (not slate) voting for directors
š We introduced a majority voting policy in 2005
š We have had term limits for directors since 2011
š We have director share ownership requirements
š We disclose directors’ holdings of Scotiabank equity
š Board committees have full authority to retain independentexternal advisors
š We limit the number of other public company boards ourdirectors can serve on, and serve on together
š Over 30% of our directors are women. Our board diversitypolicy also includes age, gender, ethnicity, geographicbackground, experience and personal characteristics
š We have qualification requirements for serving on our auditand conduct review, executive and risk, and humanresources committees
š The board and committees oversee the independence ofthe finance, risk management, compliance and auditfunctions
š The executive and risk committee and human resourcescommittee meet jointly to discuss compensation risk
š Independent directors meet without management presentat each board meeting
š We have a formal, annual board assessment
š Shareholders and other stakeholders can contact theChairman of the Board, independent directors andcommittee chairs
š We have a formal director orientation and educationprogram
š We have meeting attendance requirements for directors
š Directors meet with members of our internationalsubsidiary boards
X WHAT WE DON’T DOš We do not have a staggered board – all our directors are
elected annually
š Management directors do not sit on board committees
š Our directors are not over boarded (no director can sit onmore than four other public company boards)
š No director, executive or employee can monetize or hedgeour common shares or equity-based compensation
š We do not have dual class shares, non-voting orsubordinated voting shares
24 Scotiabank
GO
VERN
AN
CE
About the board
The Bank Act requires a minimum of seven directors. At least two-thirds cannot beaffiliated with Scotiabank and a majority must be resident Canadians. Our boardnormally has between 12 and 18 directors.
This year 13 directors are nominated for election, and the board is comfortable thatthis is an appropriate size to generate open and engaging discussions, to make surethe committees have the right combination of skills, and to allocate responsibilitiesappropriately. The board must approve any change to its size.
The board delegates day-to-day management of our affairs to executivemanagement, up to certain limits.
STRUCTURE OF THE BOARD
Chairman of the Board
The Chairman of the Board is an independent director, responsible for leading theboard in carrying out its duties and responsibilities effectively, efficiently andindependent of management.
He presides over all board meetings, oversees the board committees and chairs allsessions with the independent directors. Independent directors met in camera atevery board meeting in fiscal 2014. He is directly involved in director orientation,continuing education and the board assessment process.
The Chairman acts as a resource for management, advising the President and CEOon major strategic and business issues and corporate governance matters. TheChairman meets with OSFI (our primary regulator), shareholders and otherstakeholders on behalf of the board, and may also meet periodically with membersof the boards of directors of our subsidiaries.
Board committees
Four standing committees help the board carry out its duties and responsibilities. Youcan find descriptions of the committee mandates and membership in the committeereports starting on page 37. The corporate governance committee recommendscommittee composition (including committee chairs) to the board, reviewscommittee membership throughout the year and after the annual meeting once theboard is elected.
Directors serve on at least one board committee. The Chairman is a member of allfour committees, and each committee chair is a member of the executive and riskcommittee. The President and CEO does not sit on any board committees because heis not independent.
Each committee’s composition requirements comply with the CSA guidelines forcorporate governance, the NYSE corporate governance rules for directorindependence that apply to us, Bank Act provisions for affiliated directors, and theOSFI corporate governance guideline.
As an executive committee of the board, the executive and risk committee canexercise certain powers of the board between board meetings, within the limitationsset out by the Bank Act and as determined by the board from time to time. Only theboard can issue securities, approve our financial statements and declare dividends,among other responsibilities.
About the committee chairsCommittee chairs must be independent directors. Each chair is responsible for:• facilitating the functioning of the committee independent of management• overseeing the orientation of new members• providing input to the Chairman and the chair of the corporate governance
committee on succession plans for the committee’s composition, including therole of chair
Management proxy circular 25
Our Chairman and CEO positions areseparate. We have had an independent,non-executive Chairman of the Boardsince 2004.
Audit and conduct review
Human reso
urce
s
comm
ittee
comm
ittee
Corporate governance
comm
ittee
Exec
utive
and ris
k
com
m
ittee
BOARD OFDIRECTORS
Copies of the committee charters andmandates are posted in the corporategovernance section of our website.
You can also find more informationabout the audit and conduct reviewcommittee in our 2014 AIF onwww.sedar.com.
• managing the operations of the committee to fulfill its charter and address any other mattersdelegated to it
• setting the meeting agendas, presiding over all meetings, and ensuring that members have theinformation and resources they need to carry out their duties
• reporting the committee’s discussions and decisions or recommendations to the board.
The corporate governance committee has also reviewed committee chair succession, in light ofdirector term limits.
See the corporate governance section of our website for formal position descriptions explainingthe roles and responsibilities of the board, Chairman, committees, committee chairs and individualdirectors.
NOMINATING DIRECTORS
The corporate governance committee serves as the nominating committee of the board and isresponsible for:• determining the selection criteria for director candidates and board committees• maintaining a skills matrix of the required skills, experiences and competencies as part of board
succession planning• proposing director candidates for the board’s review and approval.
The committee maintains an evergreen list of potential candidates that is developed with a view torequired skills and our corporate governance policies, including diversity. It engages externaladvisors as necessary to help identify candidates with the appropriate skills and experience and alsoencourages current board members to recommend suitable candidates.
Before a candidate is nominated, he or she meets with the chair of the corporate governancecommittee, the Chairman, and the President and CEO to discuss the board’s expectations ofdirector contribution and commitment. You can read more about key attributes and skillsconsidered as part of our nominating process on pages 27 and 33.
MAJORITY VOTING POLICY
We adopted a majority voting policy in 2005 that requires any nominated director who is notelected by at least a majority of the votes cast, to tender their resignation from the board followingthe annual meeting.
In most cases, the board will accept the offer of resignation. The corporate governance committeecan, however, recommend retaining the director when there are extenuating circumstances. Thecommittee will consider all relevant factors, including why shareholders withheld votes, thedirector’s length of service, qualifications and contributions to Scotiabank, and our corporategovernance policies. In any case, the board will disclose its decision in a press release within90 days of the annual meeting. The board may appoint a new director to fill the vacancy if itaccepts the resignation. You can find more information about our majority voting policy in ourcorporate governance policies on our website.
This policy applies only to uncontested elections (elections where the number of nominateddirectors is the same as the number of directors to be elected).
KEY CHARACTERISTICS OF DIRECTORS
Independent
Having an independent board is one of the ways we make sure the board operates independentlyof management and makes decisions in the best interests of Scotiabank. Our independencestandards, which require the majority of our directors to be independent, comply with the BankAct Affiliated Persons Regulations, the CSA rules and the NYSE corporate governance rules. Ourdirector independence standards can be found in the corporate governance section of our website.
26 Scotiabank
92% of ournominated directorsare independent.
Brian Porter is the onlynon-independent,affiliated directorbecause of his positionas President and CEO.
GO
VERN
AN
CE
We consider a director to be independent if he or she does not have a direct or indirect materialrelationship with Scotiabank, and have a three-step process for assessing independence:1. directors complete a detailed questionnaire2. the board reviews directors against the standards, considering all relevant facts and circumstances,
including the relationship any potential director may have with us – and any relationship that theirspouses, children, principal business affiliations and any other relevant individuals have with the bank
3. directors declare any material interest in matters that come before the board.
Board diversity
Our board is composed of qualified professionals who have the requisite financial acumen and riskmanagement experience to fulfill the board’s mandate and supervise management. Our currentdirectors have a broad range of skills and experience – you can read about each director’s skills andexperience in their profiles beginning on page 12.
The corporate governance committee regularly reviews board succession with a view to providing theboard and committees with the right skills, qualifications and perspectives. We believe the bestboards include a diverse mix of experience, gender, age, ethnicity, geographic background andpersonal characteristics, as described in our written board diversity policy, which the board adoptedin 2013.
The committee looks for the most qualified candidates, male or female, based on the skill sets wehave and the experience we need. It considers diversity criteria including gender, age, ethnicity andgeographic background in assessing board composition and potential candidates. As part of itsapproach to board diversity, the bank is a signatory to the Catalyst Accord and aspires to have atleast 25% of its members be women. The board has consistently had 20% or more female memberssince 2004, and 38% of this year’s nominated directors are women. The corporate governancecommittee considers the effectiveness of the diversity policy on an ongoing basis as part of itsongoing assessment of potential director candidates, and more formally on an annual basis as part ofits review of our corporate governance policies. The effectiveness of this policy is also considered aspart of our annual board assessment process.
Five of the nominateddirectors are women.
In 2013, we signed theCatalyst Accord as partof our new writtenboard diversity policy.We have already mettheir “Call to Action”,as women represent38% of this year’snominated directors.
BOARD PRIORITIES
The board’s mandate is to:• supervise the management of the business and affairs of the bank• maintain the bank’s strength and integrity• oversee the bank’s strategic direction, its organizational structure, and succession planning for
senior management roles• perform any other duties required by law.
The mandate incorporates the specific duties and responsibilities of bank directors set out in theBank Act. Our directors and officers abide by the Bank Act’s requirement that they act honestly andin good faith, and with the diligence and skill of a reasonably prudent person.
A copy of the boardmandate is posted inthe corporategovernance section ofour website.
1. Strategic direction
The board oversees our strategic direction and holds management accountable for executing ourstrategy and delivering strong performance. New strategic initiatives and significant acquisitionsand investments must be presented to the board and/or the executive and risk committee forreview and approval.
The board participates in our strategic planning process throughout the year by:• reviewing and approving our strategic plan, taking into account the opportunities and risks of
our businesses• approving the annual capital plan and profit plan• regularly scrutinizing management’s execution of business plans and their results• reviewing our strategic plan against our risk appetite framework• approving our capital management policy and overseeing that appropriate strategies are in
place to mitigate risk
Management proxy circular 27
• assessing our corporate performance and the performance of our business lines against:• financial and other objectives established in the business plans• past performance• industry peers.
The board also dedicates at least one meeting every year to strategic planning and approves ourstrategy. In 2014, the board held two sessions dedicated to strategy.
2. Risk oversightOur risk management framework sets the foundation for managing our principal risks across theenterprise. The board approves our overall risk strategy, including major risk policies and our riskappetite framework, which sets out limits and the appropriate balance of risk and reward.
We diversify risk across business lines, geographies, products and industries. Risk is managedthrough three levels of accountability:• business lines• global risk management and other control functions• internal audit (for independent monitoring and oversight).
A changing regulatorylandscape and theglobal financial andeconomic crisisprompted the boardand committees todevote more time torisk oversight.
Management keeps the audit and conduct review committee and the executive and risk committeeup to date on regulatory developments, and informs the board of any material developments inour relationship with OSFI. The board meets with OSFI to discuss regulatory matters and the resultsof their supervisory activities.
The committees focus on how we identify and manage our principal business risks:• audit and conduct review committee – responsible for internal control and audit procedures
and external audit• corporate governance committee – responsible for governance policies, practices and trends
and board succession plan• executive and risk committee – responsible for reviewing our risk appetite framework, credit risk
appetite, crisis management (recovery) plan, and other key policies; on a quarterly basis receivesa comprehensive summary of the bank’s risk profile and performance of the portfolio againstdefined goals
• human resources committee – responsible for compensation principles, pay for performanceand leadership strategy, and identifying employees who may have a material impact on our riskexposure.
Management’s compensation review committee also reviews the compensation of key employeeswhose roles could have a material effect on risk, including a cross-section of senior executives incontrol and stewardship functions (you can read more about the committee on page 52).
Internal controls and management information systemsThe board oversees the integrity and effectiveness of our management information systems andinternal controls and approves our internal control policy.
The work is carried out mainly by the audit and conduct review committee, which:• oversees our key controls over financial reporting• sets aside time at each meeting to meet with the Chief Auditor, Chief Financial Officer,
Chief Compliance and Regulatory Officer and the independent auditors without managementpresent
• receives regular reports from management and the internal audit department on the design andoperating effectiveness of our internal controls and any significant deficiencies or materialweaknesses
• oversees our whistleblower policy and procedures and approves procedures for receiving, filingand resolving complaints about accounting or auditing matters.
28 Scotiabank
GO
VERN
AN
CE
Disclosure controls and proceduresOur disclosure controls and procedures make sure all material information is gathered andcommunicated to senior officers and the board accurately and regularly.
Our disclosure policy sets out our commitment to promptly release material information in a fair,accurate and timely way to stakeholders. Our disclosure committee, which is composed of seniorofficers, is a key part of this process and is responsible for:• evaluating events to determine whether they give rise to material information that must be
publicly disclosed and the timing of that disclosure• reviewing our core disclosure documents (management proxy circular, annual and quarterly
consolidated financial statements and related MD&A, the AIF, Form 40-F and press releases)before distribution to the board for review and approval and public release
• reviewing and updating our disclosure policy and practices (at least annually).
The disclosure committee reports to the President and CEO. Committee meetings are chaired bythe Executive Vice President, General Counsel and Secretary. The Chief Financial Officer, SeniorVice President, Investor Relations and other officers meet regularly with investment analysts andinstitutional investors, in Canada and internationally. We also hold calls with analysts and investorsafter we release our quarterly financial results. Shareholders and others can listen to thesediscussions by telephone or over the internet.
Shareholders, customers and other stakeholders can access information about Scotiabank on ourwebsite and through our investor relations department. Questions from media and the generalpublic are usually referred to our public and corporate affairs department. Customer complaintsare handled by individual branches and the Office of the President, and they consult otherdepartments as necessary.
3. Leadership development, diversity and assessment
Leadership developmentLeadership is a focus priority for the bank.
Our leadership strategy is focused on enhancing our leadership pool by having greater depth,more diversity and deploying our leaders across the global bank to better reflect our customersand markets. With operations in more than 55 countries, our international platform allows us toidentify and develop individuals who have the ability, aspiration and engagement to succeed atexecutive level roles in the organization. Over the past year, our priority has been to shape theleadership team and bring management closer to customers, markets and businesses, acceleratingthe development of our most senior leaders, and selective external recruitment.
The board oversees our leadership strategy with the support of the human resources committee.The President and CEO and the Chief Human Resources Officer, together with the humaninvestment committee, are responsible for this strategy; a senior executive is responsible for theday-to-day management. The human resources committee reviews the effectiveness of thestrategy and approves the mandates of the President and CEO and all executive officers. It alsoreviews the qualifications, experience and capabilities of all executive officers, assesses candidatesfor our most senior roles (including the President and CEO) and recommends senior executiveappointments to the board for approval. The board and management together interact formallyand informally with executive-ready and executive-potential leaders, in board and committeemeetings, and at educational seminars, board dinners and off-site meetings.
Management proxy circular 29
Leadership diversityAs Canada’s most international bank, our geographic footprint and diverse operations uniquelyposition us to leverage the broadest range of skills, knowledge and talent. We believe that thediversity and inclusiveness of our employees strengthens our position and potential and will driveour business performance. At Scotiabank, we enable and support a culture that values andrespects cultural differences, experiences and beliefs.
In 2014, we launched a diversity and inclusion council that includes our most senior leaders acrossthe organization. Chaired by the President and CEO, the council has a mandate to focus on thediversity strategies and priorities required to deliver on our business goals. Its primary objectives areto:• promote a culture of inclusion and diversity of perspective for better business results• embed diversity and inclusion in strategic business initiatives• enhance leadership development specific to open-mindedness and cross cultural awareness.
We are committed to creating opportunities that enable all employees to reach their full potential.A key component of our diversity and inclusion approach is the identification, development andadvancement of women globally. This priority is embedded in our talent management processesand supported through regular measurement and reporting.
We measure the representation of women at all levels to gauge our progress, including theemerging leader, vice president and above, and the executive leader segments. However, to effectmeaningful and sustainable change at the executive leader level, we believe it is critical to focusour efforts at the emerging leader level so that we have the broadest and highest quality talentpipeline possible. As a result, in lieu of an organizational target for representation of women at theexecutive officer level, the President and CEO and the bank’s most senior leaders have committedto measure ‘Women New to the VP+ Pool’ which is part of the bank’s internal scorecard.
The table below shows our targets (which were either achieved or exceeded) and results for fiscal2014:
Women new to the VP+ pool1Fiscal 2014
target rangeResults as at
October 31, 2014
Canada, U.S. and U.K. 40 - 50% 44%
International (excluding the U.S. and U.K.) 20 - 25% 29%
1. The two target levels reflect the differences and challenges in these regions.
Our focus on identification and professional development positions us well to strengthen therepresentation of women at the executive level over the long term. As of January 31, 2015, 29%or five of the bank’s 17 executive officers were women.
Assessment and succession planningThe human resources committee, along with the executive and risk committee and the audit andconduct review committee, oversees succession planning of senior management, including our fourcontrol functions – audit, compliance, risk and finance. As a member of the human resourcescommittee, the Chairman is directly involved in overseeing the succession plans for key seniormanagement roles.
The human resources committee is responsible for the performance management of the Presidentand CEO. The committee assesses his performance against his board-approved mandate and theshort- and long-term objectives that are established at the beginning of the year. The board reviewsthe assessment, as well as the performance assessments of the other named executives and seniorofficers.
The board is responsible for selecting, retaining and, if necessary, replacing the President and CEO.It maintains a contingency plan to mitigate business risk and ensure we continue to operateprudently in the event the President and CEO position suddenly becomes vacant.
30 Scotiabank
GO
VERN
AN
CE
What we expect from our directors
We expect directors to devote the necessary time to board and committee duties, toalways exercise independent business judgment and to act in our best interest.
INTEGRITY AND ENGAGEMENT
Directors must:• maintain high standards of integrity
• act honestly and in good faith, and with the diligence and care of a reasonably prudentperson, consistent with Bank Act requirements
• comply with our guidelines for business conduct, including the whistleblower policy andprocedures and internet/email code of conduct (see below) and the directors’ addendumconcerning conflicts of interest and any other supplementary guidelines
• use sound judgment• avoid conflicts of interest
• fulfill their responsibilities to the board and committees• review all meeting materials to diligently prepare for each board and committee meeting• actively participate in meetings and seek clarification from management to fully understand
the issues and make informed recommendations as appropriate• protect our information and keep all discussions confidential
• be active and engaged• continuously advance their knowledge of our business and relevant national and international
developments so they can make a meaningful contribution• review and approve our strategic direction and business plan, and regularly assess our financial
and business line performance against the plan• understand the risks of our business model and how they relate to our strategy and risk
appetite framework• understand our regulatory environment• participate in continuing education for directors• attend at least 75% of all board and committee meetings.
The chair of thecorporate governancecommittee meets withany director who doesnot meet ourattendancerequirements, andrecommends to theboard whether or notthe director shouldcontinue to serve.
Guidelines for business conductOur guidelines for business conduct are guiding principles for ethical behaviour at Scotiabank. Theypromote adherence to the laws and regulations that apply to us. The board approves the guidelines,including any amendments, and the audit and conduct review committee monitors compliance withthe guidelines.
Everyone is required to review the guidelines, including the whistleblower policy and procedures andthe internet/email code of conduct, when they join the bank or the board. They must also confirm inwriting every year that they understand and have complied with the guidelines. Directors must alsoread and consent to the directors’ addendum concerning conflicts of interest. None of theseguidelines can be waived for directors or executives, unless the board approves and discloses thewaiver according to securities law. The board did not grant any waivers in 2014.
Scotiabank’s guidelinesfor business conduct,including ourwhistleblower policyand procedures anddirector’s addendum,can be found in thecorporate governancesection of our website.
Avoiding conflicts of interestDirectors must disclose:• their business and personal relationships with the bank and other companies or entities they have
relationships with• if they have a conflict of interest with a matter to be discussed by the board, and must not
participate in any board or committee discussions or vote on the matter.
The board complies with all Bank Act requirements relating to conflicts of interest. The audit andconduct review committee monitors compliance and informs the board of any material deviationsand corrective action taken.
Management proxy circular 31
Reporting a concern
The whistleblower policy is a control to help safeguard the integrity of our financial reporting andbusiness dealings, and to support adherence with the guidelines for business conduct. It protectsemployees who make a report in good faith.
All directors, officers and employees must immediately report any concerns they have about financialreporting or suspected fraudulent activity, a breach of the guidelines and other compliance policies, orretaliation against an individual who reports a concern.
The following reporting channels are available under the policy:• calling the special toll-free hotline or going online to make an anonymous and confidential report
(the hotline and website are maintained by an independent third party)• all concerns can be raised with the Chief Auditor. Concerns relating to regulatory compliance, breaches
of business conduct or other compliance policies can be directly escalated to global compliance• an external party can raise a concern by contacting the Office of the President (see the back cover).
A director can speak to the chair of the audit and conduct review committee or corporate governancecommittee, or the Chairman, if he or she has a concern. All credible reports are investigated internallyor by an independent external party, and appropriate action is taken. Significant concerns are raisedwith the chair of the audit and conduct review committee and senior executives.
TENURE AND TERM LIMITS
Our term limits set out the maximum period of time that directors can stand for re-election, and donot provide guaranteed tenure. The board believes that term limits, director independenceassessments and the board evaluation process collectively help the board make sure that effectiveand independent-minded directors are nominated for election by shareholders and are importantelements in succession planning for the board.
The board approved term limits for directors in 2011 and for committee chairs since 2012:• directors appointed or elected before December 3, 2010 must retire on the earlier of (1) April 1,
2021, or (2) when they turn 70. However, if at age 70 a director has not served 10 years, theirterm is extended and they must retire by the end of a 10 year term
• directors appointed or elected after December 3, 2010 must retire on the earlier of (1) the completionof a 15 year term, or (2) when they turn 70. However, if at age 70 a director has not served 10 years,their term is extended and they must retire by the end of a 10 year term
Our nominateddirectors have anaverage tenure of6.2 years.
Shareholders electdirectors annually for aone-year term.
Shareholders vote forindividual directors, nota slate.
• a director can serve as a committee chair for three years, and for another two years with theboard’s approval
• the date each director is not eligible for re-election is set out in the director profiles beginning onpage 12.
Resignation policy (change in principal occupation)
A director must offer to resign when his or her principal occupation changes. This allows the board theopportunity to assess how the change affects the composition of the board. A bank officer who is alsoa bank director, is deemed to have resigned as a director when he or she ceases to be employed as anofficer, unless the officer is a former CEO and the board has requested that the individual remain onthe board for a fixed period.
SERVING ON OTHER PUBLIC COMPANY BOARDS
Directors bring the most to the board when they act independently and can devote the necessarytime to fulfill their responsibilities, so we limit the number of public company boards they canserve on:• directors who are chief executive officers or senior executives of public companies should not
hold more than two other public company directorships (including the board of the company ofwhich he or she is CEO or a senior executive officer)
32 Scotiabank
GO
VERN
AN
CE
• directors who are employees of private companies or other private entities, or employees of publiccompanies (other than senior officers) should not hold more than four public companydirectorships (including the board of the company they are an employee of)
• all other directors should not serve on more than five public company boards• directors cannot serve on the audit committee of more than three public companies• directors cannot serve on the board of an unaffiliated financial institution without approval.
The corporate governance committee can use its discretion to grant exceptions to the above limits incertain circumstances, but these exceptions must be reported to the board. No exceptions have beengranted to any of the nominated directors.
Board interlocks
We also limit the number of other boards our directors can serve on together. Only two directorscan serve together on the same public company board without the consent of the corporategovernance committee.
The board reviews potential conflicts of interest and board interlocks every year. Two directorscurrently serve together on the board of BCE Inc.
Board Committee memberships
Ronald Brenneman BCE Inc. Management resources and compensation (chair)Pension fund
Thomas O’Neill BCE Inc. (chair) –
SKILLS AND EXPERIENCE
Our current directors are prominent business and community leaders. They bring a wealth ofexperience to the board, generate public confidence, know our businesses and are familiar withthe geographic regions where we carry on business. The nominated directors’ backgrounds, skillsand experience, taken as a whole, equip the board to carry out its duties and supervise the bank’sbusiness and affairs.
Skills matrix
To serve on our board, directors must have considerable experience in leadership and strategy. Inaddition, each of the directors has identified five other key areas of experience in consultation withthe corporate governance committee. The committee developed the skills matrix below based onthis consultation and agreement on each director’s key areas of experience.
N.A
ufr
eite
r
G.B
abat
z
R.B
ren
nem
an
C.J
.Ch
en
C.D
alla
ra
D.D
od
ge
A.E
vere
tt
W.F
att
J.K
err
T.O
’Nei
ll
B.P
ort
er
A.R
egen
t
I.Sa
mar
asek
era
S.Se
gal
P.So
bey
B.T
ho
mas
Key areas ofexperience
Accounting/Audit
Capital markets
Corporate socialresponsibility
Finance
Financial services
Governance
Human resources
Public policy
Risk management
The corporate governance committee also maintains a detailed matrix of each director’s generalareas of experience (such as technology, marketing, regulatory and compliance), education,language skills and business experience in regions where we do business. It uses these matrices toassess board composition, plan board succession, and assess potential director candidates (you canread more about nominating directors on page 26).
Management proxy circular 33
Director development and assessment
Directors must understand the nature and operation of our business – including the size,complexity and risk profile of the bank – and stay current with governance, regulatory, risk,business, industry and other key issues to be effective members of our board. The board hasapproved a guideline on director orientation and continuing education, which outlines ourcommitment to director education, the responsibilities of the corporate governance committee,and what our education and orientation programs will cover. We expect all directors to participatein our education programs and suggest topics for seminars, briefings or reports.
ORIENTATION
Our orientation program helps new directors increase their understanding of their responsibilitiesand the bank’s operations as quickly as possible, so they can be fully engaged and contribute tothe board and committees in a meaningful way.
New directors receive the following reference materials:• an orientation package – explains key legal requirements, our by-laws, directors’ duties and
responsibilities, bank and board policies and procedures, organizational charts, an overview ofour business lines and copies of our disclosure documents
• our corporate governance information book – contains information about our corporategovernance practices and policies, the board and committees, the Bank Act and other legalrequirements, insider reporting and our guidelines for business conduct.
They also:• meet with the President and CEO, heads of control functions and other executive officers
throughout the year• may attend committee meetings for educational purposes before becoming a member• review the bank’s crisis management (recovery) plan and have the opportunity to discuss it with
management.
CONTINUING EDUCATION
Our continuing education program keeps directors up to date on regulatory developments,business initiatives and other issues affecting the bank’s operations, so they can carry out theirresponsibilities more effectively.
We hold information sessions on significant, complex or specialized aspects of our businessoperations and organize one off-site board meetings every year to familiarize directors with ourregional and international operations and to meet local senior management. In 2014, our boardmet in Kelowna, British Columbia as part of our annual meeting of shareholders, and in MexicoCity. As part of the board meeting in Mexico, the board had the opportunity to meet with localcustomers and management, local regulators and members of our subsidiary board of directors.
34 Scotiabank
GO
VERN
AN
CE
Director education in 2014
Session DateAttended by orreceived materials
Canadian Banking – Credit card growth in CanadaEducational session on the credit card business
December 2013 board
Portfolio overviewEducational sessions by Global Risk Management on various portfolios of thebank, such as financial services, aerospace and shipping, pipelines, refineriesand petrochemicals, telecom and media, mining, agriculture, automotive, realestate, consumer and healthcare
All executiveand riskcommitteemeetings in2014
executive and riskcommittee
Risk managementQuarterly enterprise risk management reports addressing credit,market, liquidity, operational, stress testing, capital, information technology,insurance, emerging and other risks
Quarterly boardexecutive and riskcommittee
OSFI regulatory updateEducational update by compliance on various regulatory matters includingcompliance, risk management, corporate governance and areas of focus
December 2013March 2014May 2014August 2014September 2014
audit and conductreview committeeexecutive andrisk committee
Scotiabank pension planEducational session by Global Human Resources/Total Rewards onthe Scotiabank pension plan
January 2014 board
Subsidiary governance developmentsReport on international and domestic corporate governance developmentsaffecting the bank’s subsidiaries
January 2014 board
Mutual fundsEducational sessions by Global Wealth Management and McKinsey & Companyon the Canadian retail asset management industry and the trends in thisbusiness segment
January 2014September 2014
board
International Banking – Caribbean region overviewEducational session on the Caribbean Region, including the economicenvironment, a financial review, key risks
March 2014 board
Global risk management and global complianceDirector orientation sessions (open to all board members)
March 2014 board
Investor relations reportEducational update by Investor Relations on the bank’s shareholder profile,investor relations program, key investor issues, analysts and rating agencies
March 2014 board
B.C. and Yukon regional updatePresentation by Canadian Banking management on customer, business andgeneral economic developments in the region
April 2014 board
Shadow bankingWritten report to the board and presentation to the executive and riskcommittee on shadow banking
June 2014 boardexecutive and riskcommittee
Global Banking & Markets – Global fixed incomeEducational session on Global Fixed Income challenges and initiatives
August 2014 board
Finance and internal auditDirector orientation sessions (open to all board members)
August 2014 board
The Canadian Domestic Systemically Important Banks RecapitalizationRegime and Bail–in DebtWritten and oral reports on the Canadian Domestic Systemically ImportantBanks’ Recapitalization Regime and Bail-in debt
August 2014September 2014
board
Public company board expectationsWritten report to the board on the expectations of public company directors
September 2014 board
Corporate social responsibilityBriefing session by Public and Corporate Affairs/Corporate Social Responsibilityon how the bank manages economic, social and environmental impacts and itsrelationship with stakeholders
September 2014 corporategovernancecommittee
MexicoMeeting with Grupo Financiero Scotiabank Inverlat, S.A. management andindependent directors, regional update and a briefing on the energy sector
October 2014(2 days)
board
Management proxy circular 35
ACCESS TO INFORMATION
We use a secure electronic delivery system to promptly disseminate information, so directors havetimely access to materials and other information to carry out their responsibilities. Directors accesstheir board materials, management updates and other key information on this portal.
All of the nominated directors are members of the Institute of Corporate Directors (ICD) and canaccess ICD events. The ICD supports director education and advocates for best practices ingovernance.
BOARD ASSESSMENT
The corporate governance committee is responsible for board assessment and uses a two-partprocess to encourage full and frank feedback. It completes this assessment every year and in 2014confirmed that the board and its committees were performing well. In 2015, the committee plansto work with an independent external advisor to facilitate the process.
Questionnairecompleted by alldirectors
Personalinterviewwith the chairof the corporategovernancecommittee andthe Chairman
by Chairman andthe chair of the corporate governance committee
+
Questionnaire
• assesses the board, committees, committee chairs and the Chairman against their mandates• includes specific and open-ended questions for feedback on a range of topics including the
board’s access to, and communications with, management• seeks feedback on the board education and orientation program• submitted to the Secretary’s department to preserve confidentiality, and the Assistant Secretary
prepares a summary report for the corporate governance committee
Personal interview
• lets directors provide candid feedback about board effectiveness, committee performance,individual performance, governance and any other issues relating to board effectiveness oroperations
• provides an opportunity to comment formally on management’s performance and engagementwith the board
• facilitates a peer review process so that directors may comment on their peers’ contributions tothe board and its committees, and any concerns they may have
• Chairman leaves toward the end of the interview to encourage open and frank discussion of hisrole and the board’s operations
Report to the board
• committee chair and Chairman review the results and develop recommendations• committee chair reports the findings, including key themes, trends and recommendations to the
board
Follow-up
• committee chair and Chairman develop a process for addressing issues, monitoring progressand reporting back
• action plan may involve working with other committee chairs as appropriate
The board reviews the assessment process annually and revises it as necessary to reflect evolvinggovernance rules, best practices and any changes to the board mandate and committee charters.Directors are also encouraged to approach the Chairman and the corporate governance committeechair at any time about any comments or concerns.
36 Scotiabank
GO
VERN
AN
CE
Committee reports
The board has four standing committees. The committee reports below describe each committee’s key responsibilities, activities andmeetings in fiscal 2014. The members listed are the committees’ current members.
Each committee sets aside time at each meeting to meet without management present. They can also engage external advisors orconsultants as necessary, and approve their contracts and fees. All committees are composed solely of independent directors.
The committee met separately withKPMG at each meeting.
The Chief Financial Officer, Chief Auditorand Chief Compliance and RegulatoryOfficer attended each committeemeeting and each met separately incamera with the committee, other thanat the meeting specifically called to assesseach officer’s effectiveness.
The committee met in camera withoutmanagement present at each of itsmeetings.
The committee reviewed its mandate andis satisfied that it carried out its dutiesand responsibilities.
The audit and conduct review committee is primarily responsible for overseeing the integrity ofour: financial reporting, compliance with legal and regulatory requirements, internal controlfunctions and our relationship with the external auditors. All of the members of the auditcommittee are financially literate within the meaning of the CSA rules, and four members are“financial experts” as defined by the SEC. For more details on the audit committee’s activities,duties and responsibilities, see our 2014 AIF on SEDAR (www.sedar.com) and the committee’scharter in the corporate governance section of our website.
Financial reporting – oversees the quality, integrity and timeliness of our annual and quarterlyfinancial reporting. Reviews financial and earnings press releases before they are released to thepublic.
Compliance and conduct review – fulfills the role of conduct review committee as required underthe Bank Act, including reviewing transactions with related parties and monitoring procedures forresolving conflicts of interest. Oversees our global compliance with legal and regulatoryrequirements.
Internal controls – oversees internal control procedures and their effectiveness. Communicatesdirectly with internal audit and oversees their effectiveness.
External auditors – oversees their audit and evaluates their independence and other qualifications.Communicates directly with them, and recommends to the board their reappointment, subject toshareholder approval.
Oversight of control functions – oversees our finance, global compliance and internal auditfunctions and their independence, and assesses the effectiveness of the heads of each function.
2014 highlights• reviewed and recommended the bank’s annual and interim consolidated financial statements
and related MD&A, financial news releases, AIF and Form 40-F to the board for approval, anddiscussed accounting changes for 2014 and 2015
• reviewed the pre-approved services to be performed by the external auditors each quarter,reviewed the auditors’ audit plan and oversaw the audit, which included the auditors’ opinionon the effectiveness of our internal control over financial reporting. Recommended theauditors’ fees for 2014 to the board for approval and assessed their performance. Reviewedand discussed the annual external audit report
• approved a new policy that sets out the criteria for tendering the contract for the role ofexternal auditor
• reviewed and monitored our internal control framework. Reviewed and approved our internalcontrol policy and recommended it to the board for approval
• received reports on related party transactions and reviewed the President and CEO’s annualdeclaration of employee, director and officer compliance with the guidelines for businessconduct
• reviewed and discussed the quarterly internal audit reports, including on our internal control,risk management and governance processes. Reviewed the audit results, approved the annualaudit plan and areas of changing importance
• received updates on key areas of our domestic and international businesses and the relatedrisks
• reviewed quarterly and annual reports about our global compliance programs, including theanti-money laundering and anti-terrorist financing program and met with the ChiefAnti-Money Laundering Officer
• reviewed management’s reports on regulatory findings and legal actions against us and oursubsidiaries and discussed significant legal actions with the General Counsel and the DeputyGeneral Counsel
• approved the mandates of the Chief Financial Officer, Chief Auditor and Chief Complianceand Regulatory Officer and assessed each officer’s effectiveness
• approved the mandates of the internal audit, global compliance and finance departments;oversaw their independence, assessed their effectiveness, reviewed their succession plans andreviewed and approved their resources, budgets and organizational structures
• reviewed and recommended board approval of the directors’ report to OSFI on conduct reviewactivities handled in the past fiscal year
• retained an independent third party to review the effectiveness of our global compliancefunction
Management proxy circular 37
CORPORATE GOVERNANCE COMMITTEE
Ashleigh Everett (chair)
C.J. ChenCharles DallaraThomas O’NeillIndira SamarasekeraSusan SegalBarbara Thomas
meetings: 6
The committee met in camera withoutmanagement present at each of itsmeetings.
The committee reviewed its mandate andis satisfied that it carried out its dutiesand responsibilities.
The corporate governance committee serves as our nominating committee, oversees ourgovernance culture and advises the board on ways to enhance our governance standards andpractices, consistent with changing regulations and emerging best practices.
Board composition and succession – recommends the composition of each committee. Identifiesand recommends qualified director candidates and oversees succession planning for the board.Manages the skills matrix to ensure proper board composition and succession planning strategiesand considers the appropriate mix of skills and experiences to meet board needs and properlyoversee the bank’s business.
Governance standards and practices – develops and maintains proper independence standardsand a director education program. Maintains key corporate governance policies, including theboard diversity policy.
Corporate social responsibility – oversees disclosure trends and practices in non-financialreporting, including corporate social responsibility, and our performance in those areas.
Assessment – manages the board, committee and director assessment process and assists theChairman in developing an action plan to address any issues or concerns arising from theassessment process.
length of service, skills and experience and assessed potential director candidates
• reviewed the composition of each committee for balance and opportunities to enhance skillsand gain new perspectives
• recommended to the board for approval the appointment of Mr. O’Neill as non-executiveChairman upon the retirement of Mr. Mayberry in April 2014
• recommended to the board for approval changes to board committee composition with aview to committee and committee chair succession planning
• reported to the board on the annual board assessment results, including the directorquestionnaires and interviews. No material issues were raised as part of this process. TheChairman and the committee chair adopted a process to address issues raised.
• reviewed updates on regulatory developments and corporate governance initiatives, andrecommended to the board for approval changes to our corporate governance policies,committee charters and other mandates
• reviewed and recommended meeting schedules for board approval, including off-sitemeetings to familiarize directors with our regional and international operations and meet withlocal senior management
• administered our director orientation and education program
• reviewed potential director candidates and recommended Ms. Nora Aufreiter as a newdirector. Ms. Aufreiter was appointed to the board in August 2014.
• reviewed and recommended our corporate governance disclosure in the circular to the boardfor approval
• reviewed shareholder proposals and recommended responses to the board for approval
• reviewed director compensation and recommended to the board, for approval, an increase inthe share ownership guidelines and the move to a flat fee structure in 2015
• reviewed potential external advisors and retained an independent advisor to facilitate anindependent assessment of board effectiveness in 2015
• reviewed the bank’s corporate social responsibility strategy and proposed changes inreporting, and international trends in this area
The Chief Risk Officer attended the nineregularly scheduled committee meetingsand met in camera with the committeeat eight meetings.
The committee met in camera withoutmanagement present at eight meetings.
The committee reviewed its mandate andis satisfied that it carried out its dutiesand responsibilities.
The executive and risk committee is primarily responsible for risk oversight and advising executivemanagement on highly sensitive matters and major strategic issues.
Oversight of risk function – oversees our global risk management function, their independenceand overall effectiveness, including the effectiveness of the Chief Risk Officer.
Risk appetite framework – recommends our risk appetite framework to the board for approval.
Risk oversight – reviews and approves our principal risks, including credit, investment, liquidity,operational, insurance and market risks. Reviews and approves significant industry, market andportfolio risks and limits. To manage compensation risk, meets with the human resourcescommittee to jointly review and recommend key elements of our executive compensationprogram, including plan design, targets, metrics and potential payouts.
Strategic advice and counsel – examines public issues facing the bank and reports on them to theboard. Advises executive management on strategic issues and highly sensitive matters, includingmergers and acquisitions.
2014 highlights• discussed and advised management on the bank’s decision to sell its investment in
CI Financial Corp.
• reviewed our 2014 risk appetite framework and its alignment with our strategic plan, andrecommended this, along with the enterprise-wide risk management framework, to the boardfor approval
• reviewed industry sector analyses and significant credit and market risk exposures throughoutthe year
• reviewed and recommended to the board for approval, our credit risk policy and credit riskappetite
• reviewed global risk management’s quarterly reports on the bank’s risk profile, includingreviews of our risk management programs and our credit, market, liquidity, operational, stresstesting and economic and regulatory capital risks. Also discussed the top emerging risks eachquarter
• reviewed and recommended risk-related policies and management programs to the board forapproval, including our country and cross border risk management guidelines, market andstructural risk management policy, catastrophic risk management policy, liquidity risk andcollateral management policy, environmental policy, information technology risk managementpolicy, and operational risk management policy
• reviewed and approved our crisis management (recovery) plan with management andpresented it to the board and OSFI. Also reviewed our financial crisis management program(recovery plan policy and financial crisis management program framework) and recommendedit to the board for approval
• reviewed management’s report on reputational risk management and the activities of thereputational risk committee
• oversaw the independence of global risk management, assessed the effectiveness of thedepartment and reviewed its succession plans, approved the mandates for the departmentand the Chief Risk Officer, and reviewed and approved the budget, organizational structureand resources of global risk management
• held five joint meetings with the human resources committee to review risks associated withexecutive compensation and incentive plans and discuss the performance assessment of theChief Risk Officer
• reviewed reports from regulators relating to key areas of risk
• met with business line heads to discuss risk considerations, exposures and commercialinitiatives in particular areas of their business
• the chair of the committee regularly met with the chair of the audit and conduct reviewcommittee to discuss risk considerations and agenda items for each committee
Management proxy circular 39
HUMAN RESOURCES COMMITTEE
John Kerr (chair)
Ronald BrennemanThomas O’NeillAaron RegentIndira SamarasekeraBarbara Thomas
meetings: 9
The committee met with its independentadvisor at each meeting and jointly withthe executive and risk committeefive times.
The committee met in camera withoutmanagement present at each of itsmeetings this year.
The committee reviewed its mandate andis satisfied that it carried out its dutiesand responsibilities.
The human resources committee is responsible for overseeing our human resources andcompensation program and practices (total rewards including salary, incentive plans, pensionplans and benefits and our executive compensation program specifically) and leadershipsuccession. None of the committee members is currently a CEO of a public company.
Compensation philosophy and human resources policies and practices – makes sure they alignwith our pay for performance strategy and risk appetite. Reviews our compensation program andmakes recommendations to the board. Oversees administration of our pension plans.
Compensation governance – reviews evolving governance practices and the alignment of ourcompensation policies with best practices of the Financial Stability Board (FSB), Institute ofInternational Finance, Financial Conduct Authority and the CCGG.
Executive compensation – oversees all aspects of our executive compensation program and ourincentive plans in particular. Establishes share ownership guidelines and requirements afterretirement. Assesses the performance of the senior leadership team and makes compensationrecommendations to the board. Reviews and recommends our compensation disclosure to theboard for approval.
Managing risk – meets with the executive and risk committee to jointly review and recommend allkey elements of our incentive plans, including plan design, targets, metrics and potential payouts.Seeks independent advice and input from a third party advisor.
Leadership and succession planning – oversees management succession plans to ensure effectiveleadership.
2014 highlights• made changes to the funding framework for the annual incentive plan to strengthen the focus
on our key financial and non-financial metrics and strategic alignment
• reviewed the design and competitiveness of the bank’s equity-based compensation programs
• recommended a change to the stock option plan including longer vesting and an overallreduction of the weight of options in the compensation mix
• oversaw the redesign of the executive compensation disclosure in the circular
• met with the bank’s Chief Auditor to review the independent review of the alignment of ourexecutive compensation program with FSB Principles for Sound Compensation Practices andImplementation Standards
• reviewed risks associated with the design and funding of our material executive compensationplans with the executive and risk committee and the Chief Risk Officer
• oversaw changes related to new regulatory requirements in our European operations
• reviewed the design, effectiveness and competitiveness of our benefits programs globally
• reviewed the funding, performance and the investment strategy of the Scotiabank pensionplan and the global governance framework
• reviewed our executive pension arrangements, including plan design, competitiveness, costsand governance trends
• recommended the compensation for the President and CEO and his direct reports and allexecutive vice presidents
• reviewed the mandates for all executive vice president roles and above
• continued to oversee management’s execution of the leadership strategy and successionplanning process to enhance the depth and breadth and diversity of executive talent, developtop leaders, increase spans of control, provide clearer accountability and place managementcloser to customers, markets and businesses
• heightened focus on executive development for the bank’s most senior leaders (new initiativesinclude a leadership development assessment, a new global executive program, and acorporate approach to managing the executive leadership pipeline)
• met with regulators, shareholders and other stakeholders to foster a dialogue on our approachto executive compensation and receive feedback
40 Scotiabank
EXEC
UTIV
EC
OM
PENSA
TION
3 Executive compensation
At Scotiabank, we believe executive compensation is key to helpingus achieve our strategy, and we design and oversee it with this goal in mind.
This section discusses our executive compensationprogram, and the process we use to make compensationdecisions that are appropriate, based on our performance,and in line with our risk appetite. It also tells you how weperformed in 2014, the compensation decisions we madethis year, and how those decisions reflect ourperformance.
OUR NAMED EXECUTIVES THIS YEAR
Brian J. PorterPresident and Chief Executive Officer
Sean D. McGuckinExecutive Vice President and Chief Financial Officer
J. Michael DurlandGroup Head, Global Banking & Markets
Christopher J. HodgsonGroup Head, Global Wealth & Insurance
• Termination and change of control . . . . . . . . . . . 77
Dear fellow shareholders,
As I reach the end of my term as a Scotiabank director and my last year as chair of the humanresources committee, I am proud of what the committee has achieved both from a leadership and
Message from thechair of the human
resources committee
pay-for-performance perspective.
On the leadership side, the committee has devoted a considerable amount of time to successionplanning: we have installed a new President and CEO and overseen a major shift in seniormanagement to ensure the bank has the right people in the right positions to lead our futuregrowth.
On the compensation side, we believe it is important to be clear about how we design and overseeour compensation program, and this year we have paid particular attention to how we explain thelink between executive compensation and the bank’s strategy and focus priorities. We are confidentwe have an approach to executive compensation that strikes the appropriate balance betweenaligning shareholders’ interests and engaging employees, setting appropriate incentives andrewarding results. We believe our model is competitive, fair and appropriate for an organization ofScotiabank’s size and complexity – and it is one that shareholders have consistently supportedthrough our “say on pay” vote, which has received 92% support or higher since we voluntarilyintroduced it in 2010.
Management proxy circular 41
Scotiabank’s strategy is aimed at creating strong, consistent and predictable earnings for ourshareholders over the long term. Each plan design and pay decision is made to support ourstrategy, without encouraging excessive risk-taking by executives or employees more broadly.
Our compensation strategy, which you can read about starting on page 45, includes:• reinforcing the accountability of executives by making the majority of compensation variable
and based on performance• supporting the bank’s strategy by paying for performance against the same metrics it uses to
measure its success – the table on page 47 shows how our compensation plans are linked tothe focus priorities
• focusing executives on the long-term by paying out compensation over time and makingthe majority of compensation equity-based
• making sure our programs are fair and in line with our peers, with whom we compete fortalent.
Members of the human resources committee were selected by the corporate governancecommittee for their experience in human resources matters, leadership and compensation.We manage compensation risk in consultation with the executive and risk committee, throughorganizational structure, management oversight, plan design (including caps on incentivepayouts), anti-hedging, clawback and other policies. We continue to believe in the importanceof discretion in judging the final result in the pay for performance decision, as we discuss onpage 52. While our incentives begin with a formula, we believe shareholders are best served byapplying judgment to the final assessment.
The result is an executive compensation program that rewards strong corporate performance,the advancement of our strategy and the enhancement of long-term shareholder value.
2014 performance and compensation
The bank had solid financial performance in 2014: well within the range of our medium-termfinancial objectives, and above the annual target ranges we set for compensation purposesbased on what we felt was reasonable to deliver value to our shareholders and to support shareprice growth.
Medium-term 2014 target for 2014performance
objectivecompensation
purposes 2014 resultsresults compared
to target
Earnings per share 5% to 10% growth $5.31 $5.41 (7% growth) +1.9%
Return on equity - one-year 15% to 18% 15.34% 15.41% +7 basis points
Return on equity - three-year average (reported) 15% to 18% 16.3% 17.4% +110 basis points
Note: We measured performance for compensation purposes after adjusting for the following one-time items: the gain from the sale of CI Financial Corp. in the third quarter
of 2014, and the restructuring charges and other notable items recorded in the fourth quarter of 2014 – see page 20 of our annual report. In addition to these adjustments,
management reduced earnings per share by $0.02 for compensation purposes due to the exclusion of CI Financial Corp. dividends ($11MM after-tax) and the exclusion of
funding costs benefit ($9MM after-tax). Adjusted results and related terms are not defined terms under GAAP and may not be comparable to similar terms used by other
financial institutions (see page 80).
The result is that 2014 performance relative to target is not as strong as it was in 2013. This isreflected in our executive compensation as a lower business performance factor for the annualincentive plan. The overall performance factor for the annual incentive plan was 113 this year,which is above our target for the year, but lower than last year (see page 61).
Employee engagement, which was in the top 10% of global financial institutions and higherthan last year, had a positive impact on the annual incentive plan business performance factor.Customer loyalty, however, was below the stretch target in two of our four businesses this year,which reduced the factor. While much was achieved in terms of customer focus in 2014, ittakes time for this to be reflected in our customer loyalty metrics. We will continue our focus in2015.
42 Scotiabank
EXEC
UTIV
EC
OM
PENSA
TION
One of our key long-term goals is to outperform our peer group of Canadian financialinstitutions in delivering total shareholder returns (TSR). While the results of our three-year totalshareholder return was below the median of our peer group, resulting in a lower payout fromthe 2011 mid-term incentive plan, we achieved this goal over five years as shown in the graphbelow.
The graph also shows what was earned by the CEO both asrealized compensation and unrealized compensation over thesame five-year period, and demonstrates the strongrelationship between shareholder returns and CEOcompensation. Realized compensation includes base salary,annual incentive, and the value of stock option exercises andperformance share unit payouts. Unrealized compensationincludes the change in value of outstanding performanceshare units (PSUs) and unexercised stock options. The area ofthe graph in darker grey shows Mr. Porter’s realized orrealizable compensation as President and CEO – he wasappointed to that role on November 1, 2013.
The board awarded Mr. Porter total direct compensation of$8,870,000 in 2014, which is 11% higher than his 2014target. It also represents a 26% increase over his 2013 totaldirect compensation which was earned prior to hisappointment as President and CEO.
Tota
l sha
reho
lder
ret
urn
($)
Tota
l CEO
pay
($ m
illio
ns)
2009
2010
2011
2012
2013
2014
50
100
150
200
250
Scotiabank TSR Total CEO pay Peer groupmedian TSR
S&P/TSXComposite
195
130
65
0
CEO PorterCEO Waugh
2014compensation
2014target
2013compensation
Total direct compensation $8,870,000 $8,000,000 $7,050,000
% variable 89% 88% 89%
You will find a detailed discussion of Mr. Porter’s 2014 compensation starting on page 64. Inbrief, the committee is very pleased with his strong contribution in his first year as President andCEO, both to the strides the bank made in advancing its focus priorities, and to the significantchanges we made this year. Under Mr. Porter’s leadership, the bank:• strategically monetized its investment in CI Financial Corp.• strengthened and re-shaped its leadership team• continued to build greater diversity in the leadership pipeline• re-aligned the wealth, insurance and global transaction banking businesses, bringing
decision-making closer to our customers while providing improved operational efficiency• consolidated its corporate and commercial lending businesses in Asia• sharpened its focus on the four Pacific Alliance countries of Mexico, Peru, Colombia and Chile.
Looking ahead
I would like to thank the members of the committee for their hard work and dedication tocarrying out our duties. It has been an honour and a privilege to serve as chair of thecommittee.
Please take some time to read this section of the circular, which explains the executivecompensation program and our decisions for 2014 in more detail. As always, we welcome yourfeedback, comments and questions at [email protected].
Sincerely,
John KerrChair of the human resources committee
Management proxy circular 43
New in 2014
We review the executive compensation program every yearand refine it as appropriate to align more closely with strategy,focus on building shareholder value, mitigate risk or improvecompetitiveness. Here are the key changes we made in 2014:
• We reduced the use of stock options for senior executivesand eliminated them altogether for our vice presidents, inkeeping with market practices. Options now make up 20%or less of the target total compensation for the namedexecutives, 15% for executive vice presidents and 10% forsenior vice presidents. PSUs now make up 70% of deferredcompensation for the named executives.
• We changed the vesting schedule for options, in keepingwith their longer-term role in our compensation program.As of December 2014, options vest 50% on the thirdanniversary date of the grant, and 50% on the fourthanniversary date of the grant (instead of 25% each yearover four years, beginning on the first anniversary date ofthe grant).
• We refined the financial and non-financial performancemetrics we use to fund the annual incentive plan to alignmore directly with our strategy and clearly differentiate theannual incentive plan from our mid-term incentive plan. Aspart of this process, we back-tested the metrics against our2012 and 2013 results to make sure the change wasappropriate.
• We added detailed performance target ranges and resultsin this year’s circular to replace the more general scorecardincluded in previous years. All components of our generalscorecard are covered either in plan funding or in theannual deliverables used to assess individual performance.
• We enhanced our vertical pay analysis, which forms part ofour decision-making process for determining the Presidentand CEO’s compensation. Our vertical analysis comparesthe President and CEO’s pay package to the medianCanadian family income.
WHAT WE DOPay for performance
š Compensation is mostly variable and not guaranteed
š We align compensation with both individual and corporateperformance
š We link a significant portion of compensation to long-termperformance
š We link compensation directly to our strategy, usingfinancial and non-financial, absolute and relativeperformance metrics
š We look at payouts under various scenarios whendetermining performance metrics for the incentive plans
š We make pay decisions within our risk appetite, consideringprojected capital ratios
š We reduce or withhold payouts when performance issignificantly below expectations
š We will claw back or require forfeiture of awards alreadypaid in situations of fraud, misconduct, inappropriate risktaking or material misstatement of our financial results
Govern executive compensation effectively
š We have a qualified, experienced and independent humanresources committee that uses an independent advisor
š Our human resources committee meets jointly with theexecutive and risk committee to review all key elements ofour incentive plans
š We consider both horizontal and vertical pay analyses whendetermining the President and CEO’s compensation for theyear
š We require executives to own Scotiabank equity
š We give shareholders a “say on pay”
š We have caps on incentive plan payouts
š We have specific compensation criteria for employees whohave a material impact on risk
š The compensation review committee, which includes theChief Risk Officer, conducts ongoing risk reviews
š Our human resources committee arranges for anindependent review of compensation programs andpractices every year
X WHAT WE DON’T DO
š We do not reprice stock options
š Executives are not allowed to use hedging to underminethe risk alignment in our compensation plans
š We do not encourage excessive risk-taking whenstructuring our executive compensation program
44 Scotiabank
EXEC
UTIV
EC
OM
PENSA
TION
Compensation discussion and analysis
1. Strategy
Scotiabank has a well-defined and clearly articulated strategy, aimed at delivering strong, consistent andpredictable earnings to our shareholders over the long term. In particular, we have a well-diversifiedand well-balanced operating model that is predicated on a strong Canadian foundation, enhanced byselect international operations. We are proud to be Canada’s most international bank.
Our business model is carefully diversified across business lines, customer segments and geographies.Overall, we look for our Canadian operations to generate approximately 50% of our earnings, with thebalance coming from our international businesses. We look to our non-wholesale businesses (personal,commercial, wealth and insurance) to generate approximately 70% of our earnings, with the balancecoming from our wholesale businesses. The objective of these guidelines is to generate consistent andpredictable earnings, with above-average growth potential.
One of our key long term goals is to outperform our peer group of Canadian financial institutions indelivering total shareholder returns.
We have developed three focus priorities to help us execute this strategy effectively:• Being more focused on our customers: by investing to consistently deliver an excellent customer
experience, we expect to deepen our relationships with existing customers and attract new ones• Enhancing our leadership depth, diversity and deployment: effective leadership will be critical
in carrying out our strategy and meeting our long term goals• Being better organized to serve our customers and reduce structural costs: we look to
achieve one or more of the following objectives across all of our operations: serve our customersbetter, simplify our operating model and improve our operating efficiency by becoming low costby design
Our compensation strategyOur executive compensation strategy supports our goal of delivering strong, consistent and predictableresults to shareholders over the longer term. We pay for performance, with a strong emphasis onvariable incentive compensation.
Our compensation programs are built with four goals in mind:
EMPHASIZING THELONG TERM
by paying compensation out over time
SUPPORTING OUR STRATEGY
by assessing performance for compensation purposes against the same financial and non-financial metrics
we use to drive performance for our
shareholders
REINFORCING ACCOUNTABILITY by clearly aligning
compensation with individual and
corporate performance
ATTRACTING AND RETAINING EXECUTIVE
TALENTby making sure
compensation is competitive and appropriate for
our strategy
STRONG, CONSISTENTAND PREDICTABLERESULTS OVER THE
LONGER TERM
Management proxy circular 45
REINFORCING ACCOUNTABILITY
by clearly aligning compensation with individual and corporate performance
Most of what we pay our executives is awarded as annual, mid-term and long-termincentives. These incentives are variable and not guaranteed.
We set performance ranges for the annual and mid-term incentive plans, soexecutives earn more when performance is strong, and less when performance isdown. The annual incentive pool is funded by bank performance (both absolute, andcompared to our peers). Individual performance determines each executive’s share ofthe pool.
Compensation mix
The human resources committee establishes a target compensation mix for eachexecutive level based on three criteria:• the executive’s ability to affect results over the longer term – more senior roles
have a higher percentage allocated to long-term incentive, which is equity-basedand linked to longer-term performance
• market practice for similar positions in our comparator group• regulatory requirements to defer incentive awards.
A progressively larger portion of compensation is delivered as deferred compensationfor more senior executives. Compensation is mostly variable, based on performanceand not guaranteed.
88% variable compensation
President and CEOcompensation mix
Base salary 12%Annual incentive 23%Mid-term incentive 46%Long-term incentive 19%
85% variable compensation
Other named
compensation mix
Base salary 15%Annual incentive 18%Mid-term incentive 47%Long-term incentive 20%
executives
46 Scotiabank
EXEC
UTIV
EC
OM
PENSA
TION
SUPPORTING OUR STRATEGY
by assessing performance for compensation purposes against the same financial andnon-financial metrics we use to drive performance for our shareholders
We link executive compensation directly to our strategy by incorporating key performanceindicators into our annual and mid-term incentive plans. Several of the indicators specificallysupport the focus priorities we introduced in 2014.
Absolute performance is measured against the objectives in our business plan. Relativeperformance is measured compared to our performance comparator group (see page 49).
Operating leverage and return on equity are not defined terms under GAAP and may not becomparable to similar terms used by other financial institutions (see page 80).
Key performanceindicators
How they are used in ourincentive plans
How they supportour strategy
Financial metrics
Return on equity • absolute performance increase shareholder value, balancing risk and return
Earnings per share • absolute performance• adjustment factor for relative performance using
earnings per share growth
increase shareholder value by increasing earnings
Operating leverage • absolute performance• adjustment factor for relative performance
reduce structural costs by measuring the differencebetween our growth in revenue and growth inexpenses
Revenue • adjustment factor for relative performance usingrevenue growth
increase shareholder value by creating and growingnew business relative to our competitors
Net income • adjustment factor for relative performance usingnet income growth
increase shareholder value by improving profit growthrelative to our competitors
Total shareholder return • relative performance increase shareholder value by measuring our shareperformance compared to our peers
Non-financial metrics
People • adjustment factor enhance leadership by measuring employeeengagement - employees who are more engaged aremore successful and more effective at buildingcustomer loyalty
Customer • adjustment factor focus on customers by measuring customer loyalty andour success at acquiring new customers
Management proxy circular 47
EMPHASIZING THE LONG TERM
by paying compensation out over time
A key aspect of our executive compensation design is that a significant portion of executivecompensation is deferred and is aligned with our share price. We believe that having a longer termpersonal investment in the bank aligns the interests of executives and shareholders, encouragesour executives to make decisions that will increase shareholder value over time, and at the sametime discourages them from taking undue and excessive risks.
The ultimate value of our long-term incentives depends on our long term performance. The largestportion of executive compensation is equity-based compensation, which vests and pays out overthree to 10 years. Executives can also choose to defer some or all of their annual incentive awardby taking it as deferred share units (DSUs) (see page 57).
or DSUs – held until the executive leaves the bank
Share ownership requirements
Our executives are required to hold Scotiabank equity to make sure their interests are aligned withthose of our shareholders. Share ownership requirements vary by level, and our most seniorexecutives must maintain their ownership for a period of time after they retire. All of the namedexecutives have met the share ownership requirement – see the executive profiles beginning onpage 64.
Newly appointed executives have three years to meet their share ownership requirement.Executives who are promoted from within have two years to meet the requirements of their newlevel. Common shares, outstanding DSUs, PSUs, and holdings through our Employee ShareOwnership Plan (ESOP) all count towards meeting the requirement.
Share ownership requirement
CEO 7x base salary (must hold for two years after retirement)
Group heads 4x base salary (must hold for one year after retirement)
Executive vice presidents 3x base salary
Senior vice presidents,vice presidents andmanaging directors 1 to 2x base salary
48 Scotiabank
EXEC
UTIV
EC
OM
PENSA
TION
ATTRACTING AND RETAINING EXECUTIVE TALENT
by making sure compensation is competitive and aligned with our strategy
Our programs are designed to attract, retain and motivate high-caliber executives to achieve our goals.We benchmark our compensation and performance against companies we compete with for executivetalent and capital, and that are comparable to us in business, size of revenue, net income and marketcapitalization.
Our compensation comparator group includes Canada’s six largest financial institutions: Bank ofMontreal, CIBC, Royal Bank of Canada, TD Bank, Manulife Financial and Sun Life Financial. Webenchmark target total compensation for executives against these companies using data provided bythe Hay Group Limited (Hay Group), an external consulting firm. Benchmarking is based on roles, takinginto consideration job scope and relative complexity of the role in relation to the comparator group,and includes salary, incentive awards, total compensation and compensation mix. This information isconsidered in the course of our compensation decision-making process (see page 53).
Our performance comparator group, which we use to assess relative performance in our mid-termincentive plan, includes our compensation comparator group, plus Power Financial Corporation. PowerFinancial Corporation does not participate in the Hay Group survey.
The table below includes information from public disclosure filings for the most recent fiscal year. Datafor the banks is as at October 31, 2014. Data for Manulife Financial, Sun Life Financial and PowerFinancial Corporation is as at December 31, 2013.
Compensationcomparator
group
Performancecomparator
groupRevenue
($billions)Net income
($billions)
Marketcapitalization
($billions)Employees
(000s)
Bank of Montreal x x 16.7 4.3 53.0 46.8
CIBC x x 13.4 3.2 40.9 44.4
Royal Bank of Canada x x 34.1 9.0 115.4 73.5
TD Bank x x 30.0 7.9 102.3 81.1
Manulife Financial x x 18.7 3.2 38.7 28.1
Sun Life Financial x x 13.9 0.9 22.9 28.5
Power Financial Corporation x 28.8 1.9 25.6 n.a.
Median 18.7 3.2 40.9 45.6
Scotiabank 23.6 7.3 84.0 86.9
Management proxy circular 49
2. Compensation governance
The board of directors is responsible for executive compensation at Scotiabank.
The human resources committee is responsible for our compensation program and practices, andworks in collaboration with the executive and risk committee when making compensationdecisions. It also receives advice from a qualified, independent third party advisor.
Human resources committeeresponsible for our compensation
program and practices(see page 40)
REPORTS
REPORTS
ELECT
CHAIRS
ADVISESCONSULTS
ADVISEExternal advisors
Chief Auditorcarries out an independent audit for the
human resources committee and for OSFI(see page 51)
Compensation review committeeensures an appropriate link
between incentive compensation and risk for key employees
(see page 52)
Independent advisor(see page 51)
BOARD OFDIRECTORS
Executive and risk committeeworks in collaboration with
the human resources committee(see page 39)
MANAGEMENT
Chief Risk Officerreviews and reports on
compensation and risk appetite
SHAREHOLDERShave a “say on pay”
ABOUT THE HUMAN RESOURCES COMMITTEE
The human resources committee has six independent directors. None of the members has everbeen a Scotiabank executive. Average committee tenure is 6.2 years.
On the committee since
John Kerr (chair) 2004
Ronald Brenneman 2004
Thomas O’Neill 2014
Aaron Regent 2014
Indira Samarasekera 2009
Barbara Thomas 2007
All committee members bring extensive experience, acquired through their managementinvolvement in public and private companies, educational institutions and other entities, and asseasoned directors, to their work on the committee. The table below shows the skills directorsserving on the human resource committee have in order to provide effective governance andoversight of our executive compensation program.
Human resources committee members
Independent 6 of 6
Executive compensation experience 6 of 6
Governance experience 6 of 6
Risk management experience 3 of 6
Human resources management 6 of 6
President/CEO experience 4 of 6
Other executive leadership 6 of 6
50 Scotiabank
EXEC
UTIV
EC
OM
PENSA
TION
Independent advice
The committee gets advice from a qualified, third party advisor on compensation matters to makesure its decisions are fair and balanced, and reflect a broader perspective. The committee makesthe final decision after considering the advice received. It has the following policies to make surethe advisor it hires is – and remains – independent:• management cannot use the same advisor• fees must be reported at each committee meeting along with a detailed description of all
related activities• the committee meets with the independent advisor at every meeting without any members of
management present.
The committee has retained Frederic W. Cook & Co., Inc. (FWC) as its independent advisor since2009.
The table below shows the fees paid to FWC in fiscal 2013 and 2014 for the following services:• a review of executive compensation practices and program design• competitive analysis of CEO compensation• trends in executive compensation and governance best practices• perspective on appropriate total compensation mix and levels, based on competitive practice
and performance• advance review of meeting materials to identify any other issues for the committee to consider
when evaluating proposed changes to our compensation program and plan designs.
FWC has confirmed that these fees are not significant relative to its total revenue and, therefore,do not affect its independence. It did not provide any other services to the committee or board ineither year.
COMPENSATION RISK OVERSIGHT
The human resources committee oversees compensation risk using an effective organizationalstructure, an independent audit, proper oversight, comprehensive policies and the use ofdiscretion. Compensation risk oversight is an important component of our risk managementframework (see page 28).
Organizational structure
Compensation for key stewardship and support functions (finance, risk management, internalaudit, compliance, legal and human resources) is tied to overall corporate performance, and notthe performance of the business lines they support.
Heads of control functions (finance, risk management, internal audit and compliance) managetheir groups independently from the business lines they support, and have final sign-off on hiring,compensation and performance assessment for key roles.
Independent audit
Internal audit conducts an independent review of our compensation programs and practices everyyear, and reports to the human resources committee. The results are also provided to OSFI. Thereview includes:• an assessment of the appropriateness of all material compensation plans and programs against
our organizational goals, our risk profile and FSB Principles and Standards• an assessment of appropriateness of payouts relative to risk• the compensation of key employees whose roles could have a material effect on risk through
operations or policies, or manage material businesses, countries or regions (see page 79).
The Chief Auditor presented the 2014 review to the committee and confirmed that Scotiabankwas in compliance with FSB Principles for Sound Governance Practices and ImplementationStandards in all material respects.
Management proxy circular 51
Management oversight
The compensation review committee identifies key employees whose roles could have a materialeffect on risk and reviews their compensation to ensure there is an appropriate link betweenincentive compensation and risk. This includes senior executives and other employees whoestablish policies that significantly affect corporate risk, or manage material businesses, countriesor regions. The compensation review committee is chaired by the Chief Risk Officer, who updatesthe human resources committee on the committee’s activities.
The compensation review committee includes:• Chief Risk Officer (chair)• Chief Human Resources Officer• Executive Vice President and Chief Financial Officer• Executive Vice President, General Counsel and Secretary• Senior Vice President and Chief Auditor• Senior Vice President and Chief Compliance and Regulatory Officer• Senior Vice President, Total Rewards.
Discretion
All compensation plan design and pay decisions are made within the context of our risk appetite,taking into consideration projected capital ratios as reflected in the annual capital adequacy reportto the board.
The annual incentive plan includes an adjustment for risk if the board believes excessive risk wastaken to achieve the year’s results. The Chief Risk Officer reports on this directly to the executiveand risk committee and human resources committee in their joint meetings.
The board can also use its discretion to:• reduce or withhold payment under the annual incentive plan if our results are significantly
below expectations• not grant mid- and long-term incentive awards at all or to specific individuals• reduce the payout value of previously granted awards when they vest for all or specific
individuals.
KEY POLICIES
Compensation policy
Our compensation policy sets out a pay for performance philosophy that supports our strategic focus, encourages strong corporateperformance and helps the bank create and sustain shareholder value. Among other things, our compensation policy outlines ourapproach to compensation risk oversight in our incentive plan design and funding. It outlines the minimum deferral rates for seniorexecutive and individuals whose roles may have a material impact on the risk profile of our business, as well as our compensationstructure for individuals in control and stewardship functions.
Anti-hedging
To be eligible to receive equity-based awards, executives are required to attest that they will not use personal hedging strategies orcompensation-related insurance to undermine the risk alignment effects embedded in our incentive compensation plans. Allemployees are prohibited from entering short sales, calls and puts with respect to any of our securities.
Insider trading
Executive officers have to pre-clear with our compliance department any trades to buy or sell our securities, including exercising stockoptions. Executives are not allowed to trade during our trading blackout periods.
Clawbacks and forfeitures
Executives will be required to forfeit outstanding incentive awards and repay compensation that has already been paid if there is amaterial misstatement of our financial results, inappropriate risk taking, a breach of compliance rules or our guidelines for businessconduct or inappropriate conduct resulting in significant losses, fines or penalties.
The following can be clawed back:• cash bonuses, commissions or payouts received from the deferred compensation plans• outstanding equity compensation, including PSUs, stock options and DSUs.
52 Scotiabank
EXEC
UTIV
EC
OM
PENSA
TION
3. Decision-making process
Our compensation process involves management, the human resources committee, the executiveand risk committee, advice from third party advisors, and the board for final approval.
All compensation program design and pay decisions are made within the context of our risk appetite.
The Chief Risk Officer regularly reports to the executive and risk committee and identifies anyconcerns. These reports form the basis for the committee’s adjustments to the incentive pools (seepage 52 for more information about how we manage and oversee compensation decisions).
2.Chooseperformancemetrics and annual deliverables
3.Set targetsfor executivecompensation
4.Reviewcorporateperformance
5.Reviewindividualperformance
6.Awardcompensation
1.Review thecompensationprogram
1. Review the compensation program
Management:• reviews the compensation program – how it supports our strategy, and how it compares with
our competitors, using market data, research and perspective from external consultants(including Towers Watson & Co., the Hay Group, Mercer and McLagan Partners Inc.), whichprovide advice and guidance on the design of our plans to management
• presents its recommendations to the human resources committee.
The human resources committee reviews the recommendations together with the executive and riskcommittee, reviews with its independent advisor, and then recommends to the board for approval.
2. Choose performance metrics and annual deliverables
Management determines business performance metrics and weightings for the incentive plans,and sets objectives for the bank overall, each business line and each country. The process includestesting various scenarios to understand performance under different conditions, to make sure theperformance metrics and objectives support our strategy and reflect the bank’s risk appetite(including credit, market, operational, reputational and other risks – see page 28).
The human resource committee reviews the performance metrics with the executive and riskcommittee, and then recommends them to the board for approval.
The President and CEO reviews the annual deliverables that will be used to assess each seniorexecutive’s individual performance, making sure these support our strategy. The President and CEOalso presents his own annual deliverables to the board for approval in the context of our corporategoals and long-term strategy.
3. Set targets for executive compensation
Management develops target compensation and recommended variable pay for the seniorleadership team, including executive vice presidents and above and senior leadership in GlobalBanking & Markets, reviewing comparator compensation data provided by the Hay Group (seepage 49 for information about our compensation comparator group). Target compensation isgenerally set at the median of the market.
The human resources committee:• reviews the target total compensation packages for the senior leadership team in relation to the
comparator group• looks specifically at compensation for key employees who have significant compensation
arrangements or are subject to regulation in different environments• reviews the target total compensation package for the President and CEO with input from its
independent advisor.
Management proxy circular 53
4. Review corporate performance
Management:• assesses performance against the corporate performance metrics to develop a business
performance factor for the incentive plans (see page 61)• carries out stress testing, looking at the amounts accrued to the incentive plans to assess
appropriate use of capital and whether funding of the incentive pool should be adjusted forother concentration risk, off-balance-sheet, liquidity or other potential risk
• makes recommendations to the human resources committee.
The human resources committee:• reviews management’s recommendation, working with the executive and risk committee• makes an adjustment for risk at the recommendation of the Chief Risk Officer• recommends the business performance factor for the incentive plans to the board for approval.
The board can reduce the size of the business performance factor based on its own riskassessment, which reduces the pool. It also has the discretion to reduce the payout to zero if wedeliver results that are significantly below expectations.
5. Review individual performance
The compensation review committee reviews the conduct and compensation of employees whoseroles could have a material effect on risk, and recommends any reductions to the President and CEO.
The President and CEO reviews the performance and compensation of his direct reports:• assesses senior management performance against their annual deliverables• recommends their salary, annual incentive awards and equity incentive awards, taking into
account past performance, future potential and market position• recommends their compensation for the year to the human resources committee.
The committee completes an in depth assessment of the President and CEO’s individualperformance in leading us towards meeting our goals, and setting and executing against our long-term strategy, including:• overall performance• implementation of the President and CEO’s strategies to increase shareholder value• achievement of the President and CEO’s annual deliverables.
6. Award compensation
The human resources committee reviews and finalizes the recommendations for the President andCEO’s direct reports, the executive vice presidents, senior leadership in Global Banking & Markets,other control function heads and UK employees who are governed by the UK Remuneration Code.The board reviews the recommendations and approves the executive compensation decisions.
The human resources committee determines the President and CEO’s target and actualcompensation, which it recommends to the board for approval. The President and CEO is notinvolved in determining his own compensation. The committee reviews reports from managementand the President and CEO’s self-assessment and consults with its independent advisor beforemaking its recommendation to the board.
The committee’s independent advisor prepares a detailed analysis for the committee to reviewwhen making its decisions about President and CEO compensation:
Horizontal benchmarking analysis:• target and actual compensation of the President and CEO’s peers in the compensation
comparator group, and trends and competitive practice in the broader Canadian market
Vertical pay analyses:• a pay ratio comparison of the President and CEO pay package relative to the median Canadian
family income• the President and CEO’s compensation in relation to the bank’s net income
Following these reviews, the committee recommends the President and CEO’s compensation tothe board for approval. Please see page 64 for details about Mr. Porter’s 2014 compensation.
54 Scotiabank
EXEC
UTIV
EC
OM
PENSA
TION
4. Program elements
The executive compensation program includes direct compensation (base salary, and annual, mid-and long-term incentive plans), and indirect compensation (pension, group benefits andperquisites).
Component Purpose FormPerformanceperiod
Pay at riskprofile
Direct compensation
Fixed Base salary Compensates executives for fulfillingtheir day-to-day responsibilities,including leadership and managementskills
cash one year no risk
Variable Annual incentiveplan(page 56)
Rewards executives for meeting annualcorporate objectives (financial and non-financial) and individual annualdeliverables
cashorDSUs that are redeemed forcash when the executiveleaves the bank (see page 57)
one year moderaterisk
Deferredcompensation(see page 58)
Mid-term incentive rewards executivesfor creating sustained shareholder valueover three years and achieving specificcorporate performance objectives
PSUs three years significantrisk
Long-term incentive rewards seniorexecutives for creating sustainedshareholder value over three to tenyears and links their interests to those ofour shareholders
stock options upto 10 years
significantrisk
Global Banking& Marketsincentive plan(see page 59)
Rewards executives in capital marketsfor meeting annual deliverables forGlobal Banking & Markets, with a link tooverall bank objectives
cashanda combination of PSUs andstock options (see deferredcompensation)
one year
three to10 years
moderaterisksignificantrisk
Indirect compensation
Pension Provides an important source ofretirement income
See page 75 for more information
defined benefit plan(contributory or non-contributory membership)
supplemental pension plan(non-registered and unfunded,for some executives)
ongoing no risk
Group benefits Invests in employee health and well-being
Executives participate on the same basisas all other employees
Vary based on level and local market
group life, accidental deathand dismemberment, disabilityand extended health anddental insurance
employee share ownershipplan (Scotiabank matches anadditional 50% up to aspecified limit)
Purpose To reward annual performance in a way that supports our strategic plan
Who participates All eligible employees, including executives(Global Banking & Markets has its own annual incentive plan – see page 59)
How we determinethe award
The amount of the award depends on the executive’s incentive target, the businessperformance factor, and his or her individual performance factor (see below)
Performance factors The business performance factor is calculated using the same financial and non-financial metrics we use to measure our corporate performance:• absolute performance is measured against the objectives in our business plan• relative performance is measured against the banks in our performance
comparator group (see page 49)The individual performance factor depends on the executive’s performanceagainst annual deliverables established at the beginning of the year
Payout CashorDSUs that are redeemed for cash when the executive leaves the bank (see below)
Forfeiture andclawbacks
Can be forfeited or clawed back under certain conditions (see pages 52 and 77 fordetails)
How we determine the award
Base salary ($)Incentive target(% of base salary)
Businessperformancefactor
AnnualIncentiveaward
Individualperformancefactor
minimum: 0cap: 150
X X X =minimum: 0cap: 2.0
minimum: 0cap: 300
Set at the beginning ofthe year.
Varies by job level, localmarket and sometimesthe role.
Determines the size ofthe incentive pool.
Based on ourperformance against thesame financial and non-financial metrics we useto measure our corporateperformance.
The committee can makeadjustments at itsdiscretion.
See Calculating thebusiness performancefactor below for details.
Determines eachexecutive’s share of theincentive pool.
Based on the executive’sperformance againstindividual goalsestablished at thebeginning of the year.
Calculating the business performance factorWe calculate the business performance factor in three steps.
1. Assessperformanceagainst financialmetrics
First we calculate a preliminary performance factor based on performance against financial metrics.
Why it’s importantMeasures customerloyalty and our successat acquiring newcustomers
Strategic focusIncrease shareholdervalue relative to ourpeers
Why it’s importantMeasures ourperformance comparedto the banks in ourperformance comparatorgroup (see page 49)based on:• net income growth• EPS growth• revenue growth• operating leverage
3. Final adjustmentsby the board
Finally, the board carries out a risk assessment with the executive and riskcommittee and the Chief Risk Officer, and assesses the appropriateness ofthe factor.
Risk adjustment
Businessperformancefactor
minimum: 0cap: 150
– =
The board will reduce thefactor if it believesexcessive risk was taken toachieve the year’s results
The board also has thediscretion to adjustthe factor, includingreducing the factor tozero (no payouts) if wedeliver results that aresignificantly belowexpectations
Taking DSUs instead of cash
We allow senior vice presidents and above to defer some or all of their annual incentive by takingit as DSUs instead of cash, as an additional way to align their interests with those of our shareholders.Executives must hold their DSUs until they leave the bank.
How it works:• Executives must decide in the first month of the fiscal year if they want to receive their award in
DSUs instead of cash.• We convert the award to DSUs at the end of the fiscal year using the price of our common shares
on the TSX at the beginning of the year, when the executive made the choice to take the DSUs.This means the executive can lose or benefit, depending how our shares perform over the year.
• DSUs earn additional units as dividend equivalents at the same rate as dividends are paid on ourcommon shares.
• Executives must redeem the DSUs by the end of the calendar year following the year they leave thebank.
Executives who decided to receive their 2015 annual incentive as DSUs will have their awardconverted to DSUs using $68.78, our closing share price on the TSX on November 3, 2014.
How our sharesperformed in 2014
Our share price whenexecutives chose toreceive their 2014 awardin DSUs was $63.70(November 1, 2013 thefirst trading date of fiscal2014).
Our share price was $65.09on December 19, 2014,when we converted theaward to DSUs – a 2.2%increase in value.
Management proxy circular 57
ABOUT DEFERRED COMPENSATION
Purpose To reward strong sustained performance over three to 10 years, and link the interests ofexecutives and shareholders
How we determinethe award
The amount of the award is based on each executive’s sustained performance during theyear, their leadership potential as defined in the bank’s leadership resource plan, andtheir compensation target. The award is forward-looking, so the human resourcescommittee does not consider the value of awards the executive has received in previousyears when it is determining new grants
Form of award Deferred compensation is equity-based and awarded to our named executives as follows:• 70% PSUs (mid-term incentive)• 30% as stock options (long-term incentive)
Forfeiture andclawbacks
Can be forfeited or clawed back under certain conditions (see pages 52 and 77 fordetails)
Mid-term incentive Long-term incentive
Purpose To reward executives for creating sustained shareholder valueover three years and achieving specific corporateperformance objectives
To retain senior executives, reward them for creatingsustained shareholder value over three to ten years, and linktheir interests to those of our shareholders
Who participates Vice presidents and above Senior vice presidents and above
Form of award PSUs
The amount of the award is converted to PSUs on the firstday of an open trading window following the public releaseof our year-end financial results, using the average closingprice of our common shares on the TSX for the 20 daysending on the last trading day before the grant date. PSUsearn dividend equivalents
Stock options
The amount of the award is converted to options on the firstday of an open trading window following the public releaseof our year-end financial results, using the estimatedcompensation value of our common shares on the grant date
The exercise price is either the closing price of our commonshares on the TSX on the trading day prior to the grant date,or the volume weighted average trading price for the fivetrading days immediately preceding the grant date(whichever is higher)
Options cannot be re-priced or exchanged for options with alower price
Options cannot be sold to a third party – they can only betransferred to a beneficiary or legal representative if theholder dies
You can read more about our stock option plan beginning onpage 74
Vesting and payout PSUs, pay out at the end of three years based on ourperformance (see below for details). Vested units are paid outin cash.
The amount the executive receives depends on the number ofunits that vest and our share price at the time of vesting:• the number of units that vest is determined by the
performance factor (see below)• vested units are converted to cash using the average
closing price of our common shares on the TSX for the 20days ending the day before the first day of our insidertrading window following the vesting date
• payments are made by December 31 of the year the unitsvest, and withholding taxes apply
As of December 2014, options vest 50% on the thirdanniversary date of the grant, and 50% on the fourthanniversary date of the grant (options awarded before thisdate vest 25% each year over four years, beginning on thefirst anniversary date of the grant)
Executives can exercise their options after they vest
The amount the executive receives depends on our shareprice at the time they exercise the options.
Options granted before December 2009 may include atandem stock appreciation right (tandem SAR). The holdermay exercise either the option or the tandem SAR for cash,equal to the value of the option gain (tandem SARs are notdilutive).
Withholding taxes and trading fees apply
Options expire after 10 years. If an option’s expiry datefalls during an insider trading blackout period (or within the10 business days after the blackout), it will automatically beextended to 10 business days after the end of the blackoutperiod
58 Scotiabank
EXEC
UTIV
EC
OM
PENSA
TION
How we calculate the performance factor for the mid-term incentiveThe performance factor determines how many units will vest at the end of the three-year period. Itranges from 0 to 150 for executive vice presidents and above.
We calculate it using the same financial metrics we use to measure our corporate performance:• absolute performance is measured against the objectives in our business plan• relative performance is measured against our performance comparator group (see page 49).
Performance factorminimum: 0cap: 150
=+
Absoluteperformance factorThree-year averagereturn on equityweighting: 50%
Objective: increase shareholdervalue balancing risk and return
Why it’s importantMeasures how efficiently weearn profits on behalf of ourshareholders and is a strongindicator of our overall annualperformance.
Objective: increaseshareholder value asmeasured by our shareperformance relative to ourpeers
Why it’s importantMeasures the appreciation inour share price compared toour performance comparatorgroup (see page 49).
The board can use its discretionto adjust the performancefactor up or down, or eliminatethe payout entirely based onits assessment of performanceand risk.
ABOUT THE GLOBAL BANKING & MARKETS INCENTIVE PLAN
Purpose To reward annual performance in a way that supports our strategic plan
Who participates Front office employees in Global Banking & Markets, including the Group Head
How we determinethe award
The amount of the award depends on the individual’s performance, the performance ofthe business line, Global Banking & Markets performance, and compensation for the rolebased on our compensation comparator group (see page 49)
Performancefactors
The incentive pool funding considers the following:• Global Banking & Markets net income before taxes and incentive payments• a funding range based on the percentage of profits that comparator companies in the
market are generally allocating to their incentive pools• senior management’s assessment of the sustainability of each business line’s
performance• the overall performance of the bank using the corporate financial metrics in the
annual incentive plan, which may affect up to 10% of the Global Banking & Marketsannual incentive pool
Risk adjustments The Chief Risk Officer reviews the bonus pool to determine whether additionaladjustments for risk are appropriate, and makes recommendations to the committee. Thecommittee recommends the bonus pool to the board for approval
Payout A combination of cash and deferred compensation, depending on level:
Cash DeferredForm of deferred
compensation
Group Head40% 60%
PSUs (70%)Stock options (30%)
Senior leaders 50% 50% PSUs
Managing directors 60% – 70% 30% – 40% PSUs
Forfeiture andclawbacks
Can be forfeited or clawed back under certain conditions (see pages 52 and 77 for details)
Management proxy circular 59
5. 2014 Compensation decisions2014 TOTAL DIRECT COMPENSATION
Variable compensation 2014
Annualincentive
Deferredcompensation
Total directcompensation
% variable % deferredBase salary
($)Cash
($)PSUs
($)
Stockoptions
($) ($)
Brian Porter 1,000,000 2,370,000 3,850,000 1,650,000 8,870,000 89% 70%
Sean McGuckin 500,000 630,000 1,169,000 501,000 2,800,000 82% 73%
Michael Durland 550,000 2,980,000 3,129,000 1,341,000 8,000,000 93% 60%
Christopher Hodgson 550,000 770,000 1,680,000 720,000 3,720,000 85% 76%
Anatol von Hahn 550,000 710,000 1,470,000 630,000 3,360,000 84% 75%
Please see the executive profiles beginning on page 64 for a detailed discussion of each namedexecutive’s compensation for the year.
Base salaries for Mr. Porter and Mr. McGuckin were increased in 2014 in line with the increase intheir accountabilities compared to 2013. Mr. Porter was appointed President and CEO, andMr. McGuckin’s accountabilities increased when Mr. Marwah, former Vice Chairman and ChiefOperating Officer, retired. The base salaries for the other named executives did not change.
Annual incentive awards are based on the business performance factor and on individualperformance. We discuss the business performance factor below. You will find a discussion of eachnamed executive’s individual performance in the executive profiles.
Deferred compensation (granted as 70% PSUs and 30% stock options) is awarded based on eachexecutive’s sustained performance during the year, their leadership potential as defined in thebank’s leadership resource plan, and their compensation target. See pages 58 and 59 for details.
• The PSUs will vest on November 30, 2017. The amount the executives will receive depends onhow many units actually vest, and our share price. The number of units that vest will bedetermined by the performance factor, which will be calculated based on our absolute returnon equity and relative total shareholder return over the three-year period. Vested units are paidout in cash.
• The options will vest in December of 2017 and 2018, and expire in 2024. Executives will be ableto exercise their options after they vest. The amount they receive will depend on our share priceat the time of exercise.
2014 ANNUAL INCENTIVE AWARD
We use three steps to calculate the all-bank business performance factor for the annual incentive:a factor based on financial metrics, an adjustment based on performance against non-financial andrelative metrics, and a final adjustment by the board for risk and other considerations. You will finda detailed discussion about this process, why we use these metrics and how they are linked to ourstrategy on page 47.
The formulas below show you that the all-bank performance factor this year is 113. This is downfrom 125 last year for the following reasons:• we exceeded our 2014 financial targets for all three financial metrics, but by less than in 2013.
This had the effect of reducing the factor, which you can see in the rating scale below. Ourreturn on equity objective is lower than last year because there was a significant increase inrequired regulatory capital. See page 18 of our annual report for a discussion of our resultscompared to 2013.
• the people metric measures employee engagement against the 2013 employee engagementscore of 47%. This year’s results were 2% above our 2013 results and in the top 10% of thefinancial institutions participating in the independent survey. This put us at the maximumadjustment of +2.5.
• our customer metric measures our performance against customer loyalty targets. This year wemissed our stretch targets in two of our four business lines, although one of the business lineswas very close to achieving its target. This resulted in an adjustment down by -1.5.
60 Scotiabank
EXEC
UTIV
EC
OM
PENSA
TION
• our overall performance relative to our peers was at the average, which resulted in no adjustmentup or down. The comparison was conducted using the adjusted earnings as disclosed by our peers.
• there was also no negative adjustment for risk this year. The Chief Risk Officer led a review of risk-related considerations separate from the mechanisms already embedded in the plans to determine ifany further risk adjustment was required (see page 52 for more about this process), and concludedthat the bank had operated within its risk appetite and no adjustment was required.
1. Performanceagainst financialmetrics Return on equity
102 x 40% 119 x 40% 116 x 20%
EarningsBusinessperformancefactor based onfinancial metrics
112
Operating
=++ per share leverage
Rating scalethreshold
50target
100maximum
150 actual
Return on equity 13.8% 15.34% 16.9% 15.41% � 102
Earnings per share $5.05 $5.31 $5.58 $5.41 � 119
Operating leverage -4.7% 0.3% 5.3% 1.9% � 116
The board can use its discretion to reduce or withhold payment if our results are significantly below expectations.We measured performance for compensation purposes after adjusting for one-time items (see page 42). Theseadjustments impacted both the targets and the results. Adjusted results and related terms are not defined termsunder GAAP and may not be comparable to similar terms used by other financial institutions (see page 80).
People metricBank and business line performancecompared to 2013 employeeengagement score of 47%
1% below2013
top 10% offinancial
institutionsin the survey
1% above2013
top 10% and 2%above 2013
� +2.5
Customer metricBusiness line performance comparedto customer loyalty target
2 or moremiss target
3 of 4meet target
4 of 4meet target
2 of 4 business lines mettarget, 1 close
� -1.5
Rating scale -10 0 +10
Relative performance metricBank performance compared to thebanks in our performancecomparator group (see page 49)
all four metricsrank fourth or
fifth
performancein line with
peers
all four metricsrank first or
second
Performance in line with peersbased on adjusted earnings
they have disclosed:net income growth: 3rd
EPS growth: 3rdrevenue growth: tied 3rd
operating leverage: 1st
� 0
3. Finaladjustmentsby the board Risk adjustment
Business
0
=performancefactor113
–
Management proxy circular 61
PAYOUT OF 2011 PSU AWARDS
The PSUs we awarded to the named executives in 2011 vested on November 30, 2014 (the end ofthe PSU three-year performance period). Payouts were made in December 2014.
The table below shows how we calculated the PSU payout.• The amount the executives received was based on how many units vested, and our share price
at the time of vesting.• The number of units that vested was determined by the performance factor, which was
calculated based on our absolute and relative performance over the three-year period (seebelow for details).
• Dividend equivalents were received as additional units paid at the same rate as dividends paidon our common shares during the vesting period.
• The vesting price was the average closing price of our common shares on the TSX for the20 days ending on December 5, 2014, the day before the first day of our insider tradingwindow following the vesting date.
• The difference between grant value and payout value represents alignment with the experienceof our shareholders since it includes the impact of dividend reinvestment and share pricegrowth since grant, in addition to the performance factor.
Number ofPSUs granted
in 2011
Number ofdividend
equivalentsreceived
TotalPSUs
Performancefactor
%
Vestingprice
($)
Payout valueon vesting
($)
Grantvalue
($)
Differencebetween
grant value andpayout value
Brian Porter 24,866 + 3,144 = 28,010 x 89 x 69.14 = 1,723,593 1,250,000 38%
Sean McGuckin 8,793 + 1,112 = 9,904 x 95 x 69.14 = 650,550 442,000 47%
Michael Durland 42,769 + 5,408 = 48,177 x 89 x 69.14 = 2,964,581 2,150,000 38%
Christopher Hodgson 19,893 + 2,516 = 22,408 x 89 x 69.14 = 1,378,875 1,000,000 38%
Anatol von Hahn 12,134 + 1,534 = 13,669 x 89 x 69.14 = 841,114 610,000 38%
How we calculated the performance factorWe use two steps to calculate the performance factor for the PSU payout: absolute performanceagainst our three-year return on equity targets, and our total shareholder return compared to ourpeers over the three-year period. You will find more information about why we use these metricsand how they are linked to our strategy on page 47.
This year the performance factor is below 100, at 89, because the relative performance factorreduced the impact of the absolute performance factor (see below for details). The combinedresult is that the executives received fewer PSUs, in line with our performance over the three yearssince the original award. Note that our five-year total shareholder return was above the peer groupmedian (see page 70).
Mr. McGuckin’s performance factor is slightly higher because his PSUs were granted when he wasa senior vice president, which has a different performance factor range.
Absolute performance factorThe absolute performance factor is our three-year average return on equity (net income lesspreferred share dividends, expressed as a percentage of average common shareholders’ equity).Return on equity is assessed each year against annual targets, which are in line with the expectedearnings target that goes into the annual incentive plan. Results below threshold are given aperformance factor of 0.
The absolute performance factor uses reported return on equity, as specified when the awardswere granted in 2011. This reflects actual earnings and value created over the medium term, andtherefore has not been adjusted for one-time items that were excluded for annual incentive awardpurposes (see page 42 for 2014 adjustments). As a result, the targets and results for the mid-termawards were higher than those used for annual incentives.
62 Scotiabank
EXEC
UTIV
EC
OM
PENSA
TION
threshold0
minimum50
target100
maximum150 actual
Absoluteperformance
factor(3-year average)
2012 8.7% 15.7% 17.4% 19.1% 19.7% � 150
2013 8.0% 14.3% 15.9% 17.5% 16.4% � 116 128
2014 7.8% 14.0% 15.5% 17.1% 16.1% � 119
The return on equity objective has declined over the three years mainly because of the significant increasein required regulatory capital – our Common Equity Tier 1 ratio is much higher than it was three years ago.
Relative performance factorThe relative performance factor is our total shareholder return compared to our performance comparatorgroup (see page 49). TSR is calculated as the appreciation in our share price plus dividends reinvested overthe three-year period, using the 20-day average closing share price of our common shares on the TSX.
minimum50
(25th percentile of peers)
target100
(50th percentile of peers)
maximum150
(75th percentile of peers) actual
Relativeperformance
factor
Three-year total shareholderreturn 15.5% 17.4% 22.2% 13.7% 50
Absoluteperformance factor Three-year average
return on equity
128 x 50%
Relativeperformance factor Performance factor
89
Three-year relative total
shareholder return
50 x 50%
=+
While the board has the discretion to reduce the calculated performance factor, no adjustment was made.
Management proxy circular 63
BRIAN J. PORTER, PRESIDENT AND CHIEF EXECUTIVE OFFICER
Brian J. PorterToronto, Ontario, Canada
Brian Porter is President and CEO of Scotiabank. He was appointed President in November 2012, andelected to the board of directors in April 2013. He assumed the role of CEO on November 1, 2013.
As President and CEO, Mr. Porter is responsible for defining, communicating and implementingstrategic direction, goals and core values for Scotiabank that maximize long term shareholder value andreturn, and meet the needs of the Bank’s other key constituents: employees, customers andcommunities. He is accountable to the board for the development and execution of the bank’s strategy,compliance with all governance and regulatory requirements, and the overall financial performance ofScotiabank.
2014 Performance
The bank has made significant strides under the first year of Mr. Porter’s leadership as President andCEO in advancing our focus priorities: being more focused on our customers, enhancing our leadershipdepth, diversity and deployment, and being better organized to serve our customers and reducestructural costs.
The board agreed on a number of performance commitments at the beginning of the year. This year Mr. Porter:• strategically monetized our investment in CI Financial Corp., generating a gain of $555 million for the bank• strengthened and re-shaped our leadership team• continued to build greater diversity in the bank’s leadership pipeline, including increasing the proportion of women at the vice
president level and above to 27% (32% in Canada, U.S. and Europe were women, and 12% in other international locations)• re-aligned our wealth, insurance and global transaction banking businesses by integrating these operations within the other
three business lines, simplifying our operating model and bringing decision-making closer to our customers• restructured certain operations to improve our operational efficiency and to get closer to the customer• consolidated our corporate and commercial lending businesses in Asia with the rest of wholesale banking in Global Banking &
Markets, better aligning management with our customers• sharpened our focus on the four Pacific Alliance countries of Mexico, Peru, Colombia and Chile.
Highlights of our reported financial results are presented below. After adjusting results for one-time items, net income grew by 7%and diluted earnings per share for compensation purposes increased by 7%. Our return on equity results are lower in 2014,primarily due to higher regulatory capital requirements.
2014 2013 Change
Total revenue $23,604 million $21,299 million +11%
Net income $7,298 million $6,610 million +10%
Return on equity 16.1% 16.6% -50 basis points
Diluted earnings per share $5.66 $5.11 11%
2014 Compensation
2014 2013
2014Compensation mix
Base salary 11%Annual incentive 27%Mid-term incentive 43%Long-term incentive 19%
89% of his compensation is variable and not g
uara
ntee
d
(as President and CEO) (as President)
Actual Target Actual
Base salary $1,000,000 $1,000,000 $800,000
Annual incentive award $2,370,000 $1,500,000 $1,250,000
Mid-term incentive award - 70% PSUs $3,850,000 $3,000,000Long-term incentive award - 30% stock
Total direct compensation $8,870,000 $8,000,000 $7,050,000
Mr. Porter’s total direct compensation in 2014 is 26% higher than 2013 and 11%higher than his 2014 target. Just over half of the increase in total compensation is dueto the increase in his salary and target incentives commensurate with his appointmentas President and CEO, and the remaining amount is the result of his strongperformance, as noted above. In 2014 we reduced options from 40% to 30% of totaldeferred compensation.
64 Scotiabank
EXEC
UTIV
EC
OM
PENSA
TION
Annual incentiveMr. Porter’s annual incentive award was higher than both his target and last year’s award for the following reasons:• his target was increased to 150% of salary, in line with the change in his role, as noted above. This, combined with the increase
in salary, increased the amount of his target from $1,000,000 to $1,500,000• the all-bank performance factor was lower than 2013, which brought the award down (it was 113 this year compared to 125 in
2013 – see page 61 for details)• his individual contribution, growth in his new role, and the achievement of his performance commitments, as described above.
Deferred compensationMr. Porter’s deferred compensation was 10% higher than 2013, and at his target for the year. The award was based on the highertarget in line with his change in role, as noted above, his sustained performance and his leadership in helping achieve the bank’sstrategic goals. 70% of his variable compensation was deferred.
Share ownership (as at December 31, 2014)
Values are based on $66.31, the closing price of our common shares on the TSX on December 31, 2014.
Common shares DSUs PSUs Total valueAs a multipleof base salary
CEO compensation awarded vs. realizable and realized pay
The table below compares the compensation awarded to our CEO over the past five years (Richard Waugh from 2010 to 2013 andBrian Porter in 2014) and the value realized or realizable as at December 31, 2014.
We also compare the compensation values to the value earned by shareholders, indexed at $100 to show a meaningful comparison.
Overall, the value that shareholders have received over the last five years has exceeded the CEO’s realized or realizablecompensation. The realized and realizable value includes salary and cash annual incentive payments, the value at vesting of shareunits granted and current value of units that are outstanding, the value of stock options exercised during the period and the valueof outstanding stock options that are in-the-money. The values in this table can vary significantly from year to year based onchanges in share price movement and the timing of vesting and exercise.
Compensationawarded1
($ millions)
Compensation realizedand realizable as atDecember 31, 2014
($ millions) Period
Value of $100
Waugh/Porter2 Shareholder3
2010 10.7 11.4 Oct 31, 2009 to Dec 31, 2014 107 178
2011 10.6 14.5 Oct 31, 2010 to Dec 31, 2014 137 142
2012 11.1 12.8 Oct 31, 2011 to Dec 31, 2014 115 142
2013 11.1 8.8 Oct 31, 2012 to Dec 31, 2014 79 132
2014 8.9 7.1 Oct 31, 2013 to Dec 31, 2014 80 109
Average 104 141
1. Includes salary received during the year and variable compensation awardedat year-end for performance during the year.
2. The compensation realized or realizable by Mr. Waugh or Mr. Porter for each$100 awarded in total direct compensation during the fiscal year indicated.
3. The cumulative value of a $100 invested in Scotiabank common shares on thefirst trading day of the period indicated, assuming reinvestment of dividends.
Management proxy circular 65
SEAN D. MCGUCKIN, EXECUTIVE VICE PRESIDENT AND CHIEF FINANCIAL OFFICER
Sean McGuckin is Scotiabank’s Executive Vice President and Chief Financial Officer. He was appointedto this role in 2012 and assumed additional responsibilities including real estate, economics andcorporate insurance in 2014, when Mr. Marwah, the Vice Chairman and Chief Operating Officer,retired.
He is responsible for ensuring financial strategies are developed and integrated across theorganization, and partners with the executive team to develop enterprise-wide strategies to supportthe bank’s goal of delivering strong, consistent and predictable earnings to our shareholders over thelong term. He is also accountable for establishing and directing the bank’s capital managementprocesses, providing financial management oversight and oversight of operational functions withinfinance.
Sean D. McGuckin, CPA, CAMississauga, Ontario, Canada
2014 Performance
Scotiabank continued to deliver against its strategic objectives this year under Mr. McGuckin’s leadership in the following notableways:• enhanced our business optimization processes to perform deeper analysis of balance sheet usage and capital investment criteria• completed the first phase of a management systems implementation and delivered a future roadmap designed to drive deeper
analytical capabilities and greater efficiencies• contributed to the achievement of the bank’s strategy by providing support to several key acquisitions, divestitures and
partnerships including Aurion Capital Management, Cencosud S.A., CI Financial Corp., and Canadian Tire Financial Corporation• developed a robust cost/benefit framework for capital expenses to drive more informed resource allocation decisions• built an enterprise view of structural cost reduction initiatives.
2014 Compensation
2014 2013
2014Compensation mix
Base salary 18%Annual incentive 23%Mid-term incentive 42%Long-term incentive 18%
82% of his compensation is variable and not g
uara
ntee
d
Base salary $500,000 $400,000
Annual incentive award $630,000 $600,000
Mid-term incentive award - 70% PSUs $1,169,000 $870,000Long-term incentive award - 30% stock options $501,000 $580,000
= Deferred compensation $1,670,000 $1,450,000
Total direct compensation $2,800,000 $2,450,000
Mr. McGuckin’s total compensation in 2014 is 14% higher than 2013. This increase isthe result of the increase in his accountabilities with the retirement of Mr. Marwah, hisstrong performance and the increase in his salary and deferred compensation in linewith his continued growth in his role as Executive Vice President and Chief FinancialOfficer.
Annual incentiveMr. McGuckin’s annual incentive award was 5% above last year’s award for the following reasons:• his salary was higher in 2014, as noted above, which increased the amount of his target incentive• the all-bank performance factor was lower than 2013, which brought the award down
(it was 113 this year compared to 125 in 2013 – see page 61 for details)• his individual contribution and the achievement of his annual goals, as described above.
Deferred compensationMr. McGuckin’s deferred compensation was 15% higher than 2013. The award was based on his target range, his sustainedperformance and his leadership in helping achieve the Bank’s strategic goals. 73% of his variable compensation was deferred.
Share ownership (as at December 31, 2014)
Values are based on $66.31, the closing price of our common shares on the TSX on December 31, 2014.
Common shares DSUs PSUs Total valueAs a multipleof base salary
J. MICHAEL DURLAND, GROUP HEAD, GLOBAL BANKING & MARKETS
J. Michael DurlandToronto, Ontario, Canada
Michael Durland is Group Head and CEO, Global Banking & Markets. He was appointed Co-CEO in2008 with specific responsibility for the global capital markets business, and assumed full responsibilityfor the business line on May 1, 2014.
He is responsible for defining and implementing the strategic direction, goals and values for GlobalBanking & Markets in line with the bank’s strategy. This includes optimizing business opportunities,managing risk and maximizing shareholder value globally for the bank’s wholesale financial servicesoperations.
Mr. Durland’s role was expanded again on November 1, 2014 to include Global Transaction Banking,on Christopher Hodgson’s retirement.
2014 Performance
Global Banking & Markets performance was slightly higher than 2013, with revenue at a record high.Adjusted for notable items net income was 2% higher than 2013. Our reported results for GlobalBanking & Markets are presented below:
2014 2013 change
Total revenue $3,813 million $3,580 million +7%
Net income $1,459 million $1,455 million 0%
Return on economic equity 30.4% 27.6% +280 basis points
The business line also made solid progress toward achieving its strategic objectives under Mr. Durland’s leadership:• achieved record revenues in several key business units, including investment banking and Canadian lending• exceeded its global non-lending revenue targets by almost $100 million• achieved its customer cross-sell goals for product per client connection in both Canada and Mexico• acted as the exclusive financial advisor in several large multi-billion dollar transactions, such as Fortis Inc.’s acquisition of
UNS Energy Corporation• ranked #1 on the Canadian equity league tables (Bloomberg)• continued to successfully manage its operational and market risks – Global Banking & Markets remained well within its key
trading risk governance parameters such as value at risk and stress test limits, and operational losses were well within riskappetite parameters.
2014 Compensation
2014 2013
2014Compensation mix
Base salary 7%Annual incentive 37%Mid-term incentive 39%Long-term incentive 17%
Mr. Durland’s total compensation for 2014 is 3% higher than it was in 2013, reflectingthe business unit’s performance and the expansion of his role on May 1, 2014 toinclude the entire business line.
Incentive awardMr. Durland participates in the Global Banking & Markets Incentive Plan (see page 59), which he is required to take as 40% cash,42% PSUs and 18% stock options. His award was 3% higher than last year’s award for the following reasons:• his individual contribution and achievement of his annual goals, as described above, and the performance of Global Banking &
Markets and the bank overall• a higher target range than 2013, in line with the increase in his accountabilities.
Salary for 2015Mr. Durland’s salary was increased to $600,000 effective November 1, 2014 to recognize his expanded accountabilities with theintegration of global transaction banking into Global Banking & Markets.
Share ownership (as at December 31, 2014)
Values are based on $66.31, the closing price of our common shares on the TSX on December 31, 2014.
Common shares DSUs PSUs Total valueAs a multipleof base salary
Meets shareownership
requirement
$3,553,951 $0 $8,786,593 $12,340,544 22x yes
Management proxy circular 67
CHRISTOPHER J. HODGSON, GROUP HEAD, GLOBAL WEALTH & INSURANCE
Christopher J. HodgsonToronto, Ontario, Canada
Christopher Hodgson was Group Head, Global Wealth & Insurance from 2010 until October 31, 2014.On November 1, 2014, he transitioned into an advisory role as the wealth and insurance businesseswere integrated into Canadian Banking and International Banking, and global transaction banking wasintegrated into Global Banking & Markets. He will retire from the bank on February 28, 2015.
As Group Head, Global Wealth & Insurance, Mr. Hodgson was responsible for defining andimplementing the strategic direction, goals and values of global wealth management, insurance andglobal transaction banking, in line with the bank’s strategy. This included managing businessopportunities, managing risk and maximizing the long-term shareholder value of operations aroundthe world in asset management, wealth distribution, insurance, and global transaction banking.
2014 Performance
Global Wealth & Insurance had a solid year in 2014, moderately exceeding its annual targets. Afteradjusting results for the sale of the bank’s investment in CI Financial Corp. and the restructuringcharge, net income grew by 13% this year. Our reported results for Global Wealth & Insurance arepresented below:
2014 2013 change
Total revenue $5,056 million $3,996 million +26%
Net income $1,831 million $1,207 million +52%
Return on economic equity 28.2% 16.7% +1150 basis points
The business line also made solid progress toward achieving its strategic objectives under Mr. Hodgson’s leadership:• monetized a significant portion of our investment in CI Financial Corp., resulting in an after tax gain of $555 million for the bank• expanded institutional asset management by acquiring the remaining Aurion Capital Management shares• achieved record net sales for ScotiaFunds through the Canadian Banking channel for second straight year• launched 14 new products in Dynamic Funds and 22 new funds launched across Latin America and the Caribbean• expanded insurance distribution footprint in Canada and the English Caribbean.
2014 Compensation
2014 2013
2014Compensation mix
Base salary 15%Annual incentive 21%Mid-term incentive 45%Long-term incentive 19%
85% of his compensation is variable and not guaran
teed
Base salary $550,000 $550,000
Annual incentive award $770,000 $850,000
Mid-term incentive award - 70% PSUs $1,680,000 $1,440,000Long-term incentive award - 30% stock options $720,000 $960,000
= Deferred compensation $2,400,000 $2,400,000
Total direct compensation $3,720,000 $3,800,000
While Global Wealth & Insurance financial results were moderately above target and inline with 2013, all-bank performance was lower than last year. As a result,Mr. Hodgson’s total compensation is 2% lower than 2013.
Annual incentiveMr. Hodgson’s annual incentive award was 9% below last year’s award for the following reasons:• the all-bank performance factor was lower than 2013, which brought the award down (it was 113 this year compared
to 125 in 2013 – see page 61 for details) and the performance of Global Wealth & Insurance• his individual contribution and achievement of his annual goals, as described above.
Deferred compensationMr. Hodgson’s deferred compensation was the same as 2013. The award was based on his target range, his individual contribution,progress toward achieving Global Wealth & Insurance’s strategic goals, his sustained performance and his leadership in helpingachieve the bank’s strategic goals. 76% of his variable compensation was deferred.
Share ownership (as at December 31, 2014)
Values are based on $66.31, the closing price of our common shares on the TSX on December 31, 2014.
Common shares DSUs PSUs Total valueAs a multipleof base salary
Meets shareownership
requirement
$506,675 $2,591,099 $4,710,652 $7,808,426 14x yes
68 Scotiabank
EXEC
UTIV
EC
OM
PENSA
TION
ANATOL VON HAHN, GROUP HEAD, CANADIAN BANKING
Anatol von HahnToronto, Ontario, Canada
Anatol von Hahn is the Group Head, Canadian Banking. He was appointed to this role in 2010.
He is responsible for defining and implementing strategic direction, goals and values for CanadianBanking and the shared services group, in line with the bank’s strategy. This includes managing businessopportunities, managing risk and maximizing the long-term shareholder value of our personal banking,small business banking, and commercial banking businesses in Canada.
Effective November 1, 2014, Mr. von Hahn’s role was expanded to include the Canadian wealth andinsurance businesses, which were previously under Christopher Hodgson’s leadership withinGlobal Wealth & Insurance.
2014 PerformanceCanadian Banking performed well in 2014, moderately exceeding its annual targets. Our return oneconomic equity results are lower in 2014, in part due to notable items recorded in 2014. Adjusting fornotable items net income was 5% higher than last year. Our reported results for Canadian Banking arepresented below:
2014 2013 change
Total revenue $7,436 million $6,973 million +7%
Net income $2,188 million $2,151 million +2%
Return on economic equity 31.0% 33.4% -240 basis points
The business line also made solid progress toward achieving its strategic objectives under Mr. von Hahn’s leadership:• became the first Canadian bank to launch sales capabilities in our mobile banking channel• successfully closed a strategic partnership with Canadian Tire Corporation, which includes a 20% equity interest in Canadian Tire
Financial Services and becomes the exclusive provider of new financial products to Canadian Tire customers• achieved double-digit growth in credit cards• continued to lead the automotive lending space with double digit asset growth• successfully completed the rebranding of ING Direct to Tangerine, which continued to be ranked “Highest in Customer
Satisfaction Among the Midsize Retail Banks” by J.D. Power and Associates.
2014 Compensation2014 2013
2014Compensation mix
Base salary 16%Annual incentive 21%Mid-term incentive 44%Long-term incentive 19%
84% of his compensation is variable and not guaran
teed
Base salary $550,000 $550,000
Annual incentive award $710,000 $915,000
Mid-term incentive award - 70% PSUs $1,470,000 $1,200,000Long-term incentive award - 30% stock options $630,000 $800,000
= Deferred compensation $2,100,000 $2,000,000
Total direct compensation $3,360,000 $3,465,000
While Canadian Banking financial results were good, they did not exceed plan by asmuch as they had in 2013, which was an exceptionally strong year. As a result,Mr. von Hahn’s total compensation in 2014 is 3% lower than 2013.
Annual incentiveMr. von Hahn’s annual incentive award was 22% below last year’s award for the following reasons:• the all-bank performance factor was lower than 2013, which brought the award down (it was 113 this year compared to 125 in
2013 – see page 61 for details) and the lower performance of Canadian Banking relative to target• his individual contribution and achievement of his annual goals, as described above.
Deferred compensationMr. von Hahn’s deferred compensation was 5% higher than 2013. The award was based on his target range, his individualcontribution, progress toward achieving Canadian Banking’s strategic goals, his sustained performance and his leadership in helpingachieve the Bank’s strategic goals. 75% of his variable compensation was deferred.
Salary for 2015Mr. von Hahn’s salary was increased to $600,000 on November 1, 2014 to recognize his expanded accountabilities with theintegration of the wealth and insurance businesses into Canadian Banking.
Share ownership (as at December 31, 2014)
Values are based on $66.31, the closing price of our common shares on the TSX on December 31, 2014.
Common shares DSUs PSUs Total valueAs a multipleof base salary
Meets shareownership
requirement
$81,129 $6,000,320 $3,861,206 $9,942,655 18x yes
Management proxy circular 69
6. Share performance and cost of management
SHARE PERFORMANCE
The graph compares our share performance to our peergroup, the Canadian stock market and total compensationawarded to our named executives for the past five yearsending October 31, 2014. The total compensation awardedto our named executives gradually increased over the firstfour years in line with increased shareholder returns. Theaggregate amount decreased in 2014 due to lower overallbank performance as well as the change in the namedexecutives.
For comparison purposes, total shareholder return assumes:• $100 was invested in Scotiabank common shares on
November 1, 2009 and dividends were reinvested over thefive-year period
• $100 was also invested for each company in our peergroup and dividends were also reinvested over the sameperiod (the graph shows the peer group median)
• $100 was invested in the S&P/TSX Composite Index on thesame date and dividends were also reinvested.
Total compensation(named executives)
Tota
l sha
reho
lder
ret
urn
($)
2009
2010
2011
2012
2013
2014
0
50
100
150
200
Scotiabank TSR Peer group median TSR
S&P/TSX Composite Index
Our peer group includes Bank of Montreal, CIBC, Royal Bank of Canada, TD Bank, Manulife Financial, Sun Life Financial and PowerFinancial Corporation (see page 49 for more information about our performance comparator group).
We have indexed total compensation to $100 for comparison purposes. It includes base salary, the annual incentive plus the grantvalue of PSU and stock option awards for the top five named executives for the past five years (as disclosed in our circular for prioryears).
2009 2010 2011 2012 2013 2014
Scotiabank TSR $100 $125 $125 $134 $164 $185
Peer group median TSR $100 $118 $109 $117 $153 $177
S&P/TSX Composite Index $100 $119 $118 $124 $137 $155
Total compensation paid to our named executives $100 $102 $102 $107 $114 $ 96
COST OF MANAGEMENT
Cost of management is a measure we and the other major Canadian financial institutions use to show how corporate performancecompares to compensation awarded to our most senior officers. We calculate the ratio by dividing total compensation awarded toour named executives by net income after tax for each of the last five years:• total compensation includes salary, annual incentive, the grant value of PSUs and stock options, the compensatory portion of the
change in the accrued pension obligation in the year, and all other compensation as reported in the summary compensationtable (the 2013 figure only includes the total compensation for the top five named executives for comparison purposes althoughsix named executives were disclosed in our circular last year).
• net income after tax is net income reported in the consolidated statement of income for the each of the last five fiscal years. Itreflects the impact of new accounting standards we adopted as of November 1, 2010 (see note 4 to our consolidated financialstatements).
Total compensationawarded to
named executives($ millions)
Net income after tax($ millions)
Cost of management(%)
2014 28.5 7,298 0.39%
2013 34.1 6,610 0.52%
2012 32.6 6,390 0.51%
2011 30.7 5,330 0.58%
2010 31.5 4,339 0.73%
70 Scotiabank
EXEC
UTIV
EC
OM
PENSA
TION
2014 Executive compensation details
SUMMARY COMPENSATION TABLE
The table below shows the total compensation each named executive earned in the last three fiscal years.We report the share and option awards granted after the end of the fiscal year to reflect decisions madeduring the 2014 compensation review, rather than awards granted at the outset of fiscal 2014 from the2013 compensation review. We do not offer long-term non-equity incentive plan compensation to ournamed executives.
Named executive Year
Fiscalsalary
($)
Shareawards3
($)
Optionawards4
($)
Annualincentive
plan5
($)
Pensionvalue6
($)
All othercompensation7
($)
Totalcompensation
($)
Brian J. Porter1 2014 1,000,000 3,850,000 1,650,000 2,370,000 1,385,000 1,242 10,256,242President and Chief Executive 2013 800,000 3,000,000 2,000,000 1,250,000 (149,000) 1,242 6,902,242Officer (as of November 1, 2013) 2012 550,000 1,600,000 1,600,000 770,000 106,000 1,196 4,627,196
Sean D. McGuckin 2014 500,000 1,169,000 501,000 630,000 83,000 1,242 2,884,242Executive Vice President and 2013 400,000 870,000 580,000 600,000 84,000 1,242 2,535,242Chief Financial Officer 2012 309,167 500,000 500,000 410,000 373,000 1,196 2,093,363
J. Michael Durland2 2014 550,000 3,129,000 1,341,000 2,980,000 – – 8,000,000Group Head and CEO, 2013 550,000 2,601,000 1,734,000 2,890,000 – – 7,775,000Global Banking & Markets 2012 550,000 2,310,000 2,310,000 3,080,000 – – 8,250,000
1. Mr. Porter became President on November 1, 2012, and President and ChiefExecutive Officer on November 1, 2013.
2. Mr. Durland became Group Head and CEO, Global Banking & Markets onMay 1, 2014. Before May 1, 2014, Mr. Durland was Group Head and Co-CEOGlobal Banking & Markets.
3. For compensation purposes, we value PSU awards using the 20-day averageclosing price of our common shares at the time of grant to smooth out short-term aberrations in the share price. The accounting fair value is based on theclosing price of our common shares on the TSX on the grant date. 100% of thepayout value of the PSU award is based on performance criteria on vesting (seepage 59 for details).
Grant dateGrant date
fair valueAccounting
fair value
2014 December 8, 2014 $69.14 $65.072013 December 9, 2013 $65.18 $64.212012 December 10, 2012 $54.53 $55.94
4. We use the Black-Scholes model to value option awards.
Compensation fair value is different than the accounting fair value disclosed inour financial statements because different assumptions are used.
We estimate the fair value of option awards on the grant date using thefollowing assumptions, which result in less dilution than the accountingassumptions:
TermShare price
volatilityDividend
yieldRisk free
rate
2014 10 years 23.0% 3.68% 2.07%2013 10 years 23.2% 3.59% 2.46%2012 10 years 23.5% 3.47% 2.23%
The assumptions used to calculate the accounting fair value of the optionawards are different in two ways:• we used an expected life of 6.3 years, instead of the full term of 10 years, in
accordance with IFRS 2, Share-based Payment• we based volatility on historic and implied volatility and the current dividend
yield.
The accounting fair value of the 2014 stock option awards is approximately 30%less than the compensation value shown in the summary compensation table,20% less for 2013 and 16% less for 2012. As the compensation fair value isgreater, we award fewer options than if we had used the accounting fair value.The table below shows the differences in the compensation and accounting fairvalues as a percentage of the grant price.
Grant dateGrantprice
Compensation fair value(as a % of the grant price)
Accounting fair value(as a % of the grant price)
2014 December 8 $68.32 16.0% 11.2%2013 December 9 $63.98 17.5% 14.1%2012 December 10 $55.63 17.5% 14.6%
5. Annual incentive plan is the annual cash incentive (non-equity incentive plancompensation) earned by the named executives. Mr. Hodgson and Mr. von Hahnchose to defer a percentage of their annual incentive and receive DSUs insteadof cash.
6. Pension value is the compensatory change described on page 76. The decreasein net pension value for Mr. Porter in 2013 was a result of freezing his priorretirement arrangement as of October 31, 2013.
7. All other compensation includes perquisites and other taxable benefits. Theytotal less than $50,000 and 10% of the salary of each named executive andtherefore are not disclosed.
The amounts shown are Scotiabank’s contribution to ESOP. These namedexecutives participate in the plan on the same terms as our other employees.Employees can purchase our common shares and the bank contributes anadditional 50% to the purchase up to specified limits.
Amounts in this column do not include dividend equivalents earned on PSUawards because dividends are factored into the fair value calculation at the timeof grant.
Management proxy circular 71
INCENTIVE PLAN AWARDS
Outstanding share and option awards at December 31, 2014
The table below includes awards made in December 2014 after our fiscal year-end of October 31, 2014:• the value of unexercised in-the-money options equals the closing price of our common shares on
December 31, 2014 ($66.31) minus the exercise price of the option awards, multiplied by the number ofoutstanding options
• the value of the PSU awards that have not vested equals the closing price of our common shares onDecember 31, 2014, multiplied by the number of units outstanding. We valued the PSUs using theperformance at target (factor of 100%), however, the number of PSUs that may vest can range from 0%to 150% of target. There are no vested PSUs outstanding.
Total 501,514 6,499,273 58,230 3,861,206 90,489 6,000,320
1. These named executives chose to receive a percentage of their short-term incentive as DSUs. All of these DSUs have vested.
72 Scotiabank
EXEC
UTIV
EC
OM
PENSA
TION
Value vested or earned during the year
The table below shows the following for each named executive:• the total value that would have been realized on vesting of stock options in 2014
if the options had been exercised on the vesting date• the value of share awards received on vesting in 2014• the annual incentive compensation awards earned for 2014
We report the option-based and share-based awards most recently vested, rather than 12 months in arrears.
Option-based awards –Value vested during the year ($)
Share-based awards –Value vested during the year ($)
Annual incentivecompensation –
Value earned during the year ($)
Brian Porter 1,191,537 1,723,593 2,370,000
Sean McGuckin 265,796 650,550 630,000
Michael Durland 1,938,531 2,964,581 2,980,000
Christopher Hodgson 907,881 1,378,875 770,000
Anatol von Hahn 587,080 841,114 710,000
Option-based awards include the total value of stock options that vested in 2014 (25% of the options granted on each of the datesshown in the table below). The value equals the number of options that vested times the difference between the option exerciseprice and the closing share price on the vesting date.
Grant date Exercise price Vesting date Closing share price on vesting date
December 6, 2010 $55.63 December 6, 2014 $66.20 (Closing price from previous business day.)
December 5, 2011 $49.93 December 5, 2014 $66.20
December 10, 2012 $55.63 December 10, 2014 $64.11
December 9, 2013 $63.98 December 9, 2014 $65.38
Share-based awards include the value of PSUs that vested in 2014, and include dividend equivalents. Their realized value on vestingequals the number of units vested times the performance factor times the vesting price (the average closing price of our commonshares on the TSX for the 20 days ending on the vesting date).
Vesting date Performance factor Vesting price
December 5, 2014 89% $69.14
See page 62 for information about how we calculated the PSU performance factor.
Options exercised in 2014 (voluntary disclosure)
Grant date Number of options Exercise price Realized value
Brian Porter 12/02/05 70,396 $46.02 $1,736,910
Sean McGuckin 12/03/04 6,540 $39.00 $168,881
Christopher Hodgson 12/13/06 40,680 $52.00 $529,274
12/11/07 56,276 $52.57 $1,030,943
12/05/08 45,000 $33.89 $1,727,615
Anatol von Hahn 12/03/04 9,540 $39.00 $290,970
Securities authorized for issuance under equity compensation plans as at October 31, 2014
Shareholders must approve all of our stock option plans.
Other important things to note:• We stopped granting stock options to directors as of October 28, 2003.• When we acquired HollisWealth Inc. (formerly DundeeWealth) on February 1, 2011, HollisWealth stock options were converted
to 1,293,308 options based on the price of our common shares on February 1, 2011. The number of options and exerciseprices are the sum and weighted average of our common shares to be issued for stock options granted under their corporateand advisor share incentive plans. We do not plan to issue any new stock options under the HollisWealth equitycompensation plans.
• The HollisWealth share bonus plans allowed their common shares to be issued from treasury or purchased in the market. Bonusshares under these plans were converted to Scotiabank common shares to be issued from treasury. We will not be issuing newbonus shares under the HollisWealth equity compensation plans.
See note 29 to our 2014 consolidated financial statements for more information.
Management proxy circular 73
As at October 31, 2014 Securities to be issued upon exercise
Securities remaining forfuture issuance under equity
compensation plans
Securities to be issued uponexercise plus available for
issuance
Equity compensation plans #
% ofoutstanding
common shares
Weightedaverage
price #
% ofoutstanding
common shares #
% ofoutstanding
common shares
Stock option plan 22,775,840 1.87% $51.64 12,555,812 1.03% 35,331,652 2.90%
1. Effective November 1, 2013, DundeeWealth Inc. was renamed HollisWealth Inc.2. 24,351,820 as at January 31, 2015.3. $52.84 at January 31, 2015.4. 11,227,711 as at January 31, 2015.
See note 29 to our 2014 consolidated financial statements for more information.
About dilution, overhang and burn rate
Shareholders approve the number of shares that can be issued under the stock option plan, which is less than 10% of ouroutstanding common shares. In April 2011, shareholders approved an increase of 15 million common shares available for issueunder the stock option plan.
The table below shows the key details about the stock option plan and the director stock option plan (which is no longer active),but does not include HollisWealth stock options.
The human resources committee and the board have been reviewing our use of stock options in our compensation program andhow we align with the market. In 2013 the committee adjusted the allocation of mid- and long-term incentives to 40% options and60% PSUs from 50/50 previously. It introduced further changes with the 2014 grants, further reducing the weighting of options to30% for executive vice presidents, to 25% for senior vice presidents, and eliminating option awards altogether for vice presidents.
These changes have had a marked effect on our burn rate, reducing it from 0.33% in 2013 to 0.27% in 2014, and it is expected tofurther reduce in fiscal 2015.
2014 2013 2012
DilutionTotal number of options outstanding divided by total number of common shares outstanding 1.9% 1.9% 1.9%
OverhangTotal number of options available for issue plus options outstanding, divided by total number of common sharesoutstanding 2.9% 3.2% 3.5%
Burn rateTotal number of options issued in a fiscal year, divided by total number of common shares outstanding 0.27% 0.33% 0.32%
About the stock option plan• Stock options granted before December 2009 may include a tandem stock appreciation right (tandem SAR) feature, which gives
the grant holder the choice of either:• exercising the option by purchasing Scotiabank common shares at the grant price and either holding or selling the shares, or• exercising the tandem SAR and receiving a cash payment that is the difference between the exercise price and the market
price of our common shares on the date of exercise. The holder receives the same value as he or she would receive bypurchasing shares and immediately selling, but as no shares actually change hands, the stock is not diluted
• if the option is exercised, the tandem SAR is cancelled and vice versa• We do not have significant share dilution but we did issue 12 million shares related to acquisitions, equity-based compensation
and under the share dividend and share purchase plans• Other features of the plan:
• we have insider participation limits• our general loan policies apply to employees to borrow at customer rates to buy common shares for option exercises• we grant stand-alone SARs in select countries outside of Canada, where local laws may restrict the issuance of shares.
74 Scotiabank
EXEC
UTIV
EC
OM
PENSA
TION
Limits• No one can be granted stock options to purchase more than 5% of our total number of issued and outstanding common shares
on a non-diluted basis at any time• No more than 10% of our total common shares outstanding can be issued to insiders for the exercise of options in any year –
this limit applies to the stock option plan and any other security based compensation arrangement• Adjustments can be made to options in proportion to adjustments made to our common shares for certain events, like a
subdivision, consolidation, reorganization, reclassification or other event that requires adjustments to be made
Making changesShareholders must approve any increase to the maximum number of shares that may be issued under the plan or other changes tothe plan design.
The board can make the following changes to the plan without shareholder approval:• changes of an administrative or a housekeeping nature• terms, conditions and mechanics of granting stock option awards• changes to vesting, exercise or early expiry• amendments that are designed to comply with the law, tax or accounting provisions, or regulatory requirements.
RETIREMENT BENEFITS
Scotiabank pension plan
Type of plan defined benefit
Participation employees, non-contributory or contributory
Terms Non-contributory• members earn 1.5% of their highest five-year average base salary for each year of service, less the estimated
pension payable under the Canada/Quebec Pension Plan
Contributory• members contribute 4% of their base salary up to a maximum of $3,500 each calendar year and earn an annual
pension equal to 2% of their highest five-year average base salary for each year of service, less the estimatedpension payable under the Canada/Quebec Pension Plan
• annual pension benefits are capped at the maximum pension limit under the Income Tax Act (Canada)
Annual pension benefits • the retirement pension is paid for life• if there is a surviving spouse, he or she receives 60% of the member’s pension for life
Eligibility • full pension begins at age 65, the normal retirement age (age 63 if hired before 1983)• members can receive a reduced pension at age 55 (age 53 if hired before 1983)
The Scotiabank Pension Plan is our primary pension plan in Canada. All of the named executives are participants exceptMr. Durland, whose service from past participation in the plan is frozen.
Supplemental pension plan
We have individual retirement agreements with certain executives, including the named executives, to provide a non-registered,unfunded supplemental pension. We are, however, discontinuing the use of individual retirement agreements for future executives,except for the CEO. Supplemental pension arrangements for all new executive officers are now covered by the Scotiabank ExecutivePension Plan.
The pension accrual under the Scotiabank Executive Pension Plan is calculated substantially the same as under the ScotiabankPension Plan in the absence of income tax limits, except that a portion of incentive compensation is included.
For executives appointed on or before April 7, 2010, retirement benefits are capped at 70% of the highest average five-yearcompensation.
For executives appointed after April 7, 2010, in addition to retirement benefits being capped at 70% of the highest averagefive-year compensation:• the incentive compensation recognized is capped at 50% of base salary• the total amount of eligible compensation recognized in the pension calculation is capped at $600,000 for executive vice
presidents and $800,000 for group heads.
Executives do not receive any supplemental pension benefits if they leave the bank before meeting the eligibility requirements forretirement. We pay a reduced pension if the executive retires within five years of the normal retirement age, or earlier if he or she isat least 55 and has 10 or more years of service.
Management proxy circular 75
All of the named executives are vested in their supplemental pensions except Mr. McGuckin. When Mr. Porter became Presidentand CEO on November 1, 2013, his retirement arrangement was amended to freeze the pension amount accrued before hisappointment, to prevent triggering a large one-time increase in pension benefit because of the increase in his compensation as CEO(see below).
Summary of benefits
Brian Porter Mr. Porter is covered by an individual retirement agreement that went into effect when he became CEO:• his previous retirement arrangement was frozen as of October 31, 2013• pension accrues at a flat rate of $125,000 for each year he is President and CEO• his total annual pension from all bank sources is capped at $1.5 million
Christopher Hodgson Mr. Hodgson was appointed a group head before April 7, 2010, so his pension is capped at 70% of his highest averagefive-year compensation
Sean McGuckinAnatol von Hahn
Mr. McGuckin and Mr. von Hahn were appointed after April 7, 2010, so their pension has a cap on both retirementbenefits and eligible compensation:• as an executive vice president Mr. McGuckin’s pension is capped at $420,000 per year (70% x $600,000)• as a group head Mr. von Hahn’s pension is capped at $560,000 per year (70% x $800,000)
Michael Durland Mr. Durland participated in the defined benefit plan for five years, but is not currently accruing pension benefits. He isentitled to a pension from the plan that is frozen at the maximum pension allowed under a registered pension plan underthe Income Tax Act (Canada)
Plan obligations
The table below shows the defined benefit pension plan obligations for each named executive as at October 31, 2014.
The amounts are calculated using actuarial methods and assumptions consistent with those used for calculating pension obligationsand annual expenses as disclosed in our consolidated financial statements. The most significant assumption is the discount rate,which is set by reference to the yields on high quality corporate bonds with durations that match the defined benefit obligations.The remaining assumptions reflect our best estimate of future events, so the values shown may not be directly comparable tosimilar estimates of pension liabilities disclosed by other companies.
Numberof yearscredited
service
Annual benefits payable ($) Accruedobligationat start of
year ($)Compensatory
change ($)Non-compensatory
change ($)
Accruedobligation
at yearend ($)
At yearend At age 65
Brian Porter 20.8 406,000 1,448,000 3,123,000 1,385,000 774,000 5,282,000
Sean McGuckin 21.0 178,000 381,000 1,496,000 83,000 357,000 1,936,000
Michael Durland 4.7 13,000 13,000 129,000 — 31,000 160,000
Christopher Hodgson 27.2 407,000 487,000 5,388,000 145,000 796,000 6,329,000
Anatol von Hahn 30.3 419,000 560,000 3,884,000 145,000 760,000 4,789,000
• Accrued obligation is the value of the projected pension benefits from all pension plans, earned for all service to date.• Compensatory change includes the annual service costs and other compensatory changes:
• the annual service cost is the value of the projected pension benefits earned in 2014• other compensatory changes reflect the change in the accrued obligation attributable to the impact of the differences
between actual earnings (salary and bonus) for the year, and those assumed in the previous years’ calculations, and theretroactive impact of any promotions or plan changes, including additional credited service accruing during the year.
• Non-compensatory change is the change in the accrued obligation attributable to items that are not related to salary and bonusdecisions and promotion, such as assumption changes, interest on the accrued obligation at the start of the year and anyemployee contributions.
• The estimated accrued obligation values are calculated each year by our independent actuaries, based on the same method andassumptions used to determine year end pension plan obligations for our pension plans as disclosed in Note 30 to the 2013consolidated financial statements and Note 31 to our 2014 consolidated financial statements.
Pension plan governance
The human resources committee oversees the Scotiabank Pension Plan. It has delegated certain fiduciary plan duties to the pensionadministration and investment committee, including the plan investment strategy and performance, which the committee reportsback to the human resources committee twice annually. The pension administration and investment committee includes thePresident and CEO, Chief Financial Officer, Chief Human Resources Officer and independent third parties, among others. The boardretains plan sponsor duties including approval of plan amendments.
76 Scotiabank
EXEC
UTIV
EC
OM
PENSA
TION
TERMINATION AND CHANGE OF CONTROL
We do not have change-of-control agreements with any of our named executives.
Change of control
We define a change of control as:• an acquisition of more than 20% of our voting shares• a change in the majority of our board members• any transaction where one or more entities acquires more than 50% of our assets, or• a merger between us and one or more entities to form another legal entity.
While we do not have individual change-of-control agreements with our named executives, our equity-based compensation plansand executive pension arrangements include terms for vesting in these circumstances.
These change of control provisions are “double-trigger” – this means they only take effect when there is a change of control andtermination of employment without cause. Vesting accelerates under the PSU, restricted share unit (RSU) and stock option plansand executive pension arrangements if an executive’s employment is terminated within two years of a change of control for anyreason other than dismissal for cause.
Treatment of compensation if employment is terminated
The table below summarizes the treatment of compensation for the named executives under various termination scenarios:• retirement – an executive may qualify for retirement under our equity plans at age 55 or older with 10 years of service, or within
five years of their normal retirement date, whichever is earlier. If neither of these criteria is satisfied, the termination ofemployment will be treated as a resignation, and the appropriate termination provisions will apply. For Global Banking &Markets, the definition of retirement under the PSU plan is age 45 with 10 years of service.
• salary and annual incentive – the table does not reflect any amounts that may be considered under common and civil law.• pension – an executive forfeits his or her supplemental pension if they resign or retire or are terminated not for cause before
being eligible for retirement, are terminated with cause or engage in a competitive business after he or she retires or otherwiseis no longer employed by us.
Annual Incentive Award forfeited Award prorated basedon period workedduring the fiscal year
Award forfeited Award forfeited Award forfeited
RSUs Unvested units expireon date of resignationand vested units arepaid out in accordancewith plan rules
Continue to vestaccording to normalschedule
Continue to vestaccording to normalschedule
Unvested units expireon date of terminationand vested units arepaid out in accordancewith plan rules
Unvested units vest onthe normal vesting dateor the termination date,whichever is earlier
PSUs Unvested units expireon date of resignationand vested units arepaid out in accordancewith plan rules
Continue to vestaccording to normalschedule
Continue to vestaccording to normalschedule
Unvested units expireon date of terminationand vested units arepaid out in accordancewith plan rules
Unvested units vest onthe vesting date or thetermination date,whichever is earlier.Executive is entitled topayment of vested unitsbased on a performancefactor of 1.0
Stock options All vested and unvestedoptions immediatelyexpire and are forfeitedon the resignation date
Continue to vestaccording to normalschedule and can beexercised within fiveyears of retirementdate, or the originalexpiry date, whicheveris earlier
Unvested optionsexpire immediately andvested options can beexercised within threemonths of thetermination date
All vested and unvestedoptions expireimmediately and areforfeited on thetermination date
Vest immediately andcan be exercised
DSUs Can be redeemed untilthe end of the calendaryear following the yearthat employment ends
Can be redeemed untilthe end of the calendaryear following the yearthat employment ends
Can be redeemed untilthe end of the calendaryear following the yearthat employment ends
Can be redeemed untilthe end of the calendaryear following the yearthat employment ends
Can be redeemed untilthe end of the calendaryear following the yearthat employment ends
Pension Entitled to accruedpension
Entitled to accruedpension
Entitled to accruedpension
Entitled to accruedpension
Entitled to accruedpension
Perquisites Perquisites end Perquisites end Perquisites end Perquisites end Perquisites end
Management proxy circular 77
Estimated payments if employment is terminated
The table below shows the estimated additional benefits each named executive would be entitled to receive if their employmentended on October 31, 2014. For equity-based compensation, the values represent the in-the-money value of any awards (as ofOctober 31, 2014) that vest or will vest as a result of termination. These values are based on a share price of $69.02, the closingprice of our common shares on October 31, 2014.
We do not gross up any compensation to cover the impact of income taxes.
The actual amounts that a named executive would receive if employment is terminated can only be determined at the time oftermination. Many factors could affect the nature and amount of the benefits and the actual amounts may be higher or lower thanthe amounts shown below.
Base salary and annual incentive figures do not include any amounts that may be considered under common and civil law. PSUshave been valued assuming a performance factor of 1.0, and may not reflect the actual payouts. The pension amount is theadditional pension amount payable beyond the accrued pension obligation as of October 31, 2014. Mr. Durland is not currentlyaccruing pension benefits.
Estimated incremental value on termination as of October 31, 2014
Name Compensation component Resignation RetirementTermination
without causeTermination
with causeChange of
control
Brian Porter Salary and annual incentive – – – – –Equity-based incentives Eligible to retire
1. Mr. Durland is eligible to retire under the PSU plan. Stock options granted tohim in 2010 will continue to vest and can be exercised for up to five years if heleaves the bank and does not engage with a competitor for two and a halfyears immediately after leaving. All stock options granted after 2010 followthe terms of our standard stock option plan.
78 Scotiabank
EXEC
UTIV
EC
OM
PENSA
TION
Other information
COMPENSATION OF EMPLOYEES WHO HAVE AN IMPACT ON OUR MATERIAL RISK
The tables below show the compensation awarded to employees who had an impact on our material risk in the lasttwo fiscal years in accordance with Implementation Standard 15 of the FSB’s Principles for Sound CompensationPractices and Implementation Standards and the Basel Committee on Banking Supervision’s Pillar III disclosurerequirement. This includes all executive vice presidents and above, senior leaders and above in Global Banking &Markets, and other select employees. At least 40 to 60% of their total incentive compensation is deferred.
The compensation review committee reviews the list of employees to make sure it is complete (see page 52).
Total compensation awarded in 2014Fixed pay Variable compensation
1. Total direct compensation includes base salary, cash incentives (non-deferred),deferred cash incentives, share-based awards and stock options.
2. Share-based is the grant value of PSUs, RSUs and deferred performance plan(DPP) units.
3. Portion of incentive deferred variable compensation is the amount awarded indeferred cash incentive, share-based and stock options.
Outstanding deferred compensation
The table below shows the outstanding vested or unvested deferred equity (stock options, stock appreciationrights, PSUs, RSUs and DPPs) or deferred cash compensation that is in-the-money at December 31, 2014. PSUs andDPPs are valued using a performance factor of 1.0.
Values may be affected by market fluctuations in the price of our common shares, or adjustments based onperformance (in the case of PSUs, DPPs and deferred cash awards).
Vested Unvested
At December 31, 2014Number ofexecutives
Deferred cashincentive
Shareunits
($millions)
Stockoptions
($millions)
Deferred cashincentive
($millions)
Shareunits
($millions)
Stockoptions
($millions)
Totaloutstanding
($millions)
Named executives 5 0.0 0.0 39.0 0.0 29.0 6.7 74.7
Other bank employees 172 0.0 2.0 145.6 3.8 245.6 19.0 416.1
Total 2014 177 0.0 2.0 184.6 3.8 274.7 25.7 490.8
Total 2013 178 0.0 2.0 222.6 5.6 303.6 59.6 593.5
Deferred compensation paid out in 2014
This includes PSU, DPP and deferred cash awards paid, and stock options exercised (including stock appreciationrights), in the year ended December 31, 2014.
At December 31, 2014 Number of executivesDeferred cash incentive
($millions)Share units($millions)
Stock options($millions)
Named executives 5 0.0 7.6 5.5
Other bank employees 172 1.9 88.5 22.3
Total 2014 177 1.9 96.1 27.8
Total 2013 178 2.2 98.5 42.8
We did not reduce deferred compensation payments in December 2014, either for explicit adjustments (suchas clawbacks) or for implicit adjustments (such as a decrease in our share price).
Our PSU performance factor was below target, which decreased the payout value of the PSU and DPP awards by $6.2 million.
Other payments awarded in 2014
Employees who have an impact on our material risk did not receive any guaranteed incentive awards in 2014or 2013. Two received sign-on awards in 2014, for a total of $0.8 million (none in 2013). We provideinformation about severance payments to OSFI confidentially for privacy reasons.
Management proxy circular 79
NON-GAAP MEASURES
We use return on equity and operating leverage to measure performance in our incentive plans.These are not defined terms under generally accepted accounting principles (GAAP), which arebased on International Financial Reporting Standards, and may not be comparable to similar termsused by other financial institutions. We define these terms as follows. Please see page 17 of ourannual report for more about how we define and use non-GAAP measures.
Operating leverage
The bank defines operating leverage as the rate of growth in total revenue (on a taxable equivalentbasis), less the rate of growth in operating expenses.
Return on equity
Return on equity is a profitability measure that presents the net income attributable to commonshareholders as a percentage of common shareholders’ equity. The bank calculates its return onequity using average common shareholders’ equity.
Economic equity and return on economic equity
For internal reporting purposes, the bank attributes capital to its business segments based on theirrisk profile and uses a methodology that considers credit, market, operational and other risksinherent in each business segment. The amount of risk capital attributed is commonly referred toas economic equity. The economic equity methodology, models and assumptions are updatedannually and applied prospectively. Return on economic equity for the business segments iscalculated as a ratio of net income attributable to common shareholders of the business segmentand the economic equity attributed.
Regulatory capital ratios
Regulatory capital ratios, such as Common Equity Tier 1, Tier 1 and Total Capital ratios, havestandardized meanings as defined by OSFI.
LOANS TO DIRECTORS AND OFFICERS
The table below shows the aggregate indebtedness outstanding at January 8, 2015 of current andformer directors, executive officers and employees in the main countries where we operate(including our subsidiaries). The amounts exclude routine indebtedness as described in note 2,below.
Purpose To the bank or a subsidiary of the bank To another entity
Share purchases – –
Other $526,746,685 –
80 Scotiabank
EXEC
UTIV
EC
OM
PENSA
TION
The following table shows the outstanding amounts that directors and executive officers borrowedfrom us or our subsidiaries to buy bank securities and for other purposes, including amountsborrowed by their respective associates, but do not include routine indebtedness.
Name and principal positionInvolvement
of issuer
Largest amountoutstanding during the
financial year endedOctober 31, 2014
Amountoutstanding as at
January 8, 2015
Financially assistedsecurities purchasesduring the financial
yearended October 31, 2014
Securities purchase program – – – –
Other programsGroup Head/Executive Vice President
Wendy Hannam lender $1,608,890 $1,003,011 –
Troy Wright lender $1,657,024 $1,569,982 –
1. Loans and other extensions of credit to executive officers and directors aremade on market terms that are no more favourable than those offered to thegeneral public, in accordance with the U.S. Sarbanes-Oxley Act of 2002 andthe related provisions of the U.S. Securities Exchange Act of 1934, asamended.
2. Routine indebtedness includes:• loans to any director or nominated director, executive officer, together
with his or her associates, made on terms no more favourable than loansto employees generally, where the amount remaining unpaid has notexceeded $50,000 at any time in the last completed financial year
• loans to full-time employees, fully secured against their residence and notexceeding their annual salary
• loans to those other than full-time employees, made on substantially thesame terms available to other customers with comparable credit (includingterms for interest rates and security rates), and involving no more than theusual risk of collectability
• loans for purchases on usual trade terms, or for ordinary travel or expenseadvances, or similar reasons, with repayment arrangements according tothe usual commercial practice.
DIRECTORS’ AND OFFICERS’ LIABILITY INSURANCE
We have purchased a liability insurance policy for our directors and officers (Side A), which expireson June 1, 2015. The policy covers each of them individually if there are situations where we arenot able or permitted to indemnify them. The policy has a $200,000,000 limit and a nil deductible,and we pay an annual premium of $919,550 for this coverage.
DIRECTORS’ APPROVAL
The board has approved the contents of this circular and authorized us to send it to you.
Deborah M. AlexanderExecutive Vice President, General Counsel and Secretary
Toronto, Ontario, CanadaFebruary 5, 2015
Management proxy circular 81
Appendix A – Shareholder proposalsThe following two shareholder proposals and accompanying statements were submitted by one shareholder. They propose to raisethese matters for consideration at the meeting. Both proposals and supporting statements have been printed as submitted.
Proposals No. 1 and 2 were submitted by Mouvement d’éducation et de défense des actionnaires (MÉDAC), 82 Sherbrooke St.West, Montréal, Québec, H2X 1X3. The proposals were submitted in French and translated into English by Scotiabank.
The board recommends you vote against each proposal for the reasons set out after each proposal. Unless otherwise instructed, thepersons designated in the form of proxy intend to vote against each of these proposals.
PROPOSAL NO. 1
Stock Options
It is proposed that the board of directors abolish, over a period of five years, stock options as a means of compensationand replace them with a form of compensation focused on the institution’s long-term performance.
From the outset, let us mention that in the middle of the last century, the academic literature referred to executive compensationmainly as a salary and approached incentive compensation very carefully.
“In mid-twentieth-century business articles and textbooks, one finds references to executive ‘salaries’; mention of incentives (in cash,stock, or options) is an exception. As a management professor stated in 1951, “It is usually unwise to have a large proportion ofexecutive pay consist of incentives.”1.”
Variable compensation developed from the 1980’s onwards, and stock options or any other stock-based compensation played anincreasingly important role among the tools used to set executive compensation. In a generally booming stock market, such form ofcompensation surely contributed to a constant increase. Moreover, as described by Professor Yvan Allaire in the document entitledPay for Value: Cutting the Gordian Knot of Executive Compensation:
“They [the stock options] tend to reward ‘luck’ as much as performance; a booming stock market lifts all boats; unless the exerciseprices of stock options are indexed to some stock market index (a rare practice that raises some thorny issues), ‘lucky’ executiveswho happen to live through one of these recurring phases of stock market exuberance will become very rich; those who happen tospend a good deal of their career when stock markets are in doldrums will not be so lucky2.”
Finally, one can certainly question the need to give such weight to variable compensation, as it promotes excessive risk-taking andwas pushed forward by many as one of the factors explaining the most recent financial crisis:
“Risk-taking incentives provided by incentive compensation arrangements in the financial industry were a contribution factor to thefinancial crisis that began in 20073”.
Since, as NEI Investments wrote, “[s]tock options are complex, susceptible to manipulation and have the effect of excessively rewardingexecutives on the basis of a single and questionable performance metric4”, we propose that stock options be gradually abolished.
The bank’s position
The human resources committee is responsible for ensuring that our compensation programs and practices are aligned with ourobjectives and the interests of shareholders. Along with annual incentives and performance share units, stock options contribute toa balance of short-, mid- and long-term incentives in our overall compensation mix. Shareholders ultimately benefit from a balancedcompensation package that will attract and retain the right talent for the long term.
Our senior executives make strategic decisions that affect the long-term success of the bank. We therefore feel it is important that aportion of their compensation is tied to a vehicle that ensures management focus is aligned with our shareholders’ interests, andwith the time horizon of risks, consistent with the Financial Stability Board principles. Options are one of the mechanisms thatcreate this alignment.
1 LORSCH, J. and R. KHURANA. 2010. The Pay Problem. May-June 2010. Harvard Magazine.http://harvardmagazine.com/2010/05/the-pay-problem
2 ALLAIRE, Y. Pay for Value: Cutting the Gordian Knot of Executive Compensation, IGOPP, p. 413 Board of Governors of the Federal Reserve System. Incentive Compensation Practices: A report on the Horizontal Review of Practices at
Large Banking Institutions. October 2011. p. 1.http://www.federalreserve.gov/plublications/other-reports/files/incentive-compensation-practices-report-201110.pdf
4 Crisis, What Crisis? — Executive Compensation in the 21st Century, NEI Investments https://www.neiinvestments.com/Documents/Research/Exec_Comp_English_Final.pdf
82 Scotiabank
We have steadily reduced our use of stock options over the past several years in favour of performance share units. Most recentlywith the December 2014 grants, we reduced the use of stock options at all senior executive levels, including the President and CEO,and eliminated them altogether at the vice president level. Stock options now make up 20% or less of the total compensation forgroup heads and above, approximately 15% for executive vice presidents and 10% for senior vice presidents.
At this small proportion of the total compensation mix, the concern that stock options promote or reward excessive risk-taking ormanipulative behavior is largely negated. To further reinforce the longer term role of stock options within our compensation mix,the vesting schedule for our options was extended this year. Stock options now vest 50% after the 3rd year and 50% after the4th year following grant. This change further strengthens the alignment with shareholder interests over the long term.
In addition, our expected burn rate for 2015 will be further reduced from 2014 and significantly below the level that would triggerconcern with shareholder advisory groups.
For these reasons, the bank recommends voting against this proposal.
PROPOSAL NO. 2
Executive Pension Plans
It is proposed that the bank’s new executives be subject to the same pension plan as all employees and that such planbe based solely on salary.
According to the 2014 proxy circular, pension plans provided to the bank’s executives are defined benefit pension plans andindividual retirement agreements were entered into to provide non-registered, unfunded supplemental pensions to executives atthe level of Group Head and Executive Vice President or above, including certain named executive officers. Under these agreements,the pension accrual is calculated substantially as under the SPP, except that a portion of incentive compensation is included.Pursuant to such agreements, Mr. Waugh and Mr. Porter may receive, each year until the age of 65, an annual pension of$2 million and $1.45 million, respectively, which very few Canadians will ever receive.
Due to the current approach to compensation, executives receive, before as well as after their retirement, a compensation that canhardly be justified. We have been deploring for several years the use of stock options that tend to reward not only performance butalso “luck”, and encourage excessive risk-taking. We also deplore the calculation method that includes annual bonuses whichincrease inequity between executives and employees. As the saying goes: You can’t have your cake and eat it too.
In order to promote equity, it is proposed that the bank submit a policy on its executive pension plan so that, over a period offive years, the situation is rectified and all employees are subject to the same pension plan.
The bank’s position
The bank believes its current pension arrangements are appropriate. Most Canadian employees participate in the ScotiabankPension Plan (SPP), which is a defined benefit pension plan. Members of the executive management team who participate in asupplemental pension plan also participate in the SPP on the same basis as all other Canadian participants. All eligible employeesare enrolled in the SPP after one year of service, unless they specifically elect not to join. All pension benefits under the SPP arebased on salary only. As annual pension benefits under the SPP are capped by the Income Tax Act (Canada), to attract and retainhigh caliber executives, eligible executives at the vice president level and above (up to the President and CEO), participate in theScotiabank Executive Pension Plan (SEPP). The SEPP is a non-registered, unfunded supplemental pension plan to the SPP. Employeepension benefits under the SEPP are based on salary and a percentage of incentive compensation, but are also limited by dollar capsas set out in the SEPP provisions. These caps were put in place to limit pensionable earnings. The table on page 76 of the circularshows the projected annual pension benefits to be received by each named executive officer at age 65. These projected amountsare comparable to, or less than, each named executive officer’s current salary except for Mr. Porter. Mr. Porter’s projected annualpension benefit amount in the table is comparable to 2013 CEO salary levels at Canadian bank comparators including Scotiabank’sprevious CEO. Mr. Porter’s pension cap is also significantly lower (25%) than our previous President and CEO. In addition, SEPPbenefits are only payable to executives who meet the retirement eligibility requirements, and are otherwise forfeited. This benefit isan important long-term retention mechanism for the bank.
For these reasons, the bank recommends voting against this proposal.
Management proxy circular 83
Discussion on withdrawn proposals
Mr. Andrew Palicz submitted the following proposal. After discussions with the bank, Mr. Palicz agreed to withdraw his proposalbut asked that the text of the proposal and supporting statement be included in the circular.
“Untranslated Webcasts of Scotiabank’s Annual General Meetings. Resolved, that untranslated bilingual versions of the webcasts ofAnnual General Meetings of Scotiabank be included on Scotiabank’s website alongside the French only and English only versionsthat are already therein provided.
Shareholder Statement: French only and English only webcasts of Scotiabank’s Annual General Meeting are already to be found inthe French and English Investor Relations sections, respectively, of Scotiabank’s website. Many Scotiabank shareholders, though, areable to understand both French and English. Such shareholders may wish to avoid the occasionally inevitable semantic lacunae, aswell as the loss of nuance, that do in fact result from even very high quality simultaneous translation. Those shareholders who valuesemantic precision may therefore prefer, when able, to hear the thoughts and ideas of another person in that person’s own voiceand language. The implementation of this proposal would allow those shareholders who are unable to attend Scotiabank’s AnnualMeeting in person to easily do so.”
Mr. Palicz submitted one additional proposal regarding shareholder approval of an annual charitable donations budget. Followingdiscussions with the bank and on the basis of a mutual understanding of the bank’s efforts in this area, Mr. Palicz agreed towithdraw this shareholder proposal.
Three additional proposals were submitted by MÉDAC regarding (1) the use of an equity ratio as a benchmark in the executivecompensation process; (2) director expertise in corporate social responsibility; and (3) business practices related to credit cardsand corporate social responsibility. Following discussions with the Bank and on the basis of a mutual understanding of the bank’sefforts in these areas, MÉDAC agreed to withdraw these shareholder proposals, but asked that the text of the first proposal aboveand its supporting statement, be included in the circular but not voted on:
“Report on Compensation
It is proposed that the bank implement an executive compensation policy that provides for the use, each year, of theequity ratio as a compensation benchmark in order to assure shareholders that its executive compensation strategy isfair and equitable.
After analyzing management proxy circulars, we came to the conclusion that the process of determining executive compensationdepends highly on horizontal benchmarking with peers in so-called “similar” businesses. Such process leads to a continuouscompensation escalation because it leads to an increase each time a business grants compensation higher than its group median.Several observers of sound governance practices denounced the almost exclusive use of such process. This creates a growingdiscrepancy between the most senior officer’s compensation and the average compensation of an employee, leading to injusticewithin the company and malfunction of the economy, as fewer workers have the purchasing power to buy what is produced by theeconomy – which is one of the factors explaining the recent financial crisis.
As Yvan Allaire wrote:
[Translation] “Previously, compensation systems were conceived in a spirit of internal equity and not on the basis of a supposedly‘talent’ market. We must reintroduce forms of compensation that foster and protect solidarity, mutual trust and a feeling of equityin and about the company, give the members of the organization the sense of ‘being all on the same boat’ and encourage them toshare a long-term vision for the company1.”
Being aware of the concerns raised by such process, the six major Canadian banks retained Meridian, a compensation consultingfirm, to analyze this matter and make recommendations. While it considers horizontal benchmarking relevant, this firm suggestedthe following:
“While vertical benchmarking is unlikely to be sufficient as a primary basis for setting executive compensation, it can provideimportant context for a Committee, particularly in assessing trends in pay disparity2.”
Taking into consideration the benefits of comparing the executive compensation with the compensation of other employees of thebank, we propose that the bank’s policy provides for the systematic use of the equity ratio, i.e. the ratio between the chief executiveofficer’s compensation and the median income of the bank’s employees.”
1 http://www.lesaffaires.com/blogues/yvan-allaire/le-noeud-gordien-de-la-remuneration-des-dirigeants/544879 [available in French only]2 http://www.td.com/document/PDF/corporateresponsibility/Canadian-Banks-Horizontal-Benchmarking.pdf
84 Scotiabank
HOW TO CONTACT US
INVESTORS Investor Relations, Finance DepartmentScotiabankScotia Plaza44 King Street WestToronto, Ontario, Canada M5H 1H1Tel.: (416) 775-0798Fax: (416) 866-7867Email: [email protected]
CUSTOMERS Contact your branch manager first.
If your matter isn’t resolved, contact:Office of the President – Customer ConcernsScotiabankScotia Plaza44 King Street WestToronto, Ontario, Canada M5H 1H1Tel: (416) 933-1700 or toll free 1 (877) 700-0043Email: [email protected]
SHAREHOLDERSchanges in share registrationaddress changesdividend informationlost share certificatesestate transfersduplicate mailings
Computershare Trust Company of Canada100 University Avenue, 8th floorToronto, Ontario, Canada M5J 2Y1Tel.: 1 (877) 982-8767Fax: 1 (888) 453-0330Email: [email protected]
Co-Transfer Agent (U.S.A.)Computershare Trust Company N.A.250 Royall StreetCanton, MA 02021, U.S.A.Tel.: 1 (800) 962-4284
INDEPENDENT DIRECTORS Chairman of the BoardScotiabankScotia Plaza44 King Street WestToronto, Ontario, Canada M5H 1H1
EXECUTIVE COMPENSATIONMATTERS
Chair, Human Resources CommitteeScotiabankScotia Plaza44 King Street WestToronto, Ontario, Canada M5H [email protected]
Reminder about shareholder mailings
We announce our financial results by media release, and our financial statements and management’s discussion and analysis(MD&A) are available on our website (www.scotiabank.com).
If you are a shareholder and want to receive our quarterly financial statements and MD&A in 2015, you must mark therequest box at the bottom of your proxy form (registered shareholders) or voting instruction form (beneficial shareholders).
Some households may receive multiple copies of our annual report because multiple registered shareholders live at the sameaddress. If you are a registered shareholder, you can tell us not to send the annual report (containing the annual financialstatements and MD&A) by marking the waiver box at the bottom of your proxy form.
® Registered trademark of The Bank of Nova Scotia.


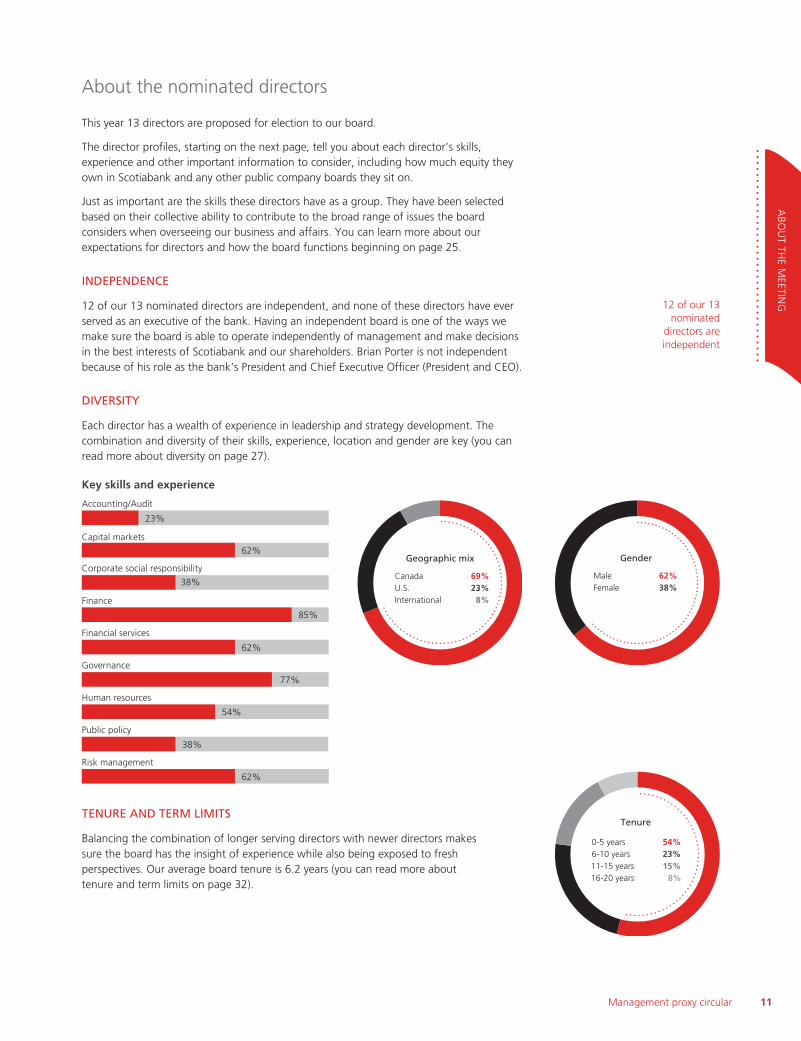
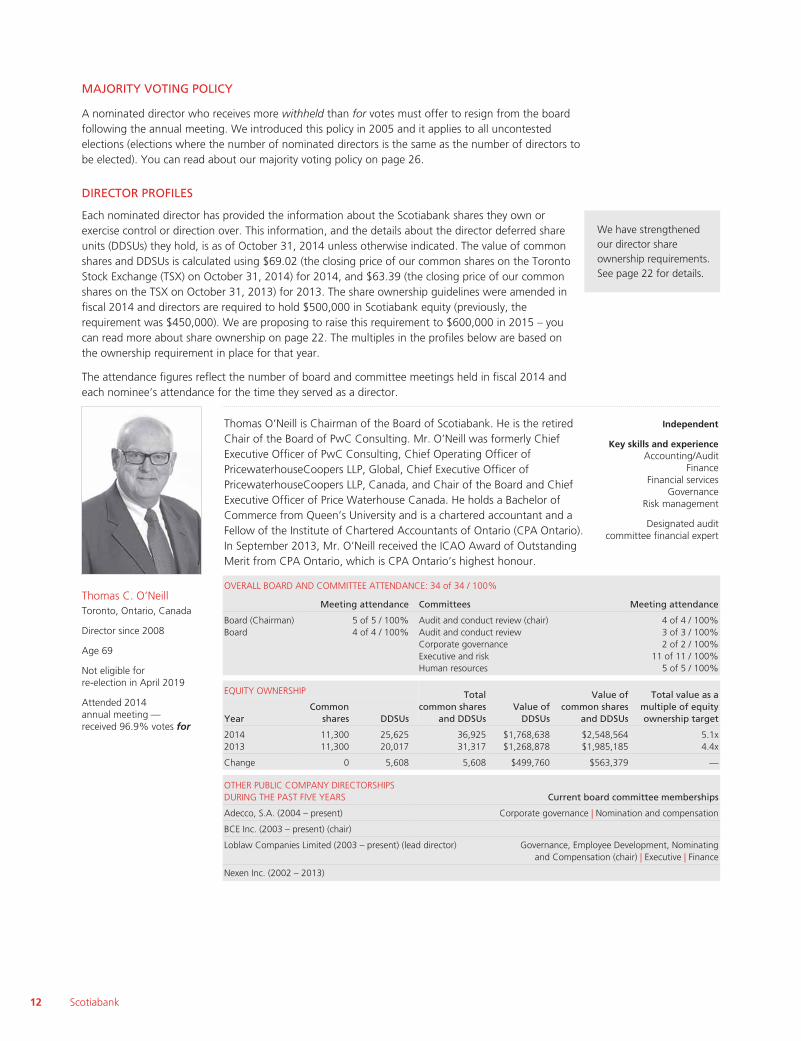


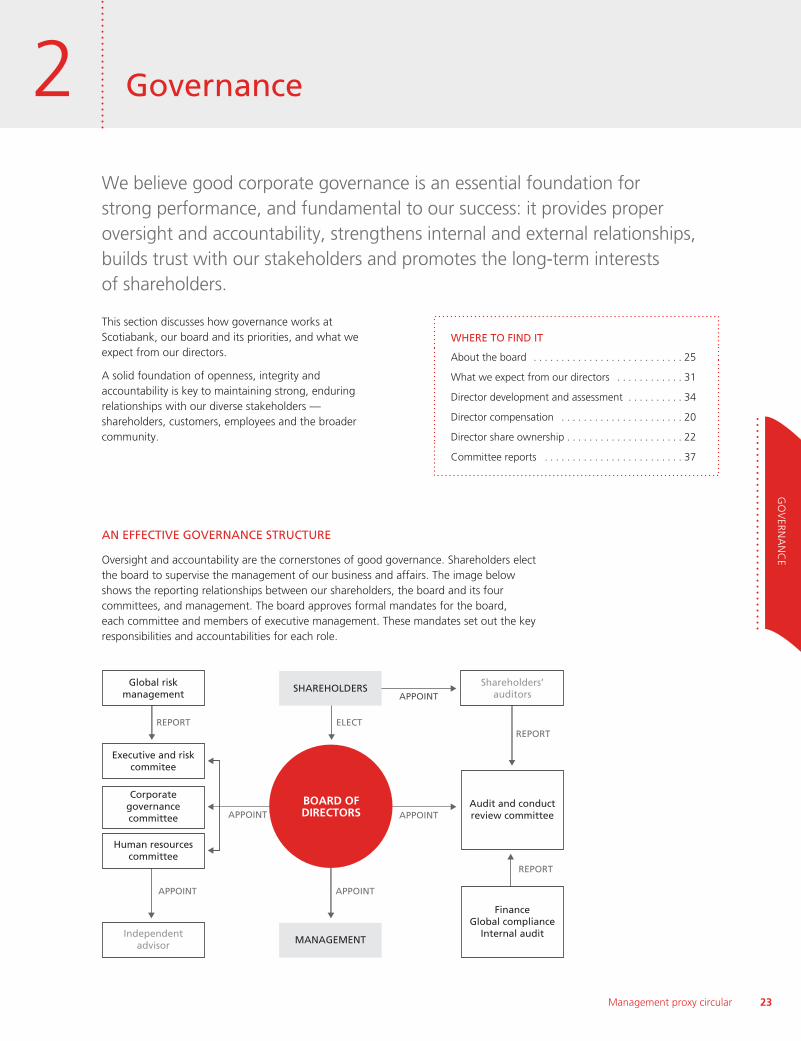


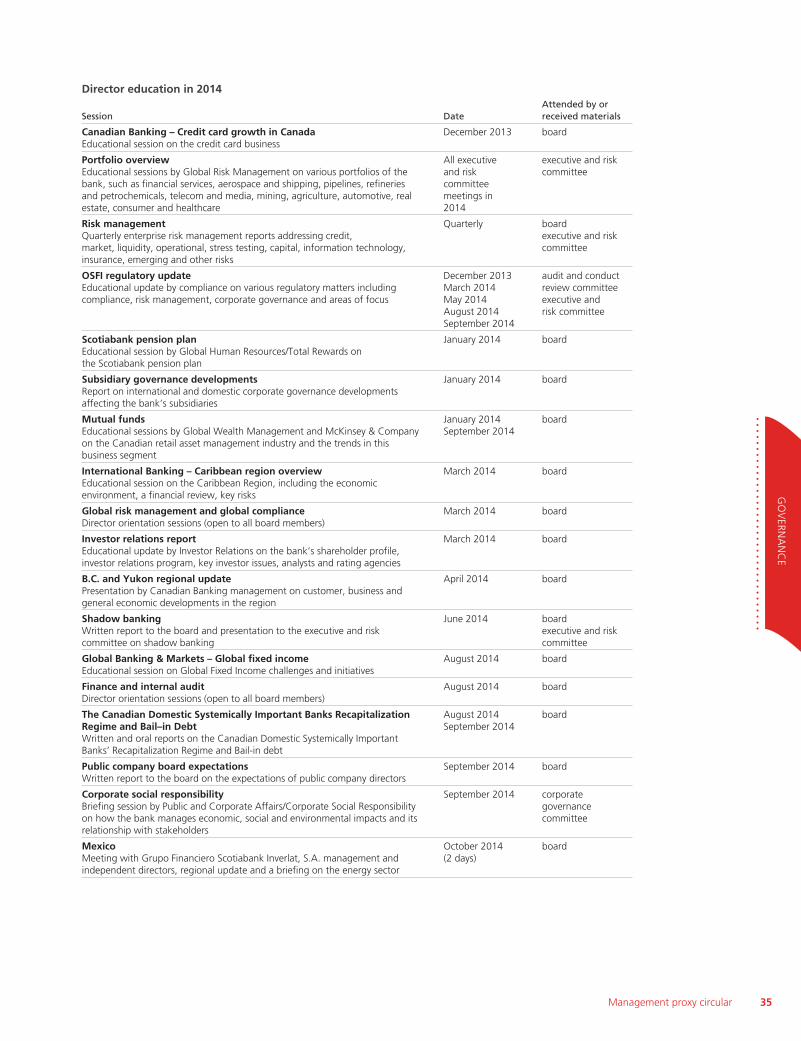


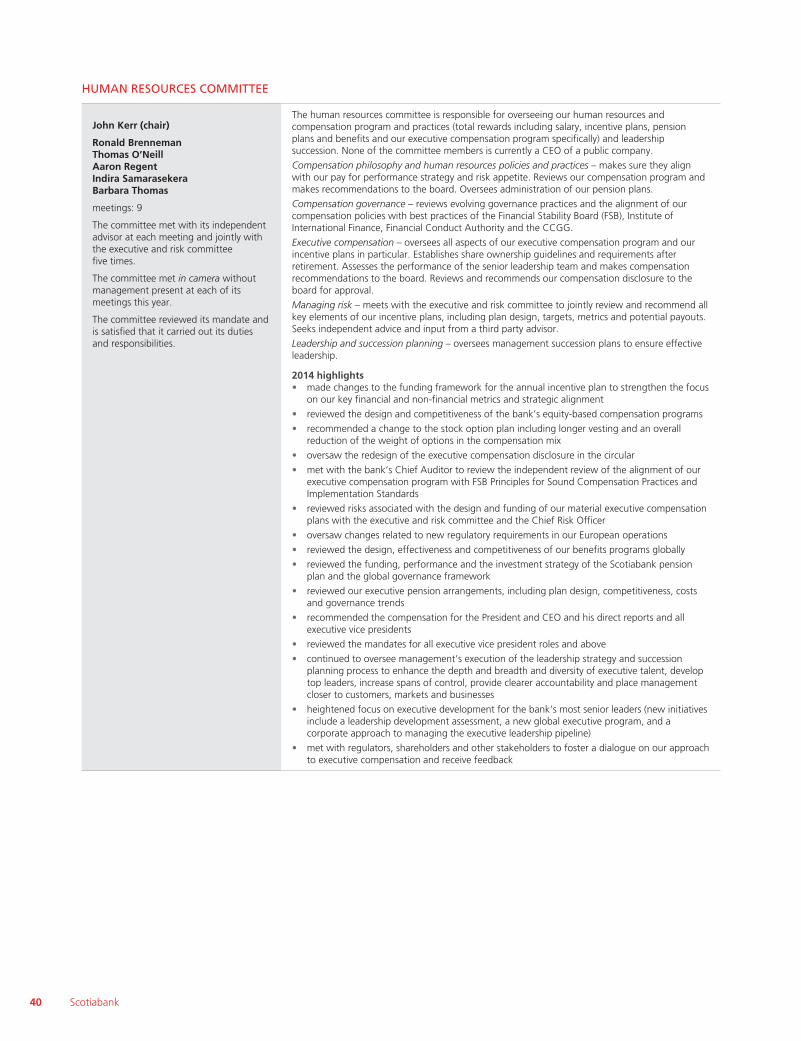


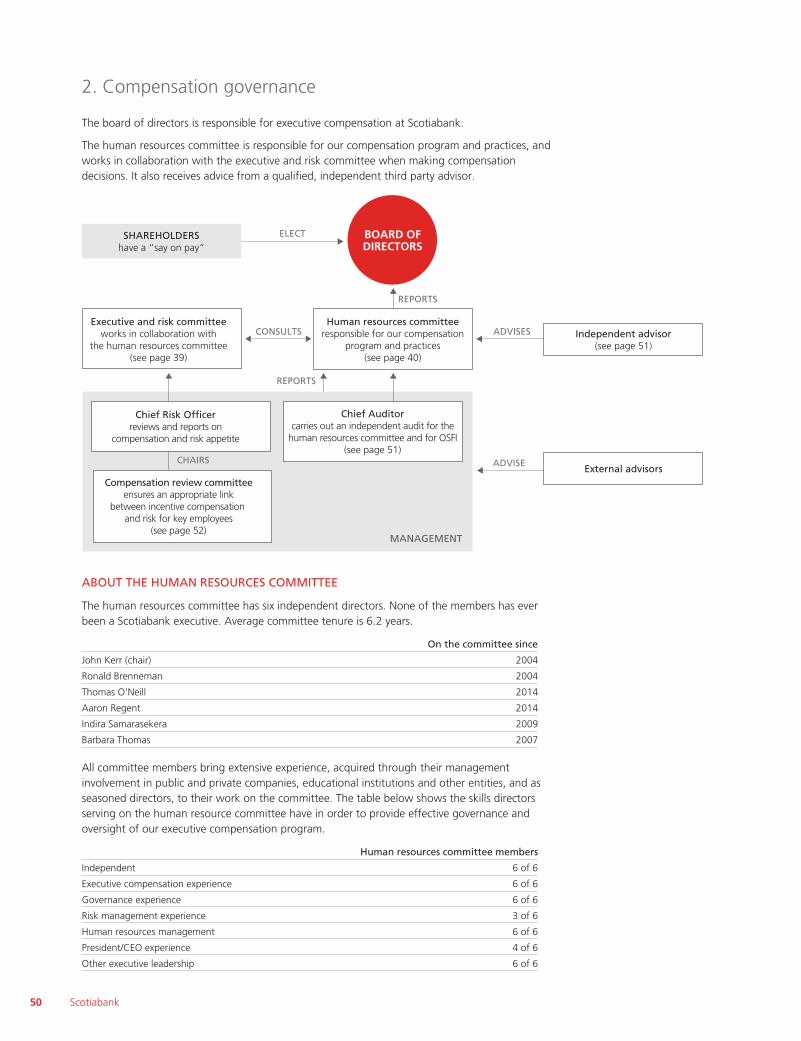


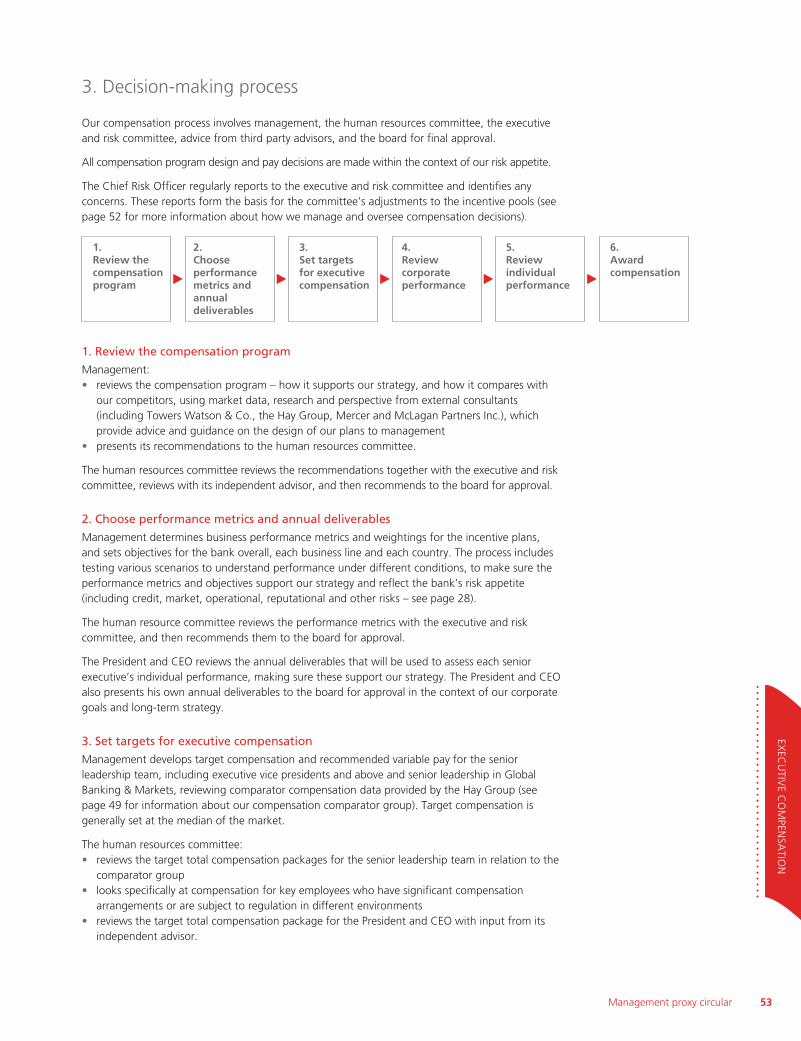


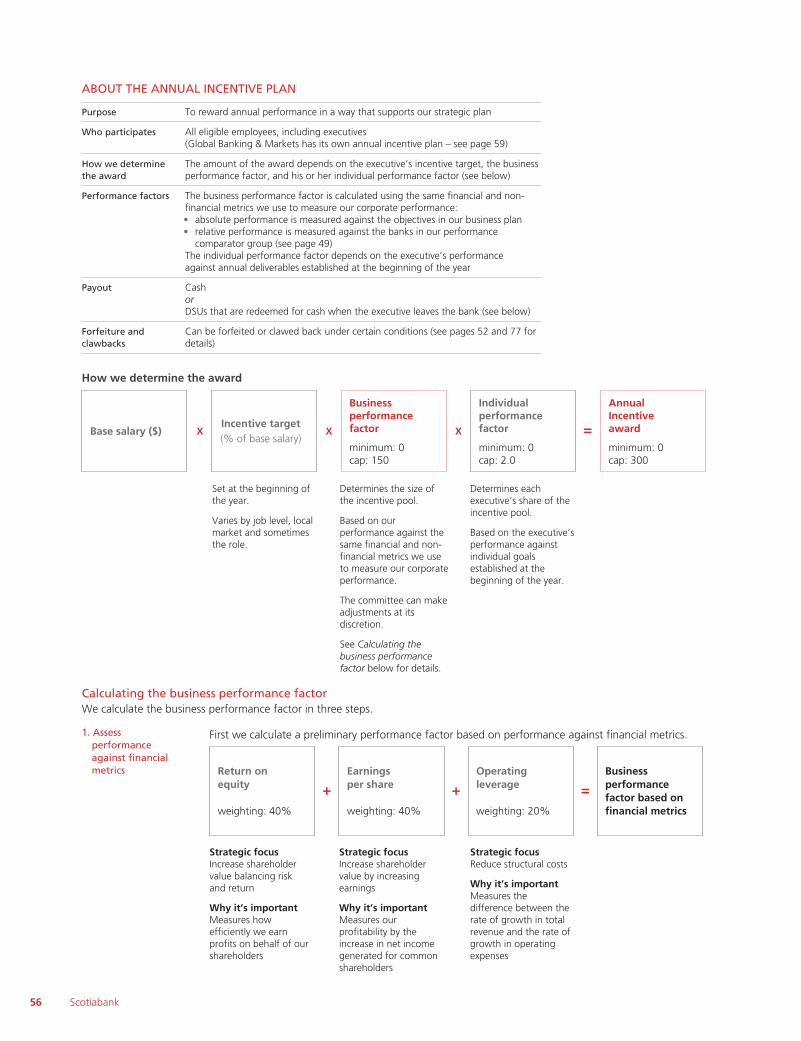


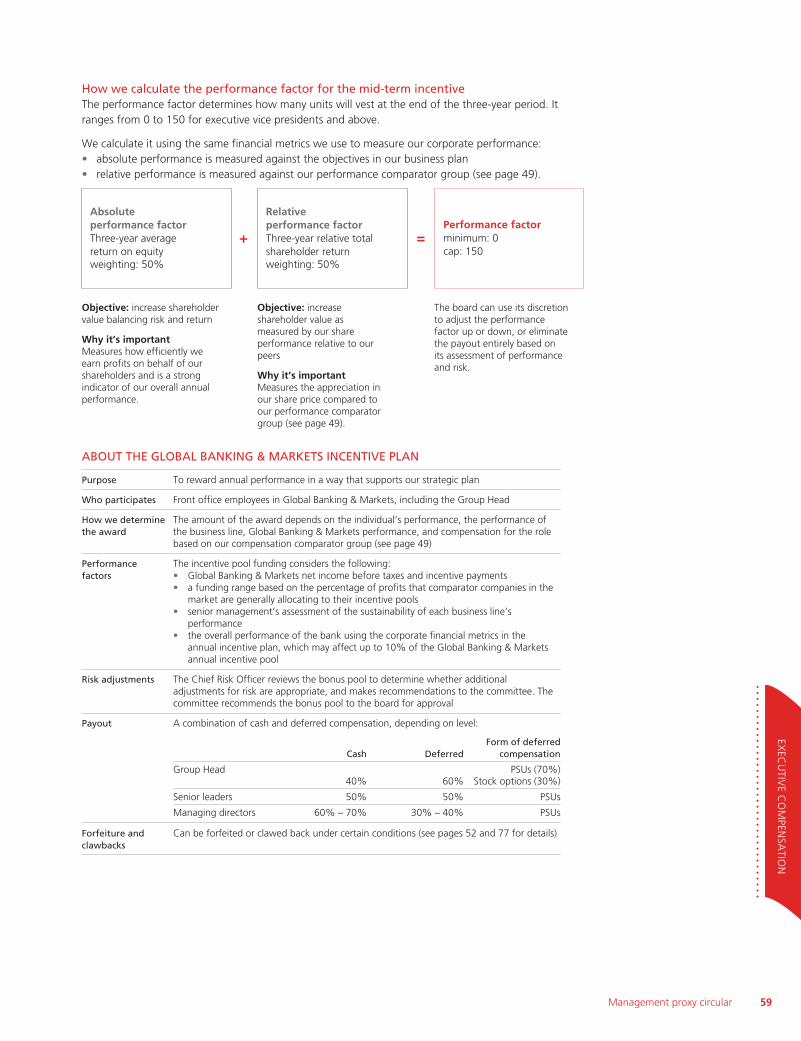

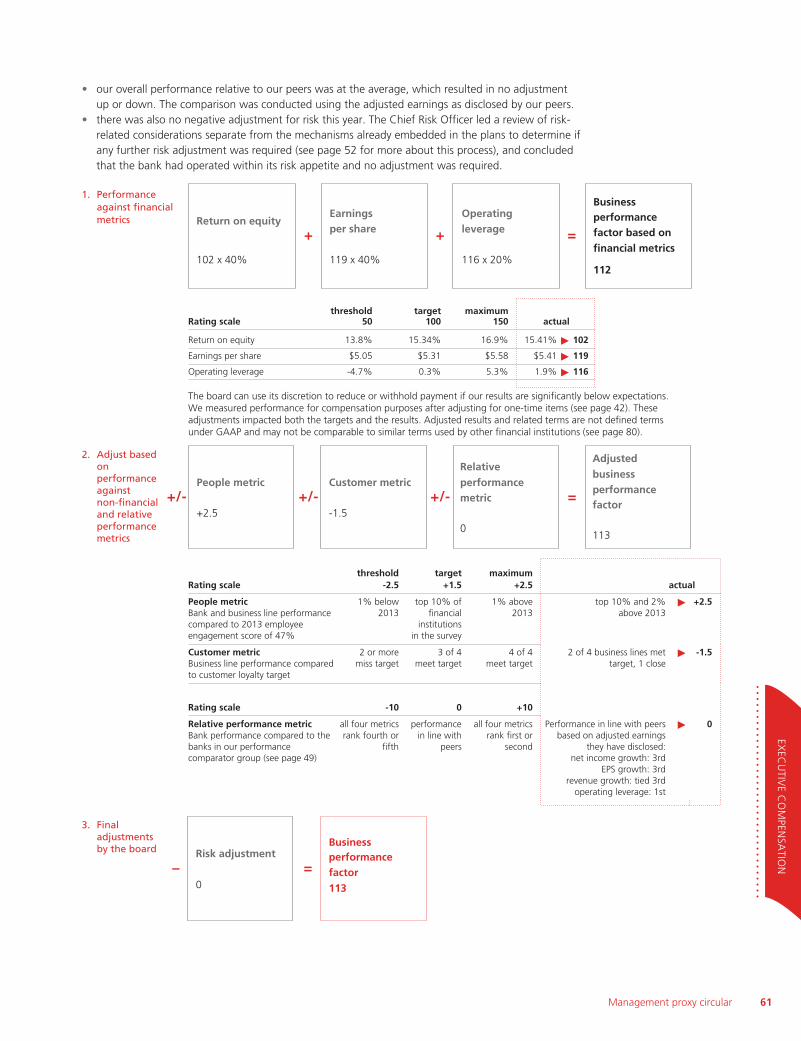
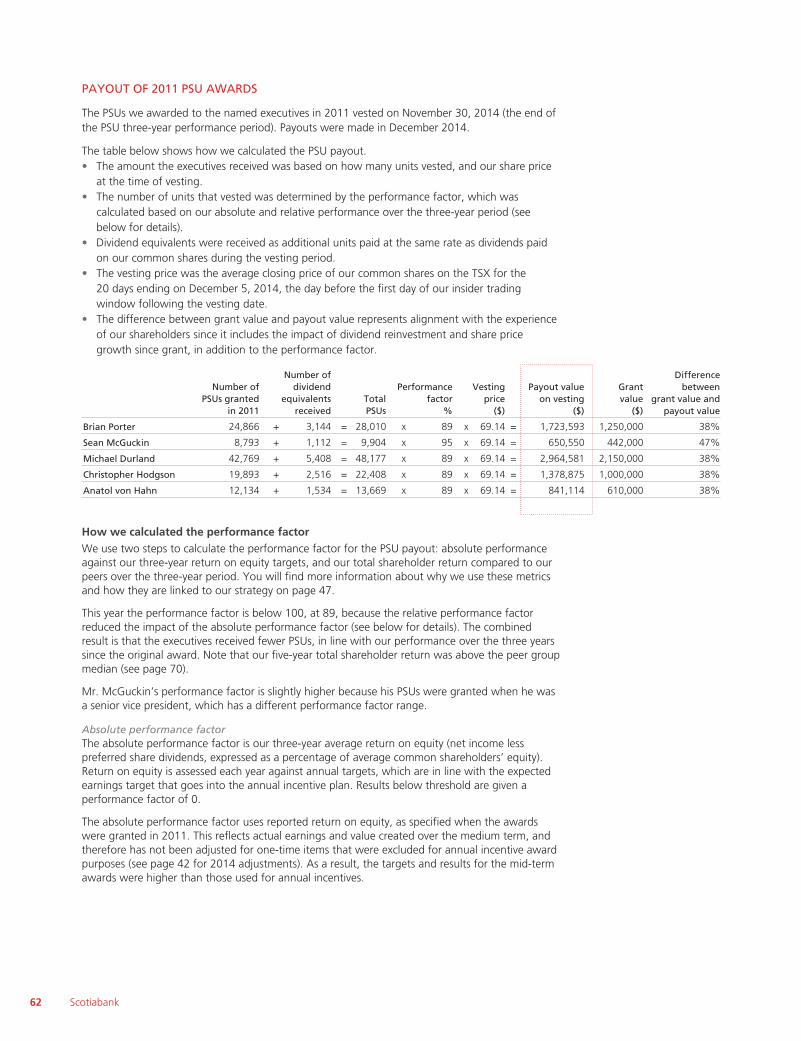

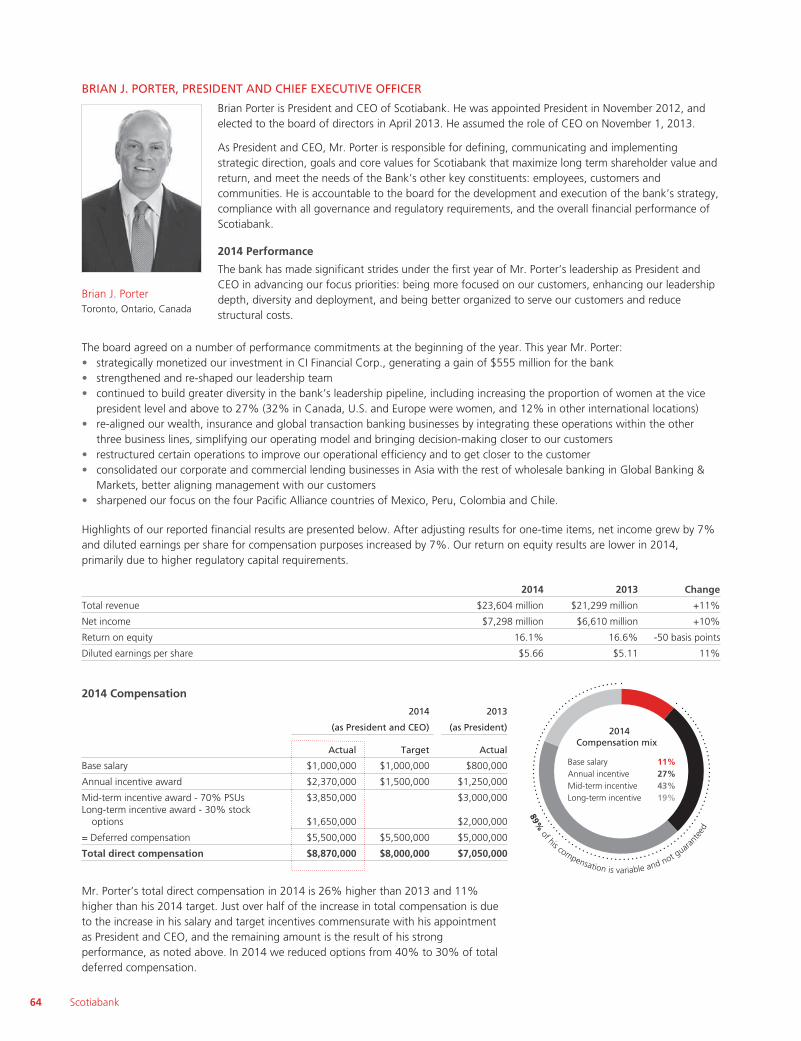
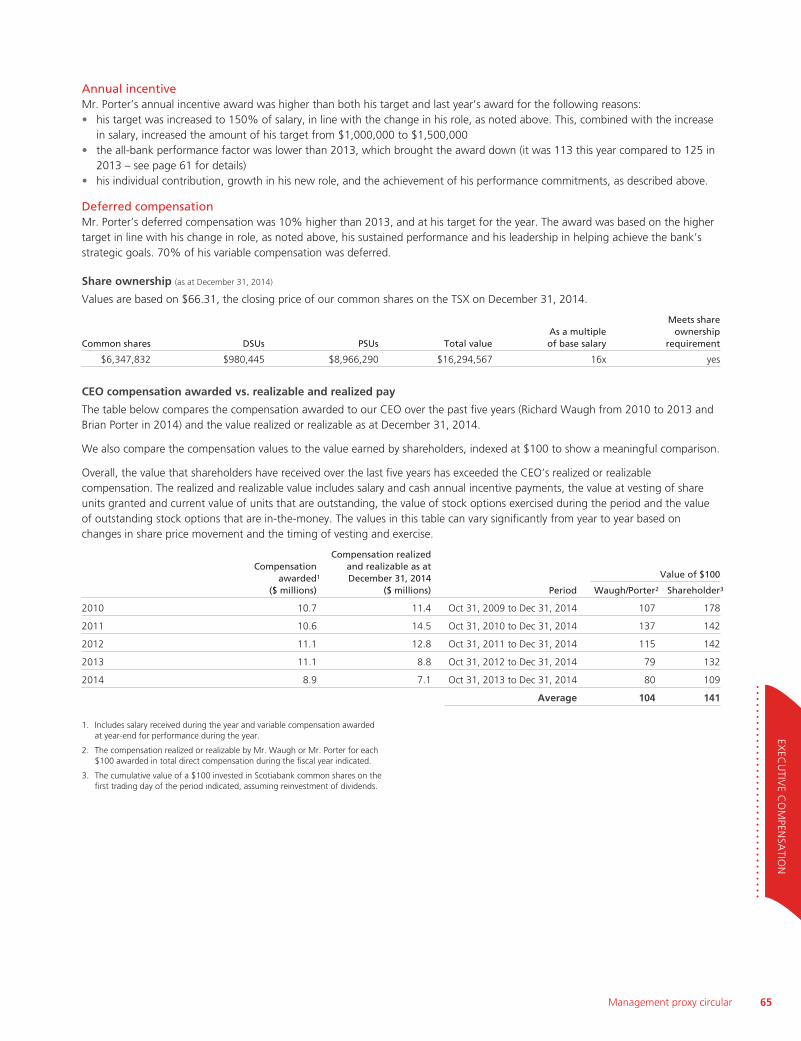
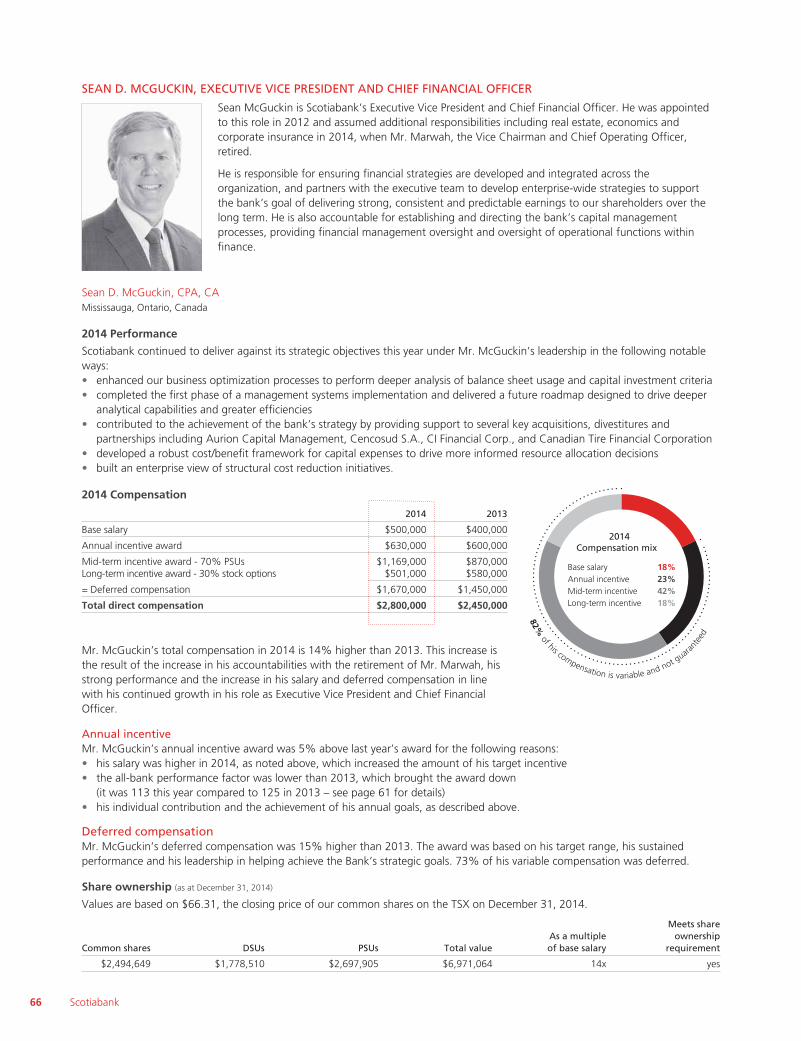


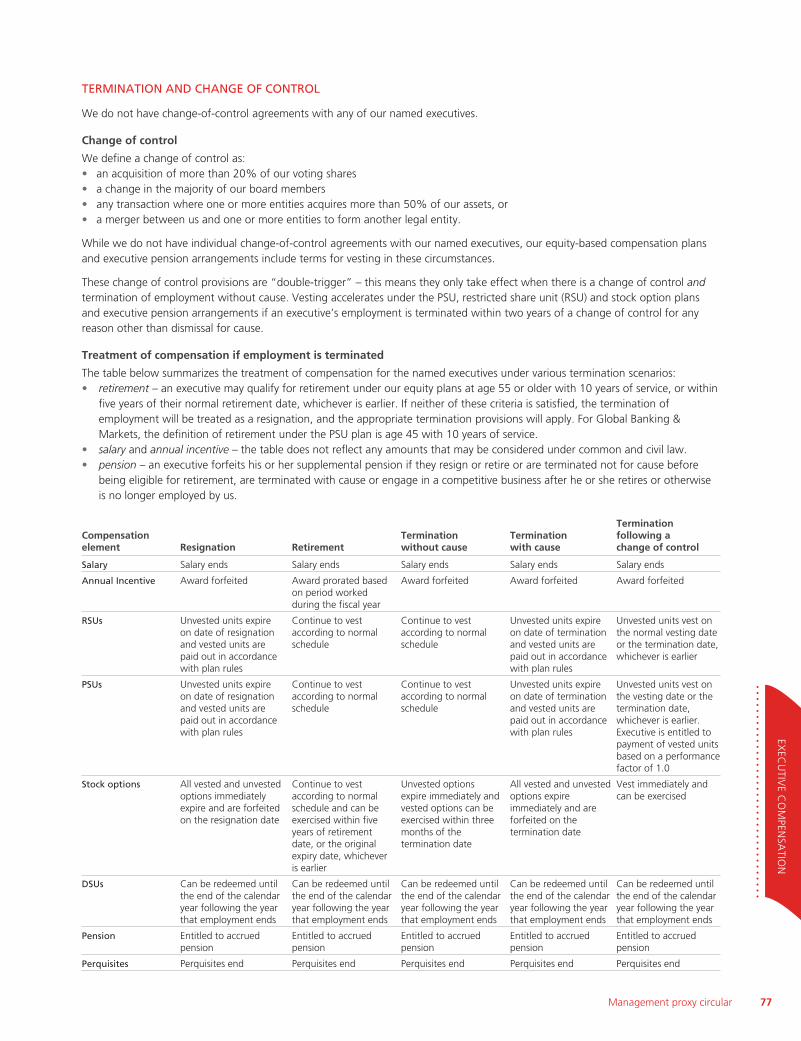

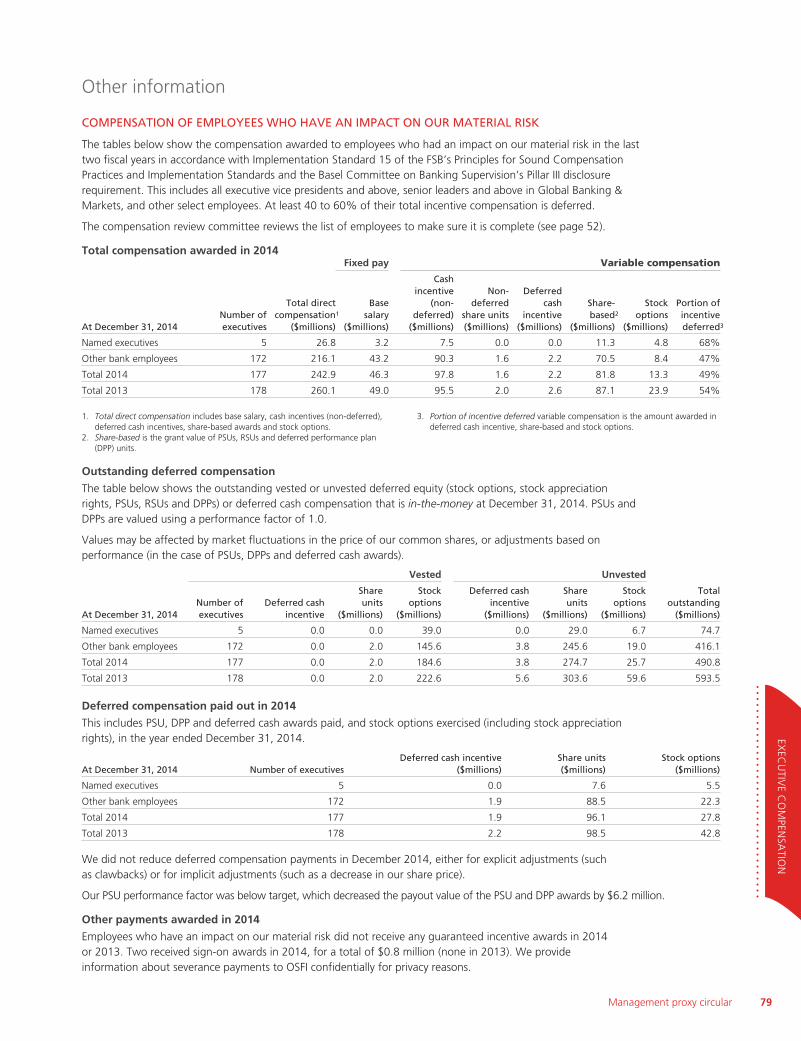


![[ BUSINESS SERVICES SECTOR ] - Global Affairs · PDF fileCANADA’S BUSINESS SERVICES SECTOR ... customer relations management, knowledge process outsourcing, data ... Columbia is](https://static.documents.pub/doc/80x56/5aa551707f8b9ab4788cfeb9/-business-services-sector-global-affairs-s-business-services-sector-customer.jpg)


![Machinery and Equipment Value · PDF fileCanada’s competitive advantages [ MACHINERY AND EQUIPMENT SECTOR ] CANADA’S MACHINERY AND EQUIPMENT SECTOR ... Agriculture, mining, oil](https://static.documents.pub/doc/80x56/5aa0ce8c7f8b9a8e178e8151/machinery-and-equipment-value-s-competitive-advantages-machinery-and-equipment.jpg)


![[ WIRELESS COMMUNICATIONS ] - Welcome / Bienvenue | · PDF fileCANADA’S WIRELESS COMMUNICATIONS SECTOR ... including mesh networks, ... Wireless Technologies, Software, Mobile Media.](https://static.documents.pub/doc/80x56/5aa3fdbb7f8b9afa758b4766/-wireless-communications-welcome-bienvenue-canadas-wireless-communications.jpg)

