40
Canadian Environmental Sector Trends SUPPLEMENTAL REPORT: Labour Market Research Study 2010 Future Growth Expectations for Worker Demand within each Environmental Subsector ECO CANADA

Canadian Environmental Sector Trends S U P P L E M E N T A L R E P O R T :
Labour Market Research Study 2010
Future Growth Expectations for Worker Demand within each Environmental Subsector
ECO CANADA
2
Table of Contents 1.0 INTRODUCTION ................................................................................................................................................... 3
1.1 About ECO Canada .................................................................................................................................... 4
1.2 Research Objectives .................................................................................................................................. 4
2.0 EXECUTIVE SUMMARY ...................................................................................................................................... 6
3.0 DRIVERS OF EMPLOYMENT IN ENVIRONMENTAL SUB-SECTORS .................................................... 8
3.1 Environmental Inputs: Resource Management ................................................................................ 8
3.1.1 Management of natural resources ......................................................................................... 8
3.1.2 Wildlife and fisheries ............................................................................................................... 12
3.1.3 Management of energy resources ........................................................................................ 13
3.2 Environmental Outputs: Environmental Protection ...................................................................... 18
3.2.1 Protection of ambient air and climate ................................................................................ 18
3.2.2 Water protection, treatment, supply, and conservation................................................. 21
3.2.3 Waste management (nonhazardous waste) ...................................................................... 23
3.2.4 Remediation and protection .................................................................................................. 28
3.2.5 Protection of biodiversity and landscape ........................................................................... 29
3.2.6 Noise and vibration abatement ............................................................................................ 31
3.3 Other Environmental Sub-sectors ..................................................................................................... 32
3.3.1 Environmental education and training ............................................................................... 32
3.3.2 Environmental policy and legislation .................................................................................. 34
3.3.3 Eco-innovation / research and development ..................................................................... 36
3.3.4 Environmental safety and health ......................................................................................... 38
3.3.5 Environmental communications and public awareness ................................................. 39
3
Table of Tables
Table 1 Employment in Key Agricultural Occupations ................................................................................................................ 9
Table 2 Certified Organic Products .................................................................................................................................................... 10
Table 3 Employment in Forestry Occupations 1996-2006 ...................................................................................................... 11
Table 4 Growth in industry demand for Forestry Professionals ........................................................................................... 12
Table 5 Employment in Conservation of Wildlife and Fisheries ............................................................................................ 12
Table 6 Employment in Mining Occupations ................................................................................................................................ 13
Table 7 Industry Expenditures on Energy-Related Environmental Processes and Technologies............................ 14
Table 8 KW Capacity by Renewable Energy Source .................................................................................................................... 15
Table 9 Direct Employment Estimates for the Canadian Wind Industry ........................................................................... 17
Table 10 All Vehicles in Scope for Canada by Fuel Type ........................................................................................................... 18
Table 11 Alberta investments in Carbon Capture and Storage ............................................................................................. 20
Table 12 Growth in Waste Management Employment ............................................................................................................. 24
Table 13 Trend in Per-Capita Waste Management in Canada ............................................................................................... 25
Table 14 Government Spending for Federal Contaminated Sites ........................................................................................ 29
Table 15 Revenues from Sales of Noise and Vibration Abatement ..................................................................................... 32
Table 16 Enrolment in University Environmental Education in Canada 1998-2007 ................................................... 34
Table 17 Occupations in Environmental Policy and Legislation ........................................................................................... 35
Table 18 Industries Employing Natural and Applied Science Policy ................................................................................... 36
Table 19 Total Public Relations and Communications Occupations ................................................................................... 40 Table of Figures
Figure 1 Canadian Environmental Goods and Services Sector Model ..................................................................... 5
Figure 2 Future Growth Expectations for Worker Demand in each Environmental Sub-sector ...................... 6
Figure 3 Total Employment in Agriculture 1976 - Present ........................................................................................ 8
Figure 4 Sustainable Development on Agricultural Land ........................................................................................... 9
Figure 5 Industries Employing Forestry Professionals, Forestry Technicians ....................................................... 10
Figure 6 Employment in the Forestry Sector 1990-2008 ......................................................................................... 11
Figure 7 Workers Employed in Electric Power Generation, Transmission & Distribution ................................ 14
Figure 8 Generation Capacity of Renewable Energy Sources in Canada ............................................................. 15
Figure 9 Revenues and Workers Employed in Manufacturing of Solar Power Panels ...................................... 16
Figure 10 Growth in Wind Generation Capacity in Canada .................................................................................... 16
Figure 11 Capital Expenditures on Air Pollution 1995-2006 .................................................................................. 19
Figure 12 Revenues of Canadian Firms for Air Pollution Control Goods and Services ..................................... 19
................................. 20
Figure 14 Industry Capital Expenditures on Water Pollution 1995-2006 ........................................................... 21
Figure 15 Employees in Water, Sewage, and similar systems ................................................................................. 22
Figure 16 Capital Expenditures on Water, Sewage and Other Water Utility Systems ..................................... 22
Figure 17 Expenditures on Repairs to Water, Sewage and Other Water Utility Systems ................................ 23
Figure 18 Growth in Waste Management Employment............................................................................................ 24
Figure 19 Employment and Revenues in Waste Management................................................................................ 25
Figure 20 Employment and Per-Capita Waste Generations .................................................................................... 26 Figure 21 Employment in Waste Management 1996-2006 Figure 22 Growth in Employment for Remediation Services Figure 23 Environmental Remediation Spending 1995-2006 Figure 24 Spending on Wildlife and Habitat Protection Figure 25 Total Research and Development Employment in Canada Figure 26 Expenditures on Energy R&D by Type of Expenditure Figure 27 Employment of R&D Personnel in Resource Industries Figure 28 Occupations in Public and Environmental Health and Safety Figure 29 Number of Accepted Work-Related Time-Loss Injuries in Canada

4
1.0 INTRODUCTION
1.1 ABOUT ECO CANADA
Environmental Careers Organization Canada (ECO Canada) is a not-for-profit corporation that assists the
Canadian environment sector in implementing sound human resource development policies. Since its
founding in 1992 (as the Canadian Council for Human Resources in the Environment Industry or
CCHREI), ECO Canada has taken great strides toward developing a national human resource strategy that
is focused towards the needs of environmental practitioners, employers and educators.
1.2 RESEARCH OBJECTIVES
ECO Canada has been collecting labour market information relevant to the environmental sector for over
15 years. Due to the dispersed and diversified nature of the sector itself, the majority of information has
had limited applicability as regional and other modalities are often so substantive that it is hard to
identify common denominators and monitor common indicators.
ECO Canada therefore commissioned the Canadian Environmental Sector Trends study to obtain baseline
data from a macro and micro level analysis of factors & drivers of change and growth within the
environmental sector with a special focus on how those changes impact employment, occupations and
labour issues.
As part of this project, the research team spoke with several key informants who are experts on the
Canadian environmental industry and its sub-divisions. These informants identified key trends that they
view as major factors that are currently driving changes in environmental employment in Canada as well
as factors that they see as major drivers in the future. In the report, these trends were explored using
secondary data to describe how these trends are likely to shape demand for environmental employment
in the future. The key micro trends in each sub-sector of the environmental sector and their potential
impact on the environmental labour market were also investigated and are outlined in this report.
The primary report can be found in a separate ECO Canada report entitled 2010 Canadian Environmental
Sector Trends Final Report. This report provides employers, government, environmental practitioners and
tory, the drivers and
barriers of growth in the sector. The research in the report is organized according to a new model for
categorization of employment in the environmental sector that is based on the definitional structure of
the Environmental Goods and Services Sector recently adopted by the United Nations and the European
Commission. Use of this definitional framework allows for comparisons between Canada and other
nations.
The report contains statistics and commentary which are useful for policy development to support
growth of the sector. The report findings have implications for developing a proactive policy for human
resource development in the sector and addresses current and future potential labour supply and
demand gaps. It may also be used to inform government policy decisions on the direction of future
environmental employment, particularly the impacts of social, economic and other drivers on
environmental employment. The project provides direction to government regarding what areas of
environmental employment are of primary importance to support and, therefore, what policies may be
implemented to ensure the healthy future development of environmental employment in Canada.

5
The following discussion of the divisions of the environmental sector is organized according to the
domains of the Canadian Environmental Goods and Services Sector (Figure 1), beginning with the
Resource Management (inputs) followed by the Environmental Protection domain (outputs). A
discussion of activities that span both domains follows.
Figure 1
Canadian Environmental Goods and Services Sector Model

6
2.0 EXECUTIVE SUMMARY
In this section, we review trends in each division of the Environmental Goods and Services Sector and
focus primarily on identifying the size and growth of employment in each sector.
The greatest growth will occur in the energy-related divisions (energy efficiency, renewable energy
generation, alternative fuels, and alternative fuel vehicles). Several of the energy-related sectors have
seen double-digit growth over the past decade and will continue to grow. Climate change mitigation
has been growing with provinces implementing provincial emissions reduction and trading schemes
(Figure 2). Further compliance mechanisms could stimulate future growth in both new jobs and new
skills in this area.
Figure 2 Future Growth Expectations for Worker Demand in each
Environmental Sub-sector
High to moderate growth is expected eco-innovation, protection of biodiversity, environmental health
and safety, and environmental remediation. Spending on eco-innovation for energy efficiency is related
to energy prices with demand for more efficient processes and products going up when energy prices
spike. Protection of bio-diversity is a small but growing area with most provinces developing a bio-
diversity protection division within the last few years. Accelerated spending on federal contaminated
sites will drive high growth in site assessments and site remediation in the next few years.
Environmental health and safety employment has grown by 8% per year between the last two census
periods (2001 and 2006) driven by regulation and efforts by firms to mitigate exposure to injury
litigation.
Several of the more traditional environmental industry areas continue to grow in the 3% to 5%
employment growth range. These stable growth industries are growing in line with or slightly faster
than overall national employment growth. They include protection of ambient air, water systems design
(for water supply), waste management, environmental education, environmental policy and legislation,
and environmental employment and communications.

7
Growth in some sectors has been flat for some time. These include water quality protection, water and
wastewater utilities. Industry capital expenditures for water quality protection have been flat for the
past decade and employment in water utilities has been flat for several decades, with essentially the
same number of workers employed in the sector today as were employed 20 years ago. Retirements of
these workers, however, will drive replacement demand.
Employment in the natural resources industries (agriculture, forestry, fishing, and minerals (except oil
and gas) have been in long-term structural decline. Most growth in these areas is in changes in the
skills required of workers. There is significant growth in the number of farms using organic farming
practices, however the total number of workers employed has declined. There is growth in demand for
forestry professionals in the government sector where efforts are made to manage sustainable forests.
However, overall the demand for professionals and workers in all parts of the forestry sector are in
decline. Employment in the minerals sector is highly cyclical, with employment driven by commodity
prices while the industry experiences long-term structural declines in employment as technology and
innovation make mines more efficient.
8
3.0 DRIVERS OF EMPLOYMENT IN ENVIRONMENTAL
SUB-SECTORS
3.1 ENVIRONMENTAL INPUTS: RESOURCE MANAGEMENT
3.1.1 MANAGEMENT OF NATURAL RESOURCES
Resource management of natural resources includes management of agricultural resources, forest
resources, wildlife and fisheries resources, and minerals resources. The focus in agricultural resource
management is on sustainable agricultural practices and development of organic or other farming
techniques which protect land and agricultural resources. The focus in forest management is on forest
resources that are non-cultivated All of the activities
that are carried out for the maintenance and management of these resources are included in forest
management. This includes restoration activities (reforestation and afforestation) as well as the
prevention and control of forest fires. Management of wildlife and fisheries activities are aimed at the
minimization of the intake or disturbance of wild flora and fauna through in-process modifications as
well as withdrawals reduction and regulation measures. Restoration activities are included
carried out for their maintenance and management. Often the management of game reserves, e.g. in the
case of birds, has the purpose of
Management of minerals comprises activities aimed at the minimization of the intake of minerals
through in-process modifications as well as the reduction of scraps and the production and consumption
of recycled materials and products.
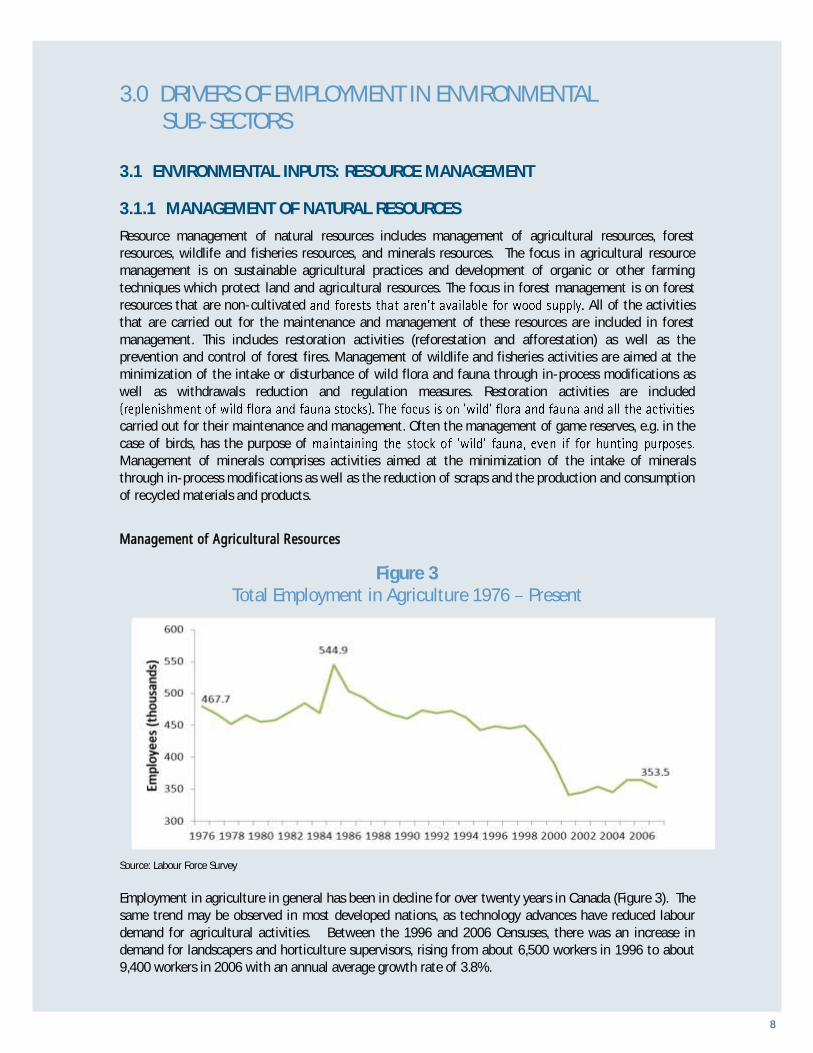
Management of Agricultural Resources
Figure 3 Total Employment in Agriculture 1976 Present
Source: Labour Force Survey
Employment in agriculture in general has been in decline for over twenty years in Canada (Figure 3). The
same trend may be observed in most developed nations, as technology advances have reduced labour
demand for agricultural activities. Between the 1996 and 2006 Censuses, there was an increase in
demand for landscapers and horticulture supervisors, rising from about 6,500 workers in 1996 to about
9,400 workers in 2006 with an annual average growth rate of 3.8%.
9
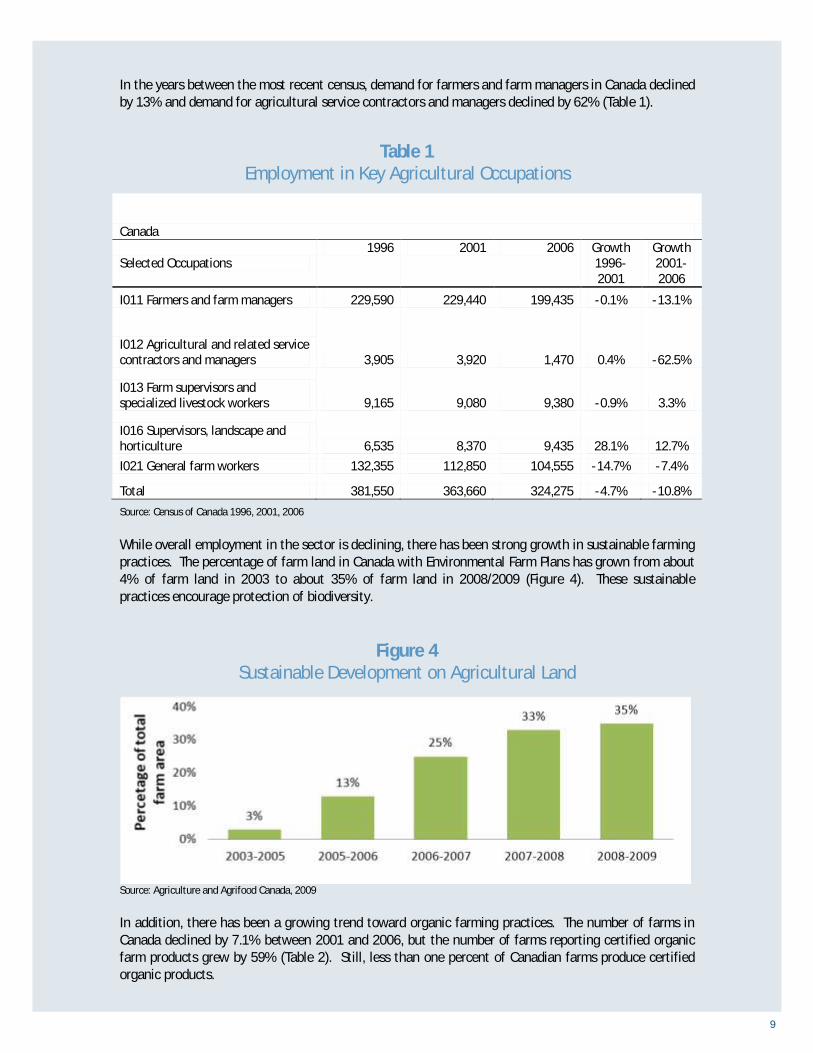
In the years between the most recent census, demand for farmers and farm managers in Canada declined
by 13% and demand for agricultural service contractors and managers declined by 62% (Table 1).
Table 1 Employment in Key Agricultural Occupations
Canada
Selected Occupations
1996 2001 2006 Growth
1996-
2001
Growth
2001-
2006
I011 Farmers and farm managers 229,590 229,440 199,435 -0.1% -13.1%
I012 Agricultural and related service
contractors and managers 3,905 3,920 1,470 0.4% -62.5%
I013 Farm supervisors and
specialized livestock workers 9,165 9,080 9,380 -0.9% 3.3%
I016 Supervisors, landscape and
horticulture 6,535 8,370 9,435 28.1% 12.7%
I021 General farm workers 132,355 112,850 104,555 -14.7% -7.4%
Total 381,550 363,660 324,275 -4.7% -10.8%
Source: Census of Canada 1996, 2001, 2006
While overall employment in the sector is declining, there has been strong growth in sustainable farming
practices. The percentage of farm land in Canada with Environmental Farm Plans has grown from about
4% of farm land in 2003 to about 35% of farm land in 2008/2009 (Figure 4). These sustainable
practices encourage protection of biodiversity.
Figure 4 Sustainable Development on Agricultural Land
Source: Agriculture and Agrifood Canada, 2009
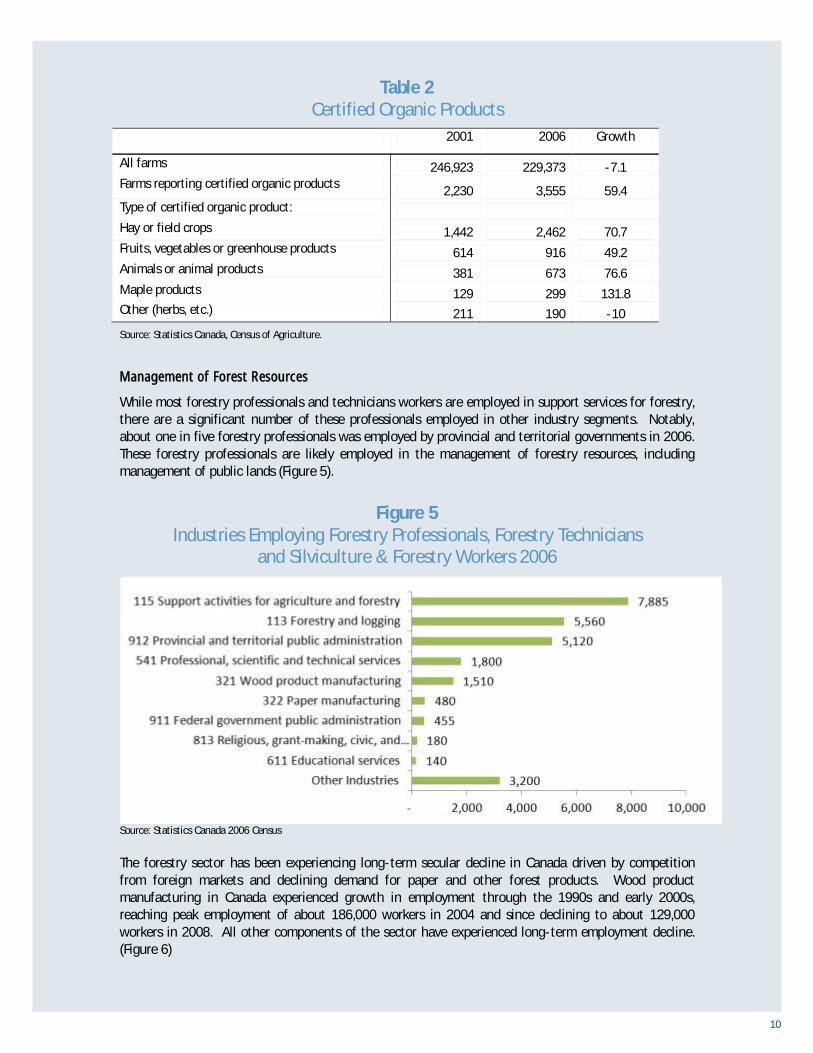
In addition, there has been a growing trend toward organic farming practices. The number of farms in
Canada declined by 7.1% between 2001 and 2006, but the number of farms reporting certified organic
farm products grew by 59% (Table 2). Still, less than one percent of Canadian farms produce certified
organic products.
10
Table 2 Certified Organic Products
2001 2006 Growth
All farms 246,923 229,373 -7.1
Farms reporting certified organic products 2,230 3,555 59.4
Type of certified organic product:
Hay or field crops 1,442 2,462 70.7
Fruits, vegetables or greenhouse products 614 916 49.2
Animals or animal products 381 673 76.6
Maple products 129 299 131.8
Other (herbs, etc.) 211 190 -10
Source: Statistics Canada, Census of Agriculture.
Management of Forest Resources
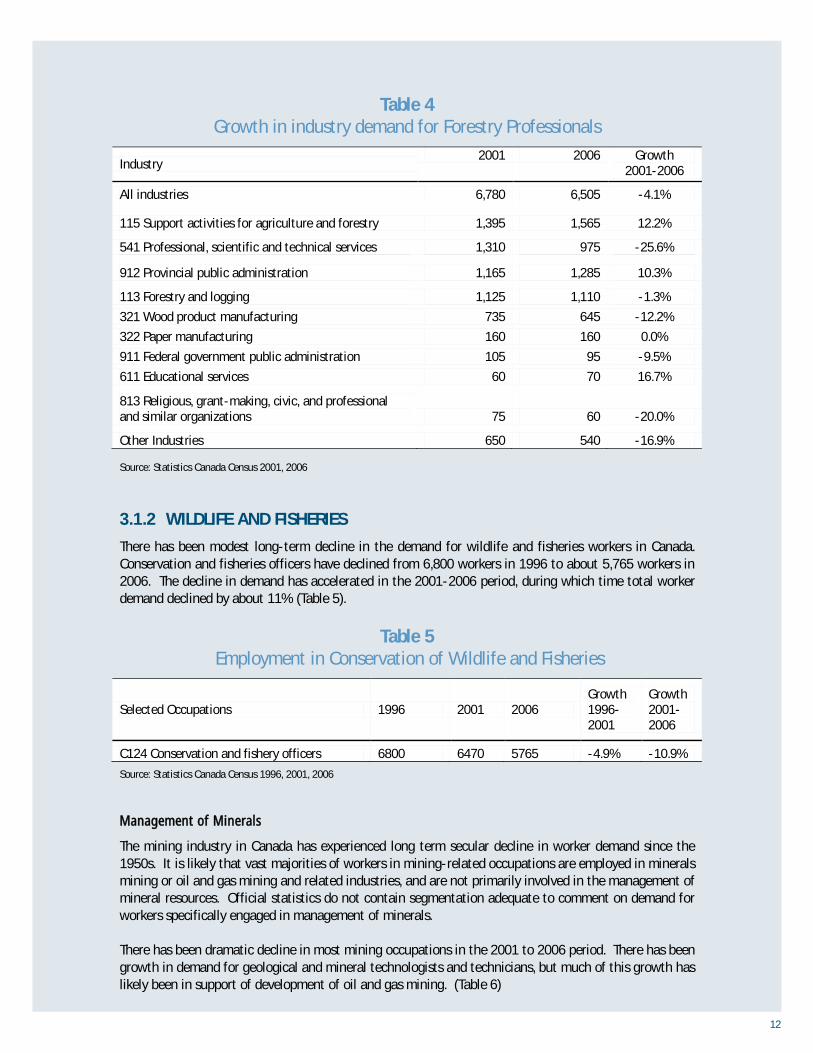
While most forestry professionals and technicians workers are employed in support services for forestry,
there are a significant number of these professionals employed in other industry segments. Notably,
about one in five forestry professionals was employed by provincial and territorial governments in 2006.
These forestry professionals are likely employed in the management of forestry resources, including
management of public lands (Figure 5).
Figure 5
Industries Employing Forestry Professionals, Forestry Technicians
and Silviculture & Forestry Workers 2006
Source: Statistics Canada 2006 Census
The forestry sector has been experiencing long-term secular decline in Canada driven by competition
from foreign markets and declining demand for paper and other forest products. Wood product
manufacturing in Canada experienced growth in employment through the 1990s and early 2000s,
reaching peak employment of about 186,000 workers in 2004 and since declining to about 129,000
workers in 2008. All other components of the sector have experienced long-term employment decline.
(Figure 6)

11
Figure 6 Employment in the Forestry Sector 1990-2008
Source: Labour Force Survey
Between 1996 and 2001, there was growth in demand for forestry professionals (42% growth), forestry
technicians (4.8% growth) and silviculture and forestry workers (22% growth). The growth in these
professions did not carry through the next census gap, when negative growth rates were experienced for
essentially all forestry occupations. (Table 3)
Table 3
Employment in Forestry Occupations 1996-2006
Employment in Selected Occupations 1996 2001 2006
Growth
1996-
2001
Growth
2001-
2006
C022 Forestry professionals 4,750 6,780 6,505 42.7% -4.1%
C123 Forestry technologists and technicians 10,455 10,960 9,805 4.8% -10.5%
I11 Supervisors, logging and forestry 6,530 5,335 4,620 -18.3% -13.4%
I16 Logging and forestry workers 34,375 29,370 22,335 -14.6% -24.0%
I161 Chain saw and skidder operators 24,610 17,430 12,315 -29.2% -29.3%
I162 Silviculture and forestry workers 9,770 11,935 10,020 22.2% -16.0%
I216 Logging and forestry labourers 19,180 15,485 12,745 -19.3% -17.7%
J015 Supervisors, forest products processing 11,825 11,020 10,150 -6.8% -7.9%
Total 121,495 108,315 88,495 -10.8% -18.3%
Source: Census of Canada 1996, 2001, 2002
Industries that have experienced significant growth in demand for these workers include support
activities for agriculture and forestry (12% growth) and provincial administration (10% growth).
(Table 4)
12
Table 4 Growth in industry demand for Forestry Professionals
Industry 2001 2006 Growth
2001-2006
All industries 6,780 6,505 -4.1%
115 Support activities for agriculture and forestry 1,395 1,565 12.2%
541 Professional, scientific and technical services 1,310 975 -25.6%
912 Provincial public administration 1,165 1,285 10.3%
113 Forestry and logging 1,125 1,110 -1.3%
321 Wood product manufacturing 735 645 -12.2%
322 Paper manufacturing 160 160 0.0%
911 Federal government public administration 105 95 -9.5%
611 Educational services 60 70 16.7%
813 Religious, grant-making, civic, and professional
and similar organizations 75 60 -20.0%
Other Industries 650 540 -16.9%
Source: Statistics Canada Census 2001, 2006
3.1.2 WILDLIFE AND FISHERIES
There has been modest long-term decline in the demand for wildlife and fisheries workers in Canada.
Conservation and fisheries officers have declined from 6,800 workers in 1996 to about 5,765 workers in
2006. The decline in demand has accelerated in the 2001-2006 period, during which time total worker
demand declined by about 11% (Table 5).
Table 5
Employment in Conservation of Wildlife and Fisheries
Selected Occupations 1996 2001 2006
Growth
1996-
2001
Growth
2001-
2006
C124 Conservation and fishery officers 6800 6470 5765 -4.9% -10.9%
Source: Statistics Canada Census 1996, 2001, 2006
Management of Minerals
The mining industry in Canada has experienced long term secular decline in worker demand since the
1950s. It is likely that vast majorities of workers in mining-related occupations are employed in minerals
mining or oil and gas mining and related industries, and are not primarily involved in the management of
mineral resources. Official statistics do not contain segmentation adequate to comment on demand for
workers specifically engaged in management of minerals.
There has been dramatic decline in most mining occupations in the 2001 to 2006 period. There has been
growth in demand for geological and mineral technologists and technicians, but much of this growth has
likely been in support of development of oil and gas mining. (Table 6)

13
Table 6 Employment in Mining Occupations
Selected Occupations 1996 2001 2006
Growth
1996-
2001
Growth
2001-
2006
C112 Geological and mineral technologists and
technicians 8,670 8,405 10,075 -3.1% 19.9%
J111 Central control and process operators, mineral and
metal processing 5,605 6,550 3,780 16.9% -42.3%
J121 Machine operators, mineral and metal processing 10,155 13,985 8,585 37.7% -38.6%
J125 Inspectors and testers, mineral and metal
processing 4,335 4,575 4,070 5.5% -11.0%
Source: Statistics Canada Census 1996, 2001, 2006
3.1.3 MANAGEMENT OF ENERGY RESOURCES
Management of energy resources comprises activities aimed at the minimization of the intake of fossil
resources through the production of energy from renewable sources, heat/energy saving and
management and the minimization of the intake of fossil resources for raw materials for uses other than
energy production.
Heat Savings and Energy Efficiency
Workers engaged in energy efficiency and heat savings may be employed in:
The construction sector Workers employed in the installation of energy-efficient building
technology, especially in energy efficiency upgrades to homes or to industry as well as new building
construction.
The manufacturing sector Workers employed in the design of energy-efficient processes and products.
Government Includes a variety of program administrators, energy auditors, city planners, civil
engineers, and similar workers engaged in government programs to reduce energy demand and increase efficiency.
Service Sectors Workers employed in facilities management and related activities.
There is no comprehensive source of information on the number of workers engaged in energy-efficiency
activities. The number of workers in the segment has likely increased in step with growth in spending on
energy related environmental processes and technologies. From 2002 to 2006, there was a 78% increase
in such expenditures in the manufacturing and natural resource sectors. This equates to an annual
average growth rate of 16%. It is important to note, however, that the actual growth in the sector is
not gradual. Most of this growth occurred more recently in 2004-2006. Total expenditures declined
from 2002 to 2004. The more labour-intensive operating expenditures increased only marginally from
the 2002-2004 period. (Table 7)

14
Table 7 Industry Expenditures on Energy-Related Environmental Processes
and Technologies
Years 2002 2004 2006
Annual
Growth
2002-
2006
Operating Expenditures $ 523.0 $ 575.8 $ 1,009.0 18%
Capital Expenditures $ 583.3 $ 379.3 $ 964.0 13%
Total Expenditures $ 1,106.3 $ 955.1 $ 1,973.0 16%
Source: Statistics Canada Survey of Environmental Protection Expenditures in the Business Sector
In the construction sector, growth in demand for energy auditors is perhaps the best indicator of growth.
program was formed. In 2008, the first year of the program, there were 1,004 energy auditors who were
certified by the ecoENERGY program. This number grew by 76% in the 2008 to 2009 period to 1,770
workers. The Atlantic Provinces have higher concentrations of these workers on a per-capita basis. More
than half of these workers are employed in Ontario, where demand for these workers effectively doubled
between 2008 and 2009.
This high growth trend is expected to continue in the next few years while the ecoENERGY federal program
is in place. In addition, some provinces have introduced similar programs or matching programs which
further incentivize homeowners and businesses to invest in energy efficiency for their homes and facilities.
Renewable Energy Resources
The total number of workers employed in electric resources has varied in the last two decades. In the period
from 1990 through 1998, the industry underwent gradual decline in employment, decreasing from about
100,800 workers in 1990 to 83,200 workers in 1998. Since 1998, the number of workers in the industry has
increased. There were 93,000 workers employed in the industry in 2008. (Figure 7) The return to growth in
the industry is likely tied to the increase in employment related to renewable energy.
Figure 7 Workers Employed in Electric Power Generation, Transmission & Distribution
1991-2008
Source: Statistics Canada Survey of Employment Payroll and Hours (SEPH)

15
eration.
Biomass is the second largest component, representing 6% of capacity. Total renewable energy
generation capacity (including hydro, wind, solar, thermal, and other forms of energy generation), has
grown gradually in Canada since the 1980s at an average annual growth of about 1.1%. (Figure 8)
Figure 8
Generation Capacity of Renewable Energy Sources in Canada
Source: CIEEDAC Renewables Database
While the total generation has grown gradually, there has been tremendous growth in the segments
outside of hydro and biomass, namely in wind, solar, and thermal power generations. (Table 8)
Table 8 KW Capacity by Renewable Energy Source
KW Capacity
(X 1,000) 1980 1990 2000 2009
1990-
2000 Avg.
Annual
Growth
2000-
2009 Avg.
Annual
Growth
High Growth
Solar (on-grid) 405 417 2,121 43,150 20% 40%
Wind - 20 124,107 1,045,567 164% 27%
Geothermal 387 492 9,754 30,266 39% 13%
Low Growth Hydro 55,498,324 62,326,768 69,683,968 73,286,368 1.2% 0.6%
Biomass 1,988,041 3,759,097 4,681,993 4,828,093 2.5% 0.3%
Municipal Solid
Waste 21,100 22,300 22,300 22,300 0.0% 0.0%
Tidal - 20,000 20,000 20,000 0.0% 0.0%
Total 57,507,465 66,128,165 74,408,261 78,156,761 1.3% 0.5%
Source: CIEEDAC Renewables Database

16
PV Solar Power Generation
Employment in the solar power sector spans manufacturing of solar panels, sales and distribution,
installation, and maintenance of on-site solar power. The industry is comprised of grid-connected
solar power and off-grid generation at the site of consumption.
Figure 9 Revenues and Workers Employed in Manufacturing of Solar Power Panels
Source: Natural Resources Canada, Canmet Energy Survey of Active Solar Thermal Collectors
Total revenues for PV solar power generation in Canada have grown from $4.9 million in 2002 to $18.8
million in 2008. (Figure 9) Much of this growth has been driven by exports of solar panels. Employment
figures for manufacturing of panels indicate that employment has grown from a mere 169 workers in
1996 to over 1,000 workers in 2006. Since 2002, employment in the industry has growth at an annual
average growth rate of 19% per year, which is roughly the same average growth of revenue in the
sector.
There is little information available on the labour requirements for installation and maintenance of solar
panels. However, it is expected that growth in demand for installation of PV solar power will roughly
match domestic demand for sales of solar panels.
Wind Power
Figure 10 Growth in Wind Generation Capacity in Canada
Source: CIEEDAC Renewables Database
17
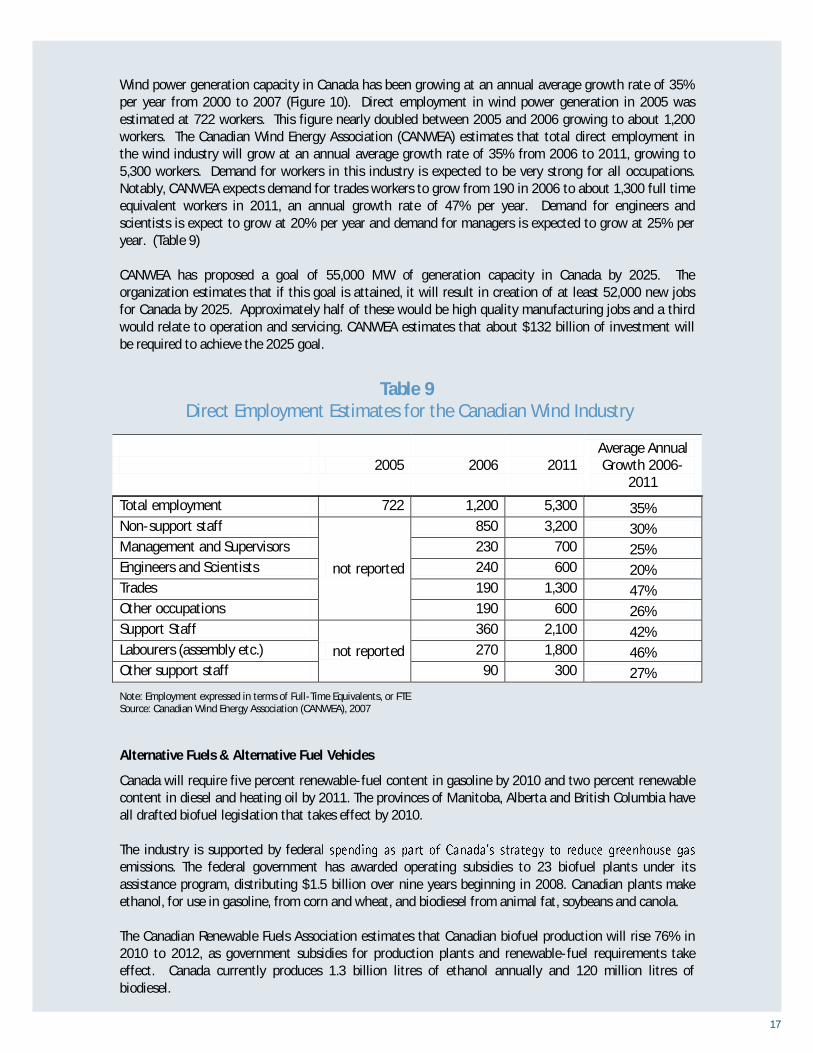
Wind power generation capacity in Canada has been growing at an annual average growth rate of 35%
per year from 2000 to 2007 (Figure 10). Direct employment in wind power generation in 2005 was
estimated at 722 workers. This figure nearly doubled between 2005 and 2006 growing to about 1,200
workers. The Canadian Wind Energy Association (CANWEA) estimates that total direct employment in
the wind industry will grow at an annual average growth rate of 35% from 2006 to 2011, growing to
5,300 workers. Demand for workers in this industry is expected to be very strong for all occupations.
Notably, CANWEA expects demand for trades workers to grow from 190 in 2006 to about 1,300 full time
equivalent workers in 2011, an annual growth rate of 47% per year. Demand for engineers and
scientists is expect to grow at 20% per year and demand for managers is expected to grow at 25% per
year. (Table 9)
CANWEA has proposed a goal of 55,000 MW of generation capacity in Canada by 2025. The
organization estimates that if this goal is attained, it will result in creation of at least 52,000 new jobs
for Canada by 2025. Approximately half of these would be high quality manufacturing jobs and a third
would relate to operation and servicing. CANWEA estimates that about $132 billion of investment will
be required to achieve the 2025 goal.
Table 9 Direct Employment Estimates for the Canadian Wind Industry
2005 2006 2011
Average Annual
Growth 2006-
2011
Total employment 722 1,200 5,300 35%
Non-support staff
not reported
850 3,200 30%
Management and Supervisors 230 700 25%
Engineers and Scientists 240 600 20%
Trades 190 1,300 47%
Other occupations 190 600 26%
Support Staff
not reported
360 2,100 42%
Labourers (assembly etc.) 270 1,800 46%
Other support staff 90 300 27%
Note: Employment expressed in terms of Full-Time Equivalents, or FTE Source: Canadian Wind Energy Association (CANWEA), 2007
Alternative Fuels & Alternative Fuel Vehicles
Canada will require five percent renewable-fuel content in gasoline by 2010 and two percent renewable
content in diesel and heating oil by 2011. The provinces of Manitoba, Alberta and British Columbia have
all drafted biofuel legislation that takes effect by 2010.
The industry is supported by federa
emissions. The federal government has awarded operating subsidies to 23 biofuel plants under its
assistance program, distributing $1.5 billion over nine years beginning in 2008. Canadian plants make
ethanol, for use in gasoline, from corn and wheat, and biodiesel from animal fat, soybeans and canola.
The Canadian Renewable Fuels Association estimates that Canadian biofuel production will rise 76% in
2010 to 2012, as government subsidies for production plants and renewable-fuel requirements take
effect. Canada currently produces 1.3 billion litres of ethanol annually and 120 million litres of
biodiesel.

18
Alternative fuel vehicles represent a small but growing share of total vehicles in use in Canada.
According to the Canadian Vehicle Survey, the number of alternative fuels vehicles in use in Canada
grew from 68,645 in 2001 to 82,231 in 2008, an average annual increase of 3.1%. (Table 10) Production
of alternative fuel vehicles in the US has grown at an annual growth rate of 12% per year from 2003 to
2007.
Table 10 All Vehicles in Scope for Canada by Fuel Type
Total, all vehicles 2001 2008
Total, all fuel types 17,444,421 20,166,421
Gasoline 16,470,569 18,923,790
Diesel 905,207 1,160,400
Other fuel type 68,645 82,231
Source: Canadian Vehicle Survey
3.2 ENVIRONMENTAL OUTPUTS: ENVIRONMENTAL PROTECTION
3.2.1 PROTECTION OF AMBIENT AIR AND CLIMATE
Protection of ambient air and climate comprises measures and activities aimed at the reduction of
emissions into the ambient air or ambient concentrations of air pollutants in addition to measures and
activities aimed at the control of emissions of greenhouse gases and gases that adversely affect the
stratospheric ozone layer.
Employment in protection of ambient air and climate is difficult to quantify and is not well tracked in
Canada. The sector is comprised of activities related to pollution control and prevention as well as
activities related to reduction of greenhouse gas emissions.
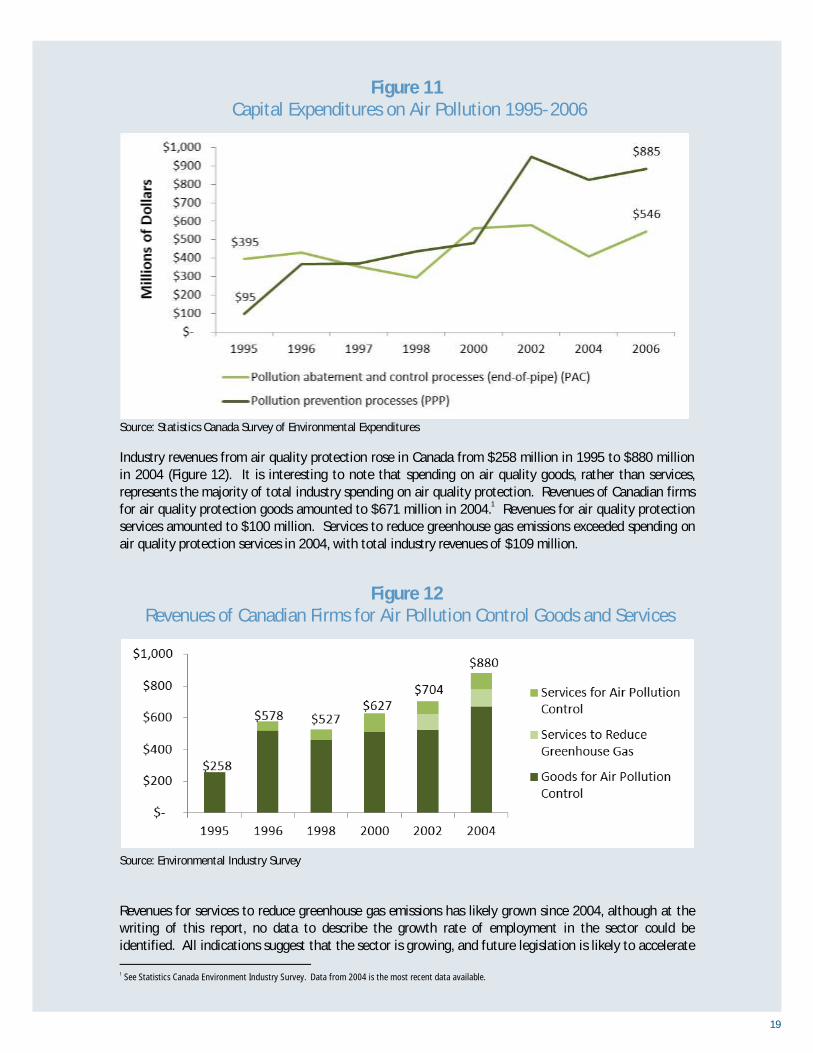
Employment in air pollution control has declined in the EU, due to maturity of the industry. Over the
past decade, there has been an ongoing trend toward spending on air pollution prevention processes and
less growth in spending on air pollution abatement and control (end-of-pipe) processes. From 1995 to
2006, capital spending on air pollution prevention processes (PPPs) has growth from $95 million in 1995
to $885 million in 2006. Growth in spending has risen in intervals with strong growth in spending on
PPPs in 2006 and in the 2000-2002 periods. Capital spending on end-of-pipe processes has grown at a
more modest rate, increasing from $395 million in 1995 to $546 million in 2006. (Figure 11)
19
Figure 11 Capital Expenditures on Air Pollution 1995-2006
Source: Statistics Canada Survey of Environmental Expenditures
Industry revenues from air quality protection rose in Canada from $258 million in 1995 to $880 million
in 2004 (Figure 12). It is interesting to note that spending on air quality goods, rather than services,
represents the majority of total industry spending on air quality protection. Revenues of Canadian firms
for air quality protection goods amounted to $671 million in 2004.1 Revenues for air quality protection
services amounted to $100 million. Services to reduce greenhouse gas emissions exceeded spending on
air quality protection services in 2004, with total industry revenues of $109 million.
Figure 12 Revenues of Canadian Firms for Air Pollution Control Goods and Services
Source: Environmental Industry Survey
Revenues for services to reduce greenhouse gas emissions has likely grown since 2004, although at the
writing of this report, no data to describe the growth rate of employment in the sector could be
identified. All indications suggest that the sector is growing, and future legislation is likely to accelerate
1 See Statistics Canada Environment Industry Survey. Data from 2004 is the most recent data available.
20
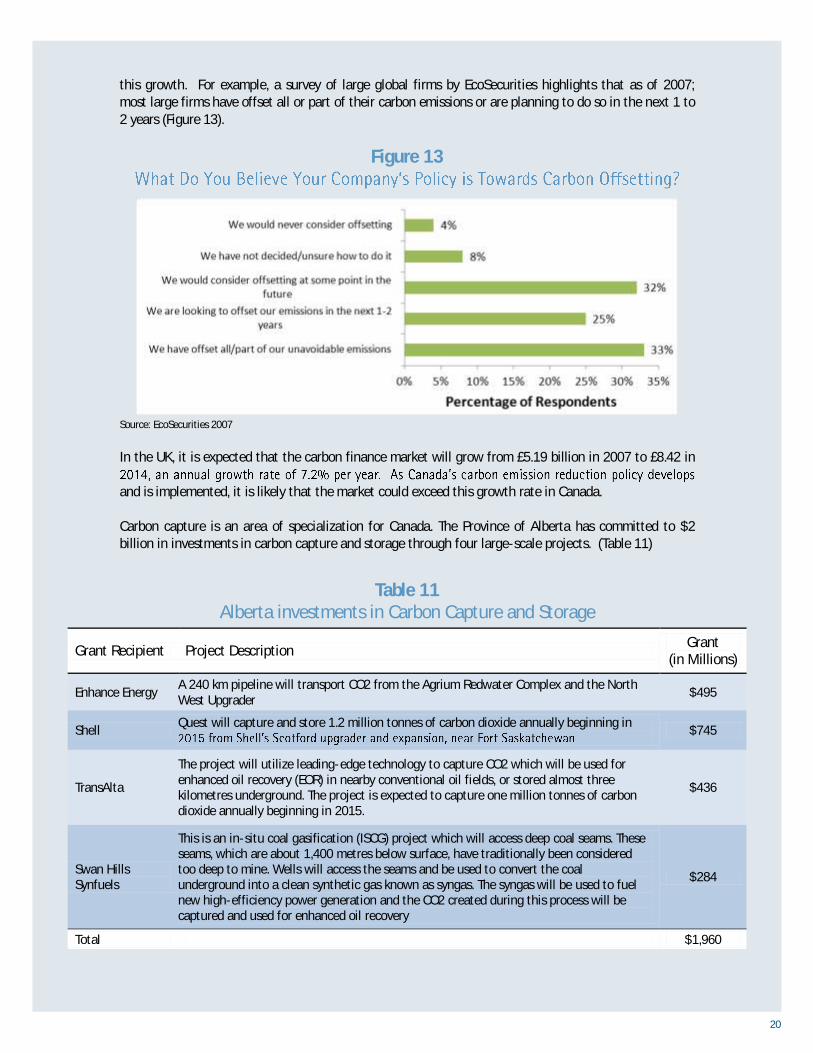
this growth. For example, a survey of large global firms by EcoSecurities highlights that as of 2007;
most large firms have offset all or part of their carbon emissions or are planning to do so in the next 1 to
2 years (Figure 13).
Figure 13
Source: EcoSecurities 2007
In the UK, it is expected that the carbon finance market will grow from £5.19 billion in 2007 to £8.42 in
and is implemented, it is likely that the market could exceed this growth rate in Canada.
Carbon capture is an area of specialization for Canada. The Province of Alberta has committed to $2
billion in investments in carbon capture and storage through four large-scale projects. (Table 11)
Table 11 Alberta investments in Carbon Capture and Storage
Grant Recipient Project Description Grant
(in Millions)
Enhance Energy A 240 km pipeline will transport CO2 from the Agrium Redwater Complex and the North
West Upgrader $495
Shell Quest will capture and store 1.2 million tonnes of carbon dioxide annually beginning in
$745
TransAlta
The project will utilize leading-edge technology to capture CO2 which will be used for
enhanced oil recovery (EOR) in nearby conventional oil fields, or stored almost three
kilometres underground. The project is expected to capture one million tonnes of carbon
dioxide annually beginning in 2015.
$436
Swan Hills
Synfuels
This is an in-situ coal gasification (ISCG) project which will access deep coal seams. These
seams, which are about 1,400 metres below surface, have traditionally been considered
too deep to mine. Wells will access the seams and be used to convert the coal
underground into a clean synthetic gas known as syngas. The syngas will be used to fuel
new high-efficiency power generation and the CO2 created during this process will be
captured and used for enhanced oil recovery
$284
Total $1,960
21
3.2.2 WATER PROTECTION, TREATMENT, SUPPLY, AND CONSERVATION
This segment includes conservation and management of water supply as a resource, protection of water
from pollution, and treatment of wastewater.
Management of water as a resource includes activities aimed at the minimization of inland waters
intake through in-process modifications as well the reduction of water losses and leaks or reduction of
the intake by substituting the resource with alternative resources, the installation and construction of
facilities for water reuse and savings, shower heads and taps, etc. Restoration activities are included.
Wastewater is defined as water that is of no further immediate value for the purpose for which it was
used or in the pursuit of which it was produced because of the quality, quantity or time of its
occurrence. Wastewater management comprises activities and measures aimed at preventing the
pollution of surface water by reducing the release of wastewater into inland surface water and seawater.
It includes the collection and treatment of wastewater including monitoring and regulation activities.
Septic tanks and cooling water systems are also included.
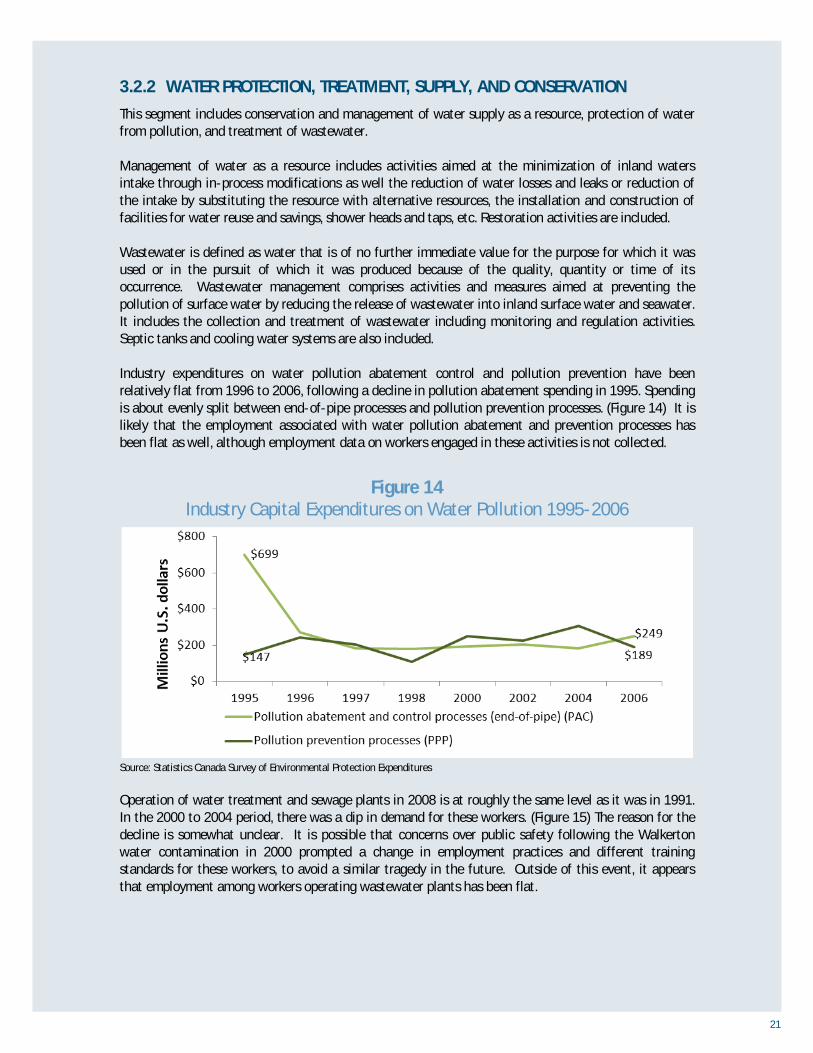
Industry expenditures on water pollution abatement control and pollution prevention have been
relatively flat from 1996 to 2006, following a decline in pollution abatement spending in 1995. Spending
is about evenly split between end-of-pipe processes and pollution prevention processes. (Figure 14) It is
likely that the employment associated with water pollution abatement and prevention processes has
been flat as well, although employment data on workers engaged in these activities is not collected.
Figure 14
Industry Capital Expenditures on Water Pollution 1995-2006
Source: Statistics Canada Survey of Environmental Protection Expenditures
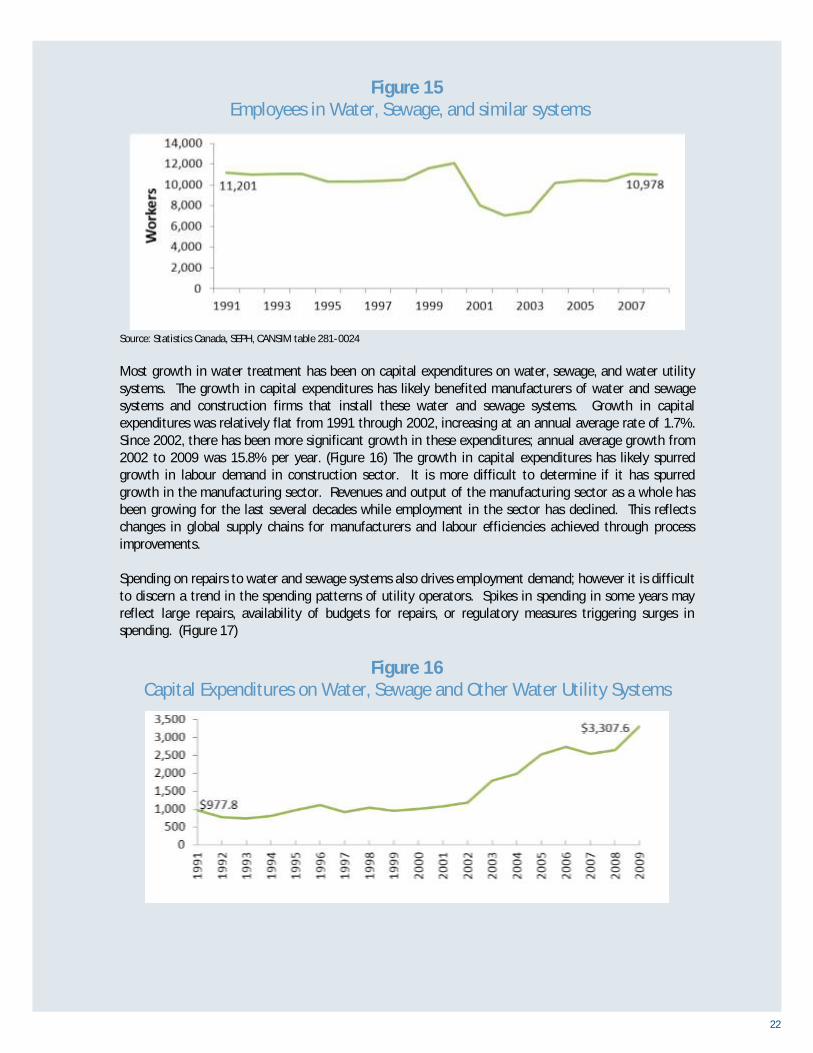
Operation of water treatment and sewage plants in 2008 is at roughly the same level as it was in 1991.
In the 2000 to 2004 period, there was a dip in demand for these workers. (Figure 15) The reason for the
decline is somewhat unclear. It is possible that concerns over public safety following the Walkerton
water contamination in 2000 prompted a change in employment practices and different training
standards for these workers, to avoid a similar tragedy in the future. Outside of this event, it appears
that employment among workers operating wastewater plants has been flat.
22
Figure 15 Employees in Water, Sewage, and similar systems
Source: Statistics Canada, SEPH, CANSIM table 281-0024
Most growth in water treatment has been on capital expenditures on water, sewage, and water utility
systems. The growth in capital expenditures has likely benefited manufacturers of water and sewage
systems and construction firms that install these water and sewage systems. Growth in capital
expenditures was relatively flat from 1991 through 2002, increasing at an annual average rate of 1.7%.
Since 2002, there has been more significant growth in these expenditures; annual average growth from
2002 to 2009 was 15.8% per year. (Figure 16) The growth in capital expenditures has likely spurred
growth in labour demand in construction sector. It is more difficult to determine if it has spurred
growth in the manufacturing sector. Revenues and output of the manufacturing sector as a whole has
been growing for the last several decades while employment in the sector has declined. This reflects
changes in global supply chains for manufacturers and labour efficiencies achieved through process
improvements.
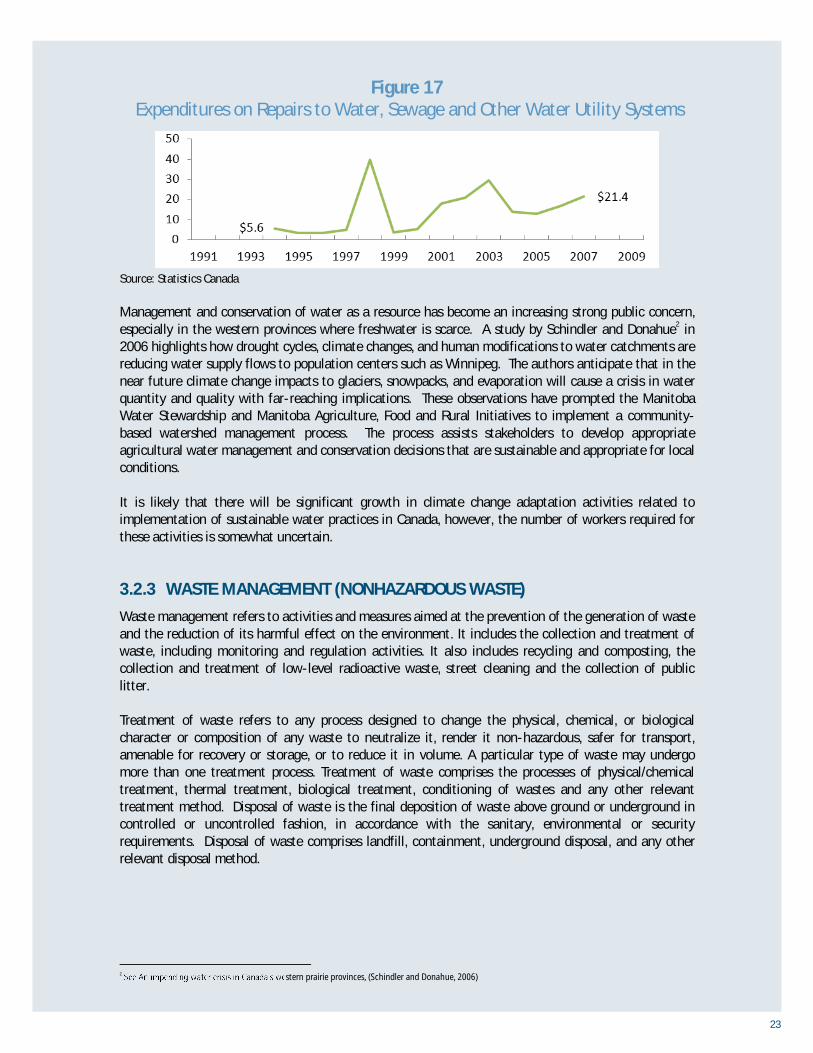
Spending on repairs to water and sewage systems also drives employment demand; however it is difficult
to discern a trend in the spending patterns of utility operators. Spikes in spending in some years may
reflect large repairs, availability of budgets for repairs, or regulatory measures triggering surges in
spending. (Figure 17)
Figure 16 Capital Expenditures on Water, Sewage and Other Water Utility Systems
23
Figure 17 Expenditures on Repairs to Water, Sewage and Other Water Utility Systems
Source: Statistics Canada
Management and conservation of water as a resource has become an increasing strong public concern,
especially in the western provinces where freshwater is scarce. A study by Schindler and Donahue2 in
2006 highlights how drought cycles, climate changes, and human modifications to water catchments are
reducing water supply flows to population centers such as Winnipeg. The authors anticipate that in the
near future climate change impacts to glaciers, snowpacks, and evaporation will cause a crisis in water
quantity and quality with far-reaching implications. These observations have prompted the Manitoba
Water Stewardship and Manitoba Agriculture, Food and Rural Initiatives to implement a community-
based watershed management process. The process assists stakeholders to develop appropriate
agricultural water management and conservation decisions that are sustainable and appropriate for local
conditions.
It is likely that there will be significant growth in climate change adaptation activities related to
implementation of sustainable water practices in Canada, however, the number of workers required for
these activities is somewhat uncertain.
3.2.3 WASTE MANAGEMENT (NONHAZARDOUS WASTE)
Waste management refers to activities and measures aimed at the prevention of the generation of waste
and the reduction of its harmful effect on the environment. It includes the collection and treatment of
waste, including monitoring and regulation activities. It also includes recycling and composting, the
collection and treatment of low-level radioactive waste, street cleaning and the collection of public
litter.
Treatment of waste refers to any process designed to change the physical, chemical, or biological
character or composition of any waste to neutralize it, render it non-hazardous, safer for transport,
amenable for recovery or storage, or to reduce it in volume. A particular type of waste may undergo
more than one treatment process. Treatment of waste comprises the processes of physical/chemical
treatment, thermal treatment, biological treatment, conditioning of wastes and any other relevant
treatment method. Disposal of waste is the final deposition of waste above ground or underground in
controlled or uncontrolled fashion, in accordance with the sanitary, environmental or security
requirements. Disposal of waste comprises landfill, containment, underground disposal, and any other
relevant disposal method.
2 stern prairie provinces, (Schindler and Donahue, 2006)

24
Figure 18 Growth in Waste Management Employment
Source: Statistics Canada SEPH
According to the Survey of Employment, Payroll and Hours (SEPH), direct employment in waste
management services has seen relatively stable growth since 1991, growing from about 11,770 workers
in 1991 to about 26,037 in 2008. (Figure 18) Employment in waste collection and employment in waste
treatment/ disposal have grown in step with one another although growth in waste collection
employment slightly outpaces growth in employment for disposal. Recently, in the 2005-2008 period,
waste collection employment has grown at 6.5% per year and waste treatment and disposal employment
has grown at 5.4% per year. (Table 12)
Table 12 Growth in Waste Management Employment
Employment Average Annual Growth
1991 2000 2005 2006 2007 2008
1991-
2000
2000-
2005
2005-
2008
Waste collection
4,055
6,711
8,278
8,745
9,942
9,992
5.8%
4.3%
6.5%
Waste treatment
and disposal
7,715
12,052
13,713
14,832
15,380
16,045
5.1%
2.6%
5.4%
Total 11,770 18,763 21,991 23,577 25,322 26,037 5.3% 3.2% 5.8%
Source: Statistics Canada SEPH
Demand for waste management, at a basic level, is driven by growth in waste generation as a result of
population growth, growth in waste per capita, and growth in commercial and industrial waste
generation.
Drawing conclusions on the impact of these drivers on waste management employment is difficult, in
part because of the lack of time-series data and in part because multiple forces shape demand for
employment in the sector. In addition, employment estimates from the SEPH do not align perfectly with
the estimates obtained through the in-depth Waste Management Industry Survey (WMIS) conducted
every two years in Canada. Employment figures from the WMIS indicate that there has been more
25
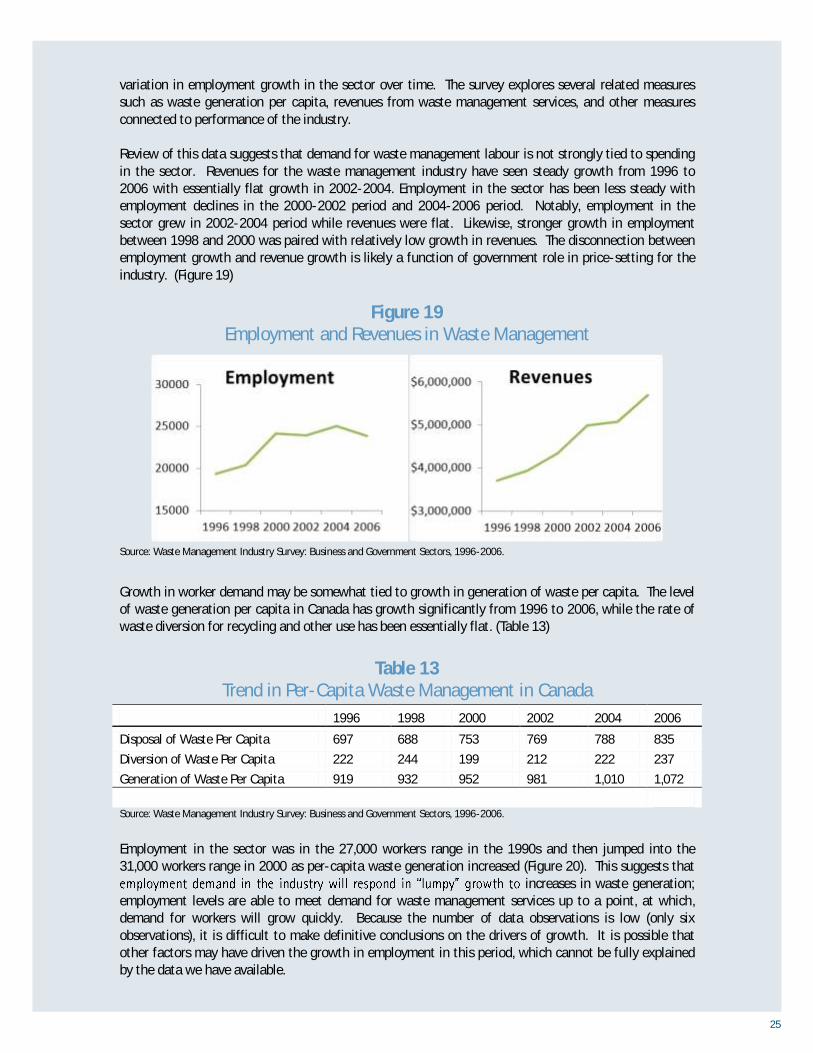
variation in employment growth in the sector over time. The survey explores several related measures
such as waste generation per capita, revenues from waste management services, and other measures
connected to performance of the industry.
Review of this data suggests that demand for waste management labour is not strongly tied to spending
in the sector. Revenues for the waste management industry have seen steady growth from 1996 to
2006 with essentially flat growth in 2002-2004. Employment in the sector has been less steady with
employment declines in the 2000-2002 period and 2004-2006 period. Notably, employment in the
sector grew in 2002-2004 period while revenues were flat. Likewise, stronger growth in employment
between 1998 and 2000 was paired with relatively low growth in revenues. The disconnection between
employment growth and revenue growth is likely a function of government role in price-setting for the
industry. (Figure 19)
Figure 19
Employment and Revenues in Waste Management
Source: Waste Management Industry Survey: Business and Government Sectors, 1996-2006.
Growth in worker demand may be somewhat tied to growth in generation of waste per capita. The level
of waste generation per capita in Canada has growth significantly from 1996 to 2006, while the rate of
waste diversion for recycling and other use has been essentially flat. (Table 13)
Table 13 Trend in Per-Capita Waste Management in Canada
1996 1998 2000 2002 2004 2006
Disposal of Waste Per Capita 697 688 753 769 788 835
Diversion of Waste Per Capita 222 244 199 212 222 237
Generation of Waste Per Capita 919 932 952 981 1,010 1,072
Source: Waste Management Industry Survey: Business and Government Sectors, 1996-2006.
Employment in the sector was in the 27,000 workers range in the 1990s and then jumped into the
31,000 workers range in 2000 as per-capita waste generation increased (Figure 20). This suggests that
increases in waste generation;
employment levels are able to meet demand for waste management services up to a point, at which,
demand for workers will grow quickly. Because the number of data observations is low (only six
observations), it is difficult to make definitive conclusions on the drivers of growth. It is possible that
other factors may have driven the growth in employment in this period, which cannot be fully explained
by the data we have available.

26
Figure 20 Employment and Per-Capita Waste Generation
Source: Waste Management Industry Survey: Business and Government Sectors, 1996-2006.
Most employment in waste management is in the business-sector, which is comprised of a mix of large
and small waste management businesses. Only about a quarter of workers are employed directly by local
governments in municipal-operated waste management services. There has been a gradual trend toward
privatization of the waste management sector, although this trend varies somewhat. In the most recent
period for which data is available (2004 to 2006), employment in the waste management industry
declined by 3% in total. Employment in the business sector of the industry was down by 5%, while
employment in the government sector in waste management rose by 5%. (Figure 21)
Figure 21 Employment in Waste Management 1996-2006
Source: Waste Management Industry Survey: Business and Government Sectors, 1996-2006.
27
Recycling
array of materials. Natural Resources Canada divides the industry into the following materials groups:
Construction, renovation and demolition
Glass
Metals
Minerals
Liquids, chemicals and gases
Oils and petrochemicals
Organic matter
Supply chains exist for each materials group, that are comprised of waste collectors, wholesalers,
dealers, processors, brokers/traders, generators, and other supply chain participants that provide specific
or unique services required for recycling of the particular material.
Employment in the recycling sector is not well tracked because of the integrated nature of the industry.
lists 4,845 recycling
firms which are in operation in Canada, ranging from large recycling employers such as Waste
Management to specialty recycling service providers. As mentioned earlier, per-capita waste
generation in Canada has grown significantly from 1996 to 2006, providing ample materials for recycling
services. However, policy on recycling requirements in Canada lags behind that of the EU.
-
growth in EU recycling employment. According to the EU Directorate General for the Environment,
employment in the recycled materials sector in Europe grew at nearly 11% per year from 2000 to 2008,
making it the second fastest growing environmental employment sector. It was also the second largest
employment segment in the EU environmental sector with over 512,000 workers in 2008. The segment
generated an impressive 283,000 new jobs in the between 2000 and 2008, making it the second largest
sub-sector contributing to new environmental jobs (behind waste management).
- ibility for the disposal of waste from
products they produce once those products have reached their useful life. Several provinces have
-
other products. In the absence of a federal program, it is difficult for recycling businesses to grow to
scale in Canada as provincial mandates differ from one another.
Paint, pigment and ink
Paper
Plastics
Rubber and tires
Textiles
Wood
28
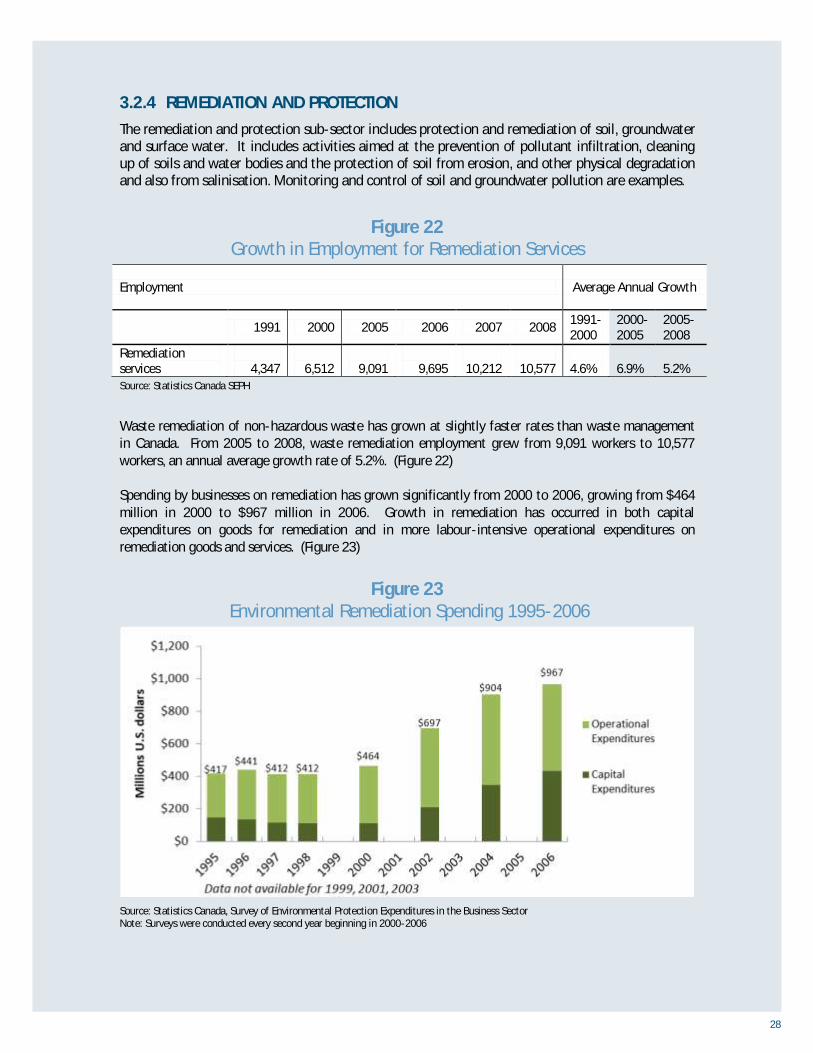
3.2.4 REMEDIATION AND PROTECTION
The remediation and protection sub-sector includes protection and remediation of soil, groundwater
and surface water. It includes activities aimed at the prevention of pollutant infiltration, cleaning
up of soils and water bodies and the protection of soil from erosion, and other physical degradation
and also from salinisation. Monitoring and control of soil and groundwater pollution are examples.
Figure 22 Growth in Employment for Remediation Services
Employment Average Annual Growth
1991 2000 2005 2006 2007 2008
1991-
2000
2000-
2005
2005-
2008
Remediation
services
4,347
6,512
9,091
9,695
10,212
10,577
4.6%
6.9%
5.2%
Source: Statistics Canada SEPH
Waste remediation of non-hazardous waste has grown at slightly faster rates than waste management
in Canada. From 2005 to 2008, waste remediation employment grew from 9,091 workers to 10,577
workers, an annual average growth rate of 5.2%. (Figure 22)
Spending by businesses on remediation has grown significantly from 2000 to 2006, growing from $464
million in 2000 to $967 million in 2006. Growth in remediation has occurred in both capital
expenditures on goods for remediation and in more labour-intensive operational expenditures on
remediation goods and services. (Figure 23)
Figure 23
Environmental Remediation Spending 1995-2006
Source: Statistics Canada, Survey of Environmental Protection Expenditures in the Business Sector
Note: Surveys were conducted every second year beginning in 2000-2006
29
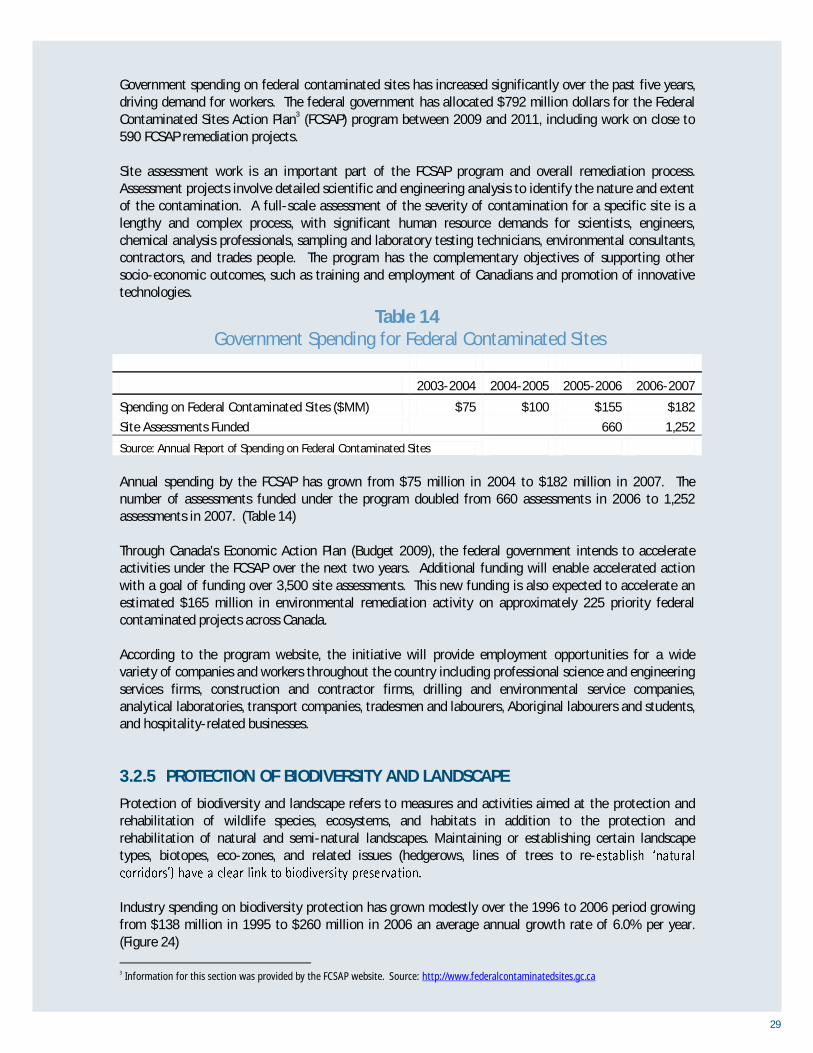
Government spending on federal contaminated sites has increased significantly over the past five years,
driving demand for workers. The federal government has allocated $792 million dollars for the Federal
Contaminated Sites Action Plan3 (FCSAP) program between 2009 and 2011, including work on close to
590 FCSAP remediation projects.
Site assessment work is an important part of the FCSAP program and overall remediation process.
Assessment projects involve detailed scientific and engineering analysis to identify the nature and extent
of the contamination. A full-scale assessment of the severity of contamination for a specific site is a
lengthy and complex process, with significant human resource demands for scientists, engineers,
chemical analysis professionals, sampling and laboratory testing technicians, environmental consultants,
contractors, and trades people. The program has the complementary objectives of supporting other
socio-economic outcomes, such as training and employment of Canadians and promotion of innovative
technologies.
Table 14
Government Spending for Federal Contaminated Sites
2003-2004 2004-2005 2005-2006 2006-2007
Spending on Federal Contaminated Sites ($MM) $75 $100 $155 $182
Site Assessments Funded
660 1,252
Source: Annual Report of Spending on Federal Contaminated Sites
Annual spending by the FCSAP has grown from $75 million in 2004 to $182 million in 2007. The
number of assessments funded under the program doubled from 660 assessments in 2006 to 1,252
assessments in 2007. (Table 14)
Through Canada's Economic Action Plan (Budget 2009), the federal government intends to accelerate
activities under the FCSAP over the next two years. Additional funding will enable accelerated action
with a goal of funding over 3,500 site assessments. This new funding is also expected to accelerate an
estimated $165 million in environmental remediation activity on approximately 225 priority federal
contaminated projects across Canada.
According to the program website, the initiative will provide employment opportunities for a wide
variety of companies and workers throughout the country including professional science and engineering
services firms, construction and contractor firms, drilling and environmental service companies,
analytical laboratories, transport companies, tradesmen and labourers, Aboriginal labourers and students,
and hospitality-related businesses.
3.2.5 PROTECTION OF BIODIVERSITY AND LANDSCAPE
Protection of biodiversity and landscape refers to measures and activities aimed at the protection and
rehabilitation of wildlife species, ecosystems, and habitats in addition to the protection and
rehabilitation of natural and semi-natural landscapes. Maintaining or establishing certain landscape
types, biotopes, eco-zones, and related issues (hedgerows, lines of trees to re-
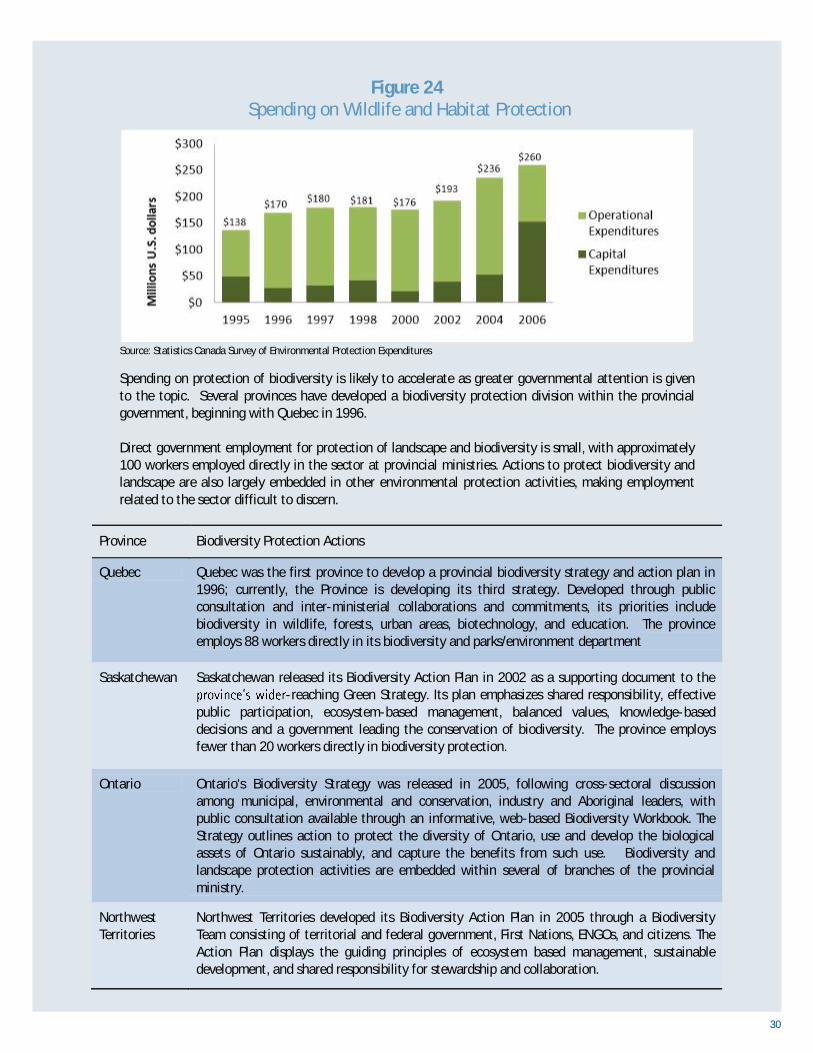
Industry spending on biodiversity protection has grown modestly over the 1996 to 2006 period growing
from $138 million in 1995 to $260 million in 2006 an average annual growth rate of 6.0% per year.
(Figure 24)
3 Information for this section was provided by the FCSAP website. Source: http://www.federalcontaminatedsites.gc.ca
30
Figure 24 Spending on Wildlife and Habitat Protection
Source: Statistics Canada Survey of Environmental Protection Expenditures
Spending on protection of biodiversity is likely to accelerate as greater governmental attention is given
to the topic. Several provinces have developed a biodiversity protection division within the provincial
government, beginning with Quebec in 1996.
Direct government employment for protection of landscape and biodiversity is small, with approximately
100 workers employed directly in the sector at provincial ministries. Actions to protect biodiversity and
landscape are also largely embedded in other environmental protection activities, making employment
related to the sector difficult to discern.
Province Biodiversity Protection Actions
Quebec Quebec was the first province to develop a provincial biodiversity strategy and action plan in
1996; currently, the Province is developing its third strategy. Developed through public
consultation and inter-ministerial collaborations and commitments, its priorities include
biodiversity in wildlife, forests, urban areas, biotechnology, and education. The province
employs 88 workers directly in its biodiversity and parks/environment department
Saskatchewan Saskatchewan released its Biodiversity Action Plan in 2002 as a supporting document to the
-reaching Green Strategy. Its plan emphasizes shared responsibility, effective
public participation, ecosystem-based management, balanced values, knowledge-based
decisions and a government leading the conservation of biodiversity. The province employs
fewer than 20 workers directly in biodiversity protection.
Ontario Ontario's Biodiversity Strategy was released in 2005, following cross-sectoral discussion
among municipal, environmental and conservation, industry and Aboriginal leaders, with
public consultation available through an informative, web-based Biodiversity Workbook. The
Strategy outlines action to protect the diversity of Ontario, use and develop the biological
assets of Ontario sustainably, and capture the benefits from such use. Biodiversity and
landscape protection activities are embedded within several of branches of the provincial
ministry.
Northwest
Territories
Northwest Territories developed its Biodiversity Action Plan in 2005 through a Biodiversity
Team consisting of territorial and federal government, First Nations, ENGOs, and citizens. The
Action Plan displays the guiding principles of ecosystem based management, sustainable
development, and shared responsibility for stewardship and collaboration.

31
Province Biodiversity Protection Actions
New
Brunswick
New Brunswick launched a Provincial Biodiversity Strategy on June 18, 2009. The Strategy
provides a framework for advancing a coordinated and collaborative approach to the
conservation and sustainable use of biological resources, representing a significant
evolutionary step forward. Influenced by the Biodiversity Outcomes Framework for Canada, the
strategy will be followed up with the development of biodiversity action plans over the next
12 to 16 months. These plans will involve stakeholders and will identify specific actions
management outcomes. A New Brunswick Biodiversity Secretariat will be established to
provide coordination and support to the Strategy. The province directly employs about 20
workers in biodiversity protection.
Manitoba Manitoba has developed Sustainable Development Strategies for natural lands and special
places, forestry, energy and mines, soil and water, and wildlife and fish, as well as initiatives
such as the Prairie Conservation Action Plan and long-term forest management plans. There
are about 45 workers employed in the province's Wildlife and Ecosystem Protection branch.
Alberta Alberta adopted a Land Use Framework in 2008 to better manage public and private lands and
natural resources in the achievement of their long-term economic, environmental and social
goals. The framework provides a blueprint for land-use management and decision-making that
cumulative impact of development on biodiversity. The province employs about 20 people
working directly on biodiversity and about 40 workers employed in the public land division.
British
Columbia
British Columbia developed a Conservation Framework in 2008 to provide a set of science-
based tools and actions for conserving species and ecosystems in the Province.
Future growth in the sector will be determined by policy created by these organizations and by the
Canadian Council of Ministers of the Environment (CCME). At a national level, the Canadian Biodiversity
Strategy4 was developed under the auspices of the CCME. In 2006, the organization adopted the
Biodiversity Outcomes Framework which guides policy-making, monitoring, and reporting of biodiversity
protection activities in Canada.
3.2.6 NOISE AND VIBRATION ABATEMENT
Noise and vibration abatement refers to measures and activities aimed at the control, reduction, and
abatement of industrial and transport noise and vibration. Activities for the abatement of neighbourhood
noise (e.g. soundproofing of dancing halls, etc.) in addition to activities for the abatement of noise in
places frequented by the public (e.g. swimming pools, schools, etc.) are included.
4 See http://www.eman-rese.ca/eman/reports/publications/rt_biostrat/intro.html
32
Table 15 Revenues from Sales of Noise and Vibration Abatement
2002 2004
Noise and
Vibration
Percent
of Total
Noise and
Vibration Percent of Total
Sales Revenue from Goods ($ millions)
Total 5,453.50 100% 4,138.60 100%
Sales Revenue from Services ($ millions)
Engineering services 27.3 25.8% 70.3 24.1%
Environmental consulting
services 9.5 9.0% 63.7 21.9%
Waste management and
remediation services 1.6 1.5% 77.8 26.7%
Total 105.9 100% 291.4 100%
Source: Environment Industry: Business Sector, 2002 (revised) and 2004.
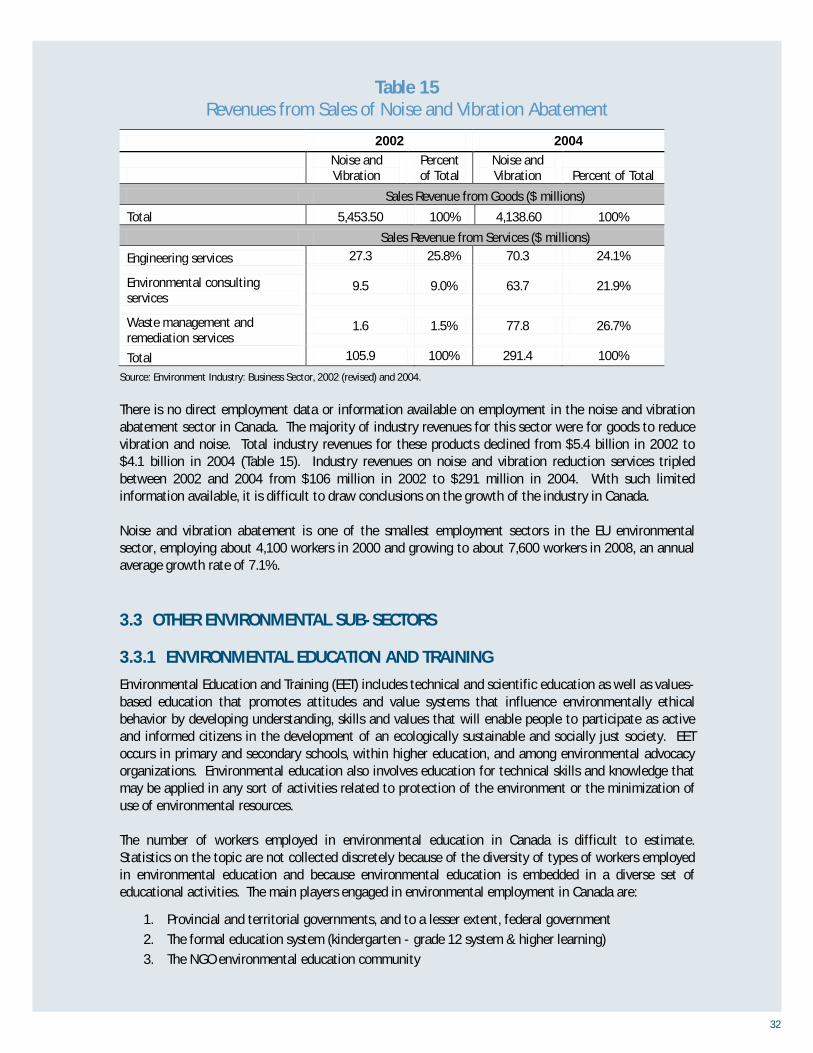
There is no direct employment data or information available on employment in the noise and vibration
abatement sector in Canada. The majority of industry revenues for this sector were for goods to reduce
vibration and noise. Total industry revenues for these products declined from $5.4 billion in 2002 to
$4.1 billion in 2004 (Table 15). Industry revenues on noise and vibration reduction services tripled
between 2002 and 2004 from $106 million in 2002 to $291 million in 2004. With such limited
information available, it is difficult to draw conclusions on the growth of the industry in Canada.
Noise and vibration abatement is one of the smallest employment sectors in the EU environmental
sector, employing about 4,100 workers in 2000 and growing to about 7,600 workers in 2008, an annual
average growth rate of 7.1%.
3.3 OTHER ENVIRONMENTAL SUB-SECTORS
3.3.1 ENVIRONMENTAL EDUCATION AND TRAINING
Environmental Education and Training (EET) includes technical and scientific education as well as values-
based education that promotes attitudes and value systems that influence environmentally ethical
behavior by developing understanding, skills and values that will enable people to participate as active
and informed citizens in the development of an ecologically sustainable and socially just society. EET
occurs in primary and secondary schools, within higher education, and among environmental advocacy
organizations. Environmental education also involves education for technical skills and knowledge that
may be applied in any sort of activities related to protection of the environment or the minimization of
use of environmental resources.
The number of workers employed in environmental education in Canada is difficult to estimate.
Statistics on the topic are not collected discretely because of the diversity of types of workers employed
in environmental education and because environmental education is embedded in a diverse set of
educational activities. The main players engaged in environmental employment in Canada are:
1. Provincial and territorial governments, and to a lesser extent, federal government
2. The formal education system (kindergarten - grade 12 system & higher learning)
3. The NGO environmental education community

33
Provincial and territorial governments have the jurisdiction over setting the educational curriculum.
Environment Canada is the main federal player in environmental education, but educational programs
are also offered by Natural Resources Canada and other organizations. These organizations facilitate
provincial and territorial working groups to integrate sustainable development education into curriculum
and also operate direct education programs and other forms of support.
Local school boards are responsible for implementing the provincial curriculum, and each board makes
budget allocation decisions and chooses and/or develops their own curriculum materials for
environmental education curriculum. School principals and teachers also play a key role in
implementing the curriculum. Thus, the type and amount of environmental education taught in the
classroom varies by school and even from class to class.
A number of post-secondary institutions in Canada are involved in environmental education. The
Université du Québec à Montréal (UQAM) holds the only Canadian Research Chair in Environmental
Education. Post-secondary operate a wide variety of training and education programs that prepare
environmental practitioners for careers in the diverse environmental sector.
In addition to these groups, there are several non-governmental environmental organizations that
promote environmental awareness and environmental educational programs. The Canadian Network for
Environmental Education and Communication (EECOM), Learning for a Sustainable Future (LSF), and
Green Street are examples of these organizations.
While it is difficult to estimate employment in environmental education, enrollment in environmental-
related university programs gives some indication in growth in demand for these workers. Enrollment in
environmental programs of study has grown from 69,700 enrollments in 1998 to 83,000 enrollments in
2007 (the latest year for which data is available) a growth rate 19% and an annual average growth rate
of 2.0% per year. (Table 16)

34
Table 16 Enrolment in University Environmental Education in Canada 1998-2007
Source: Statistics Canada PSIS Database
Program Title 1998 1999 2000 2001 2002 2003 2004 2005 2006 2007
CHANGE
(1998-
2007)
RATE OF
CHANGE
Agriculture, General 4446 4704 3138 2706 2193 2106 1959 1785 1755 1773 -2673 -60%
Biology Teacher
Education 0 114 255 252 222 195 270 234 285 306 192 168%
Biology/Biological
Sciences, General 25116 24297 23076 22569 23889 25896 27951 28536 29424 29811 4695 19%
Chemical Engineering 4284 4428 4497 4377 4674 5124 5370 5631 5808 6123 1839 43%
Chemistry Teacher
Education 0 39 87 87 90 84 111 111 117 87 48 123%
Chemistry, General 6249 6156 5706 5697 6240 7089 7674 7890 8259 8505 2256 36%
City/Urban, Community
and Regional Planning 2013 1986 1833 1863 2076 2376 2583 2775 2934 2946 933 46%
Civil Engineering,
General 6738 6723 5820 6084 6963 7908 8559 9165 9654 10254 3516 52%
Conservation Biology 0 0 0 0 0 18 174 171 168 159 141 783%
Ecology 0 0 102 90 114 141 243 294 321 312 210 206%
Environmental Science 0 207 858 1023 1269 1425 1710 1830 2085 2211 2004 968%
Environmental Studies 6336 5514 4851 4857 4560 4641 4152 4281 4524 4845 -1491 -24%
Environmental/
Environmental Health
Engineering
0 69 231 204 240 324 438 321 420 507 438 635%
Forestry, General 3021 2358 1584 1188 1107 972 843 855 792 819 -2202 -73%
Geography 8220 8100 7983 7899 8448 8724 9123 9003 8931 8799 579 7%
Geography Teacher
Education 0 54 108 81 153 174 183 159 195 174 120 222%
Geological/Geophysical
Engineering 0 141 315 303 282 249 255 255 306 324 183 130%
Geology/Earth Science,
General 3135 3012 2739 2682 2715 2685 2718 2988 3072 3297 162 5%
Natural Resources
Management and
Policy, General
0 78 141 183 231 342 528 552 657 717 639 819%
Physics Teacher
Education 0 21 63 48 63 51 75 60 63 51 30 143%
Science Teacher
Education 0 78 345 354 459 537 750 780 798 816 738 946%
Soil Science and
Agronomy, General 183 177 186 171 147 150 180 180 186 180 -3 -2%
Water, Wetlands,
Marine Resources
Management
0 18 63 63 48 48 51 48 48 42 24 133%
TOTAL ENROLLMENT 69738 68271 63975 62775 66177 71256 75900 77901 80802 83052 13314 19%
35
3.3.2 ENVIRONMENTAL POLICY AND LEGISLATION
Environmental policy and legislation refers to any activities involved in the development of regulations
on activities that may be undertaken by organizations or individuals which have an impact on the
environment. Environmental policy researchers, policy consultants, and policy program officers conduct
research, prepare reports, provide consultation and advice, and administer programs in a variety of
environmental areas related to the natural and applied sciences. They are employed by federal, provincial
and municipal governments. They are also employed by private sector employers to evaluate the impact
influence public policy
development.
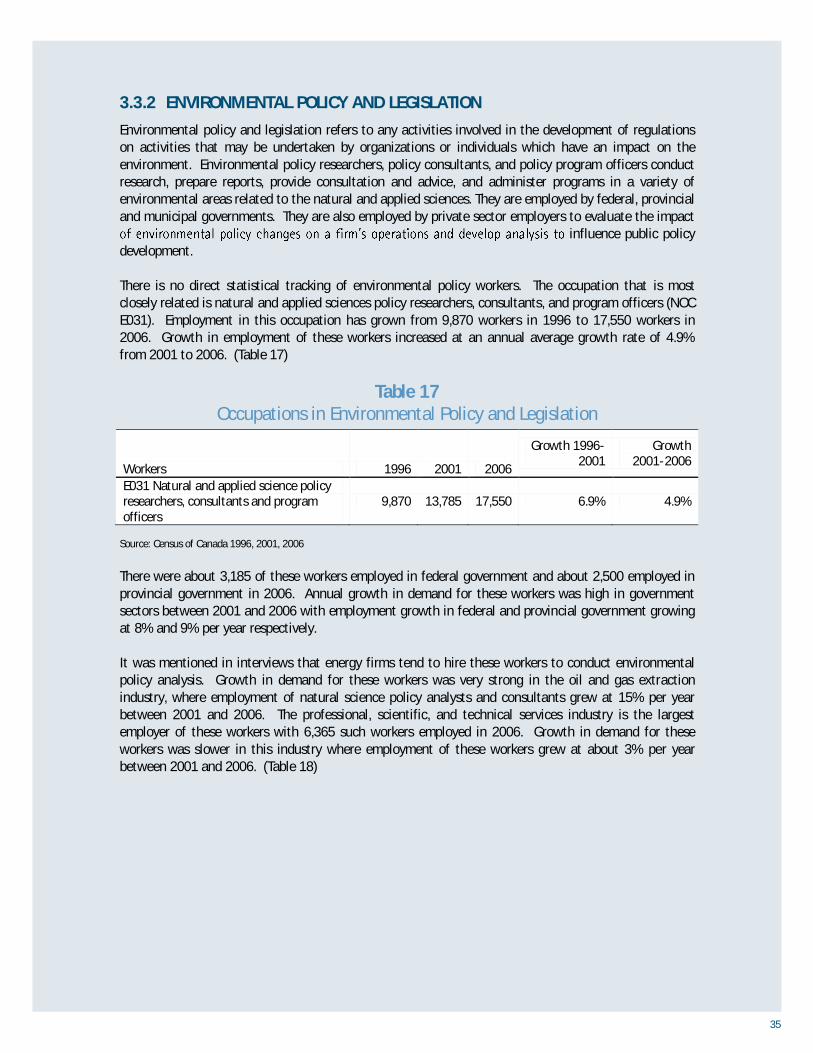
There is no direct statistical tracking of environmental policy workers. The occupation that is most
closely related is natural and applied sciences policy researchers, consultants, and program officers (NOC
E031). Employment in this occupation has grown from 9,870 workers in 1996 to 17,550 workers in
2006. Growth in employment of these workers increased at an annual average growth rate of 4.9%
from 2001 to 2006. (Table 17)
Table 17
Occupations in Environmental Policy and Legislation
Workers 1996 2001 2006
Growth 1996-
2001
Growth
2001-2006
E031 Natural and applied science policy
researchers, consultants and program
officers
9,870 13,785 17,550 6.9% 4.9%
Source: Census of Canada 1996, 2001, 2006
There were about 3,185 of these workers employed in federal government and about 2,500 employed in
provincial government in 2006. Annual growth in demand for these workers was high in government
sectors between 2001 and 2006 with employment growth in federal and provincial government growing
at 8% and 9% per year respectively.
It was mentioned in interviews that energy firms tend to hire these workers to conduct environmental
policy analysis. Growth in demand for these workers was very strong in the oil and gas extraction
industry, where employment of natural science policy analysts and consultants grew at 15% per year
between 2001 and 2006. The professional, scientific, and technical services industry is the largest
employer of these workers with 6,365 such workers employed in 2006. Growth in demand for these
workers was slower in this industry where employment of these workers grew at about 3% per year
between 2001 and 2006. (Table 18)

36
Table 18 Industries Employing Natural and Applied Science
Policy Researchers, Consultants and Program Officers
Workers 2001 2006
Annual
Average
Growth
2001-2006
Total Employment 13790 17550 5.9%
Selected Environmental Industries
115 Support activities for agriculture and forestry 20 40 15%
211 Oil and gas extraction 85 170 15%
212 Mining (except oil and gas) 80 105 6%
213 Support activities for mining and oil and gas extraction 80 70 -3%
219 Mining unspecified 0 10
221 Utilities 385 565 8%
418 Miscellaneous wholesaler-distributors (incl. Recycling) 165 200 4%
541 Professional, scientific and technical services 5465 6365 3%
562 Waste management and remediation services 200 320 10%
911 Federal government public administration 2195 3185 8%
912 Provincial and territorial public administration 1595 2500 9%
913 Local, municipal and regional public administration 410 610 8%
Other Industries 3110 3410 2%
Source: Census of Canada 2001, 2006
3.3.3 ECO-INNOVATION / RESEARCH AND DEVELOPMENT
Research and development (R&D) includes activities undertaken on a systematic basis in order to
increase the stock of knowledge and the use of this knowledge to devise new applications in the fields of
environmental protection and resource conservation. This includes research activities involved in the
identification and analysis of sources of pollution, mechanisms for the dispersion of pollutants in the
environment in addition to their effects on human beings, species and the biosphere. It covers R&D for
the prevention and elimination of all forms of pollution, and also R&D oriented towards equipment and
instruments of pollution measurement and analysis.
Eco-innovation is the production, assimilation, or exploitation of a product, production process, service
or management or business method that is novel to the organization (developing or adopting it) and
which results, throughout its life cycle, in a reduction of environmental risk, pollution and other negative
impacts of resources use (including energy use) compared to relevant alternatives.
As of 2007, there were about 148,000 full-time equivalent workers employed in research and
development in Canada (across all fields of R&D). Between 1994 and 2007, employment in R&D grew at
an annual average growth rate of 4.9% per year. (Figure 25)

37
Figure 25 Total Research and Development Employment in Canada
Source: Statistics Canada CANSIM table 358-0024
The portion of this R&D employment that is related to environmental research and development and
eco-innovation is somewhat uncertain. Eco-innovation is difficult to measure in employment terms.
Growth in eco-innovation is an important trend occurring in the environmental sector. Manufacturers
initially introduced environmental innovations to add value to their products and these innovations are
becoming increasingly common. The eco-innovation performed on product design is typically one
component of overall product design, making it difficult to distinguish eco-innovation from other forms
of product innovation.
Energy-related R&D investment declined in Canada between 2000 and 2004, but grew again from 2004
to 2007. Oil prices and other related energy prices generally began rising dramatically in 2003 and
2004, which likely contributed to the growth in demand for energy R&D. Growth has been particularly
strong in research and development for energy conservation which grew from $71 million in 2004 to
$188 million in 2007. (Figure 26)
Figure 26 Expenditures on Energy R&D by Type of Expenditure
2000 2001 2002 2003 2004 2005 2006 2007
Renewable resources $78 $91 $95 $69 $83 $64 $59 $72
Transportation and transmission $158 $101 $89 $86 $80 $79 $82 $122
Conservation $209 $134 $121 $118 $71 $143 $173 $188
Total $445 $326 $305 $273 $234 $286 $314 $382
Source: Statistics Canada
Employment of R&D personnel in electric power also began to grow again in 2004 after a long term slow
decline through the 1990s and early 2000s. There has been significant growth in R&D employment,
especially since 2000 in the agricultural sector. Between 2000 and 2007, the number of agricultural
R&D personnel in Canada grew from 527 to 1,320 full-time equivalent workers. Research and
development in forestry and fishing sectors has been essentially flat with about 249 R&D workers in
forestry and 79 in fishing in 2007. (Figure 27)

38
Figure 27 Employment of R&D Personnel in Resource Industries
Source: Statistics Canada
3.3.4 ENVIRONMENTAL SAFETY AND HEALTH
Environmental health and safety is a cross-disciplinary area concerned with protecting the safety, health
and welfare of people engaged in work or employment. The goal of all environmental safety and health
programs is to foster a safe work environment. As a secondary effect, it may also protect co-workers,
family members, employers, customers, suppliers, nearby communities, and other members of the public
who are impacted by the workplace environment. It may involve interactions among many subject areas,
including occupational medicine, occupational (or industrial) hygiene, public health, safety engineering,
chemistry, health physics, ergonomics, toxicology, epidemiology, environmental health, industrial
relations, public policy, sociology, and occupational health psychology.
Demand for workers in this field doubled from 10,590 employees in 1996 to 20,080 in 2006. Between
2001 and 2006, demand for these workers grew at an annual average growth rate of 8% per year.
(Figure 28)
Figure 28 Occupations in Public and Environmental Health and Safety
Census Year 1996 2001 2006
Avg. Annual
Growth
1996-2001
Avg. Annual
Growth
2001-2006
NOC Occupation C163 Inspectors in public and environmental
health and occupational health and safety 10,590 13,640 20,080 5.2% 8.0%
Source: Census of Canada 1996, 2001, 2006

39
Demand for workers in this field is likely related to efforts of firms to improve the safety and well being
of workers, to comply with safety regulation, and to avoid negative consequences that may result from
litigation for work-related injuries. Time-loss injuries occurring at work grew in Canada in the 1980s
reaching a peak of 621,000 such injuries in 1989. Since that time, actions by firms to improve safety
and environmental health have brought about declines in the number of injuries. Still, there were about
308,000 time-loss injuries at workplaces in Canada in 2008 suggesting that there are improvements yet
to be made in workplace and environmental safety (Figure 29).
Figure 29
Number of Accepted Work-Related Time-Loss Injuries in Canada
Source: Statistics Canada
3.3.5 ENVIRONMENTAL COMMUNICATIONS AND PUBLIC AWARENESS
Environmental public relations and communications include activities that have an environmental
component to the communication. This includes the development and implementation of
communication and promotion strategies and information programs for media relations on behalf of
businesses, governments and other organizations. Workers in this field are employed by consulting firms,
corporations, associations, government, social agencies, museums, galleries, public interest groups, and
cultural and other organizations, or they may be self-employed.
There is no official statistical tracking of workers in environmental communications. Similar to
environmental education, the level of environmental content in public communications can vary
significantly by organization, making measurements of employment in the sector difficult.
The occupation most closely related to these activities is NOC F024: professional occupations in public
relations and communications. Demand for workers in this occupation was essentially flat between
1996 and 2001. In the 2001 to 2006 period, employment of these professionals increased at an annual
average growth rate of 6.1% per year. There were about 36,905 public relations and communications
professionals in Canada in 2006. (Table 19)

40
Table 19 Total Public Relations and Communications Occupations
Occupation 1996 2001 2006
Avg. Annual
Growth
1996-2001
Avg. Annual
Growth
2001-2006
F024 Professional occupations in public
relations and communications 27,065 27,460 36,905 0.3% 6.1%
Source: Census of Canada 1996, 2001, 2006


