Quarterly Newsletter - October 2015 THE OPTIONS PLAYBOOK Sale of Put Options to Purchase Shares of Power Financial Corporation (PWF) Sale of Covered Call Options on Shares of Transcontinental Inc. Class A (TCL) p.7 MANAGER’S COMMENTARY p.3 CANADIAN EQUITY DERIVATIVES
Transcript
Quarterly Newsletter - October 2015
THE OPTIONS PLAYBOOK
Sale of Put Options to PurchaseShares of Power FinancialCorporation (PWF)
Sale of Covered Call Optionson Shares of Transcontinental Inc.Class A (TCL)
p.7
MANAGER’SCOMMENTARY
p.3
CANADIAN EQUITYDERIVATIVES
2
2015 Trading Calendar
Patrick CeresnaPatrick Ceresna is the Chief Derivative Market Strategist for Learn To Trade Global (LTTG) and optionsource.net and has been a content provider and speaker for the Montreal Exchange for over 5 years. Patrick is a Chartered Market Technician (CMT), Derivative Market Specialist (DMS) and Canadian Investment Manager (CIM) by designation. Prior to becoming a partner at LTTG, Patrick spent ten years working at key financial firms in numerous trading roles including the trading of a large fund dedicated exclusively to options writing. Patrick specializes in analyzing the intermarket relationships of the broader derivatives market and the impact those trends have on trading and investment decision making.
Martin NoëlMartin Noël holds an MBA in Financial Services from the Université du Québec à Montréal since 2003. The same year, he received his Fellow of the Institute of Canadian Bankers and was awarded the Silver Medal for his superior level of performance in the completion of the Professional Banking Program.
Martin began his career in the derivatives industry in 1983 as an options market maker for various brokerage firms on the floor of the Montréal Exchange. He later became an Options Specialist and ultimately an independent trader. In 1996, he joined the Montréal Exchange as Options Market Supervisor where he had the opportunity to contribute to the development of the Canadian options market. Since May 2009, he is President of Monetis Financial Corporation, which specializes in professional trading and financial communication.
GENERAL INFORMATION
For more information, please contactJosiane Lanoue, Senior Manager, Business Development, Equity Derivatives [email protected] or 514 871-3539
To suggest that this has been a challenging year for Canadian investors is a material understatement. The global economic slowdown has pulled the rug from underneath the feet of commodity investors. This has left an arduous investment environment where there have been very few safe havens for investors, beyond short-term fixed return assets.
During this period, the sentiment of Canadian investors has been an awkward mix of hope and anxiety about the severity of the devastation. The damage done has been most severe in commodity sectors which have, in some cases, seen stocks decline 90% or more. Any resource-driven investor has found no shelter as the carnage has been spread to every area including agriculture, basic materials, energy and precious metals.
This has been further exacerbated by the broad global slowdown in growth and the long overdue correction in the U.S. bull market. This has starved the Canadian stock market of important capital inflows to provide the buying needed to stabilize prices. This has also created such an oversold state in the Canadian markets that last week, we saw the number of stocks on the S&P/TSX60 above their 50-day moving averages drop close to 10%.
While this seems dire, there is a bright side to the picture. Often when markets get oversold to this magnitude, they provide a relief rally that retraces a meaningful amount of the prior declines. With the American and global markets all being extensively oversold, the conditions could develop for a Christmas rally. I want to prefix that a rally does not necessary imply a new bull market.
So what macro conditions can emerge to reverse the course of the current downtrend? After five consecutive months of selling, the Canadian dollar has declined close to 10 cents creating a clearly oversold condition. When looking at the chart below, one can see that these types of oversold conditions on the Canadian dollar have brought about numerous retracement rallies. Could we see a similar situation develop again?.
WILL IT BE A MERRY CHRISTMASFOR INVESTORS THIS YEAR?
3
4
The interesting observation is that the decline in the CAD was accompanied by almost all commodity based currencies. As seen by the chart below, the Australian dollar, South African Rand, Mexican Peso and New Zealand Dollar have all declined in double digits during this commodity swoon.
4
THE MANAGER’S COMMENTARY
Canadian Dollar December Futures
CAD to USD (NBD)AUD to USD (NBD)ZAR (EOD)MXN to USD (NBD)NZD to USD (EOD)
Canadian dollar has retraced up to 6 cents on two occasions over the last few years. Will se see the pattern repeat?
55
Those commodity based currencies have been driven inversely by the rising U.S. Dollar and the subsequent intermarket correlation of declining commodity prices. When looking at the chart below, one can see the carnage as copper, oil and wheat prices were down 25% or more. During this time, gold has been able to remain relatively buoyant, most likely due its prior oversold condition from the now almost four-year-old bear market.
THE MANAGER’S COMMENTARY
5
Looking Forward
Over the last few weeks, we have seen the Federal Reserve back away from a 2015 interest rate hike. As the Fed tapers their hawkish stance, the U.S. Dollar has weakened from its trading highs, taking pressure off the beaten-down commodity space. If this trend was to persist, the remaining months of the year could represent a period where the market can retrace the selling and consolidate off their most oversold levels.
While there are no certainties, the seasonality of the traditional stock market cycle further supports the idea that the markets have room to improve over the November and December period.
Is this an opportunity for investors to commit back to the markets?
For the short-term, yes, but the longer term picture remains muddled. Global growth forecasts from the World Bank and the IMF continue to be revised lower, driven by crisis in China and many emerging markets.
CopperOil (EOD)R/J CRB (EOD)Wheat (EOD)Gold (EOD)
6
THE MANAGER’S COMMENTARY
6
This is not the foundation from which a sustainable new bull market in commodities can be anchored on. Without that macro fundamental shift in the global economic landscape, the most prudent stance investors can take is to treat a Christmas rally as an opportunity to reposition a portfolio more defensively.
Opportunities While Managing Risk
Many advisors and money managers would love the opportunity to end the year on a more positive note and see the year-end performance numbers improve. This market may be willing to oblige. The risk of course is that the market loves to play the role of the great humilator and can turn an ambitious risk into a nightmare position. This is where options could be a key tool used to strategically participate in riskier assets while limiting the risk to a predefined limit.
Let’s demonstrate this with an example of the high delta call on the BMO Equal Weight Bank Index ETF (ZEB).
High Delta Calls
In this example we have a client that has room to strategically increase exposure to the Canadian Financial sector. In this case we are looking to use that BMO Equal Weight Bank Index.
• At the time of writing, the ZEB is trading at $21.86 per share.
• A December $20.00 in-the-money call option is asking $2.05. The option has $1.86 of intrinsic value which represents an equity stake in the stock and a further $0.19 in time value which represents a 0.86% cost to carry the position 10 weeks into mid-December.
Let’s put the risk/reward profile into context for this position.
• The December $20 call has a delta of 0.87. If correct about the direction of ZEB shares, the delta will gravitate to 1. What does that mean? Essentially the call is behaving like the stock to the upside almost dollar for dollar.
• The client has been able to open the call position by outlaying only about 10% of the cost of opening the corresponding stock position. More importantly, the client can define the absolute risk to the cost of the option.
This creates a far more defined asymmetric proposition. For the client, this provides the opportunity to profit from a potential Christmas rally, while being able to feel the psychological comfort that risk is defined to a predetermined level within the context of the portfolio objectives.
By Martin NoëlTHE OPTIONS PLAYBOOK
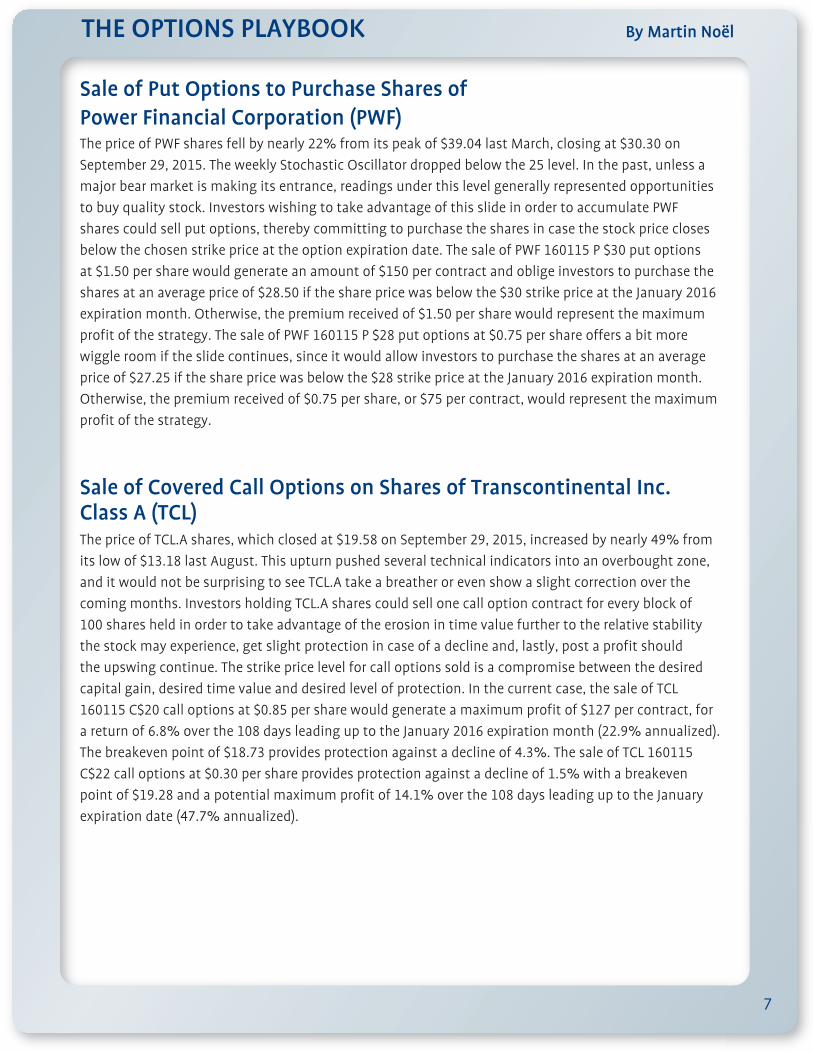
Sale of Put Options to Purchase Shares of Power Financial Corporation (PWF)
Sale of Covered Call Options on Shares of Transcontinental Inc. Class A (TCL)
The price of PWF shares fell by nearly 22% from its peak of $39.04 last March, closing at $30.30 on
September 29, 2015. The weekly Stochastic Oscillator dropped below the 25 level. In the past, unless a
major bear market is making its entrance, readings under this level generally represented opportunities
to buy quality stock. Investors wishing to take advantage of this slide in order to accumulate PWF
shares could sell put options, thereby committing to purchase the shares in case the stock price closes
below the chosen strike price at the option expiration date. The sale of PWF 160115 P $30 put options
at $1.50 per share would generate an amount of $150 per contract and oblige investors to purchase the
shares at an average price of $28.50 if the share price was below the $30 strike price at the January 2016
expiration month. Otherwise, the premium received of $1.50 per share would represent the maximum
profit of the strategy. The sale of PWF 160115 P $28 put options at $0.75 per share offers a bit more
wiggle room if the slide continues, since it would allow investors to purchase the shares at an average
price of $27.25 if the share price was below the $28 strike price at the January 2016 expiration month.
Otherwise, the premium received of $0.75 per share, or $75 per contract, would represent the maximum
profit of the strategy.
The price of TCL.A shares, which closed at $19.58 on September 29, 2015, increased by nearly 49% from
its low of $13.18 last August. This upturn pushed several technical indicators into an overbought zone,
and it would not be surprising to see TCL.A take a breather or even show a slight correction over the
coming months. Investors holding TCL.A shares could sell one call option contract for every block of
100 shares held in order to take advantage of the erosion in time value further to the relative stability
the stock may experience, get slight protection in case of a decline and, lastly, post a profit should
the upswing continue. The strike price level for call options sold is a compromise between the desired
capital gain, desired time value and desired level of protection. In the current case, the sale of TCL
160115 C$20 call options at $0.85 per share would generate a maximum profit of $127 per contract, for
a return of 6.8% over the 108 days leading up to the January 2016 expiration month (22.9% annualized).
The breakeven point of $18.73 provides protection against a decline of 4.3%. The sale of TCL 160115
C$22 call options at $0.30 per share provides protection against a decline of 1.5% with a breakeven
point of $19.28 and a potential maximum profit of 14.1% over the 108 days leading up to the January
This document is sent to you on a general information basis only. The information provided in this document, including financial and economic data, quotes and any analysis or interpretation thereof, is provided solely on an information basis and shall not be interpreted in any jurisdiction as an advice or a recommendation with respect to the purchase or sale of any derivative instrument, underlying security or any other financial instrument or as a legal, accounting, tax, financial or investment advice. Bourse de Montréal Inc. recommends that you consult your own advisors in accordance with your needs. All references in this document to specifications, rules and obligations concerning a product are subject to the Rules and Policies of Bourse de Montréal Inc. and its clearinghouse, the Canadian Derivatives Clearing Corporation. Although care has been taken in the preparation of this document, Bourse de Montréal Inc. and/or its affiliates take no responsibility for errors or omissions and reserve the right to amend or review, at any time and without prior notice, the content of this document. Bourse de Montréal Inc., its affiliates, directors, officers, employees and agents will not be liable for damages, losses or costs incurred as a result of the use of any information appearing in this document.
Standard & Poor’s and S&P are registered trademarks of Standard & Poor’s Financial Services LLC (“S&P”) and have been licensed for use by S&P Dow Jones Indices LLC and sublicensed for certain purposes by Bourse de Montréal Inc. TSX is a registered trademark of TSX Inc., and has been licensed for use by S&P Dow Jones Indices LLC and Bourse de Montréal Inc. The S&P/TSX 60 Index is a product of S&P Dow Jones Indices LLC, and has been licensed for use by Bourse de Montréal Inc. The products mentioned in this document are not sponsored, endorsed, sold or promoted by S&P Dow Jones Indices LLC, Dow Jones, S&P, their respective affiliates, or TSX Inc. and neither S&P Dow Jones Indices LLC, Dow Jones, S&P, their respective affiliates or TSX Inc., make any representation regarding the advisability of investing in such product(s).
“BAX®”, “OBX®”, “ONX®”, “OIS-MX™”, “CGZ®”, “CGF®”, “CGB®”, “LGB®”, “OGB®”, “SXO™”, “SXF™”, “SXM™”, “SCF™”, “SXA™”, “SXB™”, “SXH™”, and “SXY™” are trademarks of Bourse de Montréal Inc.
Montréal Exchange, Montréal Exchange logo, Converge, and Converge logo are trademarks of Bourse de Montréal Inc.