29
CFIF Survey Results on Liquidity, Transparency and Market Access in Canadian Fixed Income Markets October 2016 © Bank of Canada 2016. All rights reserved.

CFIF Survey Results on Liquidity, Transparency and Market Access in Canadian Fixed Income Markets October 2016
© Bank of Canada 2016. All rights reserved.

2
Disclaimer and copyright notice
The results of the 2016 Canadian Fixed-Income Forum (CFIF) survey on liquidity, transparency and market access in Canadian fixed-income markets summarize personal opinions expressed by the survey respondents and do not necessarily reflect the views of CFIF or those of individual CFIF members. The results are not to be used for commercial purposes.

3
Survey description
This survey has been prepared by CFIF to identify changes in trading, execution and portfolio management practices by both buy- and sell-side firms, and select active domestic issuers participating in the Canadian fixed-income market. Survey responses will help identify how market liquidity has changed and how market participants are adjusting to these changes.
The survey was conducted electronically from June to August 2016, and featured
multiple choice questions that in some cases allowed for short-answer responses or the ranking of several options. The survey was sent to approximately 700 firms worldwide via email, and it took approximately 30-45 minutes to complete.

4
Survey Considerations
When reviewing the results, please take into consideration the following: − This survey is meant to gather data on opinions and perceptions of individuals and the numbers
presented are based on individual perceptions, not exact institutional figures; − Responses represent opinions of individual respondents which may differ from the official views
of the institutions they work for; − All individual responses were equally weighted and do not take into account the relative activity or
size of the respondent; − In some cases the survey was responded to by multiple individuals within the same organization
(these responses may represent the views of different trading desks); − Most survey questions were optional and could be skipped; − Some questions were general in nature and applicable to all respondents, while others were
specific to the type of respondent; − Some survey questions were conditional on previous answers, e.g. questions about changes in
corporate bond trading and liquidity were asked only to those who answered that they traded corporate bonds;
− Questions relating to changes in liquidity or market practices relate to changes occurring over the past two years, and do not necessarily reflect changes that may have taken place prior to that time period; and
− The results exclude any “Not Applicable” answers.
Due to this structure, the total number of responses vary from question to question.

76%
15%
9%
Buy-Side Sell-Side Debt-Issuer
31%
15% 12%
11%
10%
8%
7% 6%
Institutional asset manager Mutual fundInsurance company Pension fundOther TreasuryHedge fund Foreign reserves fund
Response by Region
5
Overview of survey respondents
The survey was completed by 295 individuals from approximately 200 firms worldwide, implying a 28% firm response rate
– 225 buy-side respondents from ~160 firms; 45 sell-side respondents from ~20 firms; and 25 active domestic debt issuers from ~20 firms
Approximately 77% of responses came from Canada
77%
11%
8% 5%
Canada Europe USA Other
(1) Other includes Australia, Asia, and Africa
(1)
36% 25%
23% 10%
7%
C$1-9bn C$10-24bnless than C$1bn C$50bn or moreC$25-49bn
Response by Firm Type Buy-Side by Type Buy-Side by Size
59% 32%
9% Active only
Both active andpassivePassive only
6
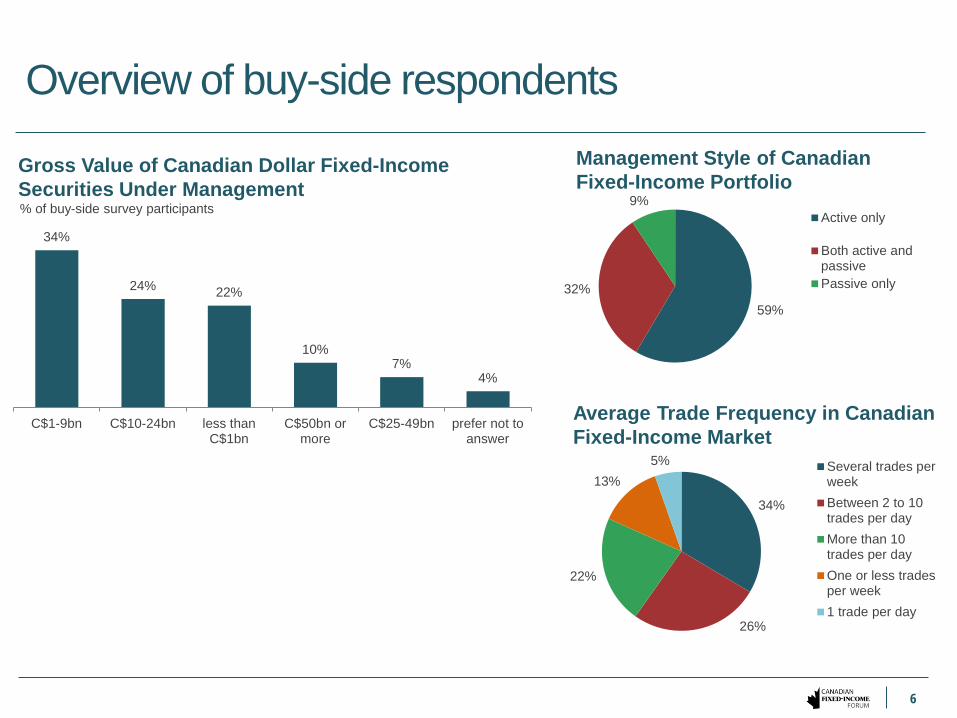
Overview of buy-side respondents
Gross Value of Canadian Dollar Fixed-Income Securities Under Management
34%
24% 22%
10% 7%
4%
C$1-9bn C$10-24bn less thanC$1bn
C$50bn ormore
C$25-49bn prefer not toanswer
Management Style of Canadian Fixed-Income Portfolio
Average Trade Frequency in Canadian Fixed-Income Market
34%
26%
22%
13% 5% Several trades per
weekBetween 2 to 10trades per dayMore than 10trades per dayOne or less tradesper week1 trade per day
% of buy-side survey participants

Market Liquidity

8
Impression of current market liquidity
1=very illiquid; 2=illiquid; 3=liquid; 4=very liquid
Impression of Current Market Liquidity
Government of Canada benchmark bonds are generally perceived to be the most liquid (very liquid) asset class by most types of survey participants
Perceptions of liquidity across other asset classes are more varied, depending on the type of institution, trading approach and location of the participant
Average Rank
All Participants Sellside Buyside Small Large Frequent & Large
Government of Canada securities - Benchmark 3.72 3.44 3.75 3.79 3.86 3.93Money markets instruments 3.37 3.17 3.35 3.26 3.42 3.27Repo - General collateral GoC and CMB 3.30 3.55 3.31 2.50 3.43 3.67Bond/BAX futures 3.16 3.60 3.03 3.20 3.27 3.29Canada Mortgage bonds (CMB) 3.11 3.11 3.10 3.14 3.00 2.92Provincial bonds 3.00 3.00 3.02 2.96 3.06 3.00Government of Canada securities - Off-the-run 2.92 2.48 2.95 3.22 2.86 3.07Interest rate swaps 2.92 2.69 3.00 3.13 2.79 2.60Repo - General collateral provincial bonds 2.76 2.60 2.73 N/A 2.92 3.00Investment grade corporate bonds - Financial 2.68 2.74 2.75 2.60 2.76 2.75Repo - General collateral NHA MBS 2.37 1.88 2.35 N/A 2.33 2.75Repo - Non GC (specials) 2.34 2.70 2.33 2.00 2.44 2.80NHA-MBS 2.26 1.89 2.24 2.75 2.06 1.71Investment grade corporate bonds - Non-financial 2.13 2.32 2.15 2.28 2.08 2.25Repo - Non-government 1.82 1.88 1.81 N/A 1.86 2.00
Buy-side
Please note: small represents buy-side firms with less than C$1 billion fixed-income securities under management; Large represents buy-side firms with greater than C$25 billion fixed-income securities under management; and Frequent and Large represents buy-side firms that trade in the Canadian dollar fixed-income market more than 10 times per day and have greater than C$25 billion fixed-income securities under management.

9
Slight decline in market liquidity over two years
1=declined significantly; 3= largely unchanged; 5= increased significantly
Liquidity was perceived to have declined only slightly for futures and Government of Canada benchmark bonds, while it was seen to have deteriorated most for investment grade corporate bonds
– Both large sell-side and frequent buy-side traders indicated a slightly more positive view of changes in liquidity Debt issuers and hedge funds indicated more significant declines in liquidity across markets than aggregate
buy- and sell-side participants
Change in Liquidity Over the Past Two Years Average Rank
All Participants Sellside Buyside Small Large Frequent & LargeBond/BAX futures 2.73 3.30 2.63 2.78 2.71 2.71Government of Canada securities - Benchmark 2.70 2.56 2.71 2.79 2.65 2.80Money markets instruments 2.66 2.56 2.66 2.85 2.68 2.73Repo - General collateral GoC and CMB 2.57 3.00 2.60 2.50 2.73 2.83Repo - General collateral NHA MBS 2.47 3.25 2.63 N/A 2.71 3.00Repo - General collateral provincial bonds 2.45 3.00 2.33 N/A 2.60 3.00NHA-MBS 2.45 2.44 2.52 2.75 2.38 2.43Canada Mortgage bonds (CMB) 2.44 2.39 2.44 2.63 2.19 2.08Interest rate swaps 2.38 2.23 2.43 2.14 2.46 2.50Repo - Non GC (specials) 2.32 2.90 2.39 2.00 2.83 3.00Provincial bonds 2.28 2.35 2.30 2.50 2.13 2.13Government of Canada securities - Off-the-run 2.24 1.78 2.27 2.54 2.09 2.40Investment grade corporate bonds - Financial 2.15 2.32 2.15 2.20 2.21 2.17Repo - Non-government 2.13 2.56 2.21 N/A 2.00 1.00Investment grade corporate bonds - Non-financial 1.76 2.21 1.68 1.96 1.75 1.92
Buy-side
Please note: small represents buy-side firms with less than C$1 billion fixed-income securities under management; Large represents buy-side firms with greater than C$25 billion fixed-income securities under management; and Frequent and Large represents buy-side firms that trade in the Canadian dollar fixed-income market more than 10 times per day and have greater than C$25 billion fixed-income securities under management.

1. Ability to execute at the most competitive price2. Ability to execute in large size3. Ability to execute with immediacy4. Ability to execute without moving the market
10
Key attributes of market liquidity
Aspects of Liquidity Most Concerned About Ranked in order of importance Most Important Attributes of Market Liquidity
1. Amount of liquidity available during market stress2. Increasing volatility in the amount of liquidity3. Amount of liquidity available on an average day4. Increasing pro-cyclicality of liquidity
The most important attribute of market liquidity is consistent across all types of market participants – However, sell-side participants place somewhat greater emphasis on their ability to execute without moving the
market, while buy-side participants are more concerned with the amount of liquidity available on an average day
Ranked in order of importance
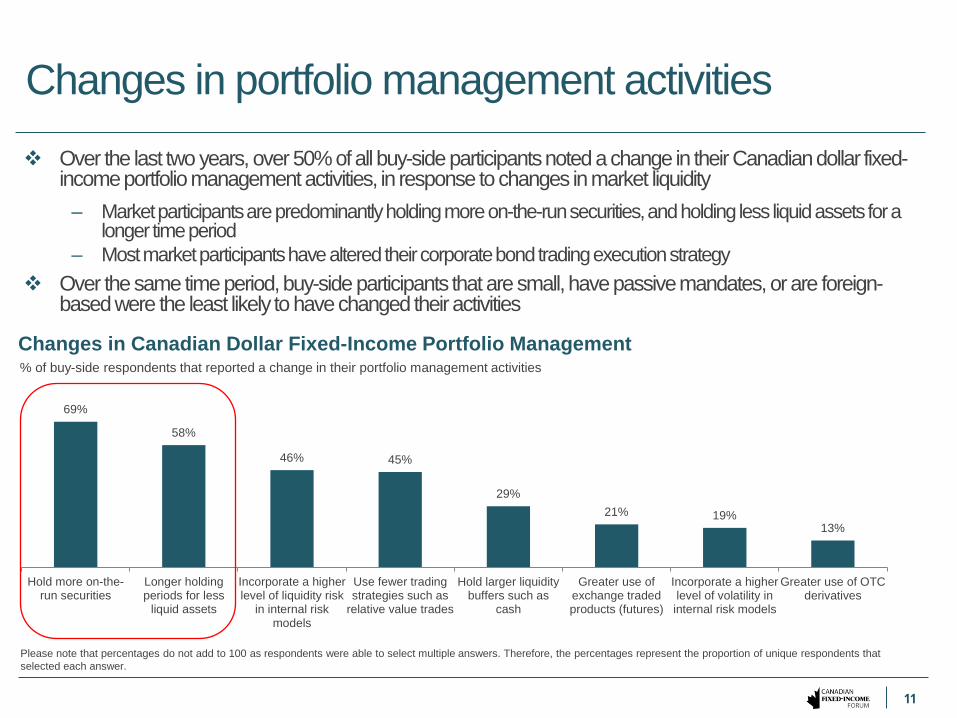
Over the last two years, over 50% of all buy-side participants noted a change in their Canadian dollar fixed-income portfolio management activities, in response to changes in market liquidity
– Market participants are predominantly holding more on-the-run securities, and holding less liquid assets for a longer time period
– Most market participants have altered their corporate bond trading execution strategy Over the same time period, buy-side participants that are small, have passive mandates, or are foreign-
based were the least likely to have changed their activities
11
Changes in portfolio management activities
69%
58%
46% 45%
29% 21% 19%
13%
Hold more on-the-run securities
Longer holdingperiods for less
liquid assets
Incorporate a higherlevel of liquidity risk
in internal riskmodels
Use fewer tradingstrategies such as
relative value trades
Hold larger liquiditybuffers such as
cash
Greater use ofexchange tradedproducts (futures)
Incorporate a higherlevel of volatility ininternal risk models
Greater use of OTCderivatives
Changes in Canadian Dollar Fixed-Income Portfolio Management % of buy-side respondents that reported a change in their portfolio management activities
Please note that percentages do not add to 100 as respondents were able to select multiple answers. Therefore, the percentages represent the proportion of unique respondents that selected each answer.

12
Changes in Government of Canada bond trading
Over the last two years, just under 40% of all survey participants noted a change in their Government of Canada bond execution strategy, in response to changes in market liquidity
– Over the same time period, buy-side participants that are small, have passive mandates, or are foreign-based were the least likely to have changed their activities
Close to 80% of sell-side participants noted a change in the Government of Canada bond execution strategy, primarily by increasing their use of bond futures or reducing their amount of relative value trading
54% 52% 52% 51% 42%
36% 35% 34% 24% 24%
Transact less Allow moretime to
execute thesame trade
Divide largeorders into
multiplesmaller trades
Reduce theamount of
relative valuetrading
Increaseallocation to
benchmark ormore liquid
bonds
Accept highertransaction
costs
Avoid tradingduring volatile
periods
Increase useof bondfutures
Adjust timingof trades
(when pre-trade price
transparencyis higher)
Trading more “proxy” assets
such as US Treasuries or
US bond futures
Changes in Government of Canada Execution Strategies % of all survey participants that reported a change in execution strategy
Please note that percentages do not add to 100 as respondents were able to select multiple answers. Therefore, the percentages represent the proportion of unique respondents that selected each answer.

13
Changes in CMB and provincial bond trading
Over the last two years, just over 40% of all survey participants noted a change in their Canada Mortgage Bond and/or provincial bond execution strategy, in response to changes in market liquidity
– Over the same time period, buy-side participants that are small, have passive mandates, or are foreign-based were the least likely to have changed their activities
Almost 70% of sell-side participants noted a change in their execution strategy, over the last two years, which predominately included increasing their allocation to benchmark or more liquid bonds, and reducing the amount of relative value trading
65% 58%
47% 45% 42% 39% 36%
23% 16%
Transact less Allow more timeto execute the
same trade
Divide largeorders into
multiple smallertrades
Increaseallocation to
benchmark ormore liquid
bonds
Reduce theamount of
relative valuetrading
Avoid tradingduring volatile
periods
Accept highertransaction
costs
Adjust timing oftrades (when
pre-trade pricetransparency is
higher)
Other change
Changes in CMB and/or Provincial Bonds Execution Strategies % of all survey participants that reported a change in execution strategy
Please note that percentages do not add to 100 as respondents were able to select multiple answers. Therefore, the percentages represent the proportion of unique respondents that selected each answer.

14
Changes in corporate bond trading
Over the last two years, approximately 75% of survey participants changed their Canadian dollar investment grade corporate bond execution strategy, in response to changes in market liquidity
– In contrast to the prior two asset classes, changes were being made by all types of participants
In the past two years, close to 70% of survey participants noted having been unsuccessful in executing a Canadian dollar investment grade corporate bond trade within a reasonable (or expected) period of time
– 85% of participants described the frequency of this happening as increasing, with close to 90% of participants indicating unattractive market pricing as the main reason for not being able to execute a trade
Change in Canadian Dollar Investment Grade Corporate Bonds Execution Strategy % of survey participants that reported a change in execution strategy
77% 67%
58% 57% 49% 49% 48% 47%
24% 24% 16%
Allow moretime to executethe same trade
Transact less Demand higherliquidity
premium (i.e.spread)
Increaseallocation tomore liquid
bonds
Accept highertransaction
costs
Divide largeorders into
multiplesmaller trades
or trade insmaller
amounts
Reduce theamount of
relative valuetrading
Avoid tradingduring volatile
periods
Adjust timing oftrades (when
pre-trade pricetransparency is
higher)
Reduce thenumber of
credits that youtrade
Other change
Please note that percentages do not add to 100 as respondents were able to select multiple answers. Therefore, the percentages represent the proportion of unique respondents that selected each answer.

Changes in Market Participant Practices

Approximately 30% of buy-side survey participants are: doing more short-term tactical trading to
take advantage of market dislocations, especially in Government of Canada securities − Close to 40% of respondents that are
not currently engaging in this activity were noted to be considering it in the future
using their portfolio to help dealers better manage their flow and inventory − Only a small percentage of respondents
that are not currently engaging in this activity were noted to be considering it in the future
16
Buy-side supporting liquidity provision
78%
52%
37%
25%
Corporate bonds Provincial bonds Government ofCanada securities
Canada Mortgagebonds
Top 4 Asset Classes used to help dealers manage their flow and inventory % of buy-side survey participants that help dealers manage their flow and inventory
Please note that percentages do not add to 100 as respondents were able to select multiple answers. Therefore, the percentages represent the proportion of unique respondents that selected each answer.

Declined significantly
Declined meaningfully
Declined slightly
Relatively unchanged
Increased slightly
Increased meaningfully
Increased Significantly
Canadian federal government bonds, including government-guaranteed issuers 8.30% 11.10% 16.70% 44.40% 13.90% 2.80% 2.80%
Provincial government bonds, including provincially-guaranteed issuers 6.50% 16.10% 32.30% 22.60% 22.60% 0.00% 0.00%
Corporate bonds (investment grade and high yield) 0.00% 10.00% 40.00% 30.00% 16.70% 3.30% 0.00%
Repo (bonds) 4.30% 17.40% 4.30% 52.20% 8.70% 13.00% 0.00%
Money markets instruments 0.00% 10.30% 13.80% 48.30% 10.30% 13.80% 3.40%
Interest rate swaps (delta traded) 0.00% 8.30% 8.30% 58.30% 8.30% 8.30% 8.30%
17
Slight decline in sell-side trading inventories concentrated in provincial and corporate bonds
Change in Canadian Dollar Trading Inventory Over the Past Two Years
Note: figures represent % of respondents
Declined significantly = (-50% or more); Declined meaningfully = (-15 to -49%); Declined slightly = (-5 to -14%); Relatively unchanged = (-4 to +4%); Increased Slightly = (+5 to +14%); Increased meaningfully (+15 to +49%); Increased Significantly = (+50% or more)
Responses from large sell-side firms indicated relatively unchanged inventories across all asset categories; note that these results are only reflective of changes that have occurred over the past two years

39%
20%
15% 15% 12%
0 to 24% 25 to 49% 50 to 74% 75 to 100% Not sure
18
Increasing share of corporate bond trading done on an agency basis
Share of Corporate Bond Trading Done on an Agency Basis % of survey participants that trade corporate bonds
Change in Share of Corporate Bond Trading Done on an Agency Basis % of survey participants that trade corporate bonds
34%
27% 25%
9%
5%
1%
Increasedsomewhat
Relativelyunchanged
Increasedsignificantly
Not sure Declinedsomewhat
DeclinedsignificantlyPercentages represent share of corporate bonds traded on an agency basis
Approximately 60% of survey respondents indicated either a somewhat or significant increase in their share of corporate bond trading done on an agency basis over the past two years

Balance sheet and regulatory changes are perceived to be the main drivers of differences in dealers’ corporate bond market making capacity
19
Drivers of changes in corporate bond market making capacity
Balance sheet changes 3.69
Regulatory changes 3.66
Internal risk management changes 3.30
Underlying profitability changes 2.99
Increase in market volatility 2.78
Main Drivers of Differences in Dealers’ Corporate Bond Market Making Capacity
Average Rank
1=not important; 2=somewhat important; 3=important; 4=very important

79% 71%
43% 36% 36%
29%
More difficult to select anappropriate time window
to issue
Spread at issuance isaffected by the lack of
liquidity of the underlyingbenchmark pricing bond
Preference to issue largerbenchmarks
More difficult to price anew issue (e.g. to agreeon a benchmark price or
takes longer to price)
Hedging interest rate risktakes longer or is more
expensive
Other
20
Debt issuers are changing their issuance process
How Changes in Market Liquidity Have Affected the Debt Issuance Process % of debt-issuers that reported a change in their ability to issue fixed income securities
Please note that percentages do not add to 100 as respondents were able to select multiple answers. Therefore, the percentages represent the proportion of unique respondents that selected each answer.
Over 55% of debt-issuers reported a change in their ability to issue fixed income securities due to changes in the underlying liquidity of fixed income securities or changes in market structure

21
Issuers have seen changes in demand composition
71%
50%
36% 29%
14% 14%
Larger “lead orders”
More reverseinquiry interest
Moreinternational
investor demand
Smaller orderbook size
Less reverseinquiry interest
Larger orderbook size
Please note that percentages do not add to 100 as respondents were able to select multiple answers. Therefore, the percentages represent the proportion of unique respondents that selected each answer.
Changes in Demand Composition of New Debt Issuance % of debt-issuers that reported a change in their ability to issue fixed income securities
Almost 55% of debt-issuers that issue in international fixed-income markets described Canadian market access as more stable relative to that of a foreign market, taking into account difference in market size
Debt issuers indicated that investor diversification was the primary reason for issuing in foreign markets

Market Transparency

All Participants Sellside Buyside Small Large Frequent & Large
Bond/BAX futures 4.13 4.59 4.00 4.00 4.00 4.33
Government of Canada securities 3.97 4.06 3.99 3.98 3.94 4.15
Money markets instruments 3.73 4.00 3.71 3.44 3.79 3.80
Canada Mortgage bonds (CMB) 3.67 3.96 3.67 3.68 3.52 3.67
Provincial bonds 3.43 3.71 3.43 3.25 3.43 3.45
Repo markets 3.09 3.85 2.93 2.75 2.82 3.00
Interest rate swaps 2.93 2.93 2.97 3.13 2.31 2.25
NHA-MBS 2.62 2.30 2.73 3.09 2.88 3.20
Corporate bonds 2.55 2.85 2.55 2.65 2.88 3.17
23
Rating of currently available pre-trade transparency
Rating of Currently Available Pre-Trade Transparency
1=very poor; 2=poor; 3=average; 4=good; 5=very good
Level of pre-trade-transparency is perceived to be higher for more liquid asset classes, and is generally rated higher by sell-side participants
– Larger and more active buy-side respondents rate pre-trade transparency higher than the aggregate buy-side Over 35% of respondents have taken steps to improve pre-trade transparency, mostly by expanding use of
electronic trading platforms and subscribing to market data services
Average Rank Buy-side
Please note: small represents buy-side firms with less than C$1 billion fixed-income securities under management; Large represents buy-side firms with greater than C$25 billion fixed-income securities under management; and Frequent and Large represents buy-side firms that trade in the Canadian dollar fixed-income market more than 10 times per day and have greater than C$25 billion fixed-income securities under management.

24
Pre-trade transparency is relatively unchanged
Change in Quality of Pre-Trade Transparency Over the Past Two Years
1=declined significantly; 2=declined somewhat; 3=largely unchanged; 4=increased somewhat; 5=increased significantly
Overall level of pre-trade transparency has stayed largely unchanged across most asset classes Average Rank
All Participants Sellside Buyside Small Large Frequent & Large
Bond/BAX futures 2.96 3.18 2.94 3.09 3.00 3.00
Government of Canada securities 2.88 2.97 2.90 3.06 2.84 2.83
Money markets instruments 2.86 2.89 2.87 3.07 2.69 2.75
Repo markets 2.77 3.23 2.65 3.33 2.89 3.00
Canada Mortgage bonds (CMB) 2.75 2.88 2.81 3.05 2.74 2.73
NHA-MBS 2.66 2.64 2.71 3.00 2.93 2.60
Provincial bonds 2.64 2.92 2.64 2.86 2.75 2.64
Interest rate swaps 2.59 2.87 2.60 2.60 2.50 2.25
Corporate bonds 2.29 2.55 2.23 2.46 2.41 2.73
Please note: small represents buy-side firms with less than C$1 billion fixed-income securities under management; Large represents buy-side firms with greater than C$25 billion fixed-income securities under management; and Frequent and Large represents buy-side firms that trade in the Canadian dollar fixed-income market more than 10 times per day and have greater than C$25 billion fixed-income securities under management.
Buy-side
All Participants Sellside Buyside Small Large Frequent & Large
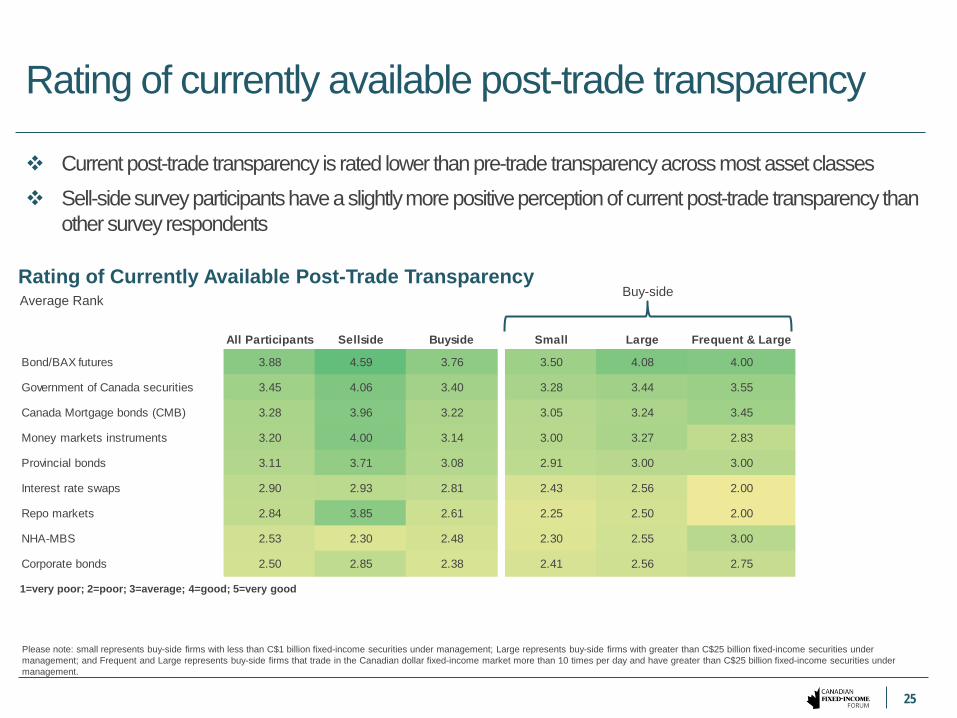
Bond/BAX futures 3.88 4.59 3.76 3.50 4.08 4.00
Government of Canada securities 3.45 4.06 3.40 3.28 3.44 3.55
Canada Mortgage bonds (CMB) 3.28 3.96 3.22 3.05 3.24 3.45
Money markets instruments 3.20 4.00 3.14 3.00 3.27 2.83
Provincial bonds 3.11 3.71 3.08 2.91 3.00 3.00
Interest rate swaps 2.90 2.93 2.81 2.43 2.56 2.00
Repo markets 2.84 3.85 2.61 2.25 2.50 2.00
NHA-MBS 2.53 2.30 2.48 2.30 2.55 3.00
Corporate bonds 2.50 2.85 2.38 2.41 2.56 2.75
25
Rating of currently available post-trade transparency
Rating of Currently Available Post-Trade Transparency
1=very poor; 2=poor; 3=average; 4=good; 5=very good
Current post-trade transparency is rated lower than pre-trade transparency across most asset classes Sell-side survey participants have a slightly more positive perception of current post-trade transparency than
other survey respondents
Average Rank Buy-side
Please note: small represents buy-side firms with less than C$1 billion fixed-income securities under management; Large represents buy-side firms with greater than C$25 billion fixed-income securities under management; and Frequent and Large represents buy-side firms that trade in the Canadian dollar fixed-income market more than 10 times per day and have greater than C$25 billion fixed-income securities under management.

26
Post-trade transparency is largely unchanged
Change in Quality of Post-Trade Transparency Over the Past Two Years
1=declined significantly; 2=declined somewhat; 3=largely unchanged; 4=increased somewhat; 5=increased significantly
Overall level of post-trade transparency has stayed largely unchanged for nearly all asset classes Sell-side participants have a slightly more positive view of the change in post-trade transparency than other survey respondents The majority of survey respondents are unsure of whether the Canadian government bond exemption (NI 21-101) for post-
trade transparency is needed – The exemption expires in January 2018
Average Rank
All Participants Sellside Buyside Small Large Frequent & Large
Bond/BAX futures 2.99 3.29 2.95 3.10 3.00 3.00
Government of Canada securities 2.98 3.25 2.94 3.03 3.04 3.00
Money markets instruments 2.90 3.15 2.91 3.17 2.92 2.88
Repo markets 2.90 3.40 2.73 3.25 3.00 3.00
Canada Mortgage bonds (CMB) 2.90 3.17 2.87 3.05 2.96 2.90
Interest rate swaps 2.88 4.00 2.75 3.00 2.67 2.00
Provincial bonds 2.81 3.18 2.78 3.00 2.95 2.75
NHA-MBS 2.77 3.00 2.68 3.00 3.00 2.75
Corporate bonds 2.62 3.20 2.44 2.73 2.88 2.57
Buy-side
Please note: small represents buy-side firms with less than C$1 billion fixed-income securities under management; Large represents buy-side firms with greater than C$25 billion fixed-income securities under management; and Frequent and Large represents buy-side firms that trade in the Canadian dollar fixed-income market more than 10 times per day and have greater than C$25 billion fixed-income securities under management.

Market Access

3.26
2.60 2.60 2.38 2.35
Pre-trade transparency Post-trade transparency Electronic RFQ tradingplatform
Direct market access (All-to-all market trading
platform)
Funding access (securitiesfinancing)
28
Most important market access parameters for trading
Average Rank of Parameters Affecting Ability to Trade Canadian Dollar Fixed-Income Products
1=not important; 2=somewhat important; 3=important; 4=very important
Close to 45% of survey respondents believe access to an all-to-all trading platform (as opposed to dealer-to-dealer or client-to-dealer platforms) for trading Canadian dollar fixed income instruments would improve market liquidity
Average Rank

29
Electronic trading is concentrated in GoC, CMB and bond futures markets
Percentage of Canadian Dollar Trading Volume Executed Electronically 0 to 24% 25 to 49% 50 to 74% 75 to 100% Not sure
Government of Canada securities 20.00% 13.30% 21.50% 43.10% 2.10%
Canada Mortgage Bonds (CMB) 23.60% 15.80% 14.50% 35.20% 10.90%
Provincial bonds 35.30% 13.30% 17.30% 24.30% 9.80%
Corporate bonds 71.00% 3.40% 1.40% 4.10% 20.00%
Repo markets 48.10% 0.00% 0.00% 0.00% 51.90%
Money markets instruments 29.40% 12.60% 8.40% 21.70% 28.00%
Bond/BAX futures 30.50% 2.30% 4.60% 32.10% 30.50%
Interest rate swaps 54.70% 0.90% 0.90% 5.10% 38.50%
Note: figures represent % of respondents


