CANADIAN, MEXICAN, AND INTERCONTINENTAL CANADIAN, MEXICAN, AND INTERCONTINENTAL INFLUENCES ON U.S. AIR QUALITY INFLUENCES ON U.S. AIR QUALITY Daniel J. Jacob with Rokjin J. Park 1 , Helen Wang, Philippe H. LeSager, Lin Zhang and funding from EPRI, DOE, NASA 1 now at Seoul National University
Transcript
CANADIAN, MEXICAN, AND INTERCONTINENTAL CANADIAN, MEXICAN, AND INTERCONTINENTAL INFLUENCES ON U.S. AIR QUALITYINFLUENCES ON U.S. AIR QUALITY
Daniel J. Jacob
with Rokjin J. Park1, Helen Wang, Philippe H. LeSager, Lin Zhang
and funding from EPRI, DOE, NASA
1 now at Seoul National University
THE U.S. EPA REGIONAL HAZE RULETHE U.S. EPA REGIONAL HAZE RULE
Mean visibility degradation (deciviews) at IMPROVE sites, 2001
Reduce U.S. aerosol sources to improve visibility in wilderness areas: progress must follow a linear rate toward endpoint of natural visibility by 2064
Park et al. [AE 2006]
1ox1o
NATURAL vs. BACKGROUND VISIBILITY DEGRADATIONNATURAL vs. BACKGROUND VISIBILITY DEGRADATION
as computed by difference of N. American and U.S. backgrounds
Circles are CASTNET/AQS rural sites used for model evaluation
Mean Canadian/Mexican enhancements are 1-3 ppb over most of U.S.; much larger enhancements in border areas of Northeast (up to 15 ppb), Southwest (up to 13 ppb)
Canadian emissions from CAC (2005), Mexican emissions from BRAVO (1999)
Wang et al. [AE, submitted]
Mean June-August 2001 values (months when Can/Mex influence is maximum)
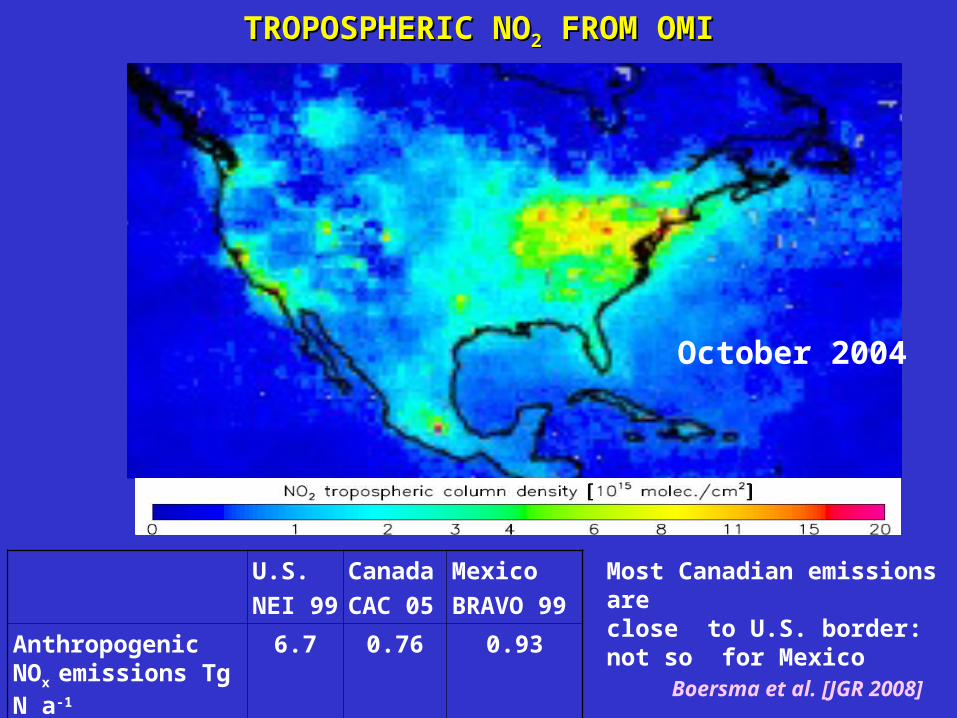
Boersma et al. [JGR 2008]
TROPOSPHERIC NOTROPOSPHERIC NO22 FROM OMI FROM OMI
October 2004
U.S.
NEI 99
Canada
CAC 05
Mexico
BRAVO 99
Anthropogenic NOx
emissions Tg N a-1
6.7 0.76 0.93
Most Canadian emissions areclose to U.S. border: not so for Mexico
MODEL EVALUATION FOR CANADIAN/MEXICAN INFLUENCEMODEL EVALUATION FOR CANADIAN/MEXICAN INFLUENCETime series at the sites most affected
Ozo
ne,
pp
b
Jun Jul Aug
Whiteface Mtn. Base, NY
ObservationsModel (standard)
observed O3 >75 ppb with >10 ppb from Canada/Mexico
Wang et al. [AE, submitted]
US backgroundNA background (PRB)Canada + Mexico
Unionville, MichiganAlpine, California
BACKGROUND CORRELATION WITH OZONEBACKGROUND CORRELATION WITH OZONEBackground concentration statistics for NE and SW sites in 10-ppb ozone bins
max75th
med
25th
min
North American background U.S. background 1:1 model vs. obs. line
Wang et al. [AE, submitted]
An air quality standard as low as 60 ppb would be achievable with domestic emission reductions alone
Northeast
Southwest
AREAS WHERE CANADIAN/MEXICAN INFLUENCES CONTRIBUTE MOST AREAS WHERE CANADIAN/MEXICAN INFLUENCES CONTRIBUTE MOST TO EXCEEDANCES OF U.S. AIR QUALITY STANDARDTO EXCEEDANCES OF U.S. AIR QUALITY STANDARD
# model days in JJA 2001 where ozone >75 ppb and Can/Mex influence > 10 ppb
Largest effects around the Great Lakes, eastern seaboard, and S. California
Wang et al. [AE, submitted]
LOOKING AHEAD TO 2020LOOKING AHEAD TO 2020Global CLE inventory + CAIR for U.S.
Anthropogenic NOx emissions by 51% in U.S., 49% in Canada, 34% in Mexico …but CLE inventory has high emissions in southeastern Canada!
Canadian pollution influence in Northeast U.S. in 2020 is comparable to or greater than residual influence from U.S. power plants (18% of U.S. NOx emissions in 2020)
Summer mean Canadian/Mexicanpollution enhancement (2020)
Validate, augment, and exploit satellite observations of transpacific transport
DC-8
C-130
Honolulu
Anchorage
Seattle
TES and AIRS satellite observations of a transpacific plumeCO columnsTES GEOS-Chem AIRS
Zhang et al. [ACP, submitted]
DC-8track
A
B
USING OZONE-CO CORRELATIONS FROM TES USING OZONE-CO CORRELATIONS FROM TES TO DETECT TRANSPACIFIC OZONE POLLUTIONTO DETECT TRANSPACIFIC OZONE POLLUTION
Zhang et al. [ACP, submitted]
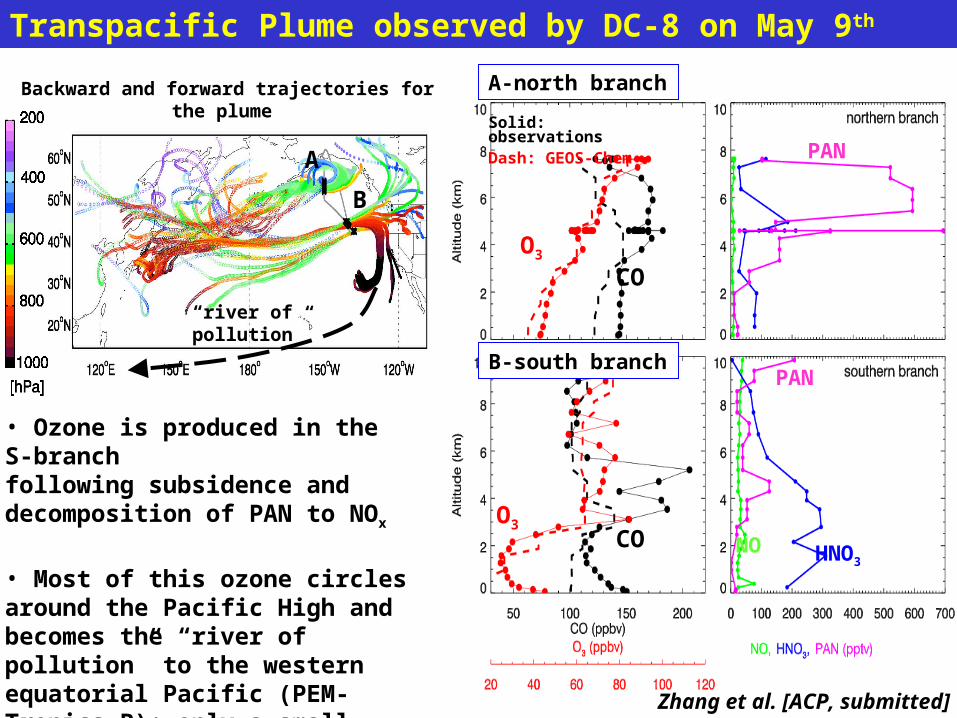
Transpacific Plume observed by DC-8 on May 9th
B-south branch
HNO3NO
O3CO
Solid: observationsDash: GEOS-Chem
A-north branch
PAN
COO3
PAN
Backward and forward trajectories for the plume
• Ozone is produced in the S-branchfollowing subsidence and decomposition of PAN to NOx
• Most of this ozone circles around the Pacific High and becomes the “river of pollution” to the western equatorial Pacific (PEM-Tropics B); only a small fraction reaches the western U.S.
A
B
“river ofpollution”
Zhang et al. [ACP, submitted]
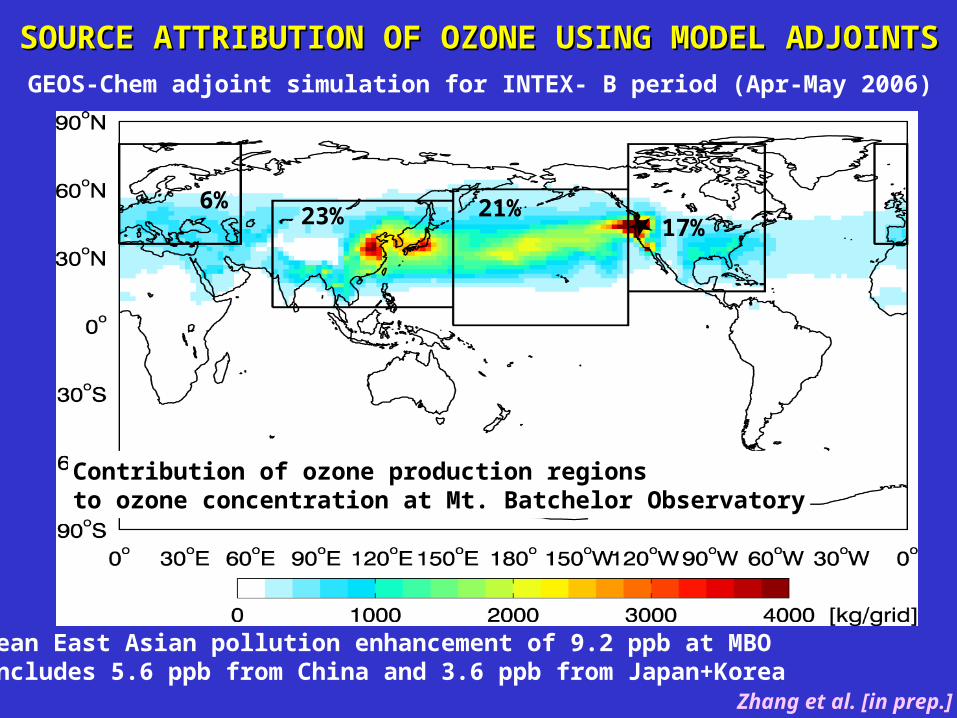
SOURCE ATTRIBUTION OF OZONE USING MODEL ADJOINTSSOURCE ATTRIBUTION OF OZONE USING MODEL ADJOINTSGEOS-Chem adjoint simulation for INTEX- B period (Apr-May 2006)
Contribution of ozone production regions to ozone concentration at Mt. Batchelor Observatory
23% 21%17%
6%6%
Mean East Asian pollution enhancement of 9.2 ppb at MBO includes 5.6 ppb from China and 3.6 ppb from Japan+Korea