58
Canadian Patient Cost Database Technical Document MIS Patient Costing Methodology March 2017

Canadian Patient Cost Database Technical Document
MIS Patient Costing MethodologyMarch 2017

Production of this document is made possible by financial contributions from Health Canada and provincial and territorial governments. The views expressed herein do not necessarily represent the views of Health Canada or any provincial or territorial government.
Unless otherwise indicated, this product uses data provided by Canada’s provinces and territories.
All rights reserved.
The contents of this publication may be reproduced unaltered, in whole or in part and by any means, solely for non-commercial purposes, provided that the Canadian Institute for Health Information is properly and fully acknowledged as the copyright owner. Any reproduction or use of this publication or its contents for any commercial purpose requires the prior written authorization of the Canadian Institute for Health Information. Reproduction or use that suggests endorsement by, or affiliation with, the Canadian Institute for Health Information is prohibited.
For permission or information, please contact CIHI:
Canadian Institute for Health Information495 Richmond Road, Suite 600Ottawa, Ontario K2A 4H6
Phone: 613-241-7860Fax: [email protected]
© 2017 Canadian Institute for Health Information
Cette publication est aussi disponible en français sous le titre Document technique sur la Base de données canadienne sur les coûts par patient : Méthodologie SIG d’établissement des coûts, mars 2017.
Table of contents Background ................................................................................................................................ 5
Introduction to patient costing ................................................................................................ 5
The value of patient costing ................................................................................................... 6
Patient cost data at CIHI ........................................................................................................ 8
Overview ............................................................................................................................... 9
Section 1: Patient costing MIS data collection requirements...................................................... 9
1.1 Classification of MIS Standards primary accounts (direct/indirect) ..............................10
1.1.1 Non–service recipient functional centres ........................................................10
1.1.2 Indirect functional centres (transient cost centres) .........................................10
1.1.3 Direct functional centres (absorbing cost centres) ..........................................11
1.2 Classification of MIS Standards secondary accounts (fixed/variable costs) .................12
1.2.1 Fixed costs ....................................................................................................12
1.2.2 Variable costs ................................................................................................12
1.2.3 Traceable supplies and other expenses .........................................................12
1.2.4 Revenues and recoveries ..............................................................................13
1.3 Summary of classification of MIS Standards primary and secondary accounts............14
1.3.1 Cost groups ...................................................................................................15
Section 2: Allocating indirect cost ..............................................................................................16
2.1 Administrative and support services costs ...................................................................16
2.2 SEAM allocation bases ...............................................................................................16
2.3 How SEAM works .......................................................................................................17
Section 3: Distributing costs to service recipients ......................................................................17
3.1 Determining unit cost ..................................................................................................19
3.1.1 Workload costing ...........................................................................................19
3.1.2 Workload + costing ........................................................................................21
3.2 Distributing costs to service recipients .........................................................................23
Section 4: Submitting patient cost data to CIHI .........................................................................23
Glossary....................................................................................................................................24
Canadian Patient Cost Database Technical Document: MIS Patient Costing Methodology, March 2017
4
Appendix A: Traceable supplies and other expenses ................................................................27
Appendix B: Cost group definitions ...........................................................................................28
Appendix C: Alternative approach for cost allocation.................................................................29
Appendix D: Administrative and support services allocation bases ...........................................30
Appendix E: SEAM cost allocation process ...............................................................................39
Appendix F: Example of SEAM cost allocation ..........................................................................40
Appendix G: Workload costing ..................................................................................................44
Appendix H: Example of workload costing ................................................................................45
Appendix I: Example of workload + costing ...............................................................................50
Appendix J: Text alternative for figures .....................................................................................57
Canadian Patient Cost Database Technical Document: MIS Patient Costing Methodology, March 2017
5
Background Introduction to patient costing Patient costing, sometimes referred to as case costing or service recipient costing, is a health care–specific term describing an activity-based costing model that tracks and costs service delivery to individual service recipients by service date. In other industries, such as manufacturing, this type of detailed costing is called product costing and is considered a fundamental component in evaluating and planning overall business strategies.
Patient costing is conducted in a variety of health care settings, both hospital and non-hospital, by health service organizations.i The objective of patient costing is to determine the cost of the care delivered to each service recipient (patient) by determining the cost of the services provided and allocating them to each service recipient. In other words, patient costing is the process of estimating the actual cost of care for individual service recipient encounters, such as inpatient admissions, emergency visits, ambulatory visits and health centre visits.
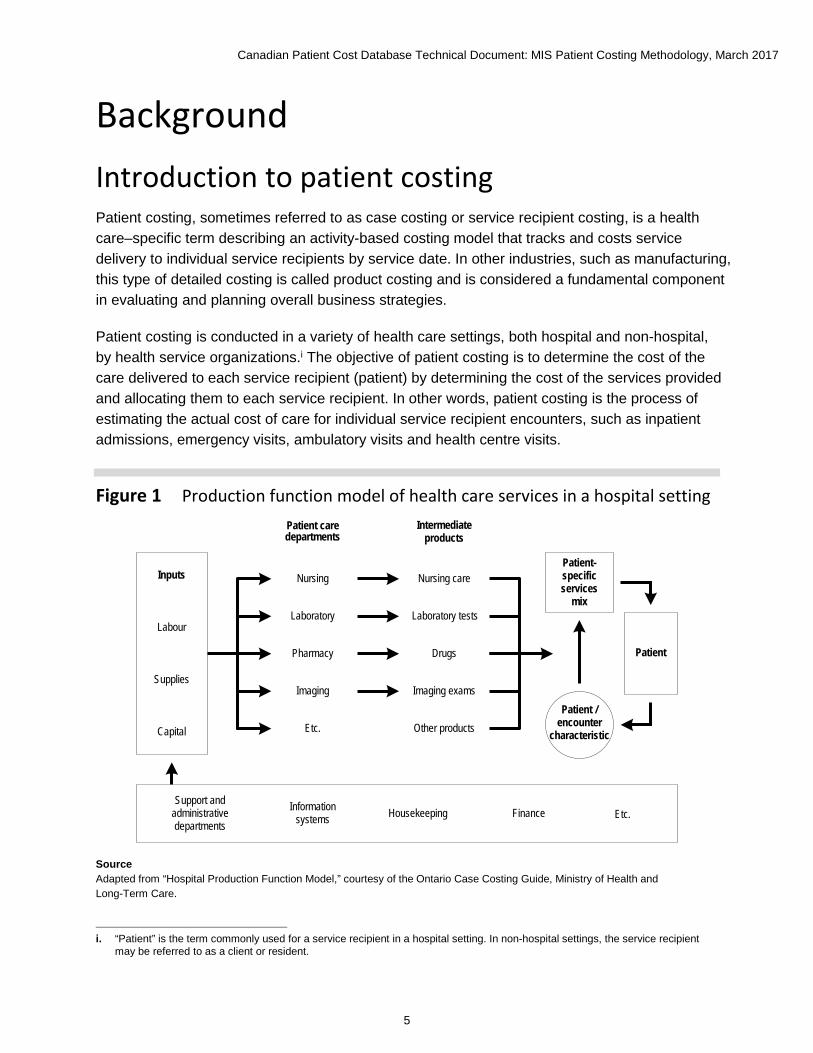
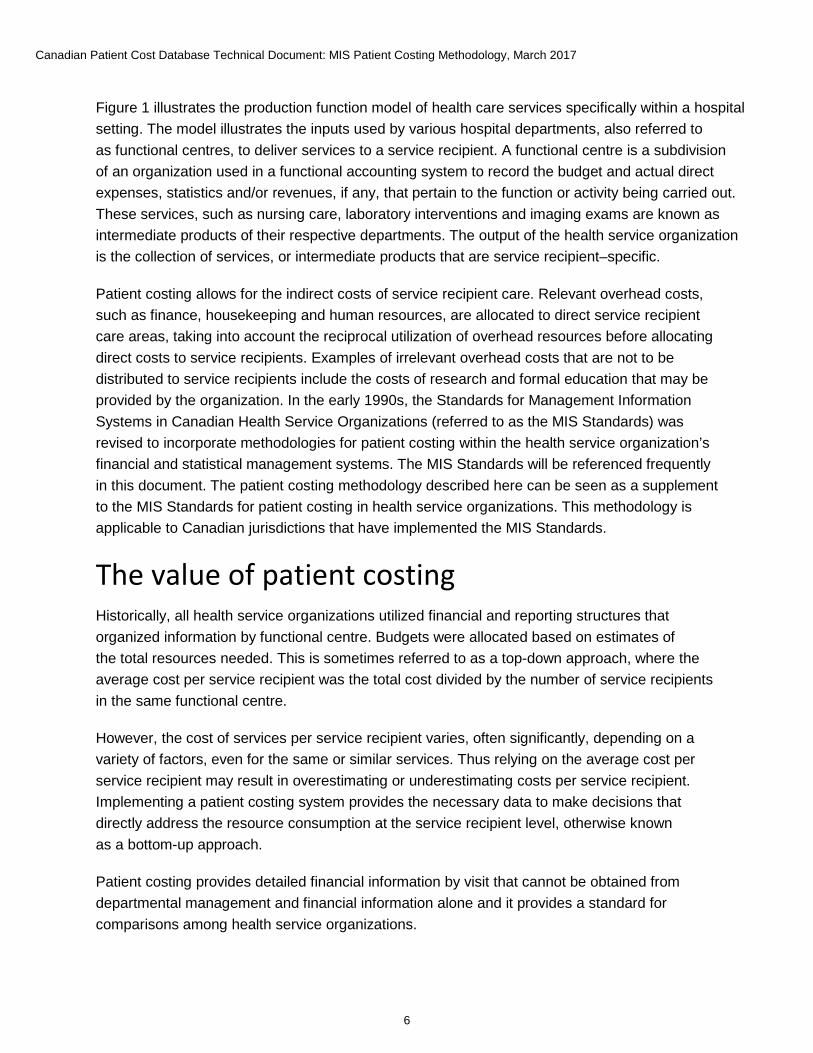
Figure 1 Production function model of health care services in a hospital setting
Inputs
Labour
Supplies
Capital
Patient care departments
Intermediate products
Nursing
Laboratory
Pharmacy
Imaging
Etc.
Nursing care
Laboratory tests
Drugs
Imaging exams
Other products
Patient-specific services
mix
Patient /encounter
characteristic
Patient
Support and administrative departments
Information systems Housekeeping Finance Etc.
Source Adapted from “Hospital Production Function Model,” courtesy of the Ontario Case Costing Guide, Ministry of Health and Long-Term Care.
i. “Patient” is the term commonly used for a service recipient in a hospital setting. In non-hospital settings, the service recipientmay be referred to as a client or resident.
Canadian Patient Cost Database Technical Document: MIS Patient Costing Methodology, March 2017
6
Figure 1 illustrates the production function model of health care services specifically within a hospital setting. The model illustrates the inputs used by various hospital departments, also referred to as functional centres, to deliver services to a service recipient. A functional centre is a subdivision of an organization used in a functional accounting system to record the budget and actual direct expenses, statistics and/or revenues, if any, that pertain to the function or activity being carried out. These services, such as nursing care, laboratory interventions and imaging exams are known as intermediate products of their respective departments. The output of the health service organization is the collection of services, or intermediate products that are service recipient–specific.
Patient costing allows for the indirect costs of service recipient care. Relevant overhead costs, such as finance, housekeeping and human resources, are allocated to direct service recipient care areas, taking into account the reciprocal utilization of overhead resources before allocating direct costs to service recipients. Examples of irrelevant overhead costs that are not to be distributed to service recipients include the costs of research and formal education that may be provided by the organization. In the early 1990s, the Standards for Management Information Systems in Canadian Health Service Organizations (referred to as the MIS Standards) was revised to incorporate methodologies for patient costing within the health service organization’s financial and statistical management systems. The MIS Standards will be referenced frequently in this document. The patient costing methodology described here can be seen as a supplement to the MIS Standards for patient costing in health service organizations. This methodology is applicable to Canadian jurisdictions that have implemented the MIS Standards.
The value of patient costing Historically, all health service organizations utilized financial and reporting structures that organized information by functional centre. Budgets were allocated based on estimates of the total resources needed. This is sometimes referred to as a top-down approach, where the average cost per service recipient was the total cost divided by the number of service recipients in the same functional centre.
However, the cost of services per service recipient varies, often significantly, depending on a variety of factors, even for the same or similar services. Thus relying on the average cost per service recipient may result in overestimating or underestimating costs per service recipient. Implementing a patient costing system provides the necessary data to make decisions that directly address the resource consumption at the service recipient level, otherwise known as a bottom-up approach.
Patient costing provides detailed financial information by visit that cannot be obtained from departmental management and financial information alone and it provides a standard for comparisons among health service organizations.
Canadian Patient Cost Database Technical Document: MIS Patient Costing Methodology, March 2017
7
Patient costing involves 4 elements:
• Collecting data on the resources used to deliver services so it can be distributed at the service recipient level, and documenting demographics and clinical activities;
• Allocating indirect costs to patient care functional centres;
• Determining the unit cost in each patient care functional centre; and
• Distributing all relevant costs to each individual service recipient encounter.
It is crucial for health service organizations in Canada to be able to measure and compare their resource utilization and the performance of their health services with those provided elsewhere in Canada. As the majority of health service organizations do not have patient costing systems in place, they often rely on CIHI’s products to estimate their costs and make business decisions.
CIHI’s products — the indicator Cost of a Standard Hospital Stay (CSHS), Resource Intensity Weights (RIWs) and case-mix grouping methodologies — enable the calculation of cost estimates at various levels of detail.
Top-down financial data submitted to CIHI from the majority of health service organizations in Canada is used to calculate the CSHS, a financial indicator of health service organization performance. Those health service organizations that have implemented patient costing systems also provide financial data to CIHI at the level of the service recipient, employing the bottom-up method. CIHI uses this detailed data to develop the RIWs and case-mix grouping methodologies. Together, these 3 products facilitate cost estimation at the level of the clinical patient group.
Thus improved cost data will lead to improved RIWs and will enable more detailed weight breakdowns, which in turn will lead to more detailed cost estimates to be used by health service organizations across Canada.
Other examples of how patient cost data and/or RIWs have been used by CIHI include
• Informing discussions around alternative funding methodologies for various jurisdictions;
• Performing research and analysis; and
• Supporting the work of a committee that determines interprovincial reimbursement rates.
These examples are not exhaustive but are meant to illustrate that patient cost data provides evidence for decision-making at the local, provincial/territorial and national levels. As the data becomes more usable and more comparable, the opportunities to improve and expand our existing products, as well as to develop new ones, will increase.
Canadian Patient Cost Database Technical Document: MIS Patient Costing Methodology, March 2017
8
While patient costing is more precise and useful than aggregated top-down average costing, it is also more resource intensive, and it requires significant initial investment as well as ongoing infrastructure and support. The usefulness of patient costing information includes support for many types of policy, planning and operational decisions. Examples include the following:
• Negotiating or setting payment rates for third-party service providers;
• Evaluating the adequacy of funding methodologies;
• Constructing cost estimates for new programs;
• Motivating the development of new treatment protocols that improve the quality of care in response to wide variation in service recipient–level cost and utilization;
• Benchmarking by patient group, or case mix, of service recipients cared for; and
• Participating in and influencing the calibration of national and provincial RIWs.
Patient cost data at CIHI After the MIS Standards was revised to incorporate methodologies for patient costing, several provinces and facilities began submitting patient cost data to the Case Mix program at CIHI to be included in the calculation of case mix products. CIHI’s case mix products, including RIWs and case-mix grouping methodologies such as Case Mix Group+ (CMG+), are crucial for health service organizations in Canada to be able to measure and compare their resource utilization and performance.
The first province to submit patient cost data for the purpose of calculating RIWs was Ontario in 1996 (submitted 1994–1995 data), followed by Alberta in 1999 (submitted 1997–1998 data) and several facilities in British Columbia in 2001. Following several transition years of using both Canadian and American cost data, CIHI’s first case mix products using only Canadian patient cost data were released in 2000. The full cost inpatient records are created by linking these cost records to CIHI’s Discharge Abstract Database (DAD). The full cost ambulatory records are created by linking cost records to CIHI’s National Ambulatory Care Reporting System (NACRS).
Canadian Patient Cost Database Technical Document: MIS Patient Costing Methodology, March 2017
9
Overview The objective of this document is to outline a comprehensive methodology that describes how to allocate and distribute costs to service recipients. This document is intended to complement the MIS Standards and be applicable to health service organizations across Canada. To obtain an electronic version of the MIS Standards, you must have a CIHI profile.
• If you don’t have a CIHI profile, you can set one up (see the instructions in the Guide to Accessing CIHI Services) or send an email to [email protected].
• If you have a CIHI profile, go to CIHI’s eStore.
• Pricing information is provided in CIHI’s eStore, accessible through your CIHI profile. The MIS Standards is free for Core Plan subscribers.
A solid and stable MIS implementation will ensure the best quality of patient costing data. Where there are common gaps in the implementation of the MIS Standards (such as an absence of nursing workload), the patient costing methodology suggests alternative approaches that will support useful patient costing information; these are provided in the appendices.
For more information on patient costing, please contact CIHI by email at [email protected].
Section 1: Patient costing MIS data collection requirements In addition to complying with the MIS Standards, patient costing imposes 3 additional data collection requirements:
1. Service recipient workload statistics must be collected and the data stored in such a way that it can be linked to individual service recipient encounters.
2. High-cost supply and service recipient travel expenses must be collected and the information stored in (traceable) supply accounts in such a way that they can be linked to individual service recipient encounters.
3. Intermediate products (specific exams, procedures and interventions) that are used must be tracked and costed, and the data must be stored in such a way that it can be linked to individual service recipient encounters.
These requirements have significant implications for information system capabilities. The appendices in this document provide guidelines for alternative data collection methods in cases where the suggested approach may not currently be met by data providers at the time of system implementation.
Canadian Patient Cost Database Technical Document: MIS Patient Costing Methodology, March 2017
10
In addition to these data collection and system requirements, patient costing introduces new categories and classifications of existing accounts, which are described in sections 1.1 (Classification of MIS Standards Primary Accounts) and 1.2 (Classification of MIS Standards Secondary Accounts). Section 1.3 provides a summary of the new classification of accounts and a suggested approach for grouping costs based on the type of service being provided.
1.1 Classification of MIS Standards primary accounts (direct/indirect)
1.1.1 Non–service recipient functional centres Non–service recipient functional centres, such as the following, are those that contain costs unrelated to service recipient care:
71 7* Research 71 8* Education, except 71 8 40* In-Service Education 71 9* Undistributed Functional Centres 81 9* Undistributed Accounting Centres
Note that while these primary accounts are considered non–service recipient and are not to be distributed to service recipients, they should, where relevant, receive a share of administrative and support services when these costs are allocated.
1.1.2 Indirect functional centres (transient cost centres) Transient cost centres contain costs of an administrative and support nature, and their costs are not distributed to service recipients. Rather, costs in transient cost centres are distributed to patients as indirect costs to service recipient functional centres. Transient cost centres are discussed in Section 2 of this document. A typical list of functional centres containing indirect costs is as follows:
Administrative Services 71 1 10 Administration 71 1 15 Finance 71 1 20 Human Resources 71 1 30 Communications
Emergency Preparedness 71 1 34 Emergency Preparedness
Canadian Patient Cost Database Technical Document: MIS Patient Costing Methodology, March 2017
11
Systems Support Services 71 1 25 Systems Support
Functional Centre Support Services 71 1 35 Materiel Management 71 1 40 Volunteer Services 71 1 55 Plant Operation 71 1 60 Plant Security 71 1 65 Plant Maintenance 71 1 75 Bio-Medical Engineering/Medical Physics
Service Recipient–Support Services 71 1 45 Housekeeping 71 1 50 Laundry and Linen 71 1 80 Registration 71 1 82 Admission/Discharge Coordination 71 1 85 Service Recipient Transport 71 1 90 Health Records 71 1 95 Service Recipient Food Services
Education 71 8 20 Audiovisual 71 8 40 In-Service Education
1.1.3 Direct functional centres (absorbing cost centres) Absorbing cost centres are service recipient functional centres that absorb the indirect costs from transient cost centres. Absorbing cost centres are discussed in Section 3 of this document.
The following functional centres typically contain direct costs:
Service Recipient 71 2 ** Nursing Inpatient Services 71 3 ** Ambulatory Care Services 71 4 ** Diagnostic and Therapeutic Services 71 5 ** Community Health Services
Non–Service Recipient 71 7 ** Research 71 8 ** Education excluding Audiovisual and In-Service Education 71 9 ** Undistributed
Canadian Patient Cost Database Technical Document: MIS Patient Costing Methodology, March 2017
12
1.2 Classification of MIS Standards secondary accounts (fixed/variable costs)
Health service organizations that perform patient costing typically group their secondary financial accounts and classify them as containing either fixed or variable costs. The purpose of grouping financial accounts is simply to reduce computational burden by eliminating much of the detail that is contained in the full chart of financial accounts. Distinguishing between fixed and variable costs enables investigation of the marginal costs of changes in volumes of services, production or activity.
1.2.1 Fixed costs Fixed costs are those that remain relatively unchanged in total, regardless of the volume of services, production or activity, within a fairly wide range of volume. A typical breakdown of secondary accounts classified as fixed costs is as follows:
3 10 ** Compensation — Management and Operational Support Personnel 3 90 ** Compensation — Medical Personnel excluding 3 90 91 (Fee-for-Service)
and 3 90 92 (Sessional Fees) 6 ** ** Sundry 7 ** ** Equipment Expense (including Depreciation) 9 ** ** Buildings and Grounds Expense
1.2.2 Variable costs Variable costs are those that vary with the volume of services, production or activity. A typical breakdown of secondary accounts classified as variable costs is as follows:
3 50 ** Compensation — Unit-Producing Personnel 3 90 91 Medical Fee for Service 3 90 92 Sessional Fees 4 ** ** Supplies 5 ** ** Traceable Supplies and Other Expenses 8 ** ** Contracted-Out
1.2.3 Traceable supplies and other expenses While many costs are distributed to service recipients using workload units (e.g., nursing care) or are bundled in intermediate products (e.g., medical imaging exams), certain materials are expensive and should be tracked separately using service recipient–specific (or traceable) accounts, which are provided for in the MIS Standards.
Canadian Patient Cost Database Technical Document: MIS Patient Costing Methodology, March 2017
13
Common examples of traceable supplies include implantable devices and prosthetics and high-cost drugs. The secondary accounts used for traceable supplies are provided in broad group 5 of the MIS Standards:
5 20* Traceable Travel Expense — Service Recipient 5 50* Traceable Supplies — Food 5 60* Traceable Supplies — Medical and Surgical 5 63* Traceable Supplies — Drugsii 5 66* Traceable Supplies — Medical Gases
The MIS Standards requires traceable supplies accounts to be used for high-cost items. If this requirement cannot be met, refer to Appendix A for an alternative approach
1.2.4 Revenues and recoveries Revenues and recoveries are identified and tracked using MIS Standards secondary accounts. In general, revenues are excluded from patient costing. There may be exceptions to this rule, as in situations in which the health care organization is merely providing flow-through funding for a third party. For example, many medical imaging functional centres use their information systems’ capabilities to automate and simplify their radiologists’ fee-for-service professional billing as an administrative service. The professional fees are billed on the physicians’ behalf, the revenues are received and the physicians are provided with these funds. It is therefore entirely reasonable to include the revenues to prevent the inflation of service recipient costs beyond the organization’s responsibility.
Flow-through funding relationships may exist in other contexts as well, and each organization will determine which revenues and expenses are for third parties and flow through the health service organization for administrative convenience.
In addition, recoveries should be excluded from patient costing, as the objective is to understand the full service recipient cost, independent of the source of payment. If the organization wishes to include recoveries in its patient costs, the recoveries should not be netted against expenses but should be considered a separate category within the functional centre. Also note that if recoveries are included in patient costing, they should not exceed aggregate functional centre costs, so that there is no surplus. Thus recoveries should not be permitted to reduce the cost of other primary accounts during the indirect cost allocation. Please see Appendix B for a list of MIS Standards secondary accounts to be included in data submission to CIHI.
ii. Changed from 5 65 Traceable Supplies — Drugs in MIS Standards 2011.
Canadian Patient Cost Database Technical Document: MIS Patient Costing Methodology, March 2017
14
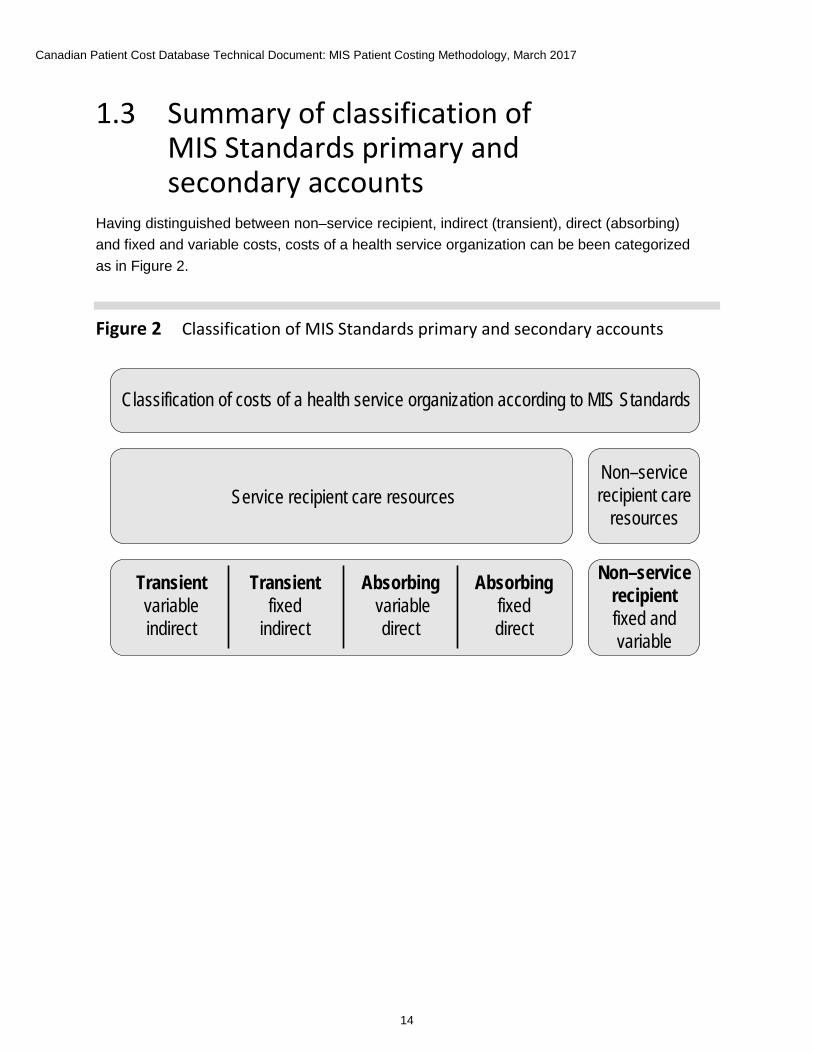
1.3 Summary of classification of MIS Standards primary and secondary accounts
Having distinguished between non–service recipient, indirect (transient), direct (absorbing) and fixed and variable costs, costs of a health service organization can be been categorized as in Figure 2.
Figure 2 Classification of MIS Standards primary and secondary accounts
Classification of costs of a health service organization according to MIS Standards
Service recipient care resourcesNon–service recipient care
resources
Transient variable indirect
Transient fixed
indirect
Absorbing variable
direct
Absorbing fixed direct
Non–service recipientfixed and variable
Canadian Patient Cost Database Technical Document: MIS Patient Costing Methodology, March 2017
15
1.3.1 Cost groups Costs can be further grouped based on the type of service provided to service recipients, as follows:
Variable direct costs • Compensation
• Medical Personnel Compensation
• Supplies and Contracted-Out Services
• Drugs
• Traceable Supplies
• Traceable Drugs
Variable indirect costs • All Variable Indirect
Fixed direct costs • Compensation
• Medical Personnel Compensation
• Sundry
• Equipment, Building and Grounds
Fixed indirect costs • All Fixed Indirect
Please refer to Appendix B for a detailed definition of each cost group. The cost groups described above provide a recommendation on how to group the cost data for the purpose of data submission to CIHI. It is expected that each health service organization may have its own unique way of grouping and analyzing costs, often at a more detailed level.
Canadian Patient Cost Database Technical Document: MIS Patient Costing Methodology, March 2017
16
Section 2: Allocating indirect cost 2.1 Administrative and support services costs Indirect costs in transient cost centres should be distributed to service recipient care functional centres using a very specific methodology, called the simultaneous equation allocation method (SEAM).
SEAM is considered the most accurate method, providing the most valid indirect and full-cost results. As such, this methodology is endorsed as the standard for cost allocation in the MIS Standards.
This approach
• Offers a realistic interpretation of functional centre interaction;
• Provides the full costs of the absorbing cost centres;
• Gives the source and amount of the indirect expense component of absorbing cost centres; and
• Is readily adaptable to computerized systems.
Some vendors may include SEAM as part of a financial system; otherwise, the function is part of many software spreadsheet packages.
If SEAM is not being used for cost allocation, refer to Appendix C for an alternative approach.
2.2 SEAM allocation bases SEAM requires allocation methodologies for each transient cost centre. For example, how much of the finance functional centre’s expenses should be allocated to each of the other administrative functional centres and to each of the consuming functional centres? These allocations may occur in 2 ways:
1. The MIS Standards encourages health service organizations to distribute the variablecost components, where possible, directly to functional centres based on usage. Thisis specifically required for certain functional centres such as the cost of major equipmentmaintenance, where a work order system should be used to distribute maintenance coststo consuming functional centres.
2. Any residual variable and fixed indirect costs remaining should be distributed to absorbingcost centres using a specific set of allocation bases unique to each functional centre.
The administrative and support services allocation bases, as well as a list of all valid transient cost centres for the SEAM allocation process, are provided in Appendix D.
Canadian Patient Cost Database Technical Document: MIS Patient Costing Methodology, March 2017
17
2.3 How SEAM works By creating linear equations for each functional centre, composed of the known direct costs plus a number of unknown full-cost variables (equal to the number of functional centres), multiplied by the corresponding allocation coefficient, the unknown full costs of all centres can be determined by solving the equations simultaneously. The cost allocation process is provided in Appendix E for those seeking more information on the specific mathematics. An example of the SEAM cost allocation process can be found in Appendix F and can also be found in the Cost Allocation section in the MIS Standards.
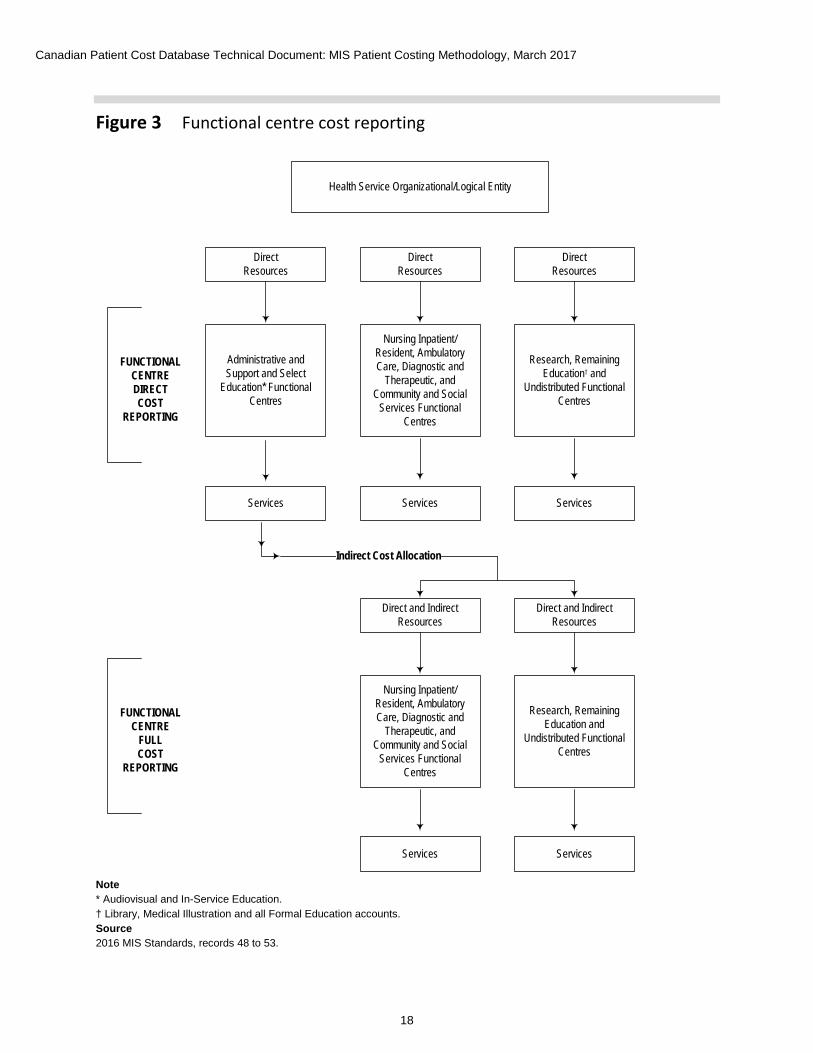
Section 3: Distributing costs to service recipients As illustrated in Figure 3, once the indirect cost allocation process is complete, the direct and indirect costs for each functional centre will be known. With this information, the functional centre full cost reports can be generated and the full cost of each service provided can be established. The next steps include determining unit cost and distributing the costs to service recipients. Section 3.1 provides 2 suggested approaches for determining unit costs and provides alternative methods where applicable. The cost distribution process is discussed in Section 3.2.
Canadian Patient Cost Database Technical Document: MIS Patient Costing Methodology, March 2017
18
Figure 3 Functional centre cost reporting
Health Service Organizational/Logical Entity
Direct Resources
Direct Resources
Direct Resources
Administrative and Support and Select
Education* Functional Centres
Nursing Inpatient/ Resident, Ambulatory Care, Diagnostic and
Therapeutic, and Community and Social
Services Functional Centres
Research, Remaining Education† and
Undistributed Functional Centres
Services Services Services
FUNCTIONALCENTREDIRECTCOST
REPORTING
Direct and IndirectResources
Direct and Indirect Resources
Nursing Inpatient/ Resident, Ambulatory Care, Diagnostic and
Therapeutic, and Community and Social
Services Functional Centres
Research, Remaining Education and
Undistributed Functional Centres
Services Services
FUNCTIONALCENTRE
FULLCOST
REPORTING
Indirect Cost Allocation
Note * Audiovisual and In-Service Education.† Library, Medical Illustration and all Formal Education accounts.Source2016 MIS Standards, records 48 to 53.
Canadian Patient Cost Database Technical Document: MIS Patient Costing Methodology, March 2017
19
The functional centre direct cost reporting framework builds on the functional centre framework, linking revenues, expenses, statistics and indicators to provide a comprehensive picture of the functional centres resource utilization, activity and productivity.
A principal component of this framework is the various workload measurement systems, which use standardized units of time for measuring and recording the volume of activity provided by a specific functional centre.
Functional centre direct cost reporting addresses the management information needs of functional centre managers by providing a set of guidelines and standards that assist in determining the volume, costs and kinds of direct resources consumed to provide a specific service within a particular functional centre.
Functional centre full cost reporting includes both the direct operating expenses incurred for labour, material and equipment, and the indirect expenses allocated from administrative and support and selected education services. These direct and indirect expenses, recorded in dollars, are referred to as the inputs to functional centre reporting, while the outputs are measured through the use of a workload measurement system and are expressed in terms of workload units or units of service.
Functional centre reporting produces information about the utilization of functional centre resources and the production of outputs. Managers can use this information to more effectively monitor and control operations for which they are accountable.
3.1 Determining unit cost There are 2 general approaches to determining unit cost:
1. The workload costing methodology; and
2. The workload + costing methodology.
3.1.1 Workload costing The workload costing methodology is used to cost the services of the following functional centres whose consumable supplies and other expenses generally behave linearly with workload:
• Nursing Inpatient/Resident Services
• Ambulatory Care Services
• Diagnostic and Therapeutic Services
• Community Health Services

Canadian Patient Cost Database Technical Document: MIS Patient Costing Methodology, March 2017
20
Workload costing follows these steps:
• Collect and report financial and statistical information based on the principles andprocedures in the MIS Standards.
• Track traceable supplies and other expenses by unique service recipient identifier.
• Use workload units (minutes) for direct and indirect cost distribution.
• Calculate the direct cost per workload unit:
=Direct cost per workload nnit
Direct costsless traceable supplies
and other expenses
Service recipientworkload units
• Determine the direct cost of a service or group of services by multiplying the applicableworkload units by the calculated direct cost per workload unit.
• Follow the same procedure to determine the indirect cost of a service.
Workload cost in a functional centre is calculated by following these steps:
1. Estimate workload unit direct cost of the functional centre as the ratio of total direct costs,less traceable expenses, to total service recipient workload units.
2. Estimate workload unit indirect cost of the functional centre as the ratio of total indirectcosts to total service recipient workload units.
3. The functional centre’s cost for a specific patient encounter is then calculated as the productof the unit cost and the patient-specific workload, plus traceable expenses for that encounter.
A minute-based cost allocation methodology, such as the MIS Standards nursing workload measurement system, is the preferred method in accordance with the MIS Standards. Costs allocated using the MIS nursing workload measurement system are the most reflective of the true costs of nursing care provision.
Proxy workload measures (e.g., weighted times using RIWs, patient hours, patient days) impact data quality and have demonstrated cost compression (e.g., high costs are not identified and the mean values may be shifted), which reduces patient costing precision.
For more details on the steps, including mathematical formulas, please consult Appendix G. For a step-by-step example of workload costing, please refer to Appendix H or to the Workload Costing Methodology section in the MIS Standards.
Canadian Patient Cost Database Technical Document: MIS Patient Costing Methodology, March 2017
21
3.1.2 Workload + costing The workload + costing methodology is used to calculate the unit costs in functional centres whose consumable supplies and other expenses may not all behave linearly with workload. As well, the type of services or products delivered by these functional centres is relatively standard, and the associated expenditures can be identified quite easily.
Operating Room (71 2 60 **) and Day Surgery Operating Room (71 3 60) functional centres are associated with identified Broad Group 4 Supplies and Other Expenses (Excludes Traceable Supplies and Other Expenses — Broad Group 5):
• Supplies — Linen Disposable (Secondary financial account 4 25 **)
• Linen Reusable — Interdepartmental (Secondary financial account 4 28 **)
• Medical/Surgical Supplies (Secondary financial account 4 60 **)
Endoscopy Specialty Day/Night Care (71 3 40 55) functional centre is associated with supply and expenses for
• Disposable Instruments (Secondary financial account 4 60 41)
Renal Dialysis Specialty Day/Night Care (71 3 40 85 **) functional centres are associated with supplies and expenses for
• Artificial Organs (4 60 26) Dialyzing Solutions (Note: Please open a specific secondaryfinancial account within your health service organization to record dialyzing solutionsexpenses separately.)
Plaster Room Specialty Clinic (71 3 50 65 40) functional centre is associated with supply and expenses for
• Dressings (4 60 61)
Clinical Laboratory (71 4 10 **) functional centre is associated with supply and expenses for
• Reagents/Chemicals (4 70 10)
Medical Imaging (71 4 15 **) functional centre is associated with supply and expenses for
• Medical Fee for Service (3 90 91)
• Film — Radiology (4 75 10)
• Contrast Media (4 75 30)
• Radioactive Materials (4 75 50)
Canadian Patient Cost Database Technical Document: MIS Patient Costing Methodology, March 2017
22
Respiratory Therapy (71 4 35 **) functional centre is associated with supply and expenses for Bronchoscopy procedures
• Disposable Instruments — Respiratory Services (4 60 43)
Pharmacy (71 4 40 70) functional centre is associated with Drug Procurement and Distribution supply and expenses for
• Drugs (4 63 00)
• Needles (4 60 63)
• Syringes (4 60 64)
• Gloves (4 60 65)
• IV Administration Sets (4 60 67)
In the above functional centres, workload is used to distribute the direct costs, such as compensation, that are expected to behave linearly with workload, whereas expected cost is used to distribute the other expenses.
Workload + costing is completed by following these steps:
• Collect and report financial and statistical information based on the principles and procedures in the MIS Standards.
• Establish separate secondary financial accounts for all identified supplies and other expenses.
• Track traceable supplies and other expenses by unique identifier (for example, prostheses in the operating room).
• Determine a standard relative value unit (RVU) for each service activity provided.
• Use the expected actual cost for all identified supplies and other expenses.
• Use workload units (minutes) for all other expenses.
Canadian Patient Cost Database Technical Document: MIS Patient Costing Methodology, March 2017
23
Workload + costing is more computationally intensive than workload costing. It is completed using the following calculations:
1. Calculate total RVUs for each category across all intermediate products (e.g., nursing care,medical images) in the functional centre.
2. Calculate the average category cost per RVU in the period by dividing the total costin each category by the total RVUs for that category.
3. Calculate the category cost for each intermediate product as the product of
• The RVU for each intermediate product and category; and
• The average cost per RVU for each category.
4. Calculate the full cost of each intermediate product by adding up the category costs forthat intermediate product; adding only those categories that are indirect will give the indirectcosts of the intermediate product, while adding only those categories that are direct will givethe direct costs of the intermediate product.
5. Obtain full, direct and indirect service recipient visit costs by linking service recipient–specificutilization of intermediate products with the full, direct and indirect costs of those products.
For more details on the steps, including mathematical formulas, please request the Workload + Costing Equations document by email ([email protected]). For a step-by-step example of workload + costing, please refer to Appendix I or to the Workload + Costing Methodology section in the MIS Standards (Chapter 6.5).
3.2 Distributing costs to service recipients Now that unit costing has been completed, the total costs are distributed among all service recipients based on the workload minutes consumed by each service recipient, ensuring that any traceable items are distributed as well.
Section 4: Submitting patient cost data to CIHI The Canadian Patient Cost Database (CPCD), which contains patient cost data for submitting provinces/territories, has a standard format to ensure consistency and enable analysis and comparison. The data submission standard is aligned with this methodology and is effective April 2016. For more information on the CPCD, please contact CIHI by email at [email protected].

Canadian Patient Cost Database Technical Document: MIS Patient Costing Methodology, March 2017
24
Glossary absorbing cost centre (ACC): Centres that are assigned or allocated the expenses that previously resided in the accounts of transient cost centres (TCCs). The term “absorbing” has been attached to these particular centres, since in the course of a cost allocation procedure these centres absorb costs of the TCCs.
allocation base: A formula or rationale that establishes the proportions by which the expenses of transient cost centres (TCCs) are assigned or distributed to transient or absorbing cost centres (ACCs). The costs of services produced by the TCCs are allocated to functional centres in proportion to their use of the services whose costs are being allocated or in the absence of an identifiable service measure, on the basis of a proxy that is deemed an acceptable alternative. Each TCC is associated with a particular allocation base that serves as the mechanism for analyzing relative resource utilization by functional centres and then allocating costs.
case costing: The process of determining the financial expense of care when care is delivered to a service recipient and allocating these expenses to each service recipient.
case mix: The methodology that is used to categorize service recipients into statistically and clinically homogeneous groups based on the collection of clinical and administrative data.
client: An individual who receives services from a health service organization.
cost group: A breakdown of variable and fixed direct and indirect expenses into a more detailed grouping, such as medical personnel compensation, using the MIS secondary accounts.
departments: Subdivisions in a hospital setting that pertain to the function or activity carried out; referred to as functional centres in the MIS Standards.
direct cost: Functional centre expenses that are directly related to the delivery of service recipient care services.
encounter: A contact by a service recipient with the health service organization to receive 1 or more services to address 1 or more needs, problems or diagnoses (may also be known as a case or registration).
fixed cost: An expense that remains relatively unchanged in total, regardless of the volume of production.
functional centre: A subdivision of an organization used in a functional accounting system to record the budget and actual direct expenses, statistics, and/or revenues, if any, that pertain to the function or activity being carried out.
Canadian Patient Cost Database Technical Document: MIS Patient Costing Methodology, March 2017
25
health service organization: A general term used to encompass providers of health care services; depending on the type of health care service that is being provided, may be a hospital, clinic, facility, etc.
indirect cost: Functional centre expenses that are classified as overhead.
intermediate products: The number of inputs that are used by various functional centres within a health service organization to deliver services to a service recipient or activity, within a fairly wide range of volume.
overhead costs: Expenses for services that do not directly produce intermediate products for service recipient care.
patient hours: A cost distribution methodology that utilizes the length of time a service recipient receives care to distribute nursing costs.
primary account: An account that tracks the organization’s assets, liabilities and net assets/fund balances (e.g., balance sheet accounts) and operational accounts.
Resource Intensity Weight (RIW): A value that quantifies the resource use that varies across service recipients and allows for the determination of a cost comparator to describe the expected relative average resource use of like inpatient cases or ambulatory care visits.
relative value unit (RVU): A value to distribute direct and indirect costs to the services provided by a functional centre.
simultaneous equation allocation method (SEAM): A cost allocation method that uses linear algebraic equations to solve the problem of reciprocal service loops and to determine the proportion of the full costs of other functional centres that must be allocated to a particular ACC to identify its indirect cost components and full cost.
secondary account: An account that is used to report revenues, expenses and statistics associated with a functional centre.
service recipient: The recipient of primary service activities of 1 or more functional centres of the health service organization, such as a patient or his or her spouse.
transient cost centre (TCC): A functional centre that contains expenses that are considered to reside there temporarily; typically support and administrative functional centres.
unit-producing personnel: Those functional centre personnel staff whose primary function is to carry out activities that directly contribute to the fulfillment of the service mandate.
variable cost: An expense that fluctuates in direct proportion to the volume of production or activity in a functional centre.

Canadian Patient Cost Database Technical Document: MIS Patient Costing Methodology, March 2017
26
visits: The occasions when service recipient activities are provided to service recipients; can be done in person (a face-to-face visit) or via email, telephone, etc. (a non–face-to-face visit).
workload: A cost distribution methodology that involves tracking time related to the activities completed by unit-producing personnel in a functional centre.
Canadian Patient Cost Database Technical Document: MIS Patient Costing Methodology, March 2017
27
Appendix A: Traceable supplies and other expenses The MIS Standards requires traceable supplies accounts to be used for high-cost items. If this requirement cannot be met, any specific supply or bundle of supplies that costs more than $500 should be tracked using the broad group 5 (Traceable Supplies and Other Expenses) accounts.
Canadian Patient Cost Database Technical Document: MIS Patient Costing Methodology, March 2017
28
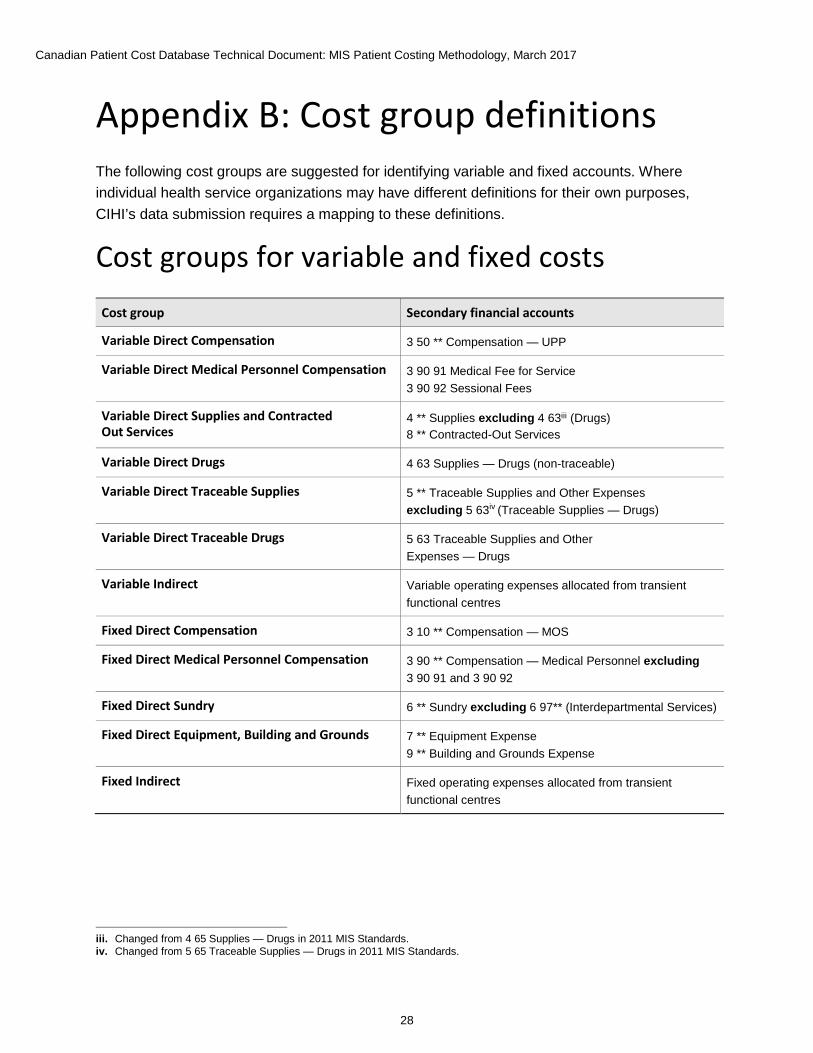
Appendix B: Cost group definitions The following cost groups are suggested for identifying variable and fixed accounts. Where individual health service organizations may have different definitions for their own purposes, CIHI’s data submission requires a mapping to these definitions.
Cost groups for variable and fixed costs Cost group Secondary financial accounts
Variable Direct Compensation 3 50 ** Compensation — UPP
Variable Direct Medical Personnel Compensation 3 90 91 Medical Fee for Service 3 90 92 Sessional Fees
Variable Direct Supplies and Contracted Out Services
4 ** Supplies excluding 4 63iii (Drugs) 8 ** Contracted-Out Services
Variable Direct Drugs 4 63 Supplies — Drugs (non-traceable)
Variable Direct Traceable Supplies 5 ** Traceable Supplies and Other Expenses excluding 5 63iv (Traceable Supplies — Drugs)
Variable Direct Traceable Drugs 5 63 Traceable Supplies and Other Expenses — Drugs
Variable Indirect Variable operating expenses allocated from transient functional centres
Fixed Direct Compensation 3 10 ** Compensation — MOS
Fixed Direct Medical Personnel Compensation 3 90 ** Compensation — Medical Personnel excluding 3 90 91 and 3 90 92
Fixed Direct Sundry 6 ** Sundry excluding 6 97** (Interdepartmental Services)
Fixed Direct Equipment, Building and Grounds 7 ** Equipment Expense 9 ** Building and Grounds Expense
Fixed Indirect Fixed operating expenses allocated from transient functional centres
iii. Changed from 4 65 Supplies — Drugs in 2011 MIS Standards.iv. Changed from 5 65 Traceable Supplies — Drugs in 2011 MIS Standards.
Canadian Patient Cost Database Technical Document: MIS Patient Costing Methodology, March 2017
29
Appendix C: Alternative approach for cost allocation If SEAM is not being used for cost allocation, an alternative methodology recommended for patient costing is the step-down method. The step-down method takes into account the amount of support services that a functional centre provides to other functional centres. The allocation is done by first allocating the costs of functional centres that provide the greatest support to the greatest number of other functional centres. The allocation continues until the costs of the functional centre that provides the least support to the fewest number of other functional centres have been allocated. Once a functional centre’s costs have been allocated, no subsequent costs are allocated back to it.

Canadian Patient Cost Database Technical Document: MIS Patient Costing Methodology, March 2017
30
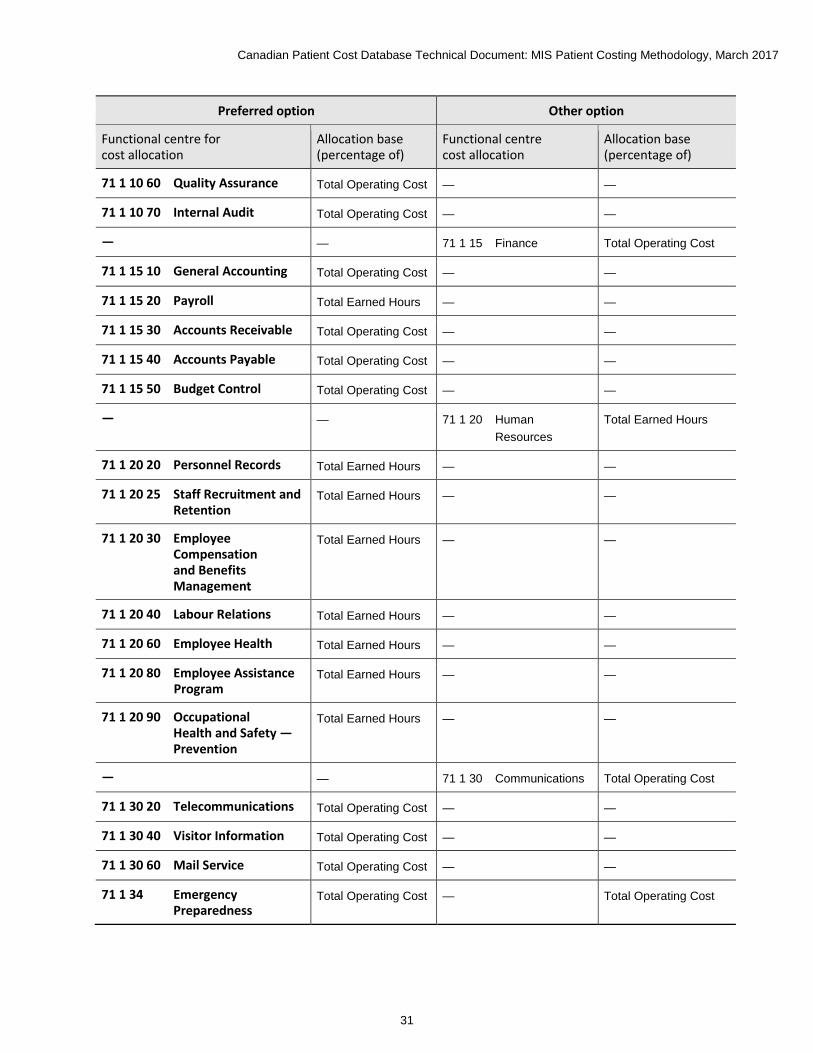
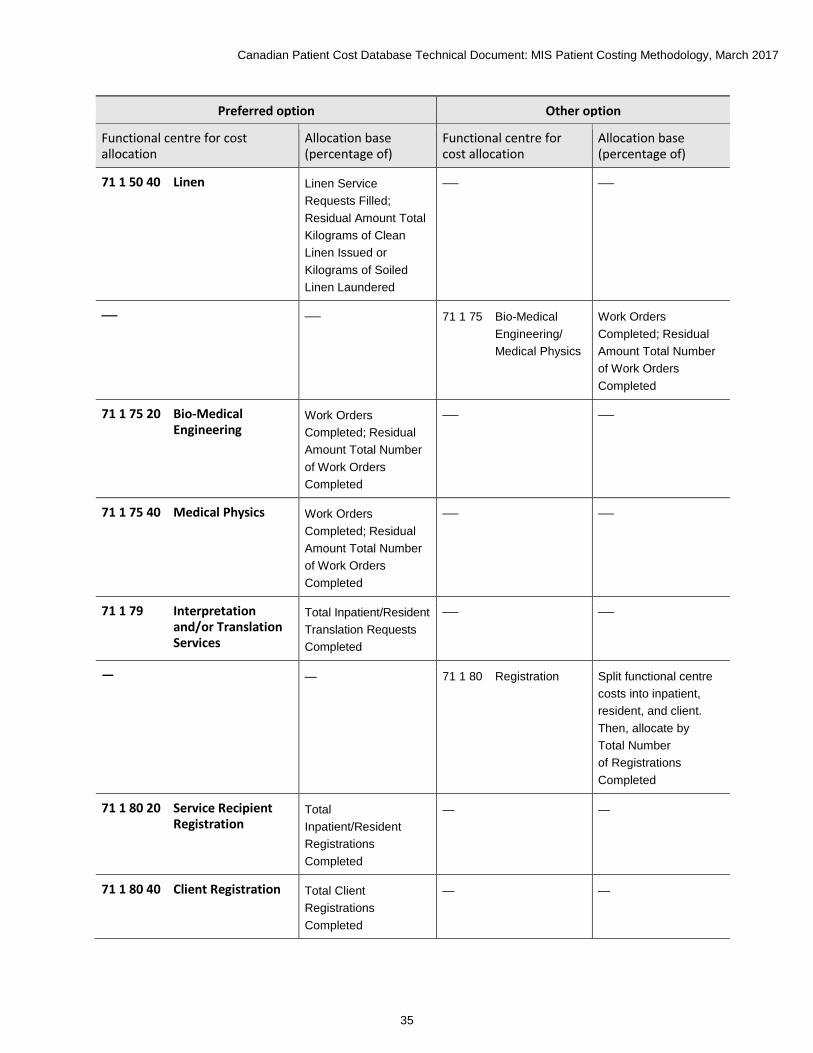
Appendix D: Administrative and support services allocation bases The allocation bases presented below show level 4 functional centre accounts as the preferred option for allocating transient or direct costs. Details on the cost allocation procedure, conducted using SEAM, are found in Section 2.
When using the cost allocation table, the following should be considered:
• Where the allocation base is described as a percentage of the total operating cost, budgeted rather than actual costs may be used throughout the year. At year-end, however, to provide a more refined allocation, the indirect costs for the absorbing cost centres should be recalculated using the actual costs, as these may vary significantly from those budgeted.
• Where the allocation base contains the expression “residual amount by,” the intent is that the direct operating costs of a transient functional centre will initially be redistributed to consuming functional centres by direct expense transfer (e.g., by work order) and only the remaining costs from the transient cost centres will be allocated as indirect expense, using the applicable allocation base.
• When calculating allocation bases (e.g., total operating cost), traceable supplies and traceable drugs are removed before calculating percentages for the allocation of indirect costs.
Administrative Services functional centres Preferred option Other option
Functional centre for cost allocation
Allocation base (percentage of)
Functional centre cost allocation
Allocation base (percentage of)
— — 71 1 10 Administration Total Operating Cost
71 1 10 10 Executive Offices Total Operating Cost — —
71 1 10 25 Utilization Management
Total Operating Cost — —
71 1 10 30 Board of Trustees Total Operating Cost — —
71 1 10 40 Public Relations Total Operating Cost — —
71 1 10 50 Planning and Development
Total Operating Cost — —
71 1 10 53 Privacy Office Total Operating Cost — —
71 1 10 55 Risk Management Total Operating Cost — —
Canadian Patient Cost Database Technical Document: MIS Patient Costing Methodology, March 2017
31
Preferred option Other option
Functional centre for cost allocation
Allocation base (percentage of)
Functional centre cost allocation
Allocation base (percentage of)
71 1 10 60 Quality Assurance Total Operating Cost — —
71 1 10 70 Internal Audit Total Operating Cost — —
— — 71 1 15 Finance Total Operating Cost
71 1 15 10 General Accounting Total Operating Cost — —
71 1 15 20 Payroll Total Earned Hours — —
71 1 15 30 Accounts Receivable Total Operating Cost — —
71 1 15 40 Accounts Payable Total Operating Cost — —
71 1 15 50 Budget Control Total Operating Cost — —
— — 71 1 20 Human Resources
Total Earned Hours
71 1 20 20 Personnel Records Total Earned Hours — —
71 1 20 25 Staff Recruitment and Retention
Total Earned Hours — —
71 1 20 30 Employee Compensation and Benefits Management
Total Earned Hours — —
71 1 20 40 Labour Relations Total Earned Hours — —
71 1 20 60 Employee Health Total Earned Hours — —
71 1 20 80 Employee Assistance Program
Total Earned Hours — —
71 1 20 90 Occupational Health and Safety — Prevention
Total Earned Hours — —
— — 71 1 30 Communications Total Operating Cost
71 1 30 20 Telecommunications Total Operating Cost — —
71 1 30 40 Visitor Information Total Operating Cost — —
71 1 30 60 Mail Service Total Operating Cost — —
71 1 34 Emergency Preparedness
Total Operating Cost — Total Operating Cost
Canadian Patient Cost Database Technical Document: MIS Patient Costing Methodology, March 2017
32
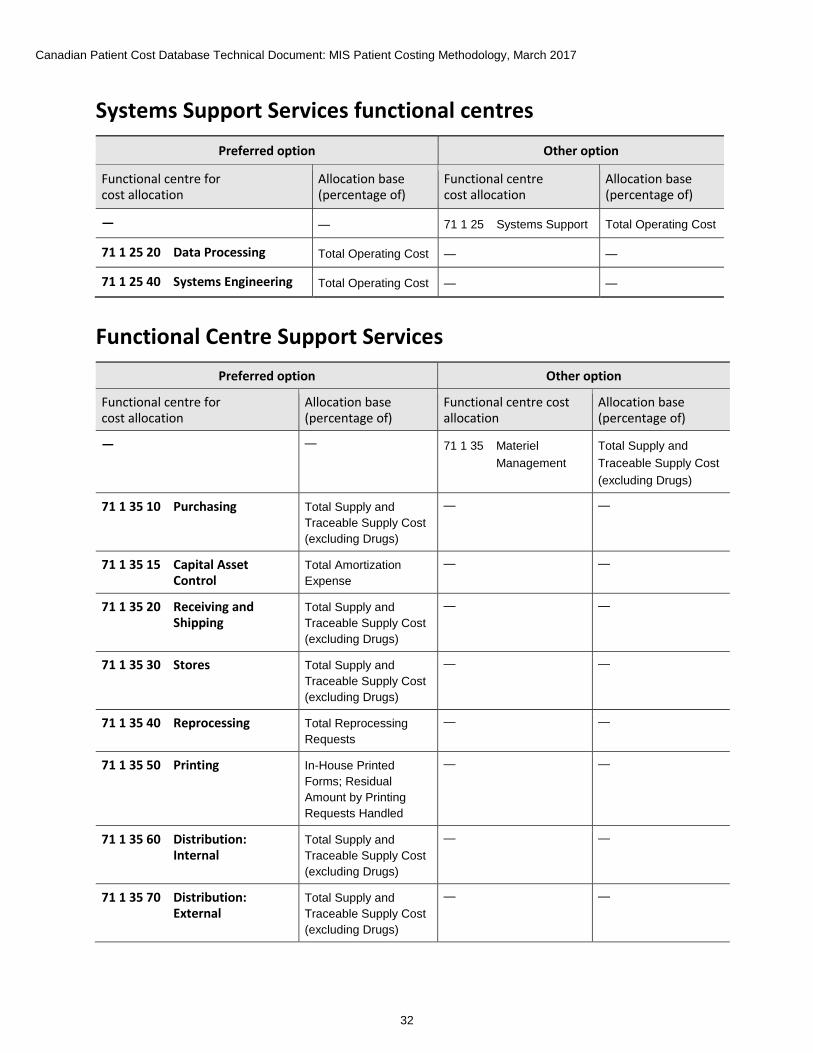
Systems Support Services functional centres Preferred option Other option
Functional centre for cost allocation
Allocation base (percentage of)
Functional centre cost allocation
Allocation base (percentage of)
— — 71 1 25 Systems Support Total Operating Cost
71 1 25 20 Data Processing Total Operating Cost — —
71 1 25 40 Systems Engineering Total Operating Cost — —
Functional Centre Support Services Preferred option Other option
Functional centre for cost allocation
Allocation base (percentage of)
Functional centre cost allocation
Allocation base (percentage of)
— — 71 1 35 Materiel Management
Total Supply and Traceable Supply Cost (excluding Drugs)
71 1 35 10 Purchasing Total Supply and Traceable Supply Cost (excluding Drugs)
— —
71 1 35 15 Capital Asset Control
Total Amortization Expense
— —
71 1 35 20 Receiving and Shipping
Total Supply and Traceable Supply Cost (excluding Drugs)
— —
71 1 35 30 Stores Total Supply and Traceable Supply Cost (excluding Drugs)
— —
71 1 35 40 Reprocessing Total Reprocessing Requests
— —
71 1 35 50 Printing In-House Printed Forms; Residual Amount by Printing Requests Handled
— —
71 1 35 60 Distribution: Internal
Total Supply and Traceable Supply Cost (excluding Drugs)
— —
71 1 35 70 Distribution: External
Total Supply and Traceable Supply Cost (excluding Drugs)
— —
Canadian Patient Cost Database Technical Document: MIS Patient Costing Methodology, March 2017
33
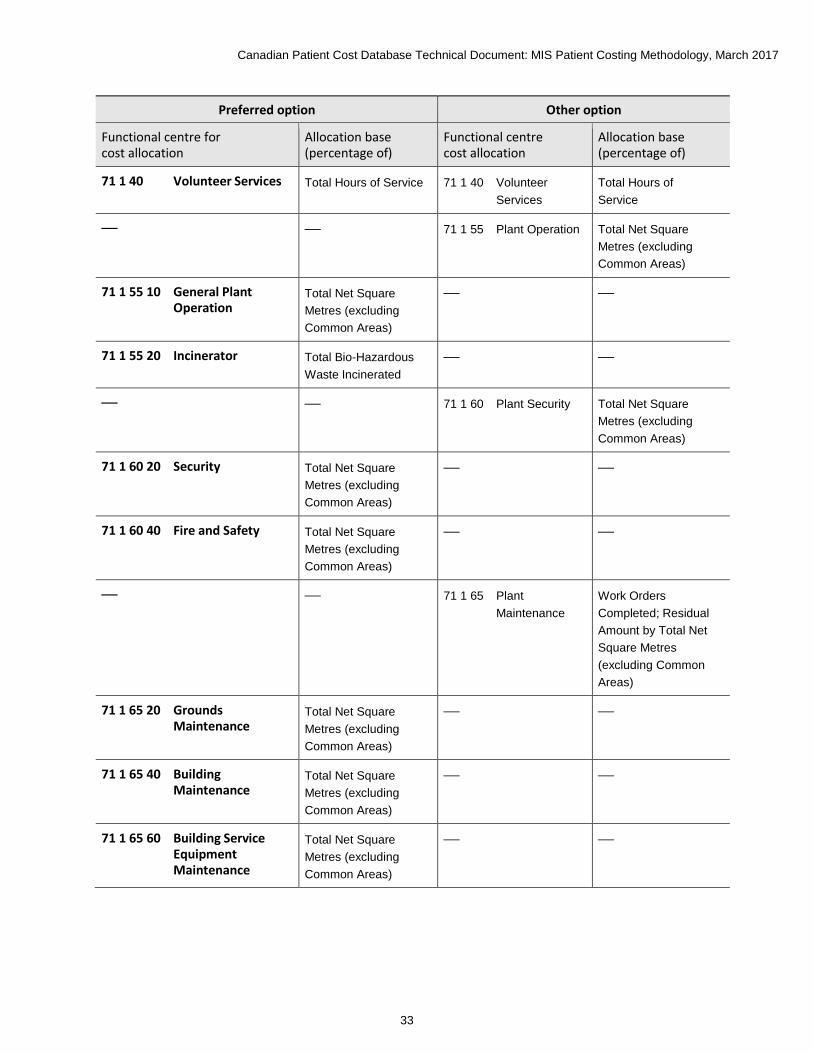
Preferred option Other option
Functional centre for cost allocation
Allocation base (percentage of)
Functional centre cost allocation
Allocation base (percentage of)
71 1 40 Volunteer Services Total Hours of Service 71 1 40 Volunteer Services
Total Hours of Service
— — 71 1 55 Plant Operation Total Net Square Metres (excluding Common Areas)
71 1 55 10 General Plant Operation
Total Net Square Metres (excluding Common Areas)
— —
71 1 55 20 Incinerator Total Bio-Hazardous Waste Incinerated
— —
— — 71 1 60 Plant Security Total Net Square Metres (excluding Common Areas)
71 1 60 20 Security Total Net Square Metres (excluding Common Areas)
— —
71 1 60 40 Fire and Safety Total Net Square Metres (excluding Common Areas)
— —
— — 71 1 65 Plant Maintenance
Work Orders Completed; Residual Amount by Total Net Square Metres (excluding Common Areas)
71 1 65 20 Grounds Maintenance
Total Net Square Metres (excluding Common Areas)
— —
71 1 65 40 Building Maintenance
Total Net Square Metres (excluding Common Areas)
— —
71 1 65 60 Building Service Equipment Maintenance
Total Net Square Metres (excluding Common Areas)
— —
Canadian Patient Cost Database Technical Document: MIS Patient Costing Methodology, March 2017
34
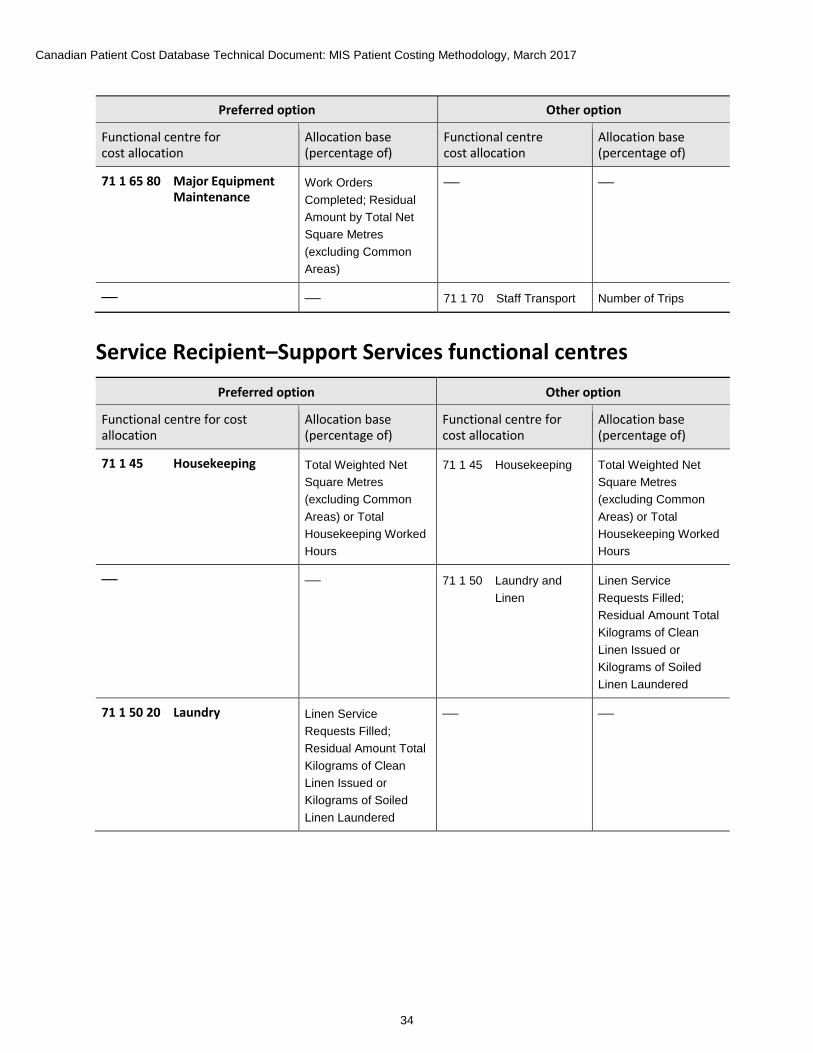
Preferred option Other option
Functional centre for cost allocation
Allocation base (percentage of)
Functional centre cost allocation
Allocation base (percentage of)
71 1 65 80 Major Equipment Maintenance
Work Orders Completed; Residual Amount by Total Net Square Metres (excluding Common Areas)
— —
— — 71 1 70 Staff Transport Number of Trips
Service Recipient–Support Services functional centres Preferred option Other option
Functional centre for cost allocation
Allocation base (percentage of)
Functional centre for cost allocation
Allocation base (percentage of)
71 1 45 Housekeeping Total Weighted Net Square Metres (excluding Common Areas) or Total Housekeeping Worked Hours
71 1 45 Housekeeping Total Weighted Net Square Metres (excluding Common Areas) or Total Housekeeping Worked Hours
— — 71 1 50 Laundry and Linen
Linen Service Requests Filled; Residual Amount Total Kilograms of Clean Linen Issued or Kilograms of Soiled Linen Laundered
71 1 50 20 Laundry Linen Service Requests Filled; Residual Amount Total Kilograms of Clean Linen Issued or Kilograms of Soiled Linen Laundered
— —
Canadian Patient Cost Database Technical Document: MIS Patient Costing Methodology, March 2017
35
Preferred option Other option
Functional centre for cost allocation
Allocation base (percentage of)
Functional centre for cost allocation
Allocation base (percentage of)
71 1 50 40 Linen Linen Service Requests Filled; Residual Amount Total Kilograms of Clean Linen Issued or Kilograms of Soiled Linen Laundered
— —
— — 71 1 75 Bio-Medical Engineering/ Medical Physics
Work Orders Completed; Residual Amount Total Number of Work Orders Completed
71 1 75 20 Bio-Medical Engineering
Work Orders Completed; Residual Amount Total Number of Work Orders Completed
— —
71 1 75 40 Medical Physics Work Orders Completed; Residual Amount Total Number of Work Orders Completed
— —
71 1 79 Interpretation and/or Translation Services
Total Inpatient/Resident Translation Requests Completed
— —
— — 71 1 80 Registration Split functional centre costs into inpatient, resident, and client. Then, allocate by Total Number of Registrations Completed
71 1 80 20 Service Recipient Registration
Total Inpatient/Resident Registrations Completed
— —
71 1 80 40 Client Registration Total Client Registrations Completed
— —
Canadian Patient Cost Database Technical Document: MIS Patient Costing Methodology, March 2017
36
Preferred option Other option
Functional centre for cost allocation
Allocation base (percentage of)
Functional centre for cost allocation
Allocation base (percentage of)
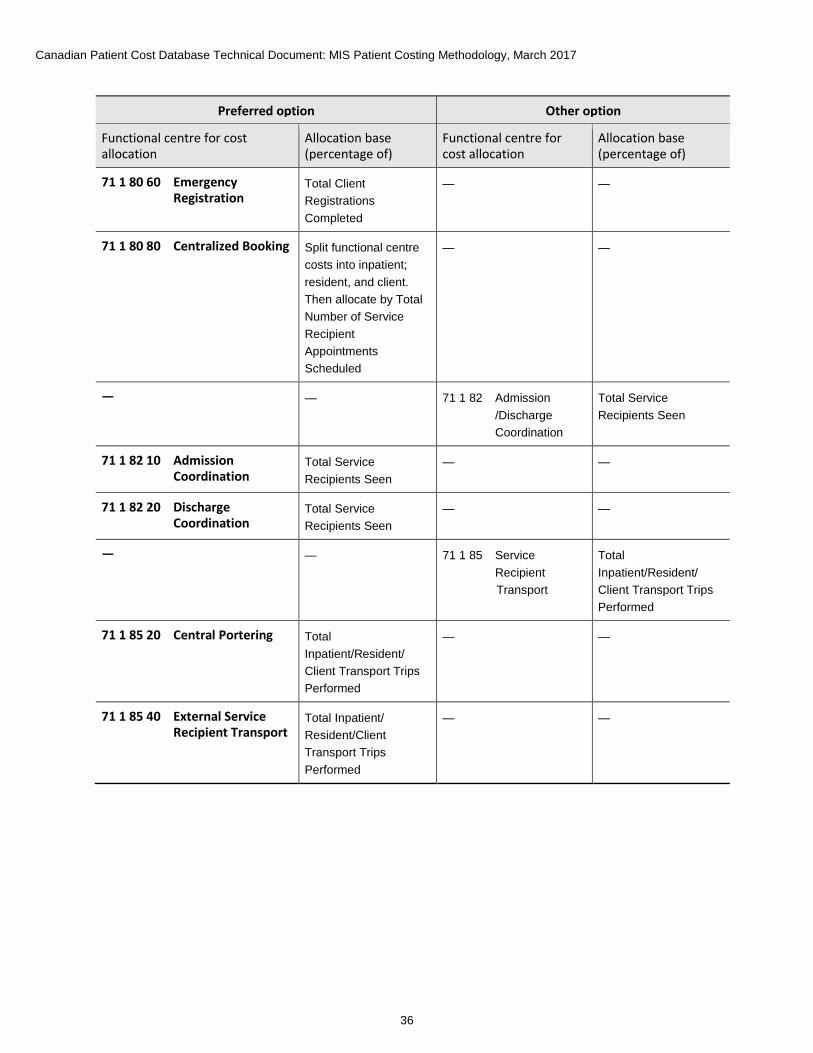
71 1 80 60 Emergency Registration
Total Client Registrations Completed
— —
71 1 80 80 Centralized Booking Split functional centre costs into inpatient; resident, and client. Then allocate by Total Number of Service Recipient Appointments Scheduled
— —
— — 71 1 82 Admission /Discharge Coordination
Total Service Recipients Seen
71 1 82 10 Admission Coordination
Total Service Recipients Seen
— —
71 1 82 20 Discharge Coordination
Total Service Recipients Seen
— —
— — 71 1 85 Service Recipient Transport
Total Inpatient/Resident/ Client Transport Trips Performed
71 1 85 20 Central Portering Total Inpatient/Resident/ Client Transport Trips Performed
— —
71 1 85 40 External Service Recipient Transport
Total Inpatient/ Resident/Client Transport Trips Performed
— —
Canadian Patient Cost Database Technical Document: MIS Patient Costing Methodology, March 2017
37
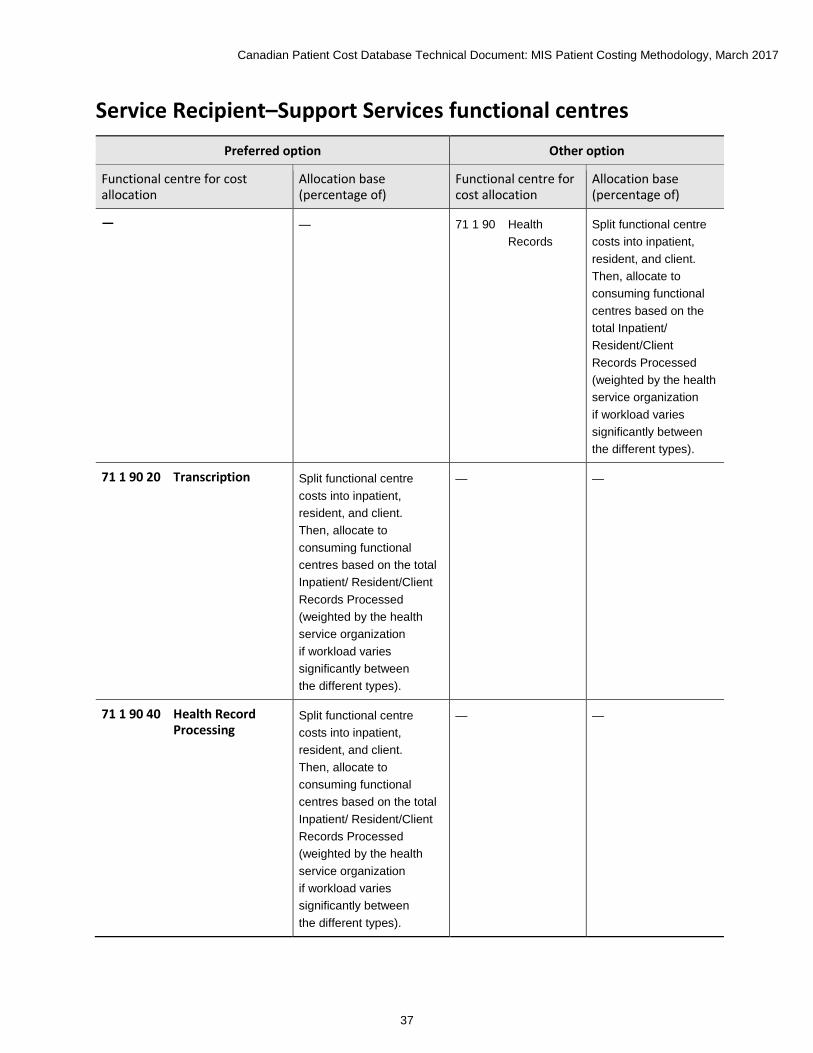
Service Recipient–Support Services functional centres Preferred option Other option
Functional centre for cost allocation
Allocation base (percentage of)
Functional centre for cost allocation
Allocation base (percentage of)
— — 71 1 90 Health Records
Split functional centre costs into inpatient, resident, and client. Then, allocate to consuming functional centres based on the total Inpatient/ Resident/Client Records Processed (weighted by the health service organization if workload varies significantly between the different types).
71 1 90 20 Transcription Split functional centre costs into inpatient, resident, and client. Then, allocate to consuming functional centres based on the total Inpatient/ Resident/Client Records Processed (weighted by the health service organization if workload varies significantly between the different types).
— —
71 1 90 40 Health Record Processing
Split functional centre costs into inpatient, resident, and client. Then, allocate to consuming functional centres based on the total Inpatient/ Resident/Client Records Processed (weighted by the health service organization if workload varies significantly between the different types).
— —

Canadian Patient Cost Database Technical Document: MIS Patient Costing Methodology, March 2017
38
Preferred option Other option
Functional centre for cost allocation Allocation base (percentage of)
Functional centre for cost allocation
Allocation base (percentage of)
71 1 90 60 Health Data and Information Services
Split functional centre costs into inpatient, resident and client, then allocate to consuming functional centres based on the total Inpatient/ Resident/Client Records Processed (weighted by the health service
— —
— — 71 1 95 Service Recipient Food Services
Total Meals Prepared
71 1 95 05 Service Recipient Food Services Administration
Total Meals Prepared
— —
71 1 95 20 Service Recipient Food Services Production
Total Meals Prepared
— —
71 1 95 30 Service Recipient Food Services Tray Assembly and Distribution
Total Meals Prepared
— —
71 1 95 40 Service Recipient Food Services Warewashing
Total Meals Prepared
— —
Selected Education functional centres Preferred option Other option
Functional centre for cost allocation
Allocation base (percentage of)
Functional centre cost allocation
Allocation base (percentage of)
71 8 20 Audiovisual Total Requisitions for Service Processed Session Hours
— —
71 8 40 In-Service Education
Total In-Service Education Participant Session Hours
— —
Canadian Patient Cost Database Technical Document: MIS Patient Costing Methodology, March 2017
39
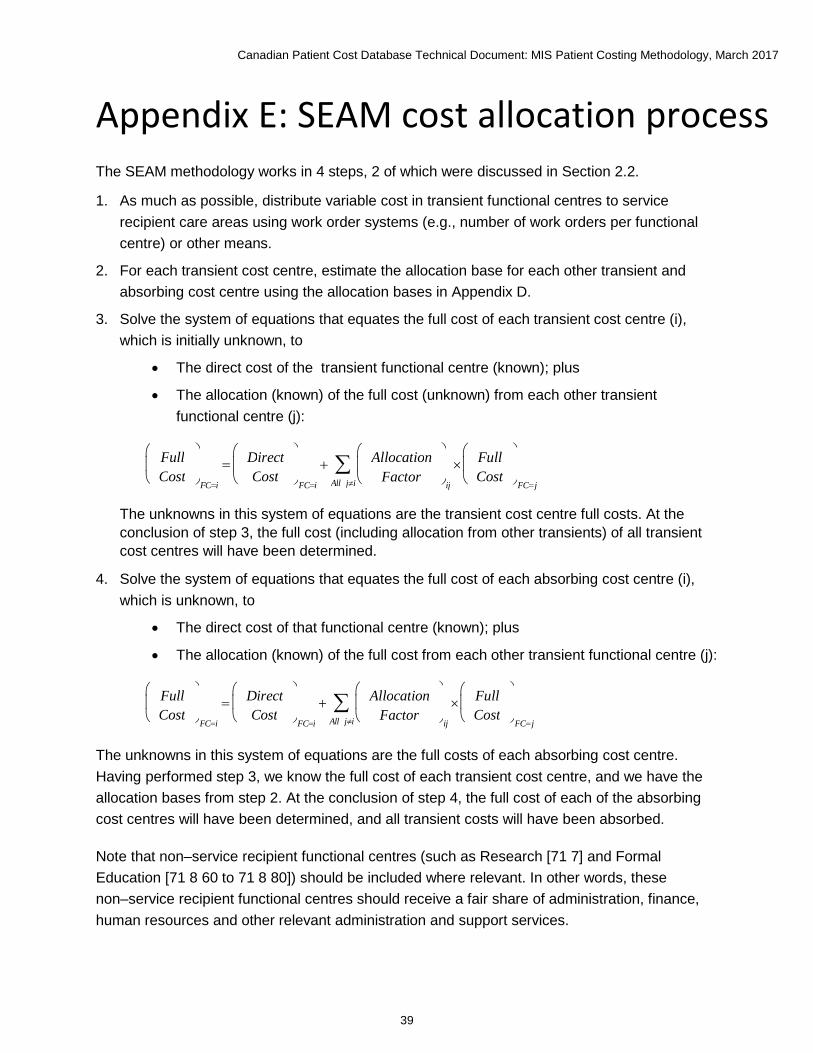
Appendix E: SEAM cost allocation process The SEAM methodology works in 4 steps, 2 of which were discussed in Section 2.2.
1. As much as possible, distribute variable cost in transient functional centres to service recipient care areas using work order systems (e.g., number of work orders per functional centre) or other means.
2. For each transient cost centre, estimate the allocation base for each other transient and absorbing cost centre using the allocation bases in Appendix D.
3. Solve the system of equations that equates the full cost of each transient cost centre (i), which is initially unknown, to
• The direct cost of the transient functional centre (known); plus
• The allocation (known) of the full cost (unknown) from each other transient functional centre (j):
The unknowns in this system of equations are the transient cost centre full costs. At the conclusion of step 3, the full cost (including allocation from other transients) of all transient cost centres will have been determined.
4. Solve the system of equations that equates the full cost of each absorbing cost centre (i), which is unknown, to
• The direct cost of that functional centre (known); plus
• The allocation (known) of the full cost from each other transient functional centre (j):
The unknowns in this system of equations are the full costs of each absorbing cost centre. Having performed step 3, we know the full cost of each transient cost centre, and we have the allocation bases from step 2. At the conclusion of step 4, the full cost of each of the absorbing cost centres will have been determined, and all transient costs will have been absorbed.
Note that non–service recipient functional centres (such as Research [71 7] and Formal Education [71 8 60 to 71 8 80]) should be included where relevant. In other words, these non–service recipient functional centres should receive a fair share of administration, finance, human resources and other relevant administration and support services.
F u l l C o s t
F C = i = D i r e c t
C o s t
F C = i + A l l o c a t i o n
F a c t o r
i j ×
A l l j ≠ i ∑ F u l l
C o s t
F C = j
F u l l C o s t
F C = i = D i r e c t
C o s t
F C = i + A l l o c a t i o n
F a c t o r
i j ×
A l l j ≠ i ∑ F u l l
C o s t
F C = j
Canadian Patient Cost Database Technical Document: MIS Patient Costing Methodology, March 2017
40
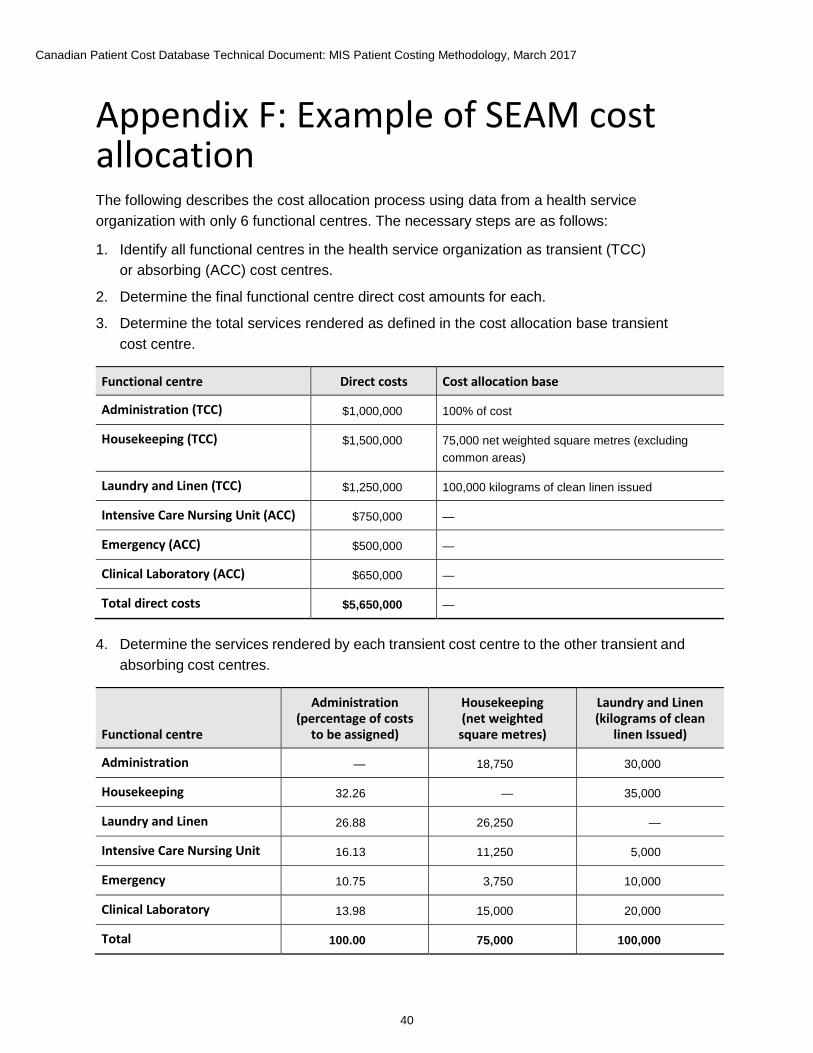
Appendix F: Example of SEAM cost allocation The following describes the cost allocation process using data from a health service organization with only 6 functional centres. The necessary steps are as follows:
1. Identify all functional centres in the health service organization as transient (TCC) or absorbing (ACC) cost centres.
2. Determine the final functional centre direct cost amounts for each.
3. Determine the total services rendered as defined in the cost allocation base transient cost centre.
Functional centre Direct costs Cost allocation base
Administration (TCC) $1,000,000 100% of cost
Housekeeping (TCC) $1,500,000 75,000 net weighted square metres (excluding common areas)
Laundry and Linen (TCC) $1,250,000 100,000 kilograms of clean linen issued
Intensive Care Nursing Unit (ACC) $750,000 —
Emergency (ACC) $500,000 —
Clinical Laboratory (ACC) $650,000 —
Total direct costs $5,650,000 —
4. Determine the services rendered by each transient cost centre to the other transient and absorbing cost centres.
Functional centre
Administration (percentage of costs
to be assigned)
Housekeeping (net weighted
square metres)
Laundry and Linen (kilograms of clean
linen Issued)
Administration — 18,750 30,000
Housekeeping 32.26 — 35,000
Laundry and Linen 26.88 26,250 —
Intensive Care Nursing Unit 16.13 11,250 5,000
Emergency 10.75 3,750 10,000
Clinical Laboratory 13.98 15,000 20,000
Total 100.00 75,000 100,000
Canadian Patient Cost Database Technical Document: MIS Patient Costing Methodology, March 2017
41
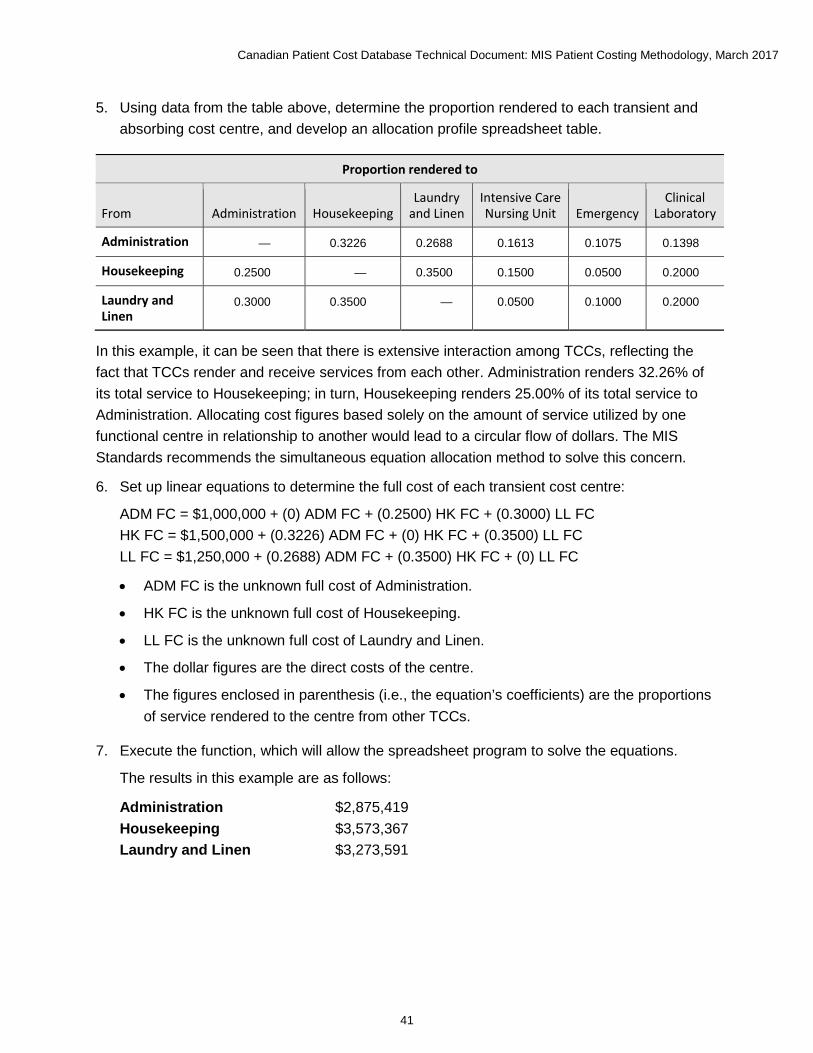
5. Using data from the table above, determine the proportion rendered to each transient and absorbing cost centre, and develop an allocation profile spreadsheet table.
Proportion rendered to
From Administration Housekeeping Laundry
and Linen Intensive Care Nursing Unit Emergency
Clinical Laboratory
Administration — 0.3226 0.2688 0.1613 0.1075 0.1398
Housekeeping 0.2500 — 0.3500 0.1500 0.0500 0.2000
Laundry and Linen
0.3000 0.3500 — 0.0500 0.1000 0.2000
In this example, it can be seen that there is extensive interaction among TCCs, reflecting the fact that TCCs render and receive services from each other. Administration renders 32.26% of its total service to Housekeeping; in turn, Housekeeping renders 25.00% of its total service to Administration. Allocating cost figures based solely on the amount of service utilized by one functional centre in relationship to another would lead to a circular flow of dollars. The MIS Standards recommends the simultaneous equation allocation method to solve this concern.
6. Set up linear equations to determine the full cost of each transient cost centre:
ADM FC = $1,000,000 + (0) ADM FC + (0.2500) HK FC + (0.3000) LL FC HK FC = $1,500,000 + (0.3226) ADM FC + (0) HK FC + (0.3500) LL FC LL FC = $1,250,000 + (0.2688) ADM FC + (0.3500) HK FC + (0) LL FC
• ADM FC is the unknown full cost of Administration.
• HK FC is the unknown full cost of Housekeeping.
• LL FC is the unknown full cost of Laundry and Linen.
• The dollar figures are the direct costs of the centre.
• The figures enclosed in parenthesis (i.e., the equation’s coefficients) are the proportions of service rendered to the centre from other TCCs.
7. Execute the function, which will allow the spreadsheet program to solve the equations.
The results in this example are as follows:
Administration $2,875,419 Housekeeping $3,573,367 Laundry and Linen $3,273,591
Canadian Patient Cost Database Technical Document: MIS Patient Costing Methodology, March 2017
42
8. Allocate the full costs of TCCs to ACCs by establishing this second set of equations using the figures calculated in step 7:
ICU FC = $750,000 + (0.1613) ADM FC + (0.1500) HK FC + (0.0500) LL FC ER FC = $500,000 + (0.1075) ADM FC + (0.0500) HK FC + (0.1000) LL FC LAB FC = $650,000 + (0.1398) ADM FC + (0.2000) HK FC + (0.2000) LL FC
• ICU FC is the unknown full cost of Intensive Care Nursing Unit.
• ER FC is the unknown full cost of Emergency.
• LAB FC is the unknown full cost of Clinical Laboratory.
• The dollar figures are the direct costs of the centre.
• The figures enclosed in parentheses (i.e., the equation’s coefficients) are the proportion of service each TCC renders to the particular ACC.
9. Solve the second set of equations achieving these results as the indirect costs for the ACCs:
Intensive Care Nursing Unit $1,913,490 Emergency $1,315,135 Clinical Laboratory $2,421,375
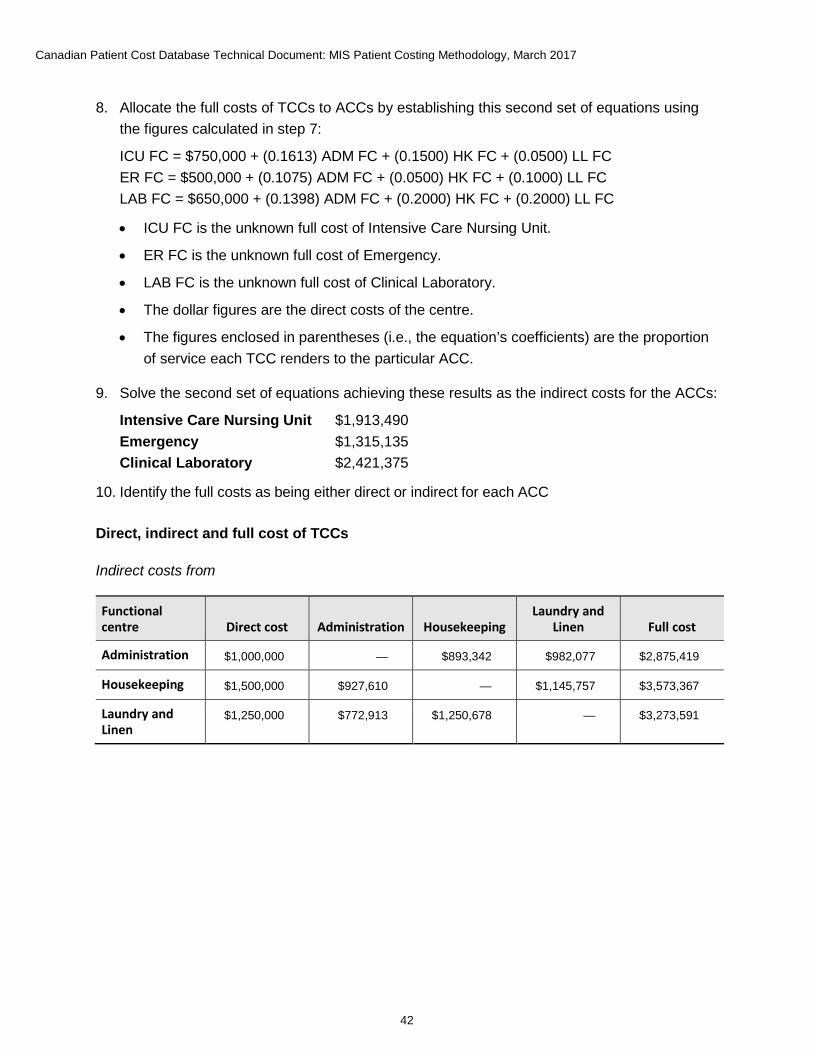
10. Identify the full costs as being either direct or indirect for each ACC
Direct, indirect and full cost of TCCs
Indirect costs from
Functional centre Direct cost Administration Housekeeping
Laundry and Linen Full cost
Administration $1,000,000 — $893,342 $982,077 $2,875,419
Housekeeping $1,500,000 $927,610 — $1,145,757 $3,573,367
Laundry and Linen
$1,250,000 $772,913 $1,250,678 — $3,273,591
Canadian Patient Cost Database Technical Document: MIS Patient Costing Methodology, March 2017
43
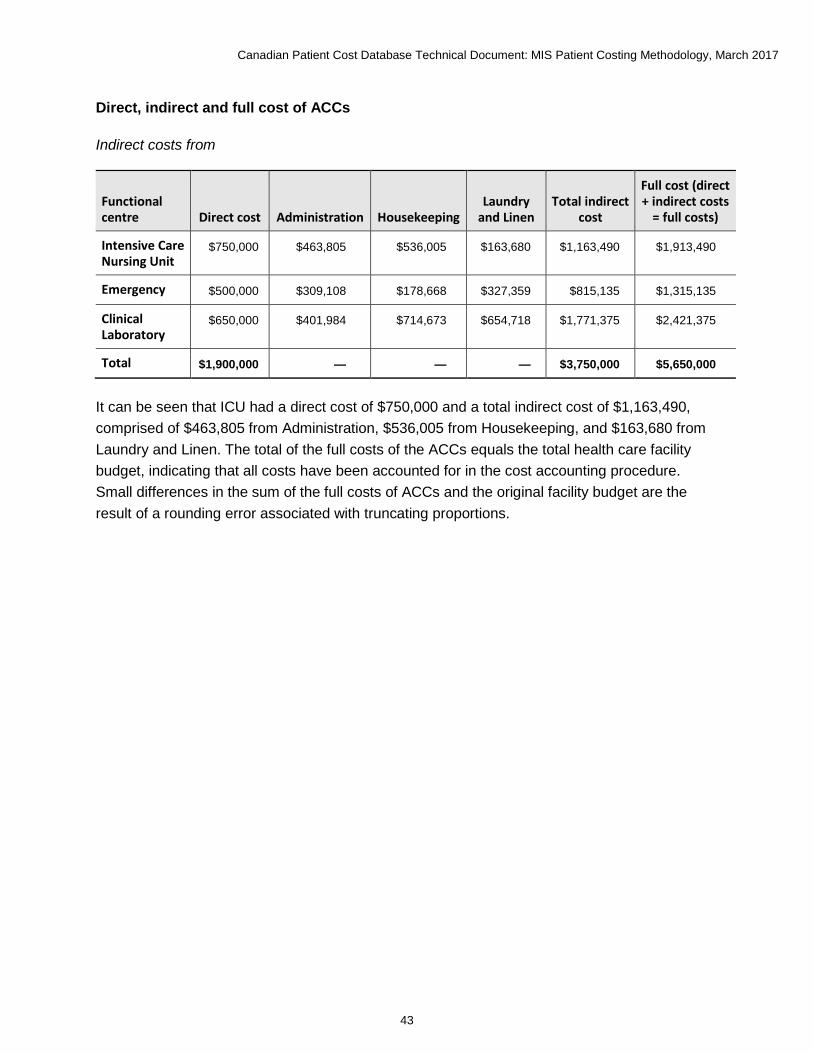
Direct, indirect and full cost of ACCs
Indirect costs from
Functional centre Direct cost Administration Housekeeping
Laundry and Linen
Total indirect cost
Full cost (direct + indirect costs
= full costs)
Intensive Care Nursing Unit
$750,000 $463,805 $536,005 $163,680 $1,163,490 $1,913,490
Emergency $500,000 $309,108 $178,668 $327,359 $815,135 $1,315,135
Clinical Laboratory
$650,000 $401,984 $714,673 $654,718 $1,771,375 $2,421,375
Total $1,900,000 — — — $3,750,000 $5,650,000
It can be seen that ICU had a direct cost of $750,000 and a total indirect cost of $1,163,490, comprised of $463,805 from Administration, $536,005 from Housekeeping, and $163,680 from Laundry and Linen. The total of the full costs of the ACCs equals the total health care facility budget, indicating that all costs have been accounted for in the cost accounting procedure. Small differences in the sum of the full costs of ACCs and the original facility budget are the result of a rounding error associated with truncating proportions.
Canadian Patient Cost Database Technical Document: MIS Patient Costing Methodology, March 2017
44
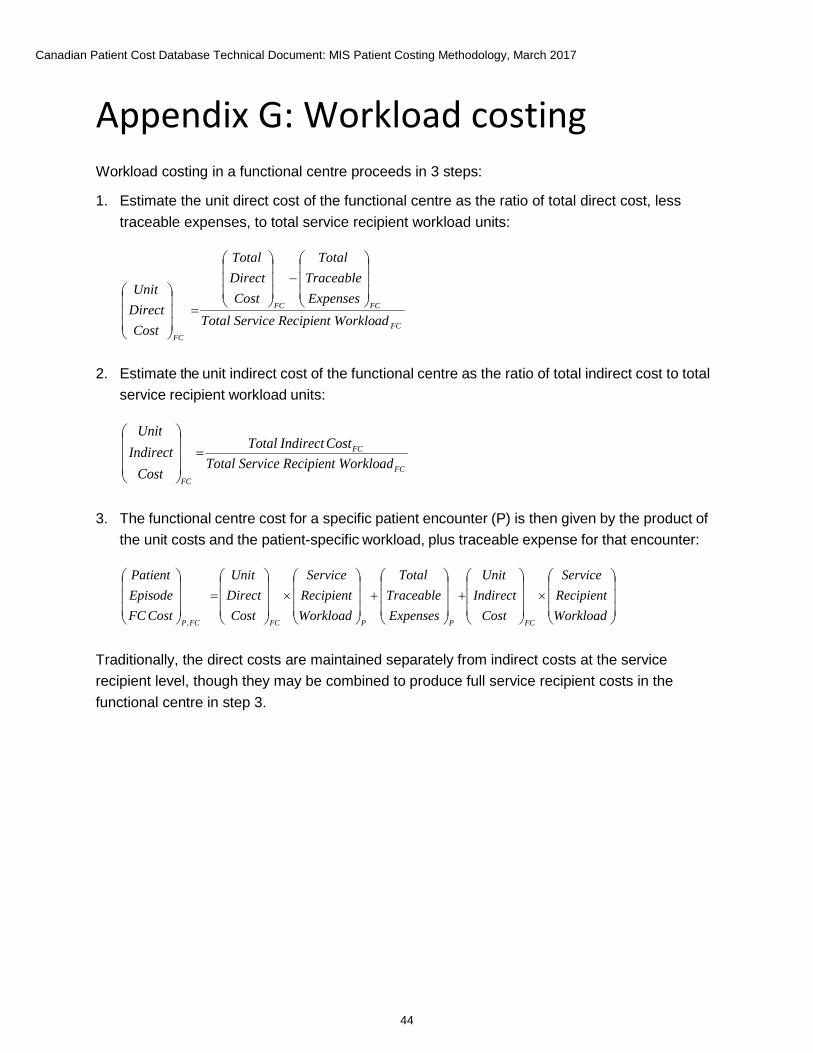
Appendix G: Workload costing Workload costing in a functional centre proceeds in 3 steps:
1. Estimate the unit direct cost of the functional centre as the ratio of total direct cost, less traceable expenses, to total service recipient workload units:
2. Estimate the unit indirect cost of the functional centre as the ratio of total indirect cost to total service recipient workload units:
3. The functional centre cost for a specific patient encounter (P) is then given by the product of the unit costs and the patient-specific workload, plus traceable expense for that encounter:
Traditionally, the direct costs are maintained separately from indirect costs at the service recipient level, though they may be combined to produce full service recipient costs in the functional centre in step 3.
FC
FCFC
FC
adent Workloice RecipiTotal ServExpensesTraceable
Total
CostDirectTotal
CostDirectUnit
−
=
FC
FC
FC
adent Workloice RecipiTotal ServCostIndirectTotal
CostIndirect
Unit =
×
+
+
×
=
WorkloadRecipientService
CostIndirect
Unit
ExpensesTraceable
Total
WorkloadRecipientService
CostDirectUnit
CostFCEpisodePatient
FCPPFCFCP
,
Canadian Patient Cost Database Technical Document: MIS Patient Costing Methodology, March 2017
45
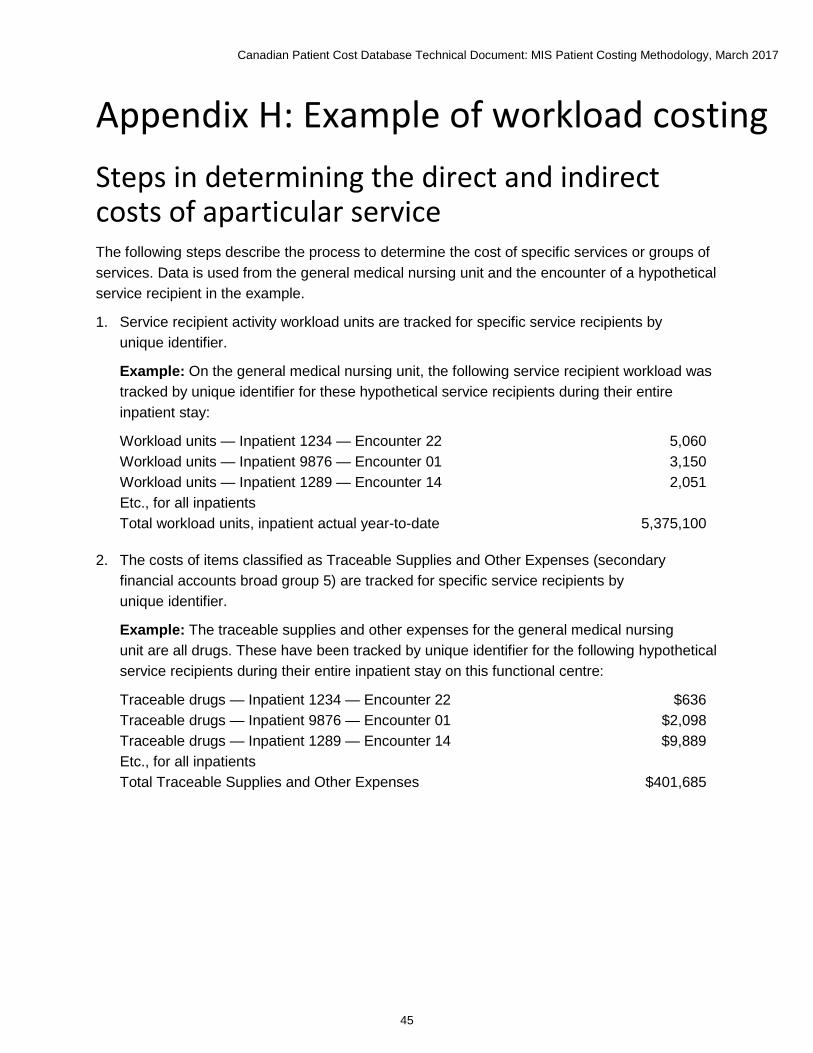
Appendix H: Example of workload costing Steps in determining the direct and indirect costs of aparticular service The following steps describe the process to determine the cost of specific services or groups of services. Data is used from the general medical nursing unit and the encounter of a hypothetical service recipient in the example.
1. Service recipient activity workload units are tracked for specific service recipients by unique identifier.
Example: On the general medical nursing unit, the following service recipient workload was tracked by unique identifier for these hypothetical service recipients during their entire inpatient stay:
Workload units — Inpatient 1234 — Encounter 22 5,060 Workload units — Inpatient 9876 — Encounter 01 3,150 Workload units — Inpatient 1289 — Encounter 14 2,051 Etc., for all inpatients Total workload units, inpatient actual year-to-date 5,375,100
2. The costs of items classified as Traceable Supplies and Other Expenses (secondary financial accounts broad group 5) are tracked for specific service recipients by unique identifier.
Example: The traceable supplies and other expenses for the general medical nursing unit are all drugs. These have been tracked by unique identifier for the following hypothetical service recipients during their entire inpatient stay on this functional centre:
Traceable drugs — Inpatient 1234 — Encounter 22 $636 Traceable drugs — Inpatient 9876 — Encounter 01 $2,098 Traceable drugs — Inpatient 1289 — Encounter 14 $9,889 Etc., for all inpatients Total Traceable Supplies and Other Expenses $401,685

Canadian Patient Cost Database Technical Document: MIS Patient Costing Methodology, March 2017
46
3. The direct costs recorded in the Traceable Supplies and Other Expenses accounts are subtracted from the total direct costs in order to determine the direct costs to be averaged over all service recipients.
Example: The traceable supplies and other expenses of the general medical nursing unit are subtracted to determine the net direct costs.
Total direct costs $3,684,727 Traceable supplies and other expenses ($401,685) Net direct costs $3,283,042
4. The net direct costs established in step 3 above are divided by the total service recipient workload units to determine the direct cost per workload unit.
Example: The calculation for the general medical nursing unit is as follows:
Direct cost per workload unit = $3,283,042 (net direct costs) ÷ 5,375,100 (service recipient workload units) = $0.61 (rounded).
5. To determine the indirect cost per workload unit, the indirect costs allocated to the functional centre are divided by the total service recipient activity workload units.
Example: The calculation for the general medical nursing unit is as follows:
Indirect cost per workload unit = $1,773,364 (indirect costs) ÷ 5,375,100 (service recipient workload units) = $0.33 (rounded).
6. To determine the direct costs of a particular service, or group of services provided by the functional centre, the direct cost per workload unit calculated in step 4 above is multiplied by the workload units applicable to that particular service/group of services.
Example: The cost of the services provided on a service recipient–specific basis can be determined for each individual service (e.g., a dressing change) if that level of detail is available and desired, or it can be determined for the total inpatient stay.
For the general medical nursing unit, we have the following information on the services received by 1 specific service recipient during his or her total inpatient stay:
Inpatient 1234 — Encounter 22 received a total of 5,060 service recipient workload units of care
The direct cost of these services is calculated as follows:
5,060 (workload units) × $0.61 (direct cost per workload units calculated in step 4) = $3,086.60
The level at which services are costed will depend on the detail desired by the health service organization for management purposes.
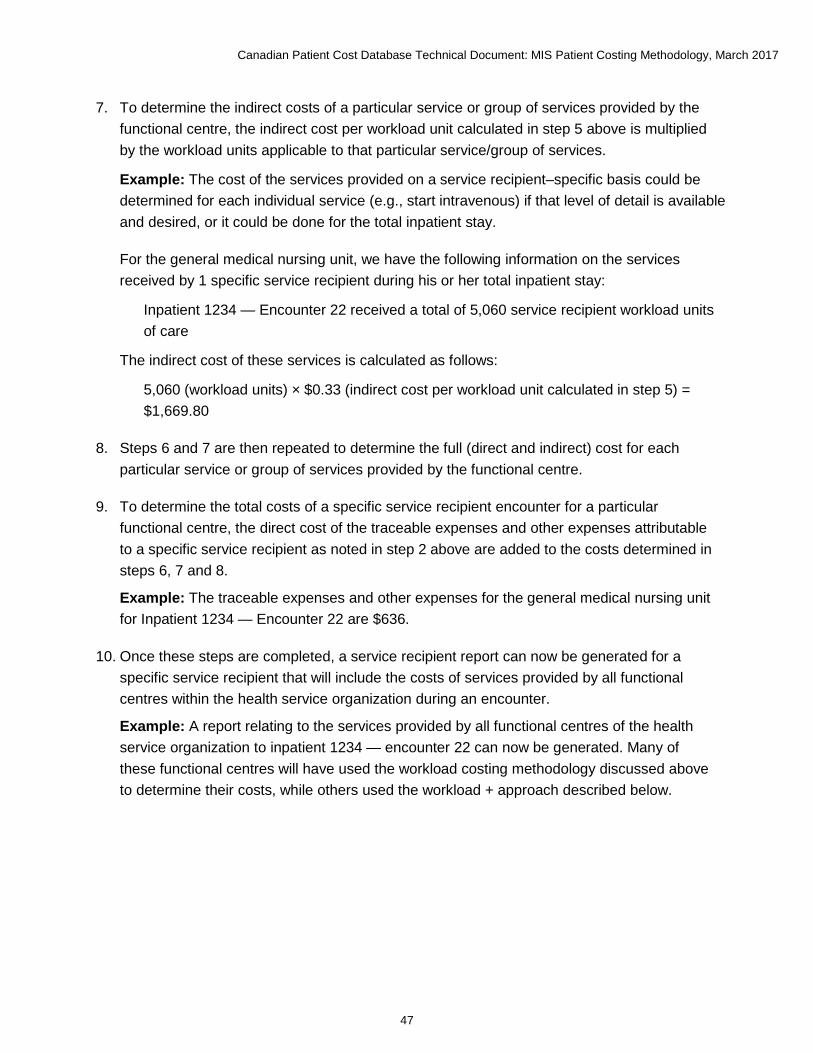
Canadian Patient Cost Database Technical Document: MIS Patient Costing Methodology, March 2017
47
7. To determine the indirect costs of a particular service or group of services provided by the functional centre, the indirect cost per workload unit calculated in step 5 above is multiplied by the workload units applicable to that particular service/group of services.
Example: The cost of the services provided on a service recipient–specific basis could be determined for each individual service (e.g., start intravenous) if that level of detail is available and desired, or it could be done for the total inpatient stay.
For the general medical nursing unit, we have the following information on the services received by 1 specific service recipient during his or her total inpatient stay:
Inpatient 1234 — Encounter 22 received a total of 5,060 service recipient workload units of care
The indirect cost of these services is calculated as follows:
5,060 (workload units) × $0.33 (indirect cost per workload unit calculated in step 5) = $1,669.80
8. Steps 6 and 7 are then repeated to determine the full (direct and indirect) cost for each particular service or group of services provided by the functional centre.
9. To determine the total costs of a specific service recipient encounter for a particular functional centre, the direct cost of the traceable expenses and other expenses attributable to a specific service recipient as noted in step 2 above are added to the costs determined in steps 6, 7 and 8.
Example: The traceable expenses and other expenses for the general medical nursing unit for Inpatient 1234 — Encounter 22 are $636.
10. Once these steps are completed, a service recipient report can now be generated for a specific service recipient that will include the costs of services provided by all functional centres within the health service organization during an encounter.
Example: A report relating to the services provided by all functional centres of the health service organization to inpatient 1234 — encounter 22 can now be generated. Many of these functional centres will have used the workload costing methodology discussed above to determine their costs, while others used the workload + approach described below.
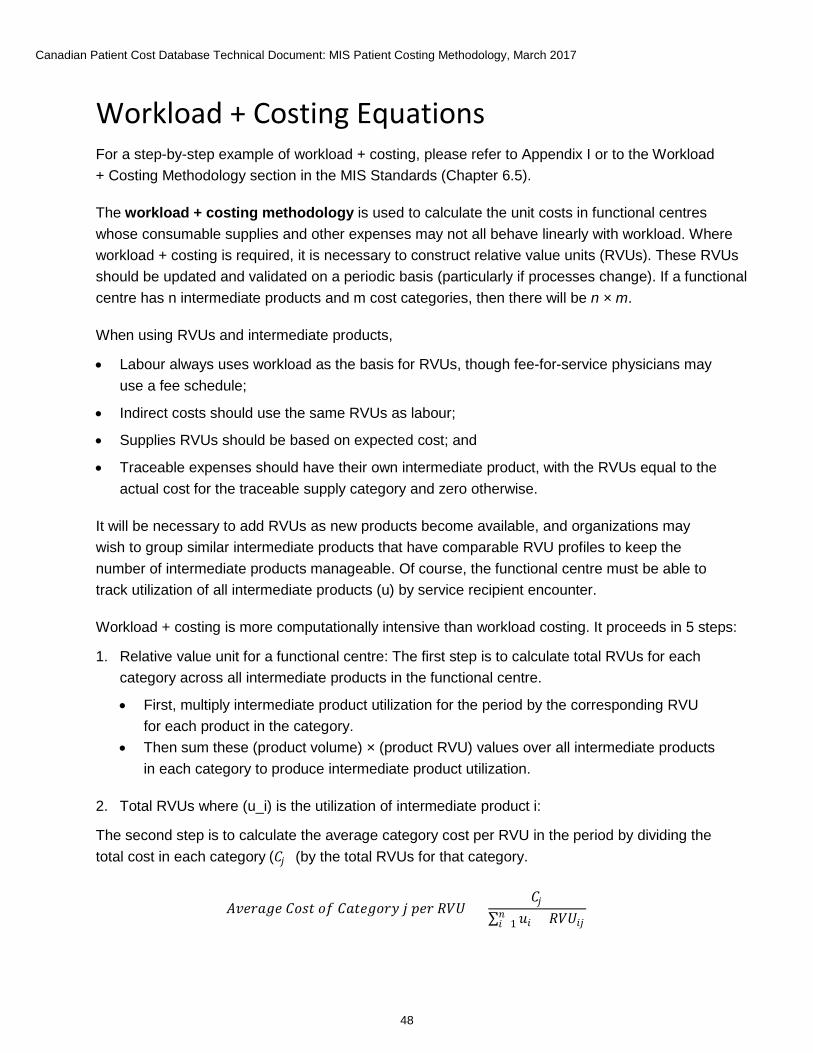
Canadian Patient Cost Database Technical Document: MIS Patient Costing Methodology, March 2017
48
Workload + Costing Equations For a step-by-step example of workload + costing, please refer to Appendix I or to the Workload + Costing Methodology section in the MIS Standards (Chapter 6.5).
The workload + costing methodology is used to calculate the unit costs in functional centres whose consumable supplies and other expenses may not all behave linearly with workload. Where workload + costing is required, it is necessary to construct relative value units (RVUs). These RVUs should be updated and validated on a periodic basis (particularly if processes change). If a functional centre has n intermediate products and m cost categories, then there will be n × m.
When using RVUs and intermediate products,
• Labour always uses workload as the basis for RVUs, though fee-for-service physicians may use a fee schedule;
• Indirect costs should use the same RVUs as labour;
• Supplies RVUs should be based on expected cost; and
• Traceable expenses should have their own intermediate product, with the RVUs equal to the actual cost for the traceable supply category and zero otherwise.
It will be necessary to add RVUs as new products become available, and organizations may wish to group similar intermediate products that have comparable RVU profiles to keep the number of intermediate products manageable. Of course, the functional centre must be able to track utilization of all intermediate products (u) by service recipient encounter.
Workload + costing is more computationally intensive than workload costing. It proceeds in 5 steps:
1. Relative value unit for a functional centre: The first step is to calculate total RVUs for each category across all intermediate products in the functional centre.
• First, multiply intermediate product utilization for the period by the corresponding RVU for each product in the category.
• Then sum these (product volume) × (product RVU) values over all intermediate products in each category to produce intermediate product utilization.
2. Total RVUs where (u_i) is the utilization of intermediate product i:
The second step is to calculate the average category cost per RVU in the period by dividing the total cost in each category (by the total RVUs for that category.
𝐴𝐴𝐴𝐴𝐴𝐴𝐴𝐴𝐴𝐴𝐴𝐴𝐴𝐴 𝐶𝐶𝐶𝐶𝐶𝐶𝐶𝐶 𝐶𝐶𝑜𝑜 𝐶𝐶𝐴𝐴𝐶𝐶𝐴𝐴𝐴𝐴𝐶𝐶𝐴𝐴𝐶𝐶 𝑗𝑗 𝑝𝑝𝐴𝐴𝐴𝐴 𝑅𝑅𝑅𝑅𝑅𝑅 =
𝐶𝐶𝑗𝑗∑ 𝑢𝑢𝑖𝑖𝑛𝑛𝑖𝑖=1 × 𝑅𝑅𝑅𝑅𝑅𝑅𝑖𝑖𝑗𝑗
(𝐶𝐶𝑗𝑗 )
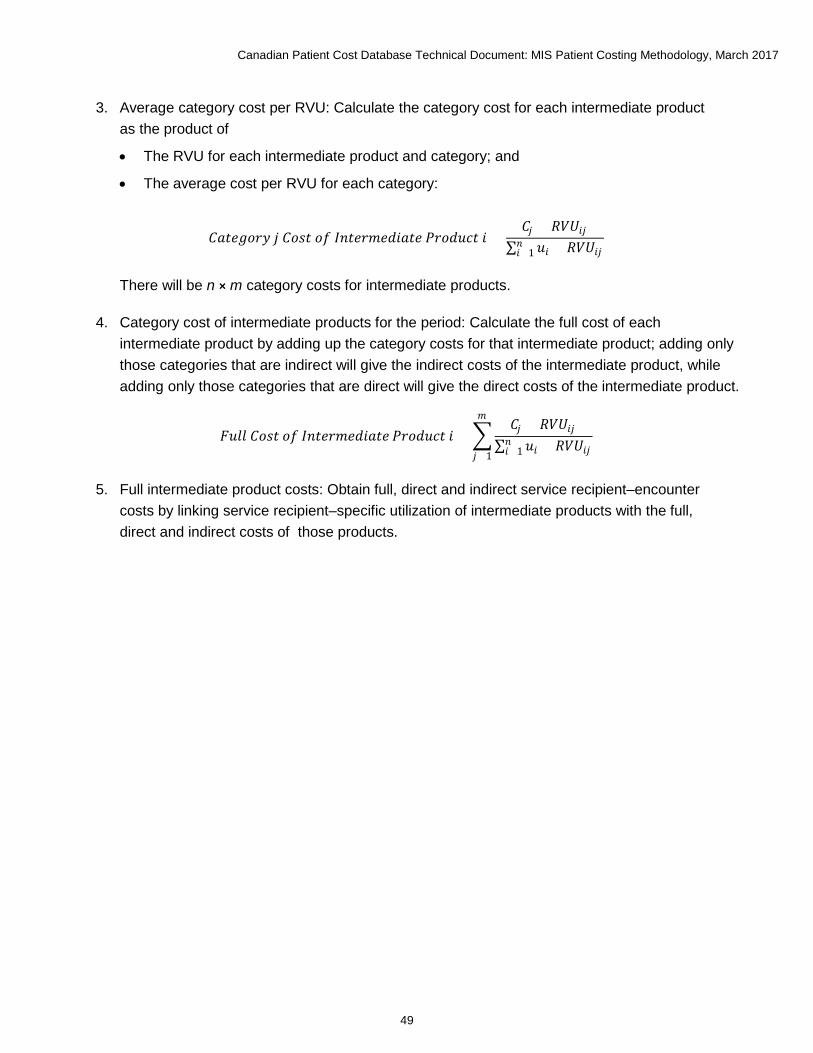
Canadian Patient Cost Database Technical Document: MIS Patient Costing Methodology, March 2017
49
3. Average category cost per RVU: Calculate the category cost for each intermediate product as the product of
• The RVU for each intermediate product and category; and
• The average cost per RVU for each category:
There will be n × m category costs for intermediate products.
4. Category cost of intermediate products for the period: Calculate the full cost of each intermediate product by adding up the category costs for that intermediate product; adding only those categories that are indirect will give the indirect costs of the intermediate product, while adding only those categories that are direct will give the direct costs of the intermediate product.
5. Full intermediate product costs: Obtain full, direct and indirect service recipient–encounter
costs by linking service recipient–specific utilization of intermediate products with the full, direct and indirect costs of those products.
𝐶𝐶𝐴𝐴𝐶𝐶𝐴𝐴𝐴𝐴𝐶𝐶𝐴𝐴𝐶𝐶 𝑗𝑗 𝐶𝐶𝐶𝐶𝐶𝐶𝐶𝐶 𝐶𝐶𝑜𝑜 𝐼𝐼𝑛𝑛𝐶𝐶𝐴𝐴𝐴𝐴𝐼𝐼𝐴𝐴𝐼𝐼𝑖𝑖𝐴𝐴𝐶𝐶𝐴𝐴 𝑃𝑃𝐴𝐴𝐶𝐶𝐼𝐼𝑢𝑢𝑃𝑃𝐶𝐶 𝑖𝑖 =𝐶𝐶𝑗𝑗 × 𝑅𝑅𝑅𝑅𝑅𝑅𝑖𝑖𝑗𝑗
∑ 𝑢𝑢𝑖𝑖𝑛𝑛𝑖𝑖=1 × 𝑅𝑅𝑅𝑅𝑅𝑅𝑖𝑖𝑗𝑗
𝐹𝐹𝑢𝑢𝐹𝐹𝐹𝐹 𝐶𝐶𝐶𝐶𝐶𝐶𝐶𝐶 𝐶𝐶𝑜𝑜 𝐼𝐼𝑛𝑛𝐶𝐶𝐴𝐴𝐴𝐴𝐼𝐼𝐴𝐴𝐼𝐼𝑖𝑖𝐴𝐴𝐶𝐶𝐴𝐴 𝑃𝑃𝐴𝐴𝐶𝐶𝐼𝐼𝑢𝑢𝑃𝑃𝐶𝐶 𝑖𝑖 = �𝐶𝐶𝑗𝑗 × 𝑅𝑅𝑅𝑅𝑅𝑅𝑖𝑖𝑗𝑗
∑ 𝑢𝑢𝑖𝑖𝑛𝑛𝑖𝑖=1 × 𝑅𝑅𝑅𝑅𝑅𝑅𝑖𝑖𝑗𝑗
𝐼𝐼
𝑗𝑗=1
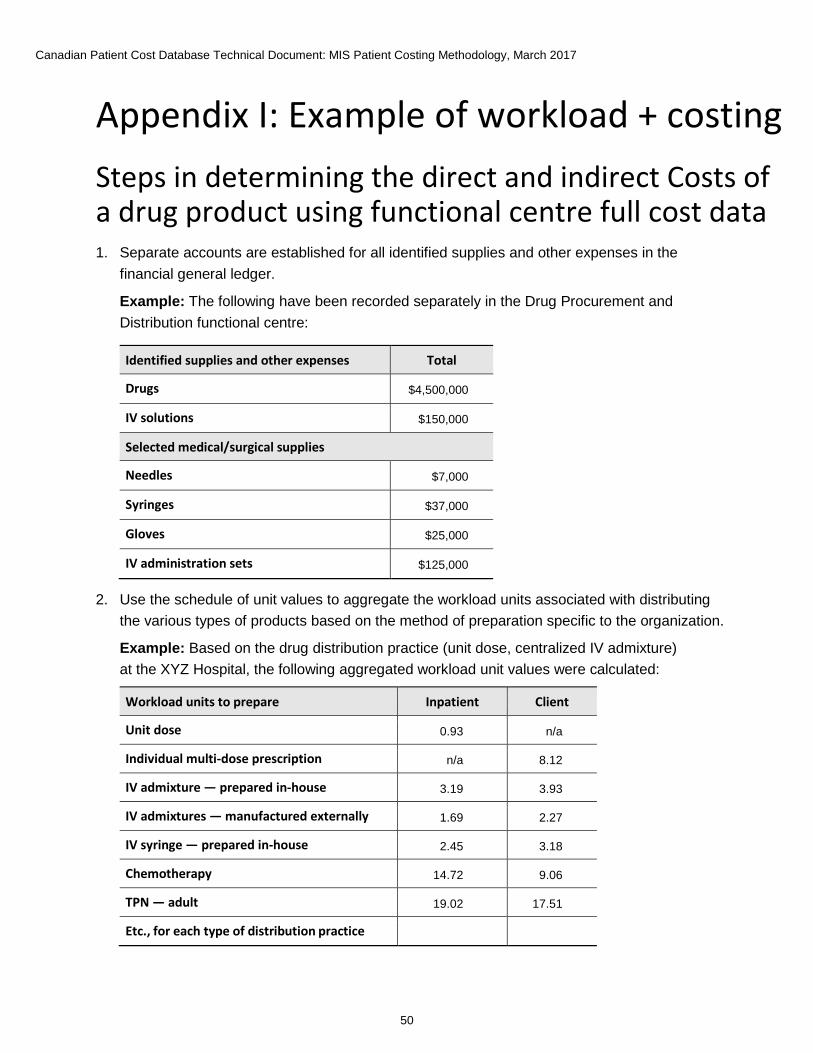
Canadian Patient Cost Database Technical Document: MIS Patient Costing Methodology, March 2017
50
Appendix I: Example of workload + costing Steps in determining the direct and indirect Costs of a drug product using functional centre full cost data 1. Separate accounts are established for all identified supplies and other expenses in the
financial general ledger.
Example: The following have been recorded separately in the Drug Procurement and Distribution functional centre:
Identified supplies and other expenses Total
Drugs $4,500,000
IV solutions $150,000
Selected medical/surgical supplies
Needles $7,000
Syringes $37,000
Gloves $25,000
IV administration sets $125,000
2. Use the schedule of unit values to aggregate the workload units associated with distributing the various types of products based on the method of preparation specific to the organization.
Example: Based on the drug distribution practice (unit dose, centralized IV admixture) at the XYZ Hospital, the following aggregated workload unit values were calculated:
Workload units to prepare Inpatient Client
Unit dose 0.93 n/a
Individual multi-dose prescription n/a 8.12
IV admixture — prepared in-house 3.19 3.93
IV admixtures — manufactured externally 1.69 2.27
IV syringe — prepared in-house 2.45 3.18
Chemotherapy 14.72 9.06
TPN — adult 19.02 17.51
Etc., for each type of distribution practice Etc., for each type of
Etc., for each type of
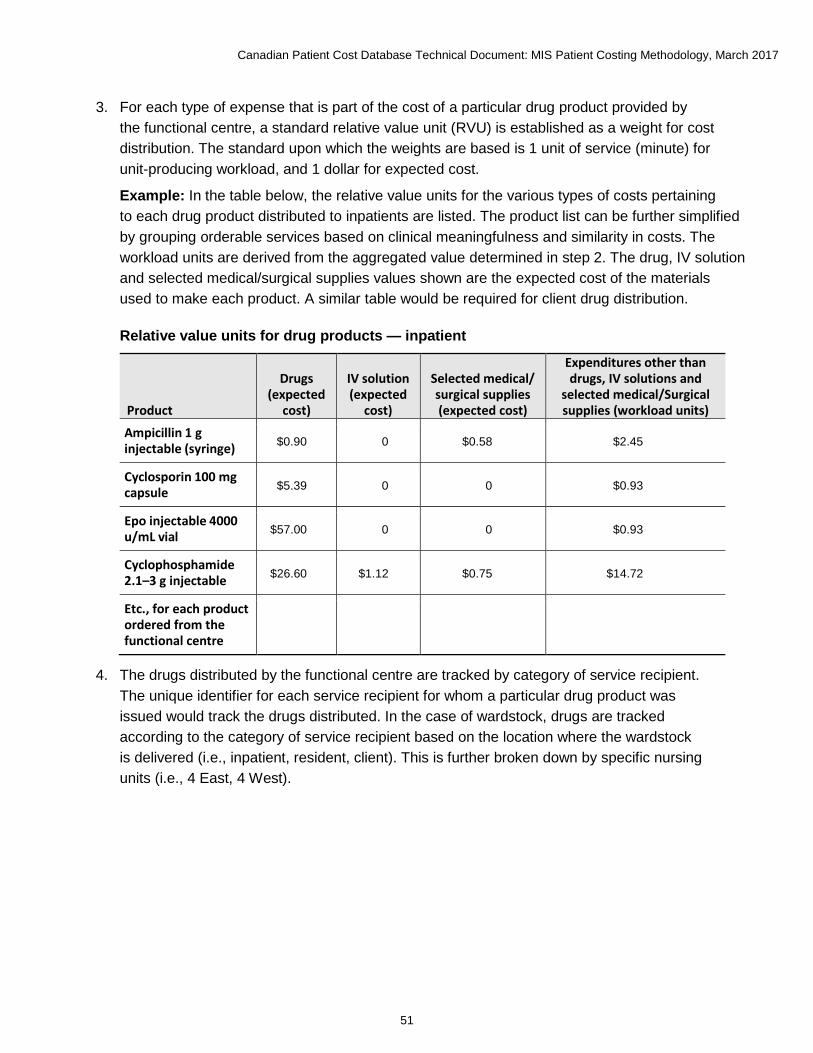
Canadian Patient Cost Database Technical Document: MIS Patient Costing Methodology, March 2017
51
3. For each type of expense that is part of the cost of a particular drug product provided by the functional centre, a standard relative value unit (RVU) is established as a weight for cost distribution. The standard upon which the weights are based is 1 unit of service (minute) for unit-producing workload, and 1 dollar for expected cost.
Example: In the table below, the relative value units for the various types of costs pertaining to each drug product distributed to inpatients are listed. The product list can be further simplified by grouping orderable services based on clinical meaningfulness and similarity in costs. The workload units are derived from the aggregated value determined in step 2. The drug, IV solution and selected medical/surgical supplies values shown are the expected cost of the materials used to make each product. A similar table would be required for client drug distribution.
Relative value units for drug products — inpatient
Product
Drugs (expected
cost)
IV solution (expected
cost)
Selected medical/ surgical supplies (expected cost)
Expenditures other than drugs, IV solutions and
selected medical/Surgical supplies (workload units)
Ampicillin 1 g injectable (syringe) $0.90 0 $0.58 $2.45
Cyclosporin 100 mg capsule $5.39 0 0 $0.93
Epo injectable 4000 u/mL vial $57.00 0 0 $0.93
Cyclophosphamide 2.1–3 g injectable $26.60 $1.12 $0.75 $14.72
Etc., for each product ordered from the functional centre
Etc., for each product
ordered from the
functional centre
Etc., for each product
ordered from the
functional centre
Etc., for each product ordered
from the functional centre
Etc., for each product ordered from the
functional centre
4. The drugs distributed by the functional centre are tracked by category of service recipient. The unique identifier for each service recipient for whom a particular drug product was issued would track the drugs distributed. In the case of wardstock, drugs are tracked according to the category of service recipient based on the location where the wardstock is delivered (i.e., inpatient, resident, client). This is further broken down by specific nursing units (i.e., 4 East, 4 West).

Canadian Patient Cost Database Technical Document: MIS Patient Costing Methodology, March 2017
52
Example: The following drugs were distributed by the Drug Procurement and Distribution functional centre in the last reporting period:
Product Inpatients Clients Total
Ampicillin 1 g injectable (syringe) 9,000 0 9,000
Cyclosporin 100 mg capsule 2,100 79,800 81,900
Epo injectable 4000 u/mL vial 80 950 1,030
Cyclophosphamide 2.1–3 g injectable
135 50 185
Etc., for each product ordered from the functional centre
Etc., for each product ordered
from the functional centre Etc., for each product ordered
from the functional centre Etc., for each product ordered
from the functional centre
Total products distributed 1,413,600 38,500 1,452,100
The following sample records show the detail to be collected for specific service recipients:
Inpatient 1234 — Encounter 22 Ampicillin 1 g injectable June 28 Inpatient 1234 — Encounter 22 Ampicillin 1 g injectable June 28 Inpatient 1234 — Encounter 22 Ampicillin 1 g injectable June 28 Inpatient 1234 — Encounter 22 Ampicillin 1 g injectable June 29, etc. Inpatient 1289 — Encounter 12 Cyclosporin 100 mg capsule Sept. 3 Inpatient 1289 — Encounter 12 Cyclosporin 100 mg capsule Sept. 3 Inpatient 1289 — Encounter 12 Cyclosporin 100 mg capsule Sept. 4 Inpatient 1289 — Encounter 12 Cyclosporin 100 mg capsule Sept. 4 Etc. for all inpatients and clients.
5. The total RVUs for each drug product distributed in the period is determined by multiplying the volume of drugs distributed by the standard relative value units established for that expense in step 3.
Example: The table below indicates the volume of a particular product that was distributed to inpatients during the reporting period. This figure is multiplied by the appropriate relative value units for the 3 types of expenditures. The total drugs, procurement and drug distribution RVU figures are determined when the calculations are completed.
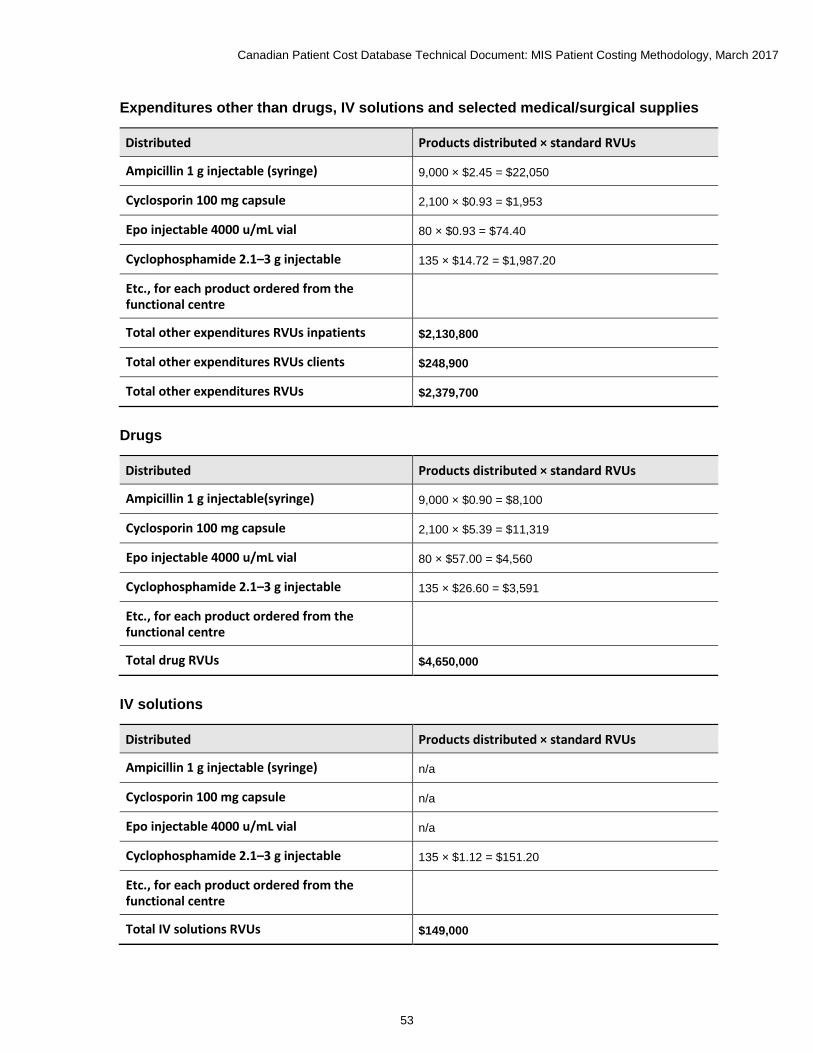
Canadian Patient Cost Database Technical Document: MIS Patient Costing Methodology, March 2017
53
Expenditures other than drugs, IV solutions and selected medical/surgical supplies
Distributed Products distributed × standard RVUs
Ampicillin 1 g injectable (syringe) 9,000 × $2.45 = $22,050
Cyclosporin 100 mg capsule 2,100 × $0.93 = $1,953
Epo injectable 4000 u/mL vial 80 × $0.93 = $74.40
Cyclophosphamide 2.1–3 g injectable 135 × $14.72 = $1,987.20
Etc., for each product ordered from the functional centre
Etc., for each product ordered from the functional centre
Total other expenditures RVUs inpatients $2,130,800
Total other expenditures RVUs clients $248,900
Total other expenditures RVUs $2,379,700
Drugs
Distributed Products distributed × standard RVUs
Ampicillin 1 g injectable(syringe) 9,000 × $0.90 = $8,100
Cyclosporin 100 mg capsule 2,100 × $5.39 = $11,319
Epo injectable 4000 u/mL vial 80 × $57.00 = $4,560
Cyclophosphamide 2.1–3 g injectable 135 × $26.60 = $3,591
Etc., for each product ordered from the functional centre
Etc., for each product ordered from the functional centre
Total drug RVUs $4,650,000
IV solutions
Distributed Products distributed × standard RVUs
Ampicillin 1 g injectable (syringe) n/a
Cyclosporin 100 mg capsule n/a
Epo injectable 4000 u/mL vial n/a
Cyclophosphamide 2.1–3 g injectable 135 × $1.12 = $151.20
Etc., for each product ordered from the functional centre
Etc., for each product ordered from the functional centre
Total IV solutions RVUs $149,000

Canadian Patient Cost Database Technical Document: MIS Patient Costing Methodology, March 2017
54
Selected medical/surgical supplies
Distributed Products distributed × standard RVUs
Ampicillin 1 g injectable (syringe) 9,000 × $0.58 = $5,220
Cyclosporin 100 mg capsule n/a
Epo injectable 4000 u/mL vial n/a
Cyclophosphamide 2.1–3 g injectable 135 × $0.75 = $101.25
Etc., for each product ordered from the functional centre
Etc., for each product ordered from the functional centre
Total selected medical/surgical supplies RVUs $194,000
6. The total direct costs for each type of expenditure are determined from the functional centre direct cost report and a direct cost for each type of relative value unit then calculated. Any identified supplies and other expenses should be subtracted to obtain the costs to be distributed using workload as the basis.
Example: Direct cost information is obtained for the Drug Procurement and Distribution functional centre. The net direct cost to be distributed based on workload relative value units are determined by subtracting the costs of drugs, IV solutions and medical/surgical supplies.The direct cost per relative value unit is then determined for the 4 types of expenses.
Total direct costs $8,000,000 Drugs $4,500,000 IV solutions $150,000 Selected medical/surgical supplies $194,000 Net direct costs $3,156,000
Direct cost per drug RVU = Drugs ÷ Total drug RVUs = $4,500,000 ÷ 4,650,000 = $0.97 (rounded)
Direct cost per IV solutions RVU = IV solutions ÷ Total IV solutions RVUs = $150,000 ÷ 149,000 =$1.01 (rounded)
Direct cost per selected medical/surgical supplies RVU = Selected medical/surgical supplies ÷ Total selected medical/surgical supplies RVUs = $194,000 ÷ 194,000 = $1.00
Direct cost per other expenditures RVU = Net direct costs ÷ Other expenditures RVUs = $3,156,000 ÷ 2,379,700 = $1.33 (rounded)
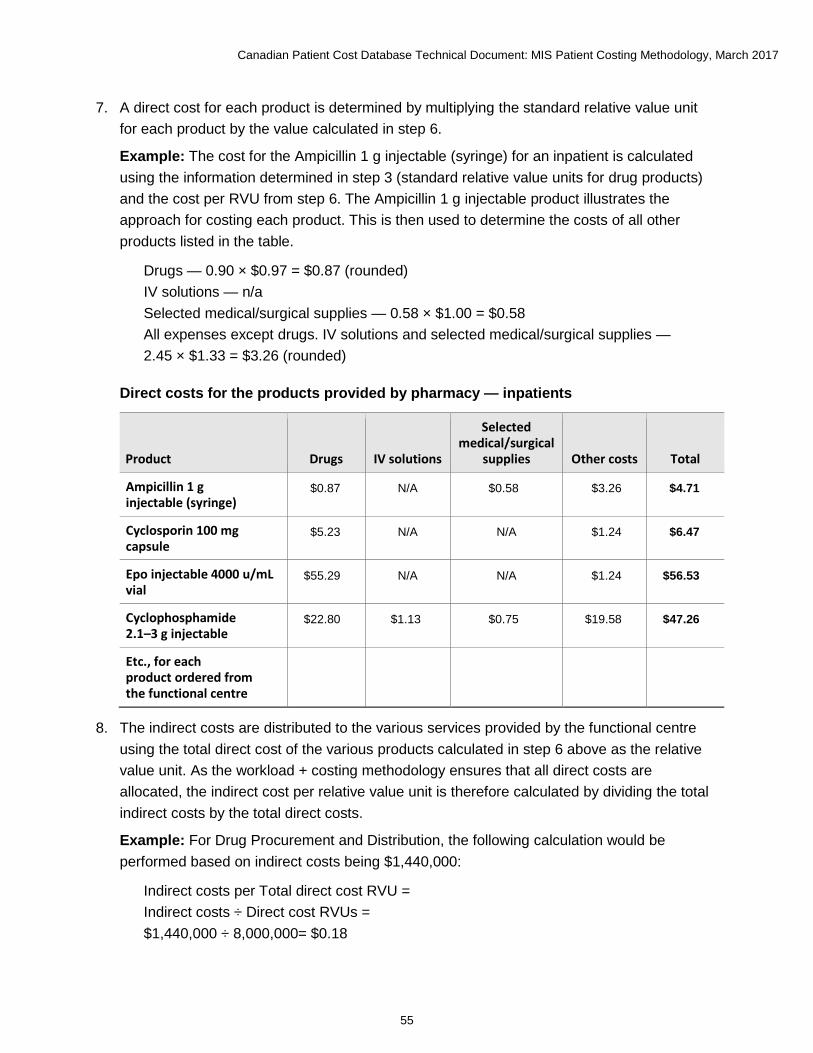
Canadian Patient Cost Database Technical Document: MIS Patient Costing Methodology, March 2017
55
7. A direct cost for each product is determined by multiplying the standard relative value unit for each product by the value calculated in step 6.
Example: The cost for the Ampicillin 1 g injectable (syringe) for an inpatient is calculated using the information determined in step 3 (standard relative value units for drug products) and the cost per RVU from step 6. The Ampicillin 1 g injectable product illustrates the approach for costing each product. This is then used to determine the costs of all other products listed in the table.
Drugs — 0.90 × $0.97 = $0.87 (rounded) IV solutions — n/a Selected medical/surgical supplies — 0.58 × $1.00 = $0.58 All expenses except drugs. IV solutions and selected medical/surgical supplies — 2.45 × $1.33 = $3.26 (rounded)
Direct costs for the products provided by pharmacy — inpatients
Product Drugs IV solutions
Selected medical/surgical
supplies Other costs Total
Ampicillin 1 g injectable (syringe)
$0.87 N/A $0.58 $3.26 $4.71
Cyclosporin 100 mg capsule
$5.23 N/A N/A $1.24 $6.47
Epo injectable 4000 u/mL vial
$55.29 N/A N/A $1.24 $56.53
Cyclophosphamide 2.1–3 g injectable
$22.80 $1.13 $0.75 $19.58 $47.26
Etc., for each product ordered from the functional centre
Etc., for each product ordered from the functional centre
Etc., for each product ordered from the functional centre
Etc., for each product ordered from the functional centre
Etc., for each product ordered from the functional centre
Etc., for each product ordered from the functional centre
8. The indirect costs are distributed to the various services provided by the functional centre using the total direct cost of the various products calculated in step 6 above as the relative value unit. As the workload + costing methodology ensures that all direct costs are allocated, the indirect cost per relative value unit is therefore calculated by dividing the total indirect costs by the total direct costs.
Example: For Drug Procurement and Distribution, the following calculation would be performed based on indirect costs being $1,440,000:
Indirect costs per Total direct cost RVU = Indirect costs ÷ Direct cost RVUs = $1,440,000 ÷ 8,000,000= $0.18
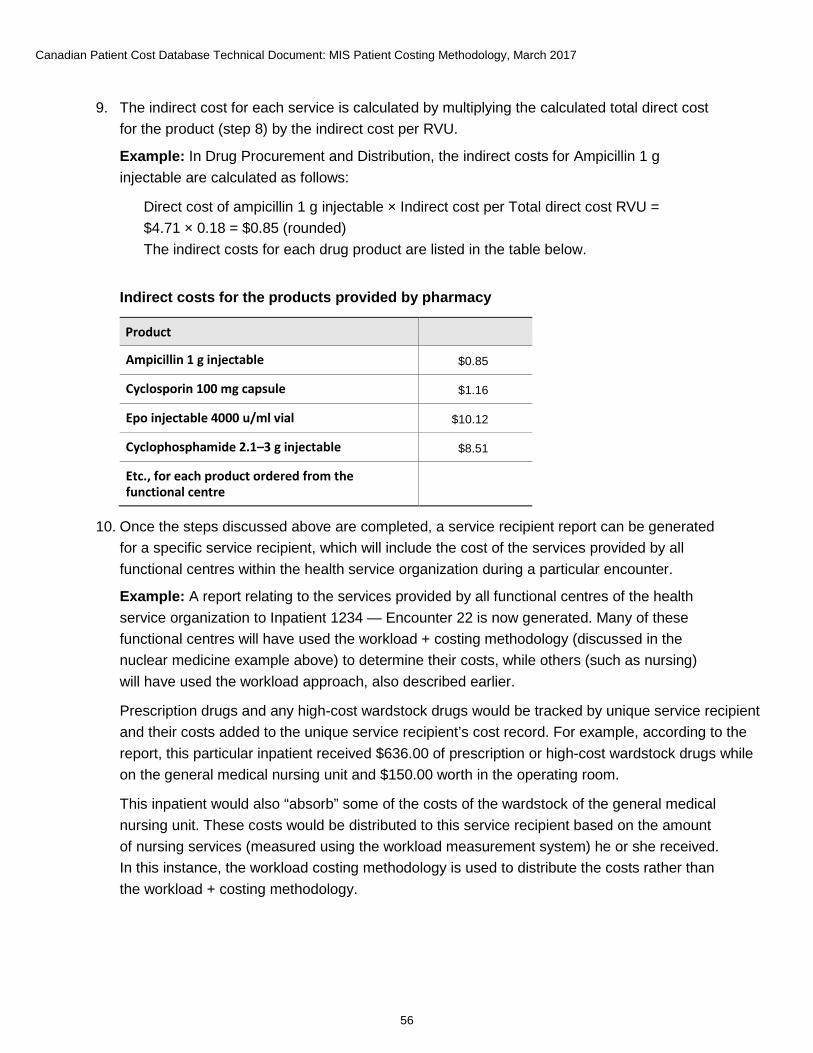
Canadian Patient Cost Database Technical Document: MIS Patient Costing Methodology, March 2017
56
9. The indirect cost for each service is calculated by multiplying the calculated total direct cost for the product (step 8) by the indirect cost per RVU.
Example: In Drug Procurement and Distribution, the indirect costs for Ampicillin 1 g injectable are calculated as follows:
Direct cost of ampicillin 1 g injectable × Indirect cost per Total direct cost RVU = $4.71 × 0.18 = $0.85 (rounded) The indirect costs for each drug product are listed in the table below.
Indirect costs for the products provided by pharmacy
Product Product
Ampicillin 1 g injectable $0.85
Cyclosporin 100 mg capsule $1.16
Epo injectable 4000 u/ml vial $10.12
Cyclophosphamide 2.1–3 g injectable $8.51
Etc., for each product ordered from the functional centre
Etc., etc. for each product ordered from the functional centre
10. Once the steps discussed above are completed, a service recipient report can be generated for a specific service recipient, which will include the cost of the services provided by all functional centres within the health service organization during a particular encounter.
Example: A report relating to the services provided by all functional centres of the health service organization to Inpatient 1234 — Encounter 22 is now generated. Many of these functional centres will have used the workload + costing methodology (discussed in the nuclear medicine example above) to determine their costs, while others (such as nursing) will have used the workload approach, also described earlier.
Prescription drugs and any high-cost wardstock drugs would be tracked by unique service recipient and their costs added to the unique service recipient’s cost record. For example, according to the report, this particular inpatient received $636.00 of prescription or high-cost wardstock drugs while on the general medical nursing unit and $150.00 worth in the operating room.
This inpatient would also “absorb” some of the costs of the wardstock of the general medical nursing unit. These costs would be distributed to this service recipient based on the amount of nursing services (measured using the workload measurement system) he or she received. In this instance, the workload costing methodology is used to distribute the costs rather than the workload + costing methodology.
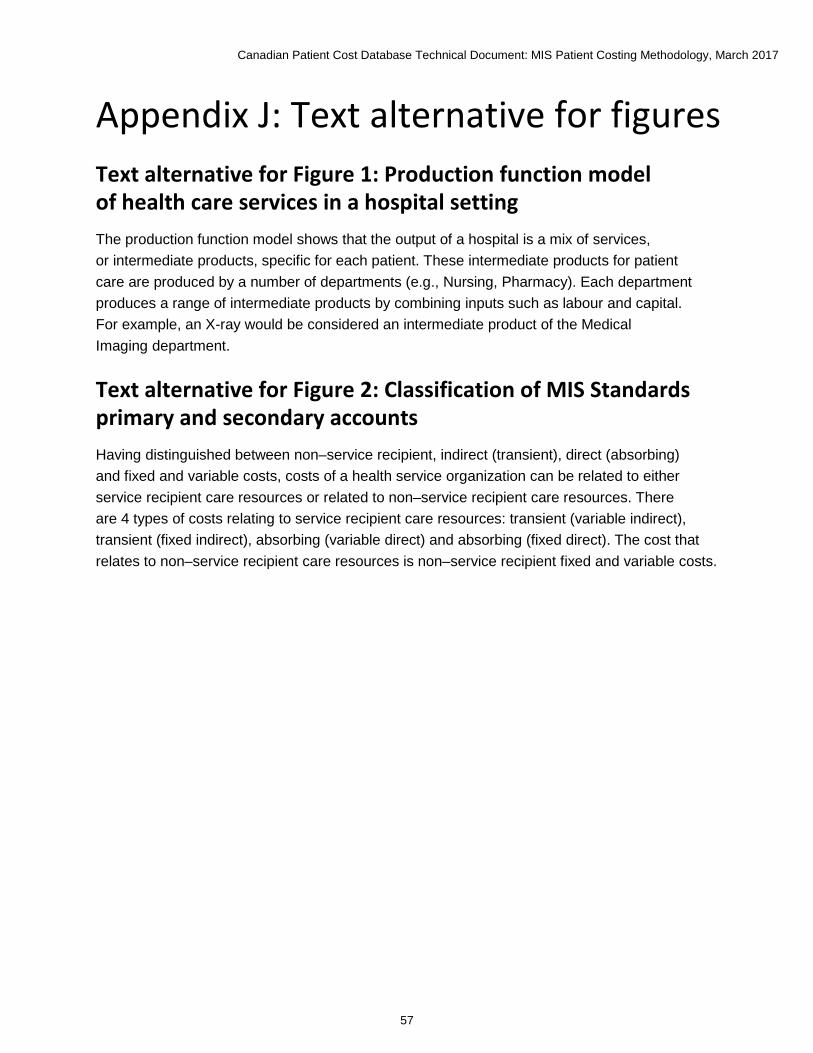
Canadian Patient Cost Database Technical Document: MIS Patient Costing Methodology, March 2017
57
Appendix J: Text alternative for figures Text alternative for Figure 1: Production function model of health care services in a hospital setting The production function model shows that the output of a hospital is a mix of services, or intermediate products, specific for each patient. These intermediate products for patient care are produced by a number of departments (e.g., Nursing, Pharmacy). Each department produces a range of intermediate products by combining inputs such as labour and capital. For example, an X-ray would be considered an intermediate product of the Medical Imaging department.
Text alternative for Figure 2: Classification of MIS Standards primary and secondary accounts Having distinguished between non–service recipient, indirect (transient), direct (absorbing) and fixed and variable costs, costs of a health service organization can be related to either service recipient care resources or related to non–service recipient care resources. There are 4 types of costs relating to service recipient care resources: transient (variable indirect), transient (fixed indirect), absorbing (variable direct) and absorbing (fixed direct). The cost that relates to non–service recipient care resources is non–service recipient fixed and variable costs.

[email protected] Ottawa495 Richmond Road
Suite 600
Ottawa, Ont.
K2A 4H6
613-241-7860
CIHI Toronto 4110 Yonge Street
Suite 300
Toronto, Ont.
M2P 2B7
416-481-2002
CIHI Victoria 880 Douglas Street
Suite 600
Victoria, B.C.
V8W 2B7
250-220-4100
CIHI Montréal 1010 Sherbrooke Street West
Suite 602
Montréal, Que.
H3A 2R7
514-842-2226
cihi.ca13716-0117


