Canadian Science Advisory Secretariat (CSAS) Proceedings Series 2015/039 National Capital Region December 2015 Proceedings of the national peer review of the Fluidigm® BioMark™ platform: Evaluation to assess fitness for purpose in microbial monitoring December 2 – 4, 2014 Nanaimo, British Columbia Chairpersons: Gilles Olivier and Roger Wysocki Editor: Ivan Stefanov Fisheries and Oceans Canada Strategic and Regulatory Science 200 Kent Street Ottawa, ON K1A 0E6
Transcript
Canadian Science Advisory Secretariat (CSAS)
Proceedings Series 2015/039 National Capital Region
December 2015
Proceedings of the national peer review of the Fluidigm® BioMark™ platform: Evaluation to assess fitness for purpose in microbial monitoring
December 2 – 4, 2014 Nanaimo, British Columbia
Chairpersons: Gilles Olivier and Roger Wysocki Editor: Ivan Stefanov
Fisheries and Oceans Canada Strategic and Regulatory Science 200 Kent Street Ottawa, ON K1A 0E6
Foreword The purpose of these Proceedings is to document the activities and key discussions of the meeting. The Proceedings may include research recommendations, uncertainties, and the rationale for decisions made during the meeting. Proceedings may also document when data, analyses or interpretations were reviewed and rejected on scientific grounds, including the reason(s) for rejection. As such, interpretations and opinions presented in this report individually may be factually incorrect or misleading, but are included to record as faithfully as possible what was considered at the meeting. No statements are to be taken as reflecting the conclusions of the meeting unless they are clearly identified as such. Moreover, further review may result in a change of conclusions where additional information was identified as relevant to the topics being considered, but not available in the timeframe of the meeting. In the rare case when there are formal dissenting views, these are also archived as Annexes to the Proceedings.
Published by: Fisheries and Oceans Canada
Canadian Science Advisory Secretariat 200 Kent Street
Correct citation for this publication: DFO. 2015. Proceedings of the national peer review of the Fluidigm® BioMark™ platform:
Evaluation to assess fitness for purpose in microbial monitoring; December 2-4, 2014. DFO Can. Sci. Advis. Sec. Proceed. Ser. 2015/039.
Aussi disponible en français : MPO. 2015. Compte rendu de l'examen national par les pairs de la plateforme BioMarkMC de
Fluidigm® : évaluation visant à déterminer son adéquation pour la surveillance microbienne, du 2 au 4 décembre 2014. Secr. can. de consult. sci. du MPO, Compte rendu 2015/039.
TABLE OF CONTENTS SUMMARY ................................................................................................................................. v
SOMMAIRE ............................................................................................................................... vi
WELCOME, OPENING REMARKS, AND CONTEXT ................................................................ 2 Introductory Presentation 1: Overview of the CSAS Advisory Process ................................... 2
PRESENTATIONS AND DISCUSSIONS (DAY 1) ..................................................................... 2 Presentation 1 - 1: Overview of the Project ............................................................................ 2 Presentation 1 - 2: The Project in a World Organisation for Animal Health (OIE) Context ...... 2 Presentation 1 - 3: Limit of Detection (LOD) ........................................................................... 3 Presentation 1 - 4: Outline of the Statistical Analyses of the Assay Assessment Experiments and Statistical Analysis of Analytical Sensitivity ...................................................................... 5 Presentation 1 - 5: Analytical Specificity ................................................................................. 6 Presentation 1 - 6: Analytical Specificity - Parasites ............................................................... 8 Presentation 1 - 7: Statistical Analysis of Analytical Specificity and Summary of Analytical Specificity ............................................................................................................................... 8 Presentation 1 - 8: Repeatability - Overview ........................................................................... 9 Presentation 1 - 9: Statistical Analysis of Repeatability .........................................................11 Wrap-up and Adjournment for Day 1 .....................................................................................12
PRESENTATIONS AND DISCUSSIONS (DAY 2) ....................................................................12 Welcome and Recapitulation of the Results from Day 1 ........................................................12 Presentation 2 – 1: Comparability .........................................................................................12 Presentation 2 – 2: Statistical Analysis of Comparability .......................................................13 Presentation 2 – 3: Specific Target Amplification (STA) and evaluation of the STA on Analytical Sensitivity ..............................................................................................................14 Presentation 2 – 4: Statistical Analysis of the Effects of STA on the Analytical Sensitivity, Specificity, and Repeatability of the Microbe Assays .............................................................15 Presentation 2 – 5: Strengths and Weaknesses of the BioMark™ Platform for Microbe Monitoring Research .............................................................................................................16 Wrap-up and Adjournment for Day 2 .....................................................................................18
PRESENTATIONS AND DISCUSSIONS (DAY 3) ....................................................................18 Welcome and Recapitulation of the Results from Days 1 and 2 ............................................18 Presentation 3 – 1: The Principle of Consensus in the CSAS Peer Review Process .............18 General Discussion and Finalization .....................................................................................18 Conclusion and Adjournment ................................................................................................20
APPENDICES ...........................................................................................................................21 Appendix 1: List of Participants .............................................................................................21 Appendix 2: Terms of Reference ...........................................................................................23
iv
TABLE OF FIGURES Figure 1: Determination of LOD that would be detected with 95% of the replicates ....................... 4
Figure 2: General schematics of the statistical analyses performed in support of Phase 2a of the Project. .......................................................................................................................... 5
Figure 3: Overview of the experimental framework for the determination of analytical specificity. . 7
Figure 4: Schematic representation of the three parts of the repeatability study. ......................... 10
Figure 5: Schematics of the comparability study design. ............................................................. 13
Figure 6: Schematics of the study design to evaluate the effect of STA on analytical sensitivity. 15
v
SUMMARY A national peer review process under the auspices of Fisheries and Oceans Canada’s (DFO) Canadian Science Advisory Secretariat (CSAS) was held in Nanaimo, British Columbia on December 2 -4, 2014. The objective of the process was to provide scientific advice about the suitability of assays based on the Fluidigm® BioMark™ platform, which uses pre-amplification, for large scale research monitoring for microbes in wild Pacific and farmed Atlantic salmon.
Specifically the review assessed:
• The analytical sensitivity, specificity, comparability and repeatability of each microbe assay, as determined in the draft Research Document and presented at the meeting.
• To what level the assay results are comparable across the Fluidigm® BioMark™ and ABI 7900 platforms (as used at the Molecular Genetics Laboratory at the Pacific Biological Station).
• The effect of the pre-amplification step of multiple independent target species on the analytical sensitivity, specificity, and repeatability of the assays. Specifically:
o Whether the pre-amplification step introduces biases in the relative abundance of targets, and
o Whether it generates spurious (false) targets.
• The benefits, limitations, uncertainties and proposed uses of this methodology (including the design and the statistical analyses) for the identified research purposes.
Participants at this meeting included Canadian and international subject matter experts from academia, the aquaculture industry, and government science, including DFO and the Canadian Food Inspection Agency (CFIA). Publications resulting from this process include a Science Advisory Report (SAR), a Research Document and these proceedings.
NB: This Proceedings document captures at a high-level the discussions which transpired during this science advisory process. For more detailed and precise information, the reader is advised to consult the published SAR which formally conveys the advice provided from this process, including all formal recommendations. In respect of the various scientific techniques and assessment methodologies, the reader is encouraged to consult the associated Research Document, which supports the SAR.
vi
SOMMAIRE Un processus d’examen national par les pairs s'est tenu sous l'égide du Secrétariat canadien de consultation scientifique (SCCS) de Pêches et Océans Canada (MPO) à Nanaimo, en Colombie-Britannique, du 2 au 4 décembre 2014. L'objectif du processus consistait à fournir un avis scientifique sur l'adéquation des essais effectués à partir de la plateforme BioMarkMC de Fluidigm®. Celle-ci utilise la préamplification aux fins de recherches à grande échelle visant la surveillance des microbes chez les saumons du Pacifique sauvages et chez les saumons de l'Atlantique d'élevage.
L'examen a plus particulièrement porté sur les éléments suivants :
• la sensibilité, la spécificité, la comparabilité et la répétabilité analytiques de chaque essai microbien, tel que cela a été établi dans le document de travail et présenté à la réunion;
• la mesure dans laquelle les résultats des essais de la plateforme BioMarkMC de Fluidigm® sont comparables à ceux de la plateforme ABI 7900 (comme elle est utilisée au laboratoire de génétique moléculaire de la station biologique du Pacifique);
• les effets de l'étape de préamplification menée pour de nombreuses espèces cibles indépendantes sur la sensibilité, la spécificité et la répétabilité analytiques des essais. Plus précisément :
o déterminer si l'étape de préamplification introduit des biais dans l'abondance relative des cibles;
o déterminer si l'étape de préamplification génère des cibles fausses;
• les avantages, restrictions, incertitudes et utilisations proposées de cette méthodologie (ce qui comprend les concepts et les analyses statistiques) pour les besoins de recherche définis.
Parmi les participants à cette réunion se trouvaient des experts en la matière canadiens et étrangers provenant du milieu universitaire, de l'industrie de l'aquaculture et du secteur scientifique fédéral, notamment le MPO et l'Agence canadienne d'inspection des aliments (ACIA). Un avis scientifique, un document de recherche et le présent compte rendu ont découlé de ce processus.
N.B. : Le présent compte rendu présente les grandes lignes des discussions qui se sont tenues au cours de ce processus de consultation scientifique. Le lecteur qui souhaite obtenir des renseignements plus détaillés et précis est invité à consulter l'avis scientifique publié qui présente formellement les avis formulés au cours de ce processus, y compris toutes les recommandations officielles. En ce qui concerne les diverses techniques scientifiques et méthodologies d'évaluation, le lecteur est invité à consulter le document de recherche connexe à l'appui de l'avis scientifique.
1
INTRODUCTION Fisheries and Oceans Canada (DFO) is collaborating with the Pacific Salmon Foundation and Genome B.C. on a five year, multi-phase project (hereafter the Project) that will combine genomics and fish health technologies to determine what microbes are carried by wild and cultured British Columbia salmon species, where the microbes may have originated and how they may impact the health of salmon.
The stated strategic goal of the Project is “to discover the microbes and potential diseases that may undermine the productivity and performance of British Columbia (wild) salmon and to determine what exchanges may happen between wild and cultured salmon in the evolution of these microbes”. The Project will proceed through four sequential Phases (stages).
Phase 1 (2012 - 2013) establishes a large-scale sampling program, running over twelve months, for wild, hatchery and aquaculture salmon. The sampling was conducted in 2012 and early 2013.
Phase 2 (2013 - 2015) will develop, test, and evaluate a novel genomic technology to determine which microbes associated with disease in salmon worldwide are carried by wild and cultured salmon in British Columbia.
Phase 3 (2014 - 2016) will focus on the microbes identified in Phase 2, with an emphasis on microbes that have not been extensively researched in B.C. and that carry the highest potential for disease in wild salmon. Laboratory challenge studies will be carried out to assess under what conditions specific microbes might be associated with disease in Pacific salmon. Additional studies assessing transmission dynamics of specific microbes will also take place.
Phase 4 (2016 - 2017) will include reporting of research and presentations to management agencies on the potential utility of methods developed and the application of outcomes to future monitoring.
Currently the Study is in Phase 2a, the stated major objective of which is to develop, test, and evaluate the sensitivity, specificity and repeatability of assays using a high throughput micro-fluidics platform (Fluidigm® BioMark™) designed to simultaneously and quantitatively assess the presence and load of microbes in multiple samples. This technology utilizes a pre-amplification step whose effects have yet to be assessed.
The Terms of Reference (TOR) for the science review were developed in response to a request for advice from DFO Science Pacific with the aim to evaluate the analytical performance of the assays developed for the high throughput micro-fluidic platform and inform the decision whether to move to Phase 2b of the study.
The agenda of the meeting reflected the goals of the peer review process as outlined in the TOR.
Participants at the science review meeting were selected as contributors of knowledge and perspective, and as objective, impartial, and professional individuals, collectively capable of providing high quality, defensible, and impartial science advice to the decision makers.
A Working Paper (draft Research Document) supplemented with supporting materials was prepared and made available to the reviewers and meeting participants prior to the meeting.
2
WELCOME, OPENING REMARKS, AND CONTEXT The Chairs of the meeting, Gilles Olivier and Roger Wysocki, welcomed all participants and thanked them for coming to this peer review meeting. Participants introduced themselves (the list of participants can be found in Appendix 1).
INTRODUCTORY PRESENTATION 1: OVERVIEW OF THE CSAS ADVISORY PROCESS Presented by Gilles Olivier
The presentation explained the practices and principles of the CSAS peer review process, and the procedures which would be followed to produce science advice during the course of this advisory process.
Discussion Questions were asked regarding the timing of publishing of the meeting documents, and the principle of consensus. The presenter answered the questions.
The TORs were reviewed and discussed, and consequently endorsed by all participants. The text of the TORs can be found in Appendix 2 and on the CSAS web page.
In addition to that, the purpose, structure, and content of the Scientific Advice Report (SAR) were explained to the participants.
PRESENTATIONS AND DISCUSSIONS (DAY 1)
PRESENTATION 1 - 1: OVERVIEW OF THE PROJECT Presented by Dr. Kristi Miller
The presenter explained the challenges that diseases to wild fish population pose to research, described the Strategic Salmon Health Initiative (SSHI), outlined the research plan for the Project, described the Fluidigm® BioMark™ platform, and outlined the studies undertaken to date to evaluate the assay and platform performance.
Discussion Significant discussion ensued regarding the general scientific approach, the sequencing of the stages of the Project, the selection of microbes to be monitored and the details of next steps of the Project.
After deliberation, it was agreed that the discussions should be limited to the issues as formulated in the TORs for this peer review process.
It was also recognized that many of the questions would be answered as the peer review process unfolded in the following days.
PRESENTATION 1 - 2: THE PROJECT IN A WORLD ORGANISATION FOR ANIMAL HEALTH (OIE) CONTEXT Presented by Dr. Ian Gardner
The presenter explained that the authors decided to evaluate the performance of the assays by following the OIE assay validation pathway, as outlined in Chapter 1.1.2 (Principles and Methods for Validation of Diagnostic Assays for Infectious Diseases) of the OIE Manual of
Diagnostic Tests for Aquatic Animals 2014 (OIE Aquatic Manual). The main driver was the fact that four microbes are listed by the World Organization for Animal Health (Organisation Internationale des Epizooties – OIE) as disease agents (viral hemorrhagic septicemia virus - VHSV, infectious salmon anemia virus - ISAV, infectious hematopoietic necrosis virus - IHNV, and salmon alphavirus).
The presenter explained that fitness-for-purpose is an overarching consideration when tests for OIE-listed diseases are validated. The purposes listed in the OIE Manual are:
1) to demonstrate population “freedom’ from infection (zero prevalence);
2) to demonstrate freedom from infection or agent in individual animals or products for trade purposes;
3) to eradicate infection;
4) to confirm a diagnosis of clinical cases;
5) to estimate prevalence of infection to facilitate risk analysis; and
6) to determine immune status in individual animals or populations.
In that context research purposes are not specifically mentioned in the OIE Aquatic Manual.
However, the authors deemed reasonable that, as a minimum, the analytical characteristics of the assays should be evaluated.
The presenter noted that to date there are no agreed-upon minimum criteria to assess analytical performance characteristics (neither by the OIE, nor by consensus in the broader expert community) and that OIE has not explicitly provided guidelines for validation of multiplex assays or new technologies such as the Fluidigm® BioMark™ platform.
The presenter also emphasized that based on prior experience, if the analytic evaluation was not rigorous, diagnostic performance may be inferior for a designated purpose, and that good analytical performance does not necessarily guarantee good diagnostic performance.
Another point that was accentuated in the presentation was that for many aquatic animal diseases, such tests are not adequately validated and that the situation is worse for shellfish and molluscs tests compared to tests for finfish species.
Discussion The participants discussed the OIE process, especially the validation pathway, factors impacting test selection in general, justification of the need for test validation, reporting guidelines for quantitative polymerase chain reaction (qPCR) studies, and provision of evidence that there are few tests in aquatic animal species which have been validated past Stage -1 of the OIE pathway.
However, it was agreed that the intended purpose of the Project is academic research, and that the fitness for purpose should be evaluated in relation to this research context, and not for diagnostic purposes.
PRESENTATION 1 - 3: LIMIT OF DETECTION (LOD) Presented by Shaorong Li
The presenter used an example to explain the concepts of Limit of Detection (LOD) and the Artificial Positive Controls (APC), which were used as sample substitutes to run the LOD experiments. The presenter also used diagrams to demonstrate the experimental design:
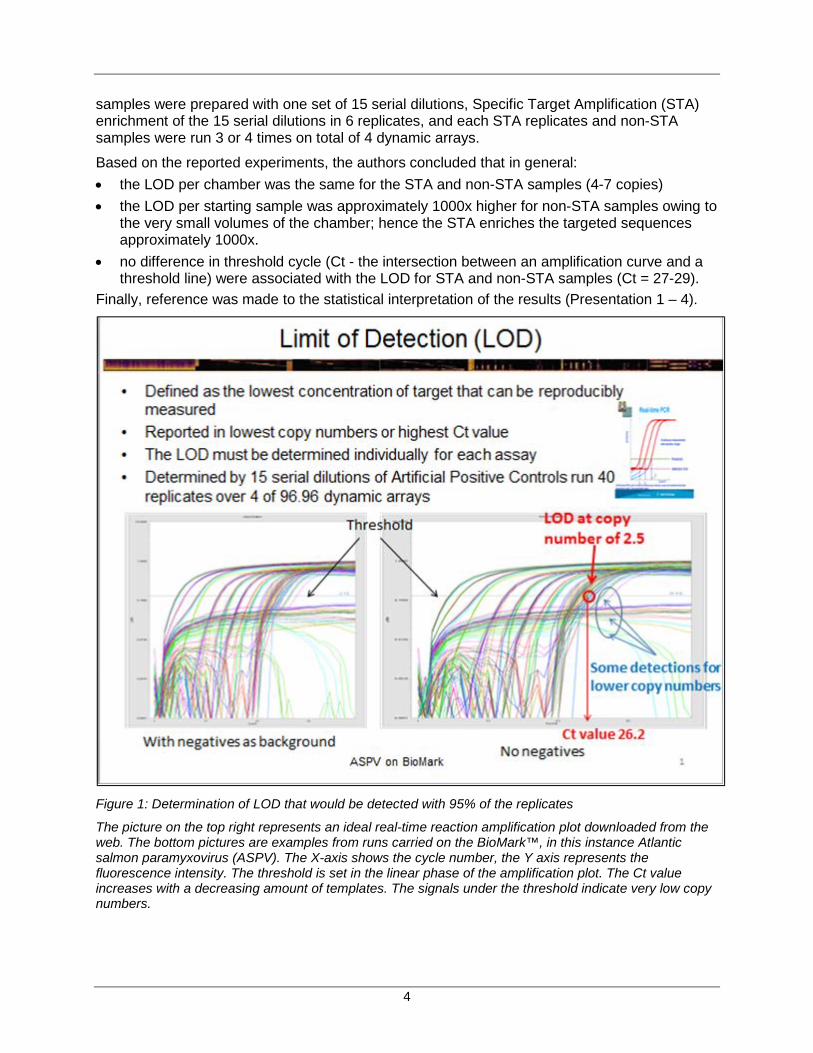
samples were prepared with one set of 15 serial dilutions, Specific Target Amplification (STA) enrichment of the 15 serial dilutions in 6 replicates, and each STA replicates and non-STA samples were run 3 or 4 times on total of 4 dynamic arrays.
Based on the reported experiments, the authors concluded that in general: • the LOD per chamber was the same for the STA and non-STA samples (4-7 copies) • the LOD per starting sample was approximately 1000x higher for non-STA samples owing to
the very small volumes of the chamber; hence the STA enriches the targeted sequences approximately 1000x.
• no difference in threshold cycle (Ct - the intersection between an amplification curve and a threshold line) were associated with the LOD for STA and non-STA samples (Ct = 27-29).
Finally, reference was made to the statistical interpretation of the results (Presentation 1 – 4).
Figure 1: Determination of LOD that would be detected with 95% of the replicates
The picture on the top right represents an ideal real-time reaction amplification plot downloaded from the web. The bottom pictures are examples from runs carried on the BioMark™, in this instance Atlantic salmon paramyxovirus (ASPV). The X-axis shows the cycle number, the Y axis represents the fluorescence intensity. The threshold is set in the linear phase of the amplification plot. The Ct value increases with a decreasing amount of templates. The signals under the threshold indicate very low copy numbers.
5
Discussion The discussions revolved around concerns that the single serial dilution procedure that was used to establish the limit of detection might have introduced a large variation and may have caused a shift in the LOD. A concern was raised that if the work on LOD and analytical sensitivity introduces avoidable variations and uncertainties, it is likely that there will be implications on the subsequent experimental work. Other technical topics discussed include the selection of threshold, storage of the samples, and the use of the assays for LOD and linearity.
PRESENTATION 1 - 4: OUTLINE OF THE STATISTICAL ANALYSES OF THE ASSAY ASSESSMENT EXPERIMENTS AND STATISTICAL ANALYSIS OF ANALYTICAL SENSITIVITY Presented by Dr. Raphael Vanderstichel
The presentation explained the overall framework and design of the statistical analyses employed throughout the Project (Figure 2) as well as the statistical methods of evaluating the analytical sensitivity of the assays and the results that were obtained.
Figure 2: General schematics of the statistical analyses performed in support of Phase 2a of the Project.
Following the introduction, the presenter described the analytical methods used to determine the limit of detection for the 46 assays on the BioMark™ platform. A schematic was used to show how the samples and controls were serially diluted and applied to the assays.
6
As well, the various methods used to calculate the estimates (such as linear range, efficiencies, correlation coefficient (R2), and 95% probability of detection (Pr (Detection)) to describe the LOD were explained graphically and with equations.
It was reported that in general the linear dynamic range of all assays was between 101 to 106 (with most assays being 107), which was deemed to be the typical range for most qPCR platforms.
Thirty eight (38) of 47 assays had efficiencies between 0.9 and 1, and the authors decided that in general, these results suggest that the assays were performing well.
The 95% Pr(Detection) were estimated to range between Cts of 23.3 to 30.7 (average = 26.4 across all assays), which was calculated to represent starting copy numbers between 1 and 31 (average 4.3 across all assays).
Based on these results, the authors concluded that the BioMark™ platform displayed equivalent or higher analytical sensitivities to traditional single assay platforms.
Discussion Questions from reviewers and participants included; whether the results for analytical sensitivity were comparable across the assays; that the use of one single dilution and analysing it 47 times is not the best method from a statistical point of view; and that the resultant variability needs to be factored in.
The following recommendations were made:
• that in the Research Document objective, neutral, and quantitative terms should be used when describing the results of experiments.
• that the text of the Research Document and the Scientific Advice Report reflect the fact that only one Fluidigm® BioMark™ device was used for the evaluation, meaning that it was not the “platform” that was evaluated, but rather just this particular instrument.
• that the authors work with the Fluidigm company and other laboratories to cross-evaluate the performance of the assays.
PRESENTATION 1 - 5: ANALYTICAL SPECIFICITY Presented by Angela Schulze
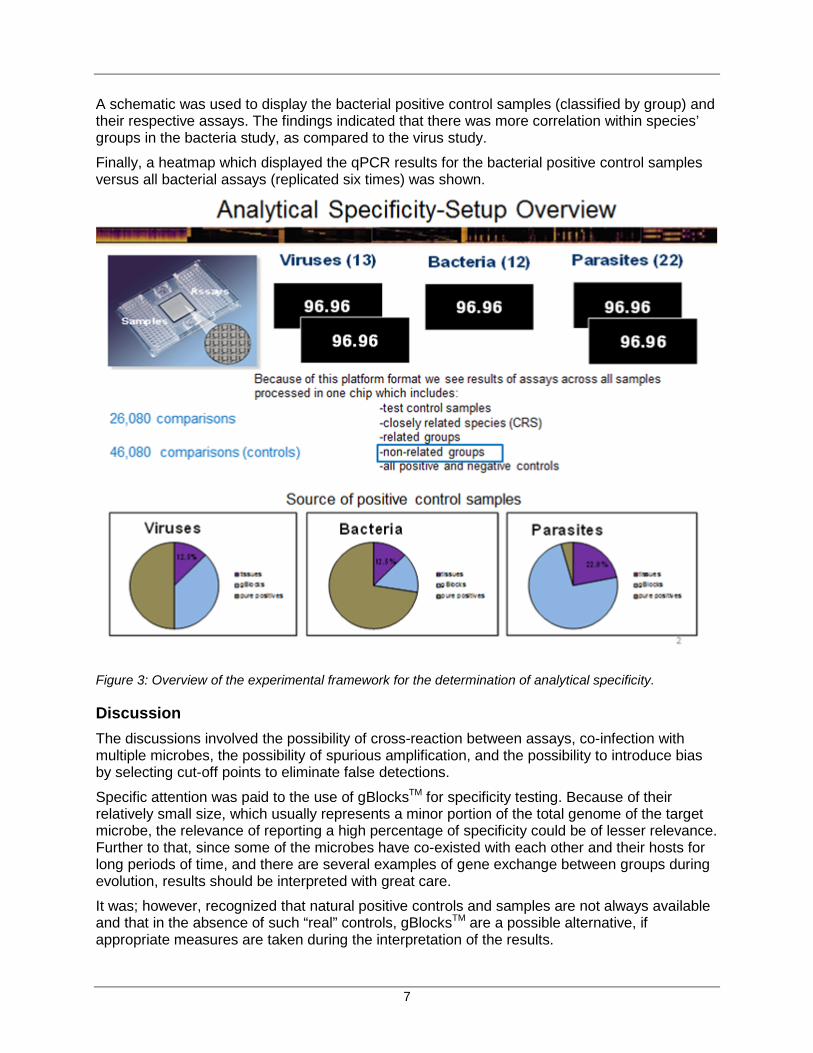
This presentation gave an overview of: the concepts defining analytical specificity (ASp), the objectives in carrying out the analyses, and the potential reasons for false detections. The various microbes tested (bacteria, viruses and parasites), the number of BioMark™ chips utilized and the total number of qPCR comparisons with and without controls were also demonstrated (Figure 3).
The positive control samples utilized, as well as the proportions of those that came from tissues, pure samples, or synthetic gBlocksTM (1,000 base pair synthetic DNA constructs produced for ASp analysis for strains or species for which “real” controls in the form of tissue samples, cell lines, or bacterial cultures were unavailable) were shown. The fact that tissues have the potential to carry co-infections, and comprised twice as many positive control samples representing the parasites than those representing the bacteria or viruses was also highlighted.
A schematic was used to display the viral positive control samples (classified by genogroup) and their respective assays. A heatmap (graphical representation of data using a colour matrix) which displayed the qPCR results for the viral positive control samples versus all viral assays (replicated 6x’s) was also shown.
7
A schematic was used to display the bacterial positive control samples (classified by group) and their respective assays. The findings indicated that there was more correlation within species’ groups in the bacteria study, as compared to the virus study.
Finally, a heatmap which displayed the qPCR results for the bacterial positive control samples versus all bacterial assays (replicated six times) was shown.
Figure 3: Overview of the experimental framework for the determination of analytical specificity.
Discussion The discussions involved the possibility of cross-reaction between assays, co-infection with multiple microbes, the possibility of spurious amplification, and the possibility to introduce bias by selecting cut-off points to eliminate false detections.
Specific attention was paid to the use of gBlocksTM for specificity testing. Because of their relatively small size, which usually represents a minor portion of the total genome of the target microbe, the relevance of reporting a high percentage of specificity could be of lesser relevance. Further to that, since some of the microbes have co-existed with each other and their hosts for long periods of time, and there are several examples of gene exchange between groups during evolution, results should be interpreted with great care.
It was; however, recognized that natural positive controls and samples are not always available and that in the absence of such “real” controls, gBlocksTM are a possible alternative, if appropriate measures are taken during the interpretation of the results.
8
PRESENTATION 1 - 6: ANALYTICAL SPECIFICITY - PARASITES Presented by Shaorong Li
The presentation explained the challenges encountered designing the experiment for analytical specificity (Asp) for parasites. Parasites are classified in broad ranges of taxa, have fewer data sequences available, and contain more closely-related species. It is to not only difficult to design/develop such assays, but also to obtain pure positive samples. Consequently, the authors needed to synthesize a large number of gBlocksTM and use numerous tissue samples as positive controls. As such, these introduced some uncertainties for the analyses.
The gBlocksTM comprise usually only a small portion of the genomes of parasite species, and therefore potential cross-amplification sites of other parts of the genome could be missed. Tissue samples have the potential of co-infections which may interfere with the interpretation of analytical specificity results.
Discussion As with the previous presentation, discussions were related to cross-contamination, the detection and prevalence of co-infection in the samples, the specificity of gBlocksTM, and the variability of the gene used as internal control for RNA quality (“housekeeping gene”).
It was debated that conclusions from the analytical specificity data may be problematic for some assays in which few close relatives were tested per target because the draft research document did not discuss challenges associated with detecting targets using a relatively slowly-evolving marker in a context of poorly characterized diversity.
A more traditional approach may involve an initial meta-genomic discovery phase to determine what microbes of interest are found in Pacific salmon and simultaneously characterize the background microbial communities against which these targets of interest would need to be detected.
It was argued; however, that this approach would be cost prohibitive unless applied in a targeted manner (i.e. in diseased fish). Instead, this analysis focused on microbes already described in salmon and suspected or known to cause disease.
PRESENTATION 1 - 7: STATISTICAL ANALYSIS OF ANALYTICAL SPECIFICITY AND SUMMARY OF ANALYTICAL SPECIFICITY Presented by Dr. Raphael Vanderstichel and Dr. Kristi Miller
The methods used for data analyses were described in detail. In brief, inclusivity (sensitivity) and exclusivity (specificity) estimates were determined for each assay, based on the Pass/Fail status ascribed to intended target microbes. 2x2 tables were used to describe how these estimates were derived.
The presenter reported that in general, the tissue samples presented the largest number of false detections, while false detections were very rare for viral assays. Most assays had 100% sensitivity, and specificity was 100% for all but three bacterial, two viral, and eight parasite assays.
Discussion Discussions revolved mostly around; the determination of the cut-off points, the compromises to be made between sensitivity and specificity, the possible techniques to confirm suspected
9
microbe detection – sequencing, histology, biological history of the samples, and the need to look at the different Ct values of different pathogens.
A recommendation was made to use OIE-validated primers whenever possible. This approach would be safer from the point of view of international context.
Another recommendation was to sequence all samples where targeted microbe nucleic acids were detected in order to differentiate between cross-reaction and co-infection. It was also commented that next generation sequencing could provide more information and contribute to the design of new, more specific assays.
A comment was made that in recent years, science has become increasingly driven by the collection and analysis of “big data”, as opposed to the traditional hypothesis-driven approach. As such, some participants felt that the scientific community is presented with a conundrum of trying to reconcile the “big data” approach with traditional standards ensuring appropriate scientific scrutiny at all steps of experimental research.
Fifteen (15) of the 47 assays assessed on the BioMark™ platform were newly designed, while the remainder were obtained from the peer reviewed literature. There was some concern that all assays developed or adopted in this evaluation may not have undergone sufficient levels of scrutiny. It was understood that this would be unmanageable within the given timeframes used for this particular Project. It was emphasised that in this sort of situation it is very important to document all assumptions and the reasons for all decisions.
It was also proposed that an evolutionarily-based detection method should be designed and implemented within an evolutionary context. This context would preferably include an assessment of; (i) the best available phylogeny of the target and its interpretation for specificity, (ii) the evolutionary rates of the genetic marker and interpretation for sensitivity and specificity, (iii) and examine to what extent species diversity is well characterized and represented in databases.
Other participants felt that this information assisted assay design/selection and interpretation of results, and there was insufficient data presented to evaluate the completeness of these analyses. It was noted that an assessment of the evolutionary rates of the genetic marker (ii above) is currently not feasible for a most species, as evolutionary rates are not known, and may not be reliable across taxa and environmental conditions (e.g. evolutionary rates are known to increase for many pathogens in a cultured setting; hence cannot be inferred from cultured to wild organisms).
The presenter described the design of the repeatability study, and the results that were obtained.
In order to determine the repeatability of the microbe assays, the authors used two studies:A4-Repeatability, and A3-Limit of Detection. Since this was the first time the A4-Repeatability study was introduced to the audience, the presenter described the laboratory methods and, with a schematic flow chart, explaining how each sample and control were processed.
In order to specifically address the multiple factors that could affect repeatability, the study (A4-Repeatability) was further broken down into 3 parts, and a diagram summarized each part and highlighted their differences (Figure 4).
This study included the following components:
10
• RNA extraction variation (Part 1),
• Technical variation (Part 2),
• Scoring variation – between technicians and in different scoring events conducted by one technician (Part 3),
• Platform variation (All parts).
In order to assure proper “blind” scoring, the initial sample identification/set-up/preparation was performed by a person removed from all subsequent evaluation steps. The presenter invited interested participants to review the detailed results summarized in the draft Research Document.
Figure 4: Schematic representation of the three parts of the repeatability study.
Discussion The discussions identified the possibility of problems with the software algorithms that might cause potential difficulties with the repeatability of the scoring, the repeatability of RNA extraction, and the use of extra sample tissue for assessing repeatability.
The audience was informed that the authors are working collaboratively with the software company to improve the algorithm used by the machine.
11
PRESENTATION 1 - 9: STATISTICAL ANALYSIS OF REPEATABILITY Presented by Dr. Raphael Vanderstichel / summary by Dr. Kristi Miller
The presentation provided a detailed explanation of the statistical methods that were used in the repeatability study, and described how the research team determined the Repeatability (r), Reproducibility (R), Concordance Correlation Coefficients (CCCs), McNemar’s chi square test and Cohen’s Kappa, as well as the level of dichotomous disagreement - Pr(Disagreement) as derived from logistic regressions. The presenter also described how each of the estimated values for this section were interpreted.
The authors found that overall, average differences in repeated Cts were: less than 0.91 between two results and less than 2.96 between two arrays in Part 1; and less than 1.52 within an array and less than 2.95 between arrays in Part 2 of the repeatability study. The CCCs were >0.8 (almost perfect agreement) for 19 out of 24 assays in both parts 1 and 2 of the study.
The repeatability between scoring events and between technician scores were assessed in Part 3, and the authors found that the average differences in repeated Cts were less than 0.75 within technicians and less than 4.01 between technicians, 19 times out of 20. For all of the results in this study, the repeatability, reproducibility, and CCC improved when only high microbe concentrations (Ct>20) were included for analyses.
The authors used a portion of the data generated in the course of the limit of detection study (A3-LOD) to assess the repeatability of microbe assays within and between arrays. Since the methods had previously been explained, only the results were shared with the audience. In brief, the authors found that the average differences in repeated Cts were less than 1.25 within an array, and less than 2.82 between arrays 19 times out of 20. The repeatability estimates were improved if the analyses included only high microbe concentrations (Cts>20).
Discussion It was suggested that caution should be applied in interpreting the McNemar equations, because of the ease to obtain good repetition results with all positive or all negative samples, and that Kappa should be provided only when there are no significant differences.
A comment was made that deoxyribonucleic acid (DNA) and ribonucleic acid (RNA) can be susceptible to plastic absorption, and therefore measurement of the nucleic acid (NA) concentrations should be performed at the different steps. For the purpose of assessment of repeatability, different brands of tubes should be tested with and without DNA treatment, as well as undertaking measurements by different technicians.
The following was recommended to the authors:
• to identify within the Research Document how many positive samples were scored, • to document the protocol used for curve interpretation, and • to distribute the repeatability assessments over a period of time, to account for temporal
differences in human and environmental (temperature, moisture, atmospheric pressure, different batches of chemicals, etc.) factors.
It was suggested that the above could form part of the laboratory’s quality assurance (QA) program.
12
WRAP-UP AND ADJOURNMENT FOR DAY 1 Dr. Kristi Miller-Saunders presented a summary of the day’s presentations and findings. The Chairs thanked the participants for their work, and invited everyone to submit what they considered to be the most important points of the day.
The meeting was adjourned for the day.
PRESENTATIONS AND DISCUSSIONS (DAY 2)
WELCOME AND RECAPITULATION OF THE RESULTS FROM DAY 1 The Chairs of the meeting welcomed everyone and co-Chair Roger Wysocki presented a recapitulation of the work done the previous day.
Participants discussed certain issues that were related to the presentations of the previous day, but were not discussed sufficiently at the time, including; the temperature used during the PCR cycles, the relation with the optimum temperature for each individual assay, the optimal concentration of primers for the different assays, and the decision to use uniform probe concentration throughout the arrays.
A comment was made that because microfauna and myofauna are poorly characterized in the marine environment, caution should be exercised not to over-interpret the results.
It was suggested that because all repeatability assays were performed with one set of manufacturer’s lot of chemicals, assessments between lots and manufacturers should be performed to compare performance characteristics, as part of the QA program.
PRESENTATION 2 – 1: COMPARABILITY Presented by Amy Tabata
The presentation outlined the experiments comparing the performance of the microbe assays completed on the Fluidigm® BioMark™ and ABI 7900 platforms. To that end the researchers used the following methodology:
• Used the same samples/extraction/ Complementary DNA (cDNA, produced from messenger (m)RNA template using a reverse transcriptase enzyme) on both platforms
• Assessed 21 microbe assays using 80 samples from the repeatability study. o BioMark™ – Each assay run in duplicate o ABI7900 – Each sample/assay run in duplicate
• Compared Ct variance between the two platforms • Compared linearity, efficiency, and sensitivity of each assay on the two platforms
Figure 5 shows the design of the comparability study.
Based on the results obtained, the authors concluded that assays that perform well on one platform will usually perform well on the other (e.g. the Kudoa thyrsites assay - ku_thy). The BioMark™ often had a higher background attributed by the authors to the peculiarities of the software algorithms).
At least in one instance (the assay for Parvicapsula pseudobranchicola - pa_pse) the BioMark™ indicated that the samples were of poor quality, while the ABI 7900 identified them as positive.
13
Figure 5: Schematics of the comparability study design.
Discussion During the discussions, it was confirmed that the same concentrations of samples and probes were used in the two compared platforms, and that the reactions were carried out at the same temperatures. The fluorescence efficiency was about 80% and a high background has been observed.
A question was asked whether performance characteristics (ramp times, hold times) were compared between platforms, and that was consequently defined as a source of uncertainty.
It was also explained that the interpretation of algorithms are very different for the two machines and that the Fluidigm® BioMark™ does not allow the adjustment of the baseline.
PRESENTATION 2 – 2: STATISTICAL ANALYSIS OF COMPARABILITY Presented by Dr. Raphael Vanderstichel / summary by Dr. Kristi Miller
Both CCCs and linear regressions were used to compare the Ct values between the BioMark™ and ABI 7900 platforms. Because of the inherent difference of approximately 10Cts, the authors anticipated lower CCCs, so they assessed various adjustments to improve agreement. Applying either global (overall) or assay-specific adjustments improved Ct agreement between the two platforms, and a receiver operating characteristic (ROC) analysis demonstrated which combinations of Ct cutpoints (to assign Pass/Fail status) also improved agreement between the
14
two platforms. The presenter reported that sensitivity and specificity could be very high (e.g. >0.99) with carefully selected Ct cutpoint values and the usage of duplicate scores.
Discussion It was noted during the discussions that different results were obtained when using a low concentration of microbes, and that under optimal conditions a similar level of detection should be achieved when using the platforms. It was explained that amplified samples were used with the Fluidigm® BioMark™, while the samples used in the ABI 7900 were not amplified and that this could explain the differences.
The participants were informed that “spiking” the tissues with a known amount of DNA was considered; however, the analyses of the results have not been completed and that they will be reported in the future.
A concern was raised that not only the Ct should be compared, but also concordance in the copy number should be sought and that conditions should be optimised. The merits / drawbacks of using Ct and copy numbers were discussed, and it was concluded that this choice can vary depending on the purpose of the analyses.
It was agreed that the reported results showed generally a high concurrence between the assays on the two platforms, although the comparability of high load samples was different from the comparability of low load samples, and the quality was affected by the quality of the amplification plots.
PRESENTATION 2 – 3: SPECIFIC TARGET AMPLIFICATION (STA) AND EVALUATION OF THE STA ON ANALYTICAL SENSITIVITY Presented by Shaorong Li and Angela Schulze
This presentation introduced the Specific Target Amplification (STA) and the approaches utilized to assess the effect of the STA step on analytical sensitivity which was termed the ASe group study (Figure 6).
This study was designed to assess and quantify the effect of the STA step on low load microbes when tested in a mixture with high, medium or low load microbes. In addition to this, it was also designed to identify any inhibitory competition between microbes within sample mixtures and to determine the rate of false positives within each assay.
Complications in the experimental setup and analysis were highlighted, including possible co-infections with positive control samples derived from tissue samples, as well as volume and microbe load limitations based on the positive control samples supplied.
Discussion The presentation was followed by a discussion in which the presenter answered questions regarding the consistency of the results and specific techniques that were used in the study.
15
Figure 6: Schematics of the study design to evaluate the effect of STA on analytical sensitivity.
PRESENTATION 2 – 4: STATISTICAL ANALYSIS OF THE EFFECTS OF STA ON THE ANALYTICAL SENSITIVITY, SPECIFICITY, AND REPEATABILITY OF THE MICROBE ASSAYS Presented by Dr. Raphael Vanderstichel and Dr. Kristi Miller
The presenter explained that the data analyses consisted of two elements: determination of the expected Ct values based on the theoretical dilution, known assay efficiencies; and definition of Ct values for high microbe concentrations (without dilutions).
Comparisons between expected and observed Cts were achieved with CCCs, and Pass/Fail statuses were assigned at predetermined Cts, based on each assay’s limit of detection. The Pr(False negative) and Pr(Detection) were calculated and used to summarize the effect of STA on analytical sensitivity; a few outlying assays were visually identified (Facilispora margolisi - fa_mar, IHNV, Spironucleus salmonicida - sp_sal, VHSV, and Yersinia ruckeri - ye_ruc). The CCC between expected and observed Cts showed overall high agreement (0.819).
Using A3-LOD data, the authors determined that there were no differences in efficiencies between STA and non-STA assay-specific groups, and no differences in the minimum number of copies in the chamber to achieve a level of 95% detection. However there were differences in the minimum number of copies in the starting material to achieve a 95% detection. The authors also found that the assay-specific repeatability (within arrays) were different between
16
STA and non-STA, while the assay reproducibility (between arrays) were similar between STA and non-STA.
Discussion Discussions revolved around the technical issues and possible biases introduced by; the STA, the subsequent clean-up of the samples, running virus primers against other microbe samples with and without STA, and the interpretation of the results. It was asserted that biases can be introduced during the post pre-amplification clean-up, depending on the primer used and that measuring the performance at this point is a critical control point, in part because suppliers can change specifications.
It was recommended that the efficiency of the primer clean-up should be measured. It was also recommended that tests be run without primers, to detect possible remaining primers or fragments.
It was discussed that one way to deal with the uncertainties of assay specificity and sensitivity might be the use of more than one assay per target microbe, which could aid in the interpretation of results. This would; however, require that the same level of testing be applied for each assay, and on the BioMark™, may necessitate more than one STA reaction per sample, as two assays in close proximity cannot be used in the same STA reaction. It was suggested that alternate way to address uncertainty would be to conduct sequence validation.
PRESENTATION 2 – 5: STRENGTHS AND WEAKNESSES OF THE BIOMARK™ PLATFORM FOR MICROBE MONITORING RESEARCH Presented by Dr. Kristi Miller
The author emphasized that the approaches, results, and conclusions of the study were in agreement with three published studies (see associated Research Document), also by early adopters of the technology, which concluded that assay performance on the BioMark™ was excellent and none could find a negative impact of the STA on assay performance.
The presenter also compared the performance of four assays (VHSV, IHNV, ISAV8, and IPNV) carried out with the BioMark™ platform with existing results, obtained using unrelated samples and qPCR platforms, at the National Aquatic Animal Health Program (NAAHP) laboratories, and concluded that results were highly comparable.
In all, the presenter asserted that the BioMark™ demonstrated the following strengths and weaknesses:
• Limited tissue requirements • Upgradable to facilitate PCR-sequencing • Simultaneous RNA quality assessments • Detection of a second probe
Weakness
• Poor curve quality for some assays • Assess presence and load, not disease • Enhanced training requirements • STA induces some enhanced variance in Ct • Initial cost of instrument
The presenter concluded that there are far more strengths than weaknesses in the implementation of the BioMark™ platform for microbe monitoring, and that with appropriate validation, this platform may also prove useful for diagnostics.
Discussion Generally the reviewers and participants agreed with the strengths and weaknesses of the BioMark™ platform as presented. However, several additional remarks were made:
• There are challenges assessing the platform and the assays for the intended purpose. This is not an intrinsic weakness, but a challenge.
• Some new technologies can be very powerful, but there has been a shift in how research is conducted. Traditionally a problem was recognised, and then ways to explain and solve it were sought. With the approach used in this study, new agents are detected, and then attempts are made to determine what problems they might create (e.g. fish disease).
• This is a new technology, developed for broad-based research with currently no standards to follow; however, it is expected that the knowledge and standards application will become more robust in the future. A step in that direction would be the establishment of a framework for the interpretation of the research results that were obtained.
• The use of the instrument for large-scale projects creates large data sets which are not subject to the same level of scrutiny as smaller data sets, creating uncertainty. It is difficult to detect and identify these sources of uncertainty. It was emphasized that the sources of uncertainty should be documented. It is recognised that this uncertainty is partially due to the limited worldwide experience with the platform and will improve over time.
• The large volume of data generated poses challenges with the handling, logistics, statistical analysis, and interpretation of the results.
• One strong point of the platform is that only very small samples are required, thereby facilitating the development of non-lethal sampling.
• As a “discovery” tool, it can multiplex while reducing the redundancy within each microbe assay.
• The extensive use of robotics in the sample and other liquid handling minimizes the risks of error.
• The platform is best suited for large-scale studies / sampling events, and less suited for smaller datasets.
18
• Standard Operating Procedures (SOPs) are not as well developed as for other platform / assay combinations. This should be addressed.
• The lack of a comparison between labs is a weakness which should be addressed in the future.
• The complex assays and large datasets require an extended quality assurance and quality control (QA/QC) program based on performance measures, particularly at critical control points.
• Calculations of the true operational costs and true total processing time should include maintenance, labour, QA/QC, amortisation of the instruments, and the time used and costs for all related activities.
Numerous comments were made, in relation to; the differentiation between assessing the Fluidigm® BioMark™ platform, or the single apparatus that was used in this series of assessments, the panel of assays used in this assessment and the interpretation of the results obtained, as well as the fact that the assays are not carried-out independently but are all linked by assay conditions and other commonalities.
Further discussions involved the use the Fluidigm® BioMark™ platform and the associated assays to determine presence / absence, prevalence, and relative load of microbes, and included possible limitations, as well as the importance of using correct terminology when framing the issues.
WRAP-UP AND ADJOURNMENT FOR DAY 2 The Chairs thanked the participants for their work and invited everyone to submit what they consider to be the most important points of the two days of discussion.
The meeting was adjourned for the day.
PRESENTATIONS AND DISCUSSIONS (DAY 3)
WELCOME AND RECAPITULATION OF THE RESULTS FROM DAYS 1 AND 2 The Chairs of the meeting welcomed the participants. Co-chair Roger Wysocki presented a recapitulation of the work done the previous day, and outlined the path forward.
PRESENTATION 3 – 1: THE PRINCIPLE OF CONSENSUS IN THE CSAS PEER REVIEW PROCESS Presented by Gilles Olivier
The co-Chair elaborated specifically on the application of the principle of consensus to this particular CSAS peer review process.
GENERAL DISCUSSION AND FINALIZATION The co-Chair presented a draft summary of the Science Advice Report and a general discussion was initiated.
Concerns were raised over the adequacy of the description of the quality control measures of the assessments, the general QA program of the laboratory, and as well as the accuracy of wording used in the text of the draft Research Document and the draft summary of the Science Advisory Report.
19
Wording was presented, discussed, and modified as the discussions went ahead on the following topics:
• The peer review found the BioMark™ platform to function as well as any other qPCR platform, and there were no shortcomings identified for the instrument per se for the purpose of proceeding with Phase 2b of the Project.
• The present research design is notably different from a traditional hypothesis-driven approach to the investigation of fish health.
• The interpretation of the significance of potentially low levels of pathogen on the health status of fish represents a new approach to assessing the potential impact of pathogens on fish populations.
• There are a number of cautions and caveats regarding the limits of extrapolation of such research results.
• The qPCR molecular detection method incorporates very specific a priori information about the sequence of the target to be detected, so it is not necessarily a technique that is well-suited to microbe discovery.
• A blind approach that does not rely on existing knowledge of extant diversity would be best for discovery research; as this maximizes the likelihood of capturing unknown as well as known targets.
• A meta-genomics approach could do this whereby amplified fragments from all organisms within a complex sample (e.g. homogenate of salmon tissues) are sequenced in parallel using next generation sequencing. Unlike qPCR, the primers used are 'universal' to broad taxonomic groups of interest.
• A procedure for reporting regulated pathogens to the Canadian Food Inspection Agency (CFIA) was discussed and agreed upon.
• For CFIA regulated, or OIE listed diseases and pathogens, OIE- prescribed assays should be used, where available.
• It was recommended that Dr. Miller’s research laboratory adheres to a QA program that would provide methods and process checks, verification of critical reagents, calibration of pipettes, etc. in order to ensure defensible and reproducible results.
• Each aspect of the testing process, including test result interpretation, should be considered in order to mitigate risks, and these processes should be captured in SOP’s and an overarching quality manual.
It was concluded that the Fluidigm® BioMark™ platform represents a powerful new technology, providing excellent potential for the detection and monitoring of microbes.
It was agreed that the assessed Fluidigm® BioMark™ instrument has demonstrated fitness for purpose for this research Project.
A number of strengths, weaknesses and potential uncertainties in results obtained using the Fluidigm® BioMark™ instrument were further discussed, and recommendations for addressing them were advanced.
The draft Research Document was accepted with some modifications. It will need to be revised based on peer review comments received, and conclusions realized, within the advisory process. Such comments will be provided to the authors to allow for revision of the draft Research Document, such that it can be reviewed and finalized to support the advice provided. Two editorial committees were appointed, one to assist with the finalization of the Scientific
20
Advice Report, and one to assess and recommend changes required for the finalization of the Research Document.
CONCLUSION AND ADJOURNMENT The Chairs concluded the meeting by thanking the authors for their hard work done under tight time constraints. The Chairs also thanked the participants for the constructive discussions and their valuable contributions to the process, and then adjourned the meeting.
The Chairs received, and forwarded to the authors shortly after the meeting, all relevant written comments and remarks from the participants.
21
APPENDICES
APPENDIX 1: LIST OF PARTICIPANTS
Participant's name Affiliation
Ahmed Siah BC Centre for Aquatic Health Science, Campbell River, British Columbia
Alf Bungay Fisheries and Oceans Canada – ABAAHS Ottawa, Ontario
Amy Tabata Fisheries and Oceans Canada - Pacific Biological Station Nanaimo, British Columbia
Angela Schulze Fisheries and Oceans Canada - Pacific Biological Station Nanaimo, British Columbia
Anne Veniot Fisheries and Oceans Canada - Gulf Fisheries Centre Moncton, New Brunswick
Benjamin Forward NB Research and Productivity Council, Food, Fisheries and Aquaculture Division, Fredericton, New Brunswick
Brian Ridell Pacific Salmon Foundation, Vancouver, British Columbia
Cathryn Abbott Fisheries and Oceans Canada - Pacific Biological Station Nanaimo, British Columbia
Diana Trager Fisheries and Oceans Canada - Aquaculture Management, Pacific Region, Vancouver, British Columbia
Diane Morrison Marine Harvest Canada Campbell River, British Columbia
Gilles Olivier Fisheries and Oceans Canada – ABAAHS Ottawa, Ontario
Ian Gardner Centre for Veterinary Epidemiological Research University of Prince Edward Island Charlottetown, Prince Edward Island
Ivan Stefanov Fisheries and Oceans Canada – ABAAHS Ottawa, Ontario
Jay Parsons Fisheries and Oceans Canada – ABAAHS Ottawa, Ontario
22
Participant's name Affiliation
Joe Banoub Fisheries and Oceans Canada - Northwest Atlantic Fisheries Centre St. John’s, Newfoundland and Labrador
Knut Falk Norwegian Veterinary Institute Oslo, Norway
Kristi Miller-Saunders Fisheries and Oceans Canada - Pacific Biological Station, Nanaimo, British Columbia
Mark Higgins Fisheries and Oceans Canada - Pacific Biological Station Nanaimo, British Columbia
Mark Saunders Fisheries and Oceans Canada - Pacific Biological Station Nanaimo, British Columbia
Michio Yasunami Department of Clinical Medicine, Institute of Tropical Medicine, Nagasaki University Nagasaki, Japan
Nathalie Bruneau Canadian Food Inspection Agency - Animal Health Science Directorate Ottawa, Ontario
Nellie Gagne Fisheries and Oceans Canada - Gulf Fisheries Centre Moncton, New Brunswick
Raphael Vanderstichel Centre for Veterinary Epidemiological Research University of Prince Edward Island Charlottetown, Prince Edward Island
Roger Wysocki Fisheries and Oceans Canada – ABAAHS Ottawa, Ontario
Sara Moutailler ANSES - Laboratoire de Santé Animale de Maisons Alfort Maison Alfort, France
Shaorong Li Fisheries and Oceans Canada - Pacific Biological Station Nanaimo, British Columbia
Sharon Clouthier Fisheries and Oceans Canada Fresh Water Institute
Sonja Saksida Unaffiliated
Stewart Johnson Fisheries and Oceans Canada - Pacific Biological Station Nanaimo, British Columbia
23
APPENDIX 2: TERMS OF REFERENCE Review of the Fluidigm® BioMark™ platform: Evaluation to assess fitness for purpose in microbial monitoring National Peer Review – National Capital Region
December 2-4, 2014 Nanaimo, British Columbia
Chairpersons: Roger Wysocki and Gilles Olivier
Context Fisheries and Oceans Canada is collaborating with the Pacific Salmon Foundation and Genome B.C. on a five year, multi-phase project (the Project) that will combine genomics and fish health technologies to determine what microbes are carried by wild and cultured British Columbia salmonids, where the microbes may have originated and how they may impact the health of salmon.
The stated strategic goal of the Project is “to discover the microbes and potential diseases that may undermine the productivity and performance of British Columbia (wild) salmon and to determine what exchanges may happen between wild and cultured salmon in the evolution of these microbes”. The Project will proceed through four sequential Phases (stages).
Phase 1 (2012 - 2013) establishes a large-scale sampling program, running over twelve months, for wild, hatchery and aquaculture salmon. The sampling was conducted in 2012 and early 2013.
Phase 2 (2013 - 2015) will develop, test, and evaluate a novel genomic technology to determine which microbes associated with disease in salmon worldwide are carried by wild and cultured salmon in British Columbia.
Phase 3 (2014 - 2016) will focus on the microbes identified in Phase 2, with an emphasis on microbes that have not been extensively researched in B.C. and that carry the highest potential for disease in wild salmon. Laboratory challenge studies will be carried out to assess under what conditions specific microbes are associated with disease in Pacific salmon. Additional studies assessing transmission dynamics of specific microbes will also take place.
Phase 4 (2016 - 2017) will include reporting of research and presentations to management agencies on the potential utility of methods developed and the application of outcomes to future monitoring.
Currently the Study is in Phase 2a, the stated major objective of which is to develop, test, and evaluate the sensitivity, specificity and repeatability of assays using a high throughput micro-fluidics platform (Fluidigm® BioMark™) designed to quantitatively assess the presence and load of microbes, in multiple samples simultaneously. This technology utilizes a novel pre-amplification step whose effects have yet to be assessed. Phase 2a, is not intended to develop an approach/tool to diagnose disease in either wild or cultured salmon. Evaluation of diagnostic sensitivity and specificity will proceed in Phase 2b of this Study.
The decision to move into Phase 2b of this study is dependent on the analytical performance of the high throughput micro-fluidic platform, and an evaluation of performance is underway. Ensuring that the performance of any tools developed to assess both the presence and the disease implications of potential microbes is important, because of the potential for wide ranging implications on Canada’s aquatic resources. Therefore, diagnostic tools should be reliable, i.e.
24
the sensitivity and specificity of the microbe assays run on the platform minimize the potential for false positive or/and negative results.
To inform decisions related to the advancement of the Project to Phase 2b, and ultimately whether the Fluidigm® BioMark™ platform and the assays based on this platform are appropriate for use in large-scale research monitoring for microbes in wild Pacific and farmed Atlantic salmon, the DFO Management Steering Committee for the Project has requested that a Canadian Science Advisory Secretariat (CSAS) National Peer Review (NPR) process be conducted to peer review the evaluation of the Fluidigm® BioMark™ platform performance for microbial detection, with particular emphasis on the impacts, if any, of the pre-amplification step.
Objectives The objective of this CSAS NPR process is to provide advice about the suitability of the assays, based on the Fluidigm® BioMark™ Platform and using pre-amplification, for large scale research monitoring for microbes in wild Pacific and farmed Atlantic salmon. A working paper will be reviewed and provide the basis for the advice.
Specifically, this review will assess:
1. The analytical sensitivity, specificity, comparability and repeatability of each microbe assay, as determined in the working paper.
2. To what level the assay results are comparable across the Fluidigm® BioMark™ and ABI 7900 platforms (within the Molecular Genetics Laboratory at the Pacific Biological Station).
3. The effect of the pre-amplification step of multiple independent target species on the analytical sensitivity specificity, and repeatability of the assays. Specifically:
• Whether the pre-amplification step introduces biases in the relative abundance of targets and,
• Whether it generates spurious (false) targets.
4. The benefits, limitations, uncertainties and proposed uses of this methodology (including the design and the statistical analyses) for the identified research purposes.
Expected Publications
• Science Advisory Report • Proceedings • Research Document
Participation
• DFO Science • DFO Fisheries and Aquaculture Management • Canadian Food Inspection Agency • Academia • Aquaculture Industry Representatives • Province of British Columbia • Non-government Organizations