49
Catalog ue no. 82-224 -X Pregnancy Outcomes 2005

8/12/2019 Canadian Stats
http://slidepdf.com/reader/full/canadian-stats 1/49
Catalogue no. 82-224-X
Pregnancy
Outcomes
2005

8/12/2019 Canadian Stats
http://slidepdf.com/reader/full/canadian-stats 2/49
How to obtain more information
For information about this product or the wide range of services and data available from Statistics Canada, visit our websiteat www.statcan.ca, e-mail us at [email protected], or telephone us, Monday to Friday from 8:30 a.m. to 4:30 p.m., at thefollowing numbers:
Statistics Canada’s National Contact Centre
Toll-free telephone (Canada and the United States):Inquiries line 1-800-263-1136
National telecommunications device for the hearing impaired 1-800-363-7629
Fax line 1-877-287-4369
Local or international calls:
Inquiries line 1-613-951-8116
Fax line 1-613-951-0581
Depository Services Program
Inquiries line 1-800-635-7943
Fax line 1-800-565-7757
To access this product
This product, Catalogue no. 82-224-X, is available free in electronic format. To obtain a single issue, visit our website atwww.statcan.ca and select “Publications” > “Free Internet publications.”
Standards of service to the public
Statistics Canada is committed to serving its clients in a prompt, reliable and courteous manner. To this end, Statistics Canadahas developed standards of service that its employees observe. To obtain a copy of these service standards, please contactStatistics Canada toll-free at 1-800-263-1136. The service standards are also published on www.statcan.ca under “About us” >“Providing services to Canadians.”

8/12/2019 Canadian Stats
http://slidepdf.com/reader/full/canadian-stats 3/49
Statistics Canada
Health Statistics Division
Pregnancy Outcomes2005
Published by authority of the Minister responsible for Statistics Canada
© Minister of Industry, 2008
All rights reserved. The cont ent of this electronic publication may be r eproduced, inwhole or in part, and by any means, without further permission from Statistics Canada,subject to the following conditions: that it be done solely for the purposes of privatestudy, research, criticism, review or newspaper summary, and/or for non-commercialpurposes; and that Statistics Canada be fully acknowledged as follows: Source (or “Adapted from”, if appropriate): Statistics Canada, year of publication, name of product, catalogue number, volume and issue numbers, reference period and page(s).Otherwise, no part of this publication may be reproduced, stored in a retrieval systemor transmitted in any form, by any means—electronic, mechanical or photocopy—or for any purposes without prior written permission of Licensing Services, ClientServices Division, Statistics Canada, Ottawa, Ontario, Canada K1A 0T6.
October 2008
Catalogue no. 82-224-X
ISSN 1712-4077
Frequency: Annual
Ottawa
La version française de cette publication est disponible sur demande (no 82-224-Xau catalogue).
Note of appreciation
Canada owes the success of its statistical system to a long standing partnership betweenStatistics Canada, the citizens of Canada, its businesses, governments and other institutions. Accurate and timely statistical information could not be produced without their continued cooperation and goodwill.

8/12/2019 Canadian Stats
http://slidepdf.com/reader/full/canadian-stats 4/49
User information
Symbols
The following standard symbols are used in Statistics Canada publications:
. not available for any reference period
.. not available for a specific reference period
... not applicable
0 true zero or a value rounded to zero
0s value rounded to 0 (zero) where there is a meaningful distinction between true zero and the value that was
rounded
p preliminary
r revised
x suppressed to meet the confidentiality requirements of the Statistics Act
E use with caution
F too unreliable to be published
2 Statistics Canada – Catalogue no. 82-224-X

8/12/2019 Canadian Stats
http://slidepdf.com/reader/full/canadian-stats 5/49
Table of contents
Highlights 4
Introduction 5
Related products 6
Statistical tables
1 Selected pregnancy outcomes statistics, by age group and place of residence of females 9
1-1 Canada 91-2 Newfoundland and Labrador 11
1-3 Prince Edward Island 13
1-4 Nova Scotia 15
1-5 New Brunswick 17
1-6 Quebec 19
1-7 Ontario 21
1-8 Manitoba 23
1-9 Saskatchewan 25
1-10 Alberta 27
1-11 British Columbia 291-12 Yukon Territory 31
1-13 Northwest Territories including Nunavut 33
1-14 Northwest Territories 35
1-15 Nunavut 37
1-16 Unknown province or territory 39
Data quality, concepts and methodology
Definitions 41
Overview — Data sources and data quality 42
Explanatory notes for the tables 47
Statistics Canada – Catalogue no. 82-224-X 3

8/12/2019 Canadian Stats
http://slidepdf.com/reader/full/canadian-stats 6/49
Highlights
• In 2005, the pregnancy rate rose to 54.6 pregnancies per 1,000 women, up by 1.3 from the historic low observed
in 2004.
• There were an estimated 447,485 pregnancies during 2005; this means that there were 9.3% fewer than
the 493,195 pregnancies in 1996, ten years earlier.
• Births accounted for 76.5% of the pregnancy outcomes in 2005, up from 74.2% in 1996, while induced abortions
and fetal loss decreased respectively from 22.7% to 21.6%, and from 3.1% to 1.9%.
• The decline in pregnancies was mostly concentrated in women under 30 years of age where the pregnancy rates
decreased in every age group.
• The largest percentage decrease in pregnancy rates was found in teenagers. In 1996, the number of
pregnancies per 1,000 women under 20 years of age was 38.7; by 2005, this rate had fallen to 24.6. Thedecline was greater for younger teen girls where the pregnancy rate for those under 15 years of age dropped
from 4.1 in 1996 to 1.9 in 2005, and from 27.3 to 15.8 over the same period for girls aged 15 to 17.
• In contrast, pregnancy rates rose for women over 30, with those aged 35 to 39 reporting the greatest increase,
from 42.7 pregnancies per 1,000 women in 1996 to 51.9 in 2005. However, the largest relative increase occurred
for women 40 years of age and over, whose pregnancy rate rose by 25 per cent, from 8.8 in 1996 to 11 births
per 1,000 women in 2005.
4 Statistics Canada – Catalogue no. 82-224-X

8/12/2019 Canadian Stats
http://slidepdf.com/reader/full/canadian-stats 7/49
Introduction
This product brings together statistics on live births, induced abortions and fetal loss (stillbirths and miscarriages) to
provide comprehensive statistics on outcomes of pregnancy.
Statistics on live births, induced abortions and fetal loss are available separately in various other products produced
by Statistics Canada. The purpose of this particular product, however, is to bring together all outcome statistics into
one product in order to provide total pregnancy statistics and to facilitate the analysis of each outcome within the
context of other outcomes.
The statistics are presented according to the calendar year in which the pregnancy terminated and not the year in
which conception took place. For each data year, the statistics are presented by the age group of the woman and
her province or territory of residence. Only pregnancies occurring to Canadian residents are included.
The CANSIM tables provide data back to 1974. These tables are updated annually to include the most current data
year available. The Internet publication provides data for the latest 10 years available.
Free access to the data is provided through a special CANSIM interface. The CANSIM tables can be linked directly
from three different locations in the HTML product:
Tables section:
• Related CANSIM tables
• Individual tables, in the Source
Related products section:
• Selected CANSIM tables from Statistics Canada
Statistics Canada – Catalogue no. 82-224-X 5
8/12/2019 Canadian Stats
http://slidepdf.com/reader/full/canadian-stats 8/49
Related products
Selected publications from Statistics Canada
82-221-X Health indicators
82-223-X Induced abortion statistics
84F0210X Births
Selected CANSIM tables from Statistics Canada
102-4503 Live births, by age of mother, Canada, provinces and territories
102-4505 Live births, crude birth rate, age-specific and total fertility rates, Canada, provinces and territories
106-9002 Pregnancy outcomes, by age group, Canada, provinces and territories
106-9005 Induced abortions, by area of report and type of facility performing the abortion, Canada,
provinces and territories
106-9013 Induced abortions, by area of residence of patient, Canada, provinces and territories
106-9034 Induced abortions, by age group and area of residence of patient, Canada, provinces and
territories
Selected surveys from Statistics Canada
3203 Hospital Morbidity Database (http://www.statcan.ca/english/sdds/3203.htm)
3209 Therapeutic Abortion Survey (http://www.statcan.ca/english/sdds/3209.htm)
3231 Vital Statistics - Birth Database (http://www.statcan.ca/english/sdds/3231.htm)
3234 Vital Statistics - Stillbirth Database (http://www.statcan.ca/english/sdds/3234.htm)
3604 Estimates of Population by Age and Sex for Canada, the Provinces and the Territories
(http://www.statcan.ca/english/sdds/3604.htm)
6 Statistics Canada – Catalogue no. 82-224-X
8/12/2019 Canadian Stats
http://slidepdf.com/reader/full/canadian-stats 9/49
Pregnancy Outcomes – 2005
Selected tables of Canadian statistics from Statistics Canada
• Pregnancy outcomes by province or territory of residence
• Pregnancy outcomes by age group
• Induced abortions by province and territory of report
• Induced abortions by area of residence of patients
• Induced abortions per 100 live births
• Induced abortions by age group
• Births and birth rate, by provinces and territories
• Population by sex and age group, by provinces and territories
Statistics Canada – Catalogue no. 82-224-X 7

8/12/2019 Canadian Stats
http://slidepdf.com/reader/full/canadian-stats 10/49
Statistical tables

8/12/2019 Canadian Stats
http://slidepdf.com/reader/full/canadian-stats 11/49
Pregnancy Outcomes – 2005
Table 1-1
Selected pregnancy outcomes statistics, by age group and place of residence of females — Canada
1996 1997 1998 1999 2000 2001 2002 2003 2004 2005
number of events
Total, pregnancies 1 , 2 , 3
All ages 493,195 474,047 464,672 454,370 443,871 449,270 443,355 447,904 445,899 447,485Under 20 years 45,375 42,953 43,012 41,089 39,208 37,622 35,547 33,553 32,035 30,948
Under 15 years 799 784 692 657 559 541 470 411 424 41415 to 19 years 44,576 42,169 42,320 40,432 38,649 37,081 35,077 33,142 31,611 30,534
15 to 17 years 16,110 15,105 14,860 13,614 13,030 12,395 11,144 10,285 10,359 9,89918 to 19 years 28,466 27,064 27,316 26,818 25,619 24,686 23,933 22,857 21,252 20,635
20 to 24 years 103,633 99,937 98,724 96,017 94,070 92,559 90,779 90,566 88,305 87,09925 to 29 years 144,831 137,779 132,926 129,450 125,458 126,715 125,142 127,572 127,538 129,10630 to 34 years 132,788 126,040 121,286 118,124 114,736 120,013 119,081 121,580 123,089 124,13535 to 39 years 55,796 56,228 57,057 57,749 57,893 59,274 59,245 60,316 59,963 61,04040 years and over 10,439 10,921 11,149 11,817 12,385 13,032 13,530 14,239 14,838 15,026Unknown age group 333 188 518 124 121 55 31 78 131 91
Live births 4
All ages 366,200 348,598 342,418 337,249 327,882 333,744 328,802 335,202 337,072 342,176Under 20 years 21,824 19,920 19,913 18,982 17,503 16,572 15,533 14,945 14,186 14,013
Under 15 years 227 218 192 177 153 116 120 97 111 11815 to 19 years 21,597 19,702 19,721 18,805 17,350 16,456 15,413 14,848 14,075 13,895
15 to 17 years 7,169 6,427 6,453 5,986 5,372 4,927 4,538 4,262 4,182 4,09618 to 19 years 14,428 13,275 13,268 12,819 11,978 11,529 10,875 10,586 9,893 9,799
20 to 24 years 67,515 63,522 63,041 61,480 59,523 58,186 56,729 56,377 55,383 55,31825 to 29 years 116,723 110,211 106,899 104,674 101,072 102,453 100,646 103,148 103,743 105,56630 to 34 years 111,024 105,131 101,422 99,455 96,353 101,460 100,768 103,607 105,705 107,52435 to 39 years 42,641 43,089 43,801 45,165 45,393 46,704 46,468 47,851 48,130 49,52640 years and over 6,267 6,598 6,844 7,374 7,924 8,347 8,647 9,214 9,802 10,146Unknown age group 206 127 498 119 114 22 11 60 123 83
Induced abortions 2 , 5 , 6
All ages 111,659 111,709 110,331 105,666 105,427 106,418 105,154 103,768 1 00,039 96,815Under 20 years 22,118 21,792 22,074 21,140 20,864 20,380 19,344 17,958 17,242 16,349
Under 15 years 544 530 483 468 389 412 337 302 304 28415 to 19 years 21,574 21,262 21,591 20,672 20,475 19,968 19,007 17,656 16,938 16,065
15 to 17 years 8,387 8,182 7,971 7,276 7,387 7,222 6,381 5,785 5,974 5,58818 to 19 years 13,187 13,080 13,476 13,396 13,088 12,746 12,626 11,871 10,964 10,477
20 to 24 years 33,207 33,714 33,422 32,462 32,623 32,730 32,371 32,662 31,467 30,35925 to 29 years 24,087 24,014 22,956 21,983 21,735 22,012 22,189 22,236 21,662 21,41930 to 34 years 17,862 17,517 16,959 15,708 15,790 16,243 15,981 15,734 15,089 14,45035 to 39 years 10,821 11,020 11,269 10,646 10,631 10,977 11,022 10,821 10,206 9,973
40 years and over 3,448 3,598 3,636 3,726 3,780 4,043 4,230 4,343 4,368 4,263Unknown age group 116 54 15 1 4 33 17 14 5 2
Fetal loss 3 , 7
All ages 15,336 13,740 11,923 11,455 10,562 9,108 9,399 8,934 8,788 8,494Under 20 years 1,433 1,241 1,025 967 841 670 670 650 607 586
Under 15 years 28 36 17 12 17 13 13 12 9 1215 to 19 years 1,405 1,205 1,008 955 824 657 657 638 598 574
15 to 17 years 554 496 436 352 271 246 225 238 203 21518 to 19 years 851 709 572 603 553 411 432 400 395 359
20 to 24 years 2,911 2,701 2,261 2,075 1,924 1,643 1,679 1,527 1,455 1,42225 to 29 years 4,021 3,554 3,071 2,793 2,651 2,250 2,307 2,188 2,133 2,12130 to 34 years 3,902 3,392 2,905 2,961 2,593 2,310 2,332 2,239 2,295 2,16135 to 39 years 2,334 2,119 1,987 1,938 1,869 1,593 1,755 1,644 1,627 1,54140 years and over 724 725 669 717 681 642 653 682 668 617Unknown age group 11 7 5 4 3 0 3 4 3 6
See footnotes at the end of the table.
Statistics Canada – Catalogue no. 82-224-X 9

8/12/2019 Canadian Stats
http://slidepdf.com/reader/full/canadian-stats 12/49
Pregnancy Outcomes – 2005
Table 1-1 – continued
Selected pregnancy outcomes statistics, by age group and place of residence of females — Canada
1996 1997 1998 1999 2000 2001 2002 2003 2004 2005
rate per 1,000 females
Total, pregnancies 1 , 2 , 3
All ages 62.7 60.1 58.8 57.3 55.7 56.0 54.9 55.2 53.3 54.6Under 20 years 38.7 36.3 35.9 34.0 32.1 30.6 28.8 27.1 25.6 24.6
Under 15 years 4.1 4.0 3.5 3.3 2.8 2.7 2.4 2.0 2.0 1.915 to 19 years 45.6 42.8 42.4 40.1 38.0 36.1 33.9 32.1 30.5 29.2
15 to 17 years 27.3 25.4 24.8 22.6 21.4 20.1 18.1 16.8 16.9 15.818 to 19 years 73.5 69.3 68.5 65.9 62.5 59.8 57.1 54.1 50.2 49.0
20 to 24 years 105.3 101.5 100.1 96.4 93.1 89.8 86.4 84.6 81.2 79.425 to 29 years 135.8 130.7 127.6 125.6 122.5 124.1 121.1 122.0 119.6 118.930 to 34 years 104.3 101.8 101.7 102.8 102.5 108.1 107.4 109.9 111.5 112.535 to 39 years 42.7 42.6 42.8 43.2 43.5 45.3 46.4 48.8 50.0 51.940 years and over 8.8 8.9 8.9 9.2 9.5 9.8 10.1 10.5 10.8 11.0Unknown age group ... ... ... ... ... ... ... ... ... ...
Live births 4
All ages 46.6 44.2 43.3 42.5 41.1 41.6 40.7 41.3 40.3 41.8Under 20 years 18.6 16.8 16.6 15.7 14.3 13.5 12.6 12.1 11.4 11.1
Under 15 years 1.2 1.1 1.0 0.9 0.8 0.6 0.6 0.5 0.5 0.615 to 19 years 22.1 20.0 19.8 18.6 17.0 16.0 14.9 14.4 13.6 13.3
15 to 17 years 12.2 10.8 10.8 9.9 8.8 8.0 7.4 7.0 6.8 6.5
18 to 19 years 37.2 34.0 33.3 31.5 29.2 27.9 26.0 25.1 23.4 23.320 to 24 years 68.6 64.5 63.9 61.7 58.9 56.4 54.0 52.7 50.9 50.425 to 29 years 109.5 104.6 102.6 101.6 98.7 100.3 97.4 98.6 97.3 97.230 to 34 years 87.2 84.9 85.1 86.6 86.1 91.4 90.9 93.7 95.8 97.435 to 39 years 32.6 32.6 32.9 33.8 34.1 35.7 36.4 38.7 40.1 42.140 years and over 5.3 5.4 5.4 5.8 6.1 6.3 6.4 6.8 7.2 7.4Unknown age group ... ... ... ... ... ... ... ... ... ...
Induced abortions 2 , 5 , 6
All ages 14.2 14.2 14.0 13.3 13.2 13.3 13.0 12.8 12.0 11.8Under 20 years 18.9 18.4 18.4 17.5 17.1 16.6 15.7 14.5 13.8 13.0
Under 15 years 2.8 2.7 2.4 2.3 1.9 2.1 1.7 1.5 1.4 1.315 to 19 years 22.1 21.6 21.6 20.5 20.1 19.4 18.4 17.1 16.3 15.3
15 to 17 years 14.2 13.7 13.3 12.1 12.1 11.7 10.4 9.5 9.7 8.918 to 19 years 34.0 33.5 33.8 32.9 32.0 30.9 30.1 28.1 25.9 24.9
20 to 24 years 33.8 34.2 33.9 32.6 32.3 31.7 30.8 30.5 28.9 27.725 to 29 years 22.6 22.8 22.0 21.3 21.2 21.6 21.5 21.3 20.3 19.730 to 34 years 14.0 14.1 14.2 13.7 14.1 14.6 14.4 14.2 13.7 13.135 to 39 years 8.3 8.3 8.5 8.0 8.0 8.4 8.6 8.8 8.5 8.540 years and over 2.9 2.9 2.9 2.9 2.9 3.0 3.2 3.2 3.2 3.1
Unknown age group ... ... ... ... ... ... ... ... ... ...
Fetal loss 3 , 7
All ages 2.0 1.7 1.5 1.4 1.3 1.1 1.2 1.1 1.1 1.0Under 20 years 1.2 1.0 0.9 0.8 0.7 0.5 0.5 0.5 0.5 0.5
Under 15 years 0.1 0.2 0.1 0.1 0.1 0.1 0.1 0.1 0.0 0.115 to 19 years 1.4 1.2 1.0 0.9 0.8 0.6 0.6 0.6 0.6 0.5
15 to 17 years 0.9 0.8 0.7 0.6 0.4 0.4 0.4 0.4 0.3 0.318 to 19 years 2.2 1.8 1.4 1.5 1.3 1.0 1.0 0.9 0.9 0.9
20 to 24 years 3.0 2.7 2.3 2.1 1.9 1.6 1.6 1.4 1.3 1.325 to 29 years 3.8 3.4 2.9 2.7 2.6 2.2 2.2 2.1 2.0 2.030 to 34 years 3.1 2.7 2.4 2.6 2.3 2.1 2.1 2.0 2.1 2.035 to 39 years 1.8 1.6 1.5 1.4 1.4 1.2 1.4 1.3 1.4 1.340 years and over 0.6 0.6 0.5 0.6 0.5 0.5 0.5 0.5 0.5 0.5Unknown age group ... ... ... ... ... ... ... ... ... ...
1. Pregnancies equal the sum of live births, fetal loss and induced abortions.
2. For 2002 and 2003, Nunavut residents are excluded due to incomplete reporting.
3. For 2002 and 2003, hospitalized cases of miscarriages, illegal abortion and unspecified abortions in Nunavut are excluded due to incomplete reporting.
4. Live birth counts are based on registrations in the Birth Database.5. Induced abortion counts are taken from the Therapeutic Abortion Survey that collects information on abortions performed in hospitals and clinics in Canada, as
well as on abortions performed on Canadian residents in selected American states, for data years prior to 2004.
6. In 2004 and 2005, information on induced abortions performed in clinics in Manitoba was not submitted to the Therapeutic Abortion Survey.7. Fetal loss is the sum of stillbirth registrations in the Stillbirth Database and cases of miscarriages, illegal abortions and unspecified abortions reported in
the Hospital Morbidity Database.Note(s): See "Data quality, concepts and methodology — Explanatory notes for the tables " section.Source(s): Statistics Canada, Canadian Vital Statistics, Birth Database and Stillbirth Database; Canadian Institute for Health Information, Hospital Morbidity
Database and Therapeutic Abortion Database (CANSIM table 106-9002).
10 Statistics Canada – Catalogue no. 82-224-X

8/12/2019 Canadian Stats
http://slidepdf.com/reader/full/canadian-stats 13/49
Pregnancy Outcomes – 2005
Table 1-2
Selected pregnancy outcomes statistics, by age group and place of residence of females — Newfoundland and
Labrador
1996 1997 1998 1999 2000 2001 2002 2003 2004 2005
number of events
Total, pregnancies 1
All ages 6,945 6,579 6,090 6,129 5,927 5,752 5,595 5,658 5,510 5,524Under 20 years 748 720 675 626 582 541 510 479 438 423
Under 15 years 15 13 13 20 13 12 11 8 5 2615 to 19 years 733 707 662 606 569 529 499 471 433 397
15 to 17 years 257 256 236 244 181 191 165 154 164 13718 to 19 years 476 451 426 362 388 338 334 317 269 260
20 to 24 years 1,759 1,642 1,484 1,443 1,424 1,311 1,256 1,288 1,231 1,16425 to 29 years 2,225 2,076 1,868 1,900 1,827 1,742 1,675 1,672 1,574 1,62430 to 34 years 1,644 1,571 1,491 1,529 1,519 1,518 1,469 1,509 1,560 1,51435 to 39 years 476 489 480 543 521 552 592 616 569 67440 years and over 79 76 90 87 54 88 92 92 138 121Unknown age group 14 5 2 1 0 0 1 2 0 3
Live births 2
All ages 5,747 5,416 4,994 5,055 4,869 4,716 4,651 4,629 4,488 4,501Under 20 years 538 496 432 419 391 349 308 305 294 261
Under 15 years 6 4 3 5 2 1 4 1 2 7
15 to 19 years 532 492 429 414 389 348 304 304 292 25415 to 17 years 172 162 136 140 123 111 99 89 93 8518 to 19 years 360 330 293 274 266 237 205 215 199 169
20 to 24 years 1,366 1,231 1,150 1,099 1,084 980 988 960 906 85625 to 29 years 1,939 1,830 1,610 1,647 1,580 1,501 1,452 1,421 1,344 1,38730 to 34 years 1,468 1,397 1,349 1,371 1,343 1,344 1,325 1,360 1,378 1,35435 to 39 years 392 408 397 454 435 478 510 524 478 56940 years and over 44 54 55 65 36 64 68 58 88 73Unknown age group 0 0 1 0 0 0 0 1 0 1
Induced abortions 3
All ages 846 837 820 851 898 883 814 895 902 883Under 20 years 174 182 214 175 178 178 193 163 x 149
Under 15 years 8 8 10 15 10 11 7 7 x 1915 to 19 years 166 174 204 160 168 167 186 156 130 130
15 to 17 years 71 79 89 89 54 74 64 58 68 4818 to 19 years 95 95 115 71 114 93 122 98 62 82
20 to 24 years 318 334 275 299 306 298 248 290 303 28725 to 29 years 175 156 183 198 204 194 190 221 197 19630 to 34 years 89 98 90 101 137 137 108 108 151 125
35 to 39 years 58 48 36 66 61 61 59 81 78 8440 years and over 18 14 22 12 12 15 16 32 x 42Unknown age group 14 5 0 0 0 0 0 0 0 0
Fetal loss 4
All ages 352 326 276 223 160 153 130 134 120 140Under 20 years 36 42 29 32 13 14 9 11 11 13
Under 15 years 1 1 0 0 1 0 0 0 0 015 to 19 years 35 41 29 32 12 14 9 11 11 13
15 to 17 years 14 15 11 15 4 6 2 7 3 418 to 19 years 21 26 18 17 8 8 7 4 8 9
20 to 24 years 75 77 59 45 34 33 20 38 22 2125 to 29 years 111 90 75 55 43 47 33 30 33 4130 to 34 years 87 76 52 57 39 37 36 41 31 3535 to 39 years 26 33 47 23 25 13 23 11 13 2140 years and over 17 8 13 10 6 9 8 2 10 6Unknown age group 0 0 1 1 0 0 1 1 0 2
See footnotes at the end of the table.
Statistics Canada – Catalogue no. 82-224-X 11

8/12/2019 Canadian Stats
http://slidepdf.com/reader/full/canadian-stats 14/49
Pregnancy Outcomes – 2005
Table 1-2 – continued
Selected pregnancy outcomes statistics, by age group and place of residence of females — Newfoundland and
Labrador
1996 1997 1998 1999 2000 2001 2002 2003 2004 2005
rate per 1,000 females
Total, pregnancies 1
All ages 44.5 43.2 41.1 42.2 41.6 41.3 40.8 41.9 40.4 42.3Under 20 years 27.8 27.9 27.1 25.6 24.4 23.5 23.0 22.3 20.9 20.8
Under 15 years 3.4 3.1 3.2 5.1 3.4 3.4 3.2 2.4 1.4 7.915 to 19 years 32.6 32.6 31.8 29.6 28.4 27.1 26.5 26.0 24.8 23.3
15 to 17 years 19.2 19.6 18.8 19.9 15.2 16.5 14.9 14.6 16.2 13.618 to 19 years 52.1 52.4 51.5 43.9 48.1 42.8 42.9 41.8 36.6 37.4
20 to 24 years 82.1 80.2 77.2 77.8 78.9 73.6 70.5 72.1 68.6 66.525 to 29 years 105.8 103.4 97.9 104.4 105.1 105.8 105.2 106.7 101.0 104.830 to 34 years 70.6 69.5 69.0 73.8 76.2 79.2 79.0 83.5 89.3 90.235 to 39 years 20.0 20.9 21.0 24.1 23.3 25.2 27.5 29.3 27.8 34.140 years and over 3.4 3.3 3.9 3.8 2.4 3.9 4.1 4.1 6.3 5.5Unknown age group ... ... ... ... ... ... ... ... ... ...
Live births 2
All ages 36.8 35.5 33.7 34.8 34.2 33.8 33.9 34.3 32.9 34.5Under 20 years 20.0 19.2 17.4 17.2 16.4 15.2 13.9 14.2 14.0 12.8
Under 15 years 1.4 1.0 0.7 1.3 0.5 0.3 1.2 0.3 0.6 2.115 to 19 years 23.6 22.7 20.6 20.2 19.4 17.8 16.2 16.8 16.7 14.9
15 to 17 years 12.9 12.4 10.8 11.4 10.3 9.6 9.0 8.4 9.2 8.418 to 19 years 39.4 38.3 35.4 33.2 33.0 30.0 26.4 28.4 27.1 24.3
20 to 24 years 63.7 60.2 59.8 59.3 60.0 55.0 55.4 53.8 50.5 48.925 to 29 years 92.2 91.1 84.4 90.5 90.9 91.2 91.2 90.7 86.3 89.530 to 34 years 63.0 61.8 62.4 66.2 67.4 70.2 71.3 75.3 78.9 80.735 to 39 years 16.5 17.4 17.3 20.1 19.4 21.8 23.7 24.9 23.4 28.840 years and over 1.9 2.3 2.4 2.9 1.6 2.9 3.0 2.6 4.0 3.3Unknown age group ... ... ... ... ... ... ... ... ... ...
Induced abortions 3
All ages 5.4 5.5 5.5 5.9 6.3 6.3 5.9 6.6 6.6 6.8Under 20 years 6.5 7.0 8.6 7.2 7.5 7.7 8.7 7.6 x 7.3
Under 15 years 1.8 1.9 2.5 3.8 2.6 3.1 2.1 2.1 x 5.715 to 19 years 7.4 8.0 9.8 7.8 8.4 8.6 9.9 8.6 7.4 7.6
15 to 17 years 5.3 6.1 7.1 7.3 4.5 6.4 5.8 5.5 6.7 4.818 to 19 years 10.4 11.0 13.9 8.6 14.1 11.8 15.7 12.9 8.4 11.8
20 to 24 years 14.8 16.3 14.3 16.1 16.9 16.7 13.9 16.2 16.9 16.425 to 29 years 8.3 7.8 9.6 10.9 11.7 11.8 11.9 14.1 12.6 12.630 to 34 years 3.8 4.3 4.2 4.9 6.9 7.2 5.8 6.0 8.6 7.4
35 to 39 years 2.4 2.1 1.6 2.9 2.7 2.8 2.7 3.8 3.8 4.340 years and over 0.8 0.6 1.0 0.5 0.5 0.7 0.7 1.4 x 1.9Unknown age group ... ... ... ... ... ... ... ... ... ...
Fetal loss 4
All ages 2.3 2.1 1.9 1.5 1.1 1.1 0.9 1.0 0.9 1.1Under 20 years 1.3 1.6 1.2 1.3 0.5 0.6 0.4 0.5 0.5 0.6
Under 15 years 0.2 0.2 0.0 0.0 0.3 0.0 0.0 0.0 0.0 0.015 to 19 years 1.6 1.9 1.4 1.6 0.6 0.7 0.5 0.6 0.6 0.8
15 to 17 years 1.0 1.1 0.9 1.2 0.3 0.5 0.2 0.7 0.3 0.418 to 19 years 2.3 3.0 2.2 2.1 1.0 1.0 0.9 0.5 1.1 1.3
20 to 24 years 3.5 3.8 3.1 2.4 1.9 1.9 1.1 2.1 1.2 1.225 to 29 years 5.3 4.5 3.9 3.0 2.5 2.9 2.1 1.9 2.1 2.630 to 34 years 3.7 3.4 2.4 2.8 2.0 1.9 1.9 2.3 1.8 2.135 to 39 years 1.1 1.4 2.1 1.0 1.1 0.6 1.1 0.5 0.6 1.140 years and over 0.7 0.3 0.6 0.4 0.3 0.4 0.4 0.1 0.5 0.3Unknown age group ... ... ... ... ... ... ... ... ... ...
1. Pregnancies equal the sum of live births, fetal loss and induced abortions.
2. Live birth counts are based on registrations in the Birth Database.
3. Induced abortion counts are taken from the Therapeutic Abortion Survey that collects information on abortions performed in hospitals and clinics in Canada, as
well as on abortions performed on Canadian residents in selected American states, for data years prior to 2004.
4. Fetal loss is the sum of stillbirth registrations in the Stillbirth Database and cases of miscarriages, illegal abortions and unspecified abortions reported in
the Hospital Morbidity Database.Note(s): See "Data quality, concepts and methodology — Explanatory notes for the tables " section.Source(s): Statistics Canada, Canadian Vital Statistics, Birth Database and Stillbirth Database; Canadian Institute for Health Information, Hospital Morbidity
Database and Therapeutic Abortion Database (CANSIM table 106-9002).
12 Statistics Canada – Catalogue no. 82-224-X

8/12/2019 Canadian Stats
http://slidepdf.com/reader/full/canadian-stats 15/49
Pregnancy Outcomes – 2005
Table 1-3
Selected pregnancy outcomes statistics, by age group and place of residence of females — Prince Edward Island
1996 1997 1998 1999 2000 2001 2002 2003 2004 2005
number of events
Total, pregnancies 1
All ages 1,956 1,804 1,698 1,702 1,643 1,594 1,498 1,597 1,561 1,503Under 20 years 192 179 182 148 156 123 122 119 112 99
Under 15 years 2 1 1 0 1 2 0 0 1 015 to 19 years 190 178 181 148 155 121 122 119 111 99
15 to 17 years 71 56 67 50 56 36 32 45 34 1918 to 19 years 119 122 114 98 99 85 90 74 77 80
20 to 24 years 448 421 398 402 396 349 305 344 320 34725 to 29 years 609 562 492 514 475 504 459 489 480 46230 to 34 years 501 427 402 412 406 425 401 427 421 40935 to 39 years 185 174 192 198 176 160 177 183 186 15840 years and over 21 41 32 28 34 33 34 35 42 27Unknown age group 0 0 0 0 0 0 0 0 0 1
Live births 2
All ages 1,694 1,591 1,504 1,515 1,441 1,380 1,328 1,417 1,390 1,340Under 20 years 146 x x x x x x x x 80
Under 15 years 0 x x x x x x x x 015 to 19 years 146 143 148 112 120 86 89 95 83 80
15 to 17 years 52 42 52 36 43 24 20 36 25 1418 to 19 years 94 101 96 76 77 62 69 59 58 66
20 to 24 years 372 359 342 349 335 289 260 290 263 29825 to 29 years 549 511 447 474 430 455 422 445 446 41930 to 34 years 452 395 374 380 376 385 372 396 390 38535 to 39 years 160 151 169 178 152 138 158 164 172 13640 years and over 15 x x x x x x x x 21Unknown age group 0 0 0 0 0 0 0 0 0 1
Induced abortions 3
All ages 190 150 149 145 158 174 130 137 143 126Under 20 years 36 x x x x x x x x 17
Under 15 years 2 x x x x x x x x 015 to 19 years 34 28 28 29 29 32 27 19 25 17
15 to 17 years 13 11 11 10 10 11 9 7 8 x18 to 19 years 21 17 17 19 19 21 18 12 17 x
20 to 24 years 59 46 46 43 49 54 39 43 50 4525 to 29 years 39 31 28 28 33 36 25 31 28 2930 to 34 years 30 23 21 24 23 28 21 23 24 1535 to 39 years 21 16 18 16 18 17 13 15 12 x
40 years and over 5 x x x x x x x x xUnknown age group 0 0 0 0 0 0 0 0 0 0
Fetal loss 4
All ages 72 63 45 42 44 40 40 43 28 37Under 20 years 10 x x x x x x x x 2
Under 15 years 0 x x x x x x x x 015 to 19 years 10 7 5 7 6 3 6 5 3 2
15 to 17 years 6 3 4 4 3 1 3 2 1 x18 to 19 years 4 4 1 3 3 2 3 3 2 x
20 to 24 years 17 16 10 10 12 6 6 11 7 425 to 29 years 21 20 17 12 12 13 12 13 6 1430 to 34 years 19 9 7 8 7 12 8 8 7 935 to 39 years 4 7 5 4 6 5 6 4 2 x40 years and over 1 x x x x x x x x xUnknown age group 0 0 0 0 0 0 0 0 0 0
See footnotes at the end of the table.
Statistics Canada – Catalogue no. 82-224-X 13

8/12/2019 Canadian Stats
http://slidepdf.com/reader/full/canadian-stats 16/49
Pregnancy Outcomes – 2005
Table 1-3 – continued
Selected pregnancy outcomes statistics, by age group and place of residence of females — Prince Edward Island
1996 1997 1998 1999 2000 2001 2002 2003 2004 2005
rate per 1,000 females
Total, pregnancies 1
All ages 55.9 51.5 48.9 49.1 47.7 46.3 43.4 46.4 44.1 43.8Under 20 years 32.5 30.2 30.6 25.0 25.9 20.2 20.2 19.5 18.3 16.1
Under 15 years 2.0 1.0 1.0 0.0 1.0 2.0 0.0 0.0 1.0 0.015 to 19 years 38.8 36.2 36.6 30.0 31.1 23.9 24.1 23.4 21.8 19.3
15 to 17 years 24.3 19.1 22.3 16.4 18.8 11.9 10.4 14.7 11.2 6.318 to 19 years 60.2 61.7 58.7 51.6 49.5 41.7 45.4 36.8 37.2 37.9
20 to 24 years 96.2 90.7 87.5 89.2 88.1 77.0 65.9 72.5 66.5 71.725 to 29 years 134.7 124.0 111.6 115.5 110.2 121.0 111.7 116.1 112.1 105.430 to 34 years 93.7 82.4 81.6 88.2 90.1 95.3 90.2 97.0 95.0 92.435 to 39 years 33.6 31.6 34.4 34.8 31.5 29.5 33.4 36.9 39.9 35.440 years and over 4.2 7.8 6.0 5.2 6.1 5.9 6.1 6.3 7.4 4.9Unknown age group ... ... ... ... ... ... ... ... ... ...
Live births 2
All ages 48.5 45.4 43.3 43.7 41.8 40.1 38.4 41.2 39.3 39.1Under 20 years 24.7 x x x x x x x x 13.0
Under 15 years 0.0 x x x x x x x x 0.015 to 19 years 29.8 29.1 29.9 22.7 24.1 17.0 17.6 18.7 16.3 15.6
15 to 17 years 17.8 14.3 17.3 11.8 14.4 7.9 6.5 11.7 8.2 4.6
18 to 19 years 47.5 51.1 49.5 40.0 38.5 30.5 34.8 29.4 28.0 31.320 to 24 years 79.9 77.4 75.2 77.5 74.5 63.7 56.2 61.1 54.7 61.525 to 29 years 121.4 112.8 101.4 106.5 99.8 109.3 102.7 105.7 104.2 95.630 to 34 years 84.6 76.2 75.9 81.4 83.4 86.3 83.7 89.9 88.0 87.035 to 39 years 29.1 27.4 30.2 31.3 27.2 25.5 29.8 33.1 36.9 30.540 years and over 3.0 x x x x x x x x 3.8Unknown age group ... ... ... ... ... ... ... ... ... ...
Induced abortions 3
All ages 5.4 4.3 4.3 4.2 4.6 5.1 3.8 4.0 4.0 3.7Under 20 years 6.1 x x x x x x x x 2.8
Under 15 years 2.0 x x x x x x x x 0.015 to 19 years 6.9 5.7 5.7 5.9 5.8 6.3 5.3 3.7 4.9 3.3
15 to 17 years 4.5 3.7 3.7 3.3 3.4 3.6 2.9 2.3 2.6 x18 to 19 years 10.6 8.6 8.8 10.0 9.5 10.3 9.1 6.0 8.2 x
20 to 24 years 12.7 9.9 10.1 9.5 10.9 11.9 8.4 9.1 10.4 9.325 to 29 years 8.6 6.8 6.4 6.3 7.7 8.6 6.1 7.4 6.5 6.630 to 34 years 5.6 4.4 4.3 5.1 5.1 6.3 4.7 5.2 5.4 3.435 to 39 years 3.8 2.9 3.2 2.8 3.2 3.1 2.5 3.0 2.6 x40 years and over 1.0 x x x x x x x x x
Unknown age group ... ... ... ... ... ... ... ... ... ...
Fetal loss 4
All ages 2.1 1.8 1.3 1.2 1.3 1.2 1.2 1.2 0.8 1.1Under 20 years 1.7 x x x x x x x x 0.3
Under 15 years 0.0 x x x x x x x x 0.015 to 19 years 2.0 1.4 1.0 1.4 1.2 0.6 1.2 1.0 0.6 0.4
15 to 17 years 2.1 1.0 1.3 1.3 1.0 0.3 1.0 0.7 0.3 x18 to 19 years 2.0 2.0 0.5 1.6 1.5 1.0 1.5 1.5 1.0 x
20 to 24 years 3.7 3.4 2.2 2.2 2.7 1.3 1.3 2.3 1.5 0.825 to 29 years 4.6 4.4 3.9 2.7 2.8 3.1 2.9 3.1 1.4 3.230 to 34 years 3.6 1.7 1.4 1.7 1.6 2.7 1.8 1.8 1.6 2.035 to 39 years 0.7 1.3 0.9 0.7 1.1 0.9 1.1 0.8 0.4 x40 years and over 0.2 x x x x x x x x xUnknown age group ... ... ... ... ... ... ... ... ... ...
1. Pregnancies equal the sum of live births, fetal loss and induced abortions.
2. Live birth counts are based on registrations in the Birth Database.
3. Induced abortion counts are taken from the Therapeutic Abortion Survey that collects information on abortions performed in hospitals and clinics in Canada, as
well as on abortions performed on Canadian residents in selected American states, for data years prior to 2004.4. Fetal loss is the sum of stillbirth registrations in the Stillbirth Database and cases of miscarriages, illegal abortions and unspecified abortions reported in
the Hospital Morbidity Database.Note(s): See "Data quality, concepts and methodology — Explanatory notes for the tables " section.Source(s): Statistics Canada, Canadian Vital Statistics, Birth Database and Stillbirth Database; Canadian Institute for Health Information, Hospital Morbidity
Database and Therapeutic Abortion Database (CANSIM table 106-9002).
14 Statistics Canada – Catalogue no. 82-224-X

8/12/2019 Canadian Stats
http://slidepdf.com/reader/full/canadian-stats 17/49
Pregnancy Outcomes – 2005
Table 1-4
Selected pregnancy outcomes statistics, by age group and place of residence of females — Nova Scotia
1996 1997 1998 1999 2000 2001 2002 2003 2004 2005
number of events
Total, pregnancies 1
All ages 12,913 12,234 11,842 11,645 11,226 10,920 10,634 10,684 10,753 10,568Under 20 years 1,374 1,224 1,261 1,134 995 885 879 854 789 748
Under 15 years 35 14 25 19 13 15 15 13 10 1015 to 19 years 1,339 1,210 1,236 1,115 982 870 864 841 779 738
15 to 17 years 512 451 441 382 347 284 290 261 269 25418 to 19 years 827 759 795 733 635 586 574 580 510 484
20 to 24 years 3,133 2,950 2,790 2,734 2,635 2,451 2,456 2,412 2,360 2,36525 to 29 years 3,803 3,702 3,537 3,489 3,371 3,212 3,043 3,050 3,085 3,08330 to 34 years 3,238 2,996 2,895 2,825 2,757 2,915 2,700 2,886 2,917 2,88435 to 39 years 1,182 1,184 1,154 1,257 1,225 1,234 1,298 1,229 1,327 1,22840 years and over 173 175 198 201 242 221 257 251 274 259Unknown age group 10 4 7 5 1 2 1 2 1 1
Live births 2
All ages 10,573 9,952 9,595 9,575 9,116 8,909 8,663 8,650 8,734 8,557Under 20 years 883 744 751 687 585 507 517 473 448 414
Under 15 years 12 6 4 3 4 8 5 6 2 615 to 19 years 871 738 747 684 581 499 512 467 446 408
15 to 17 years 327 251 240 204 193 153 148 122 138 12518 to 19 years 544 487 507 480 388 346 364 345 308 283
20 to 24 years 2,320 2,168 2,050 2,002 1,893 1,735 1,759 1,702 1,698 1,65225 to 29 years 3,309 3,196 3,047 3,066 2,906 2,771 2,599 2,612 2,612 2,64630 to 34 years 2,939 2,720 2,602 2,572 2,497 2,650 2,453 2,612 2,640 2,60035 to 39 years 996 998 994 1,091 1,061 1,077 1,136 1,067 1,146 1,04840 years and over 123 124 144 152 173 167 198 182 189 196Unknown age group 3 2 7 5 1 2 1 2 1 1
Induced abortions 3
All ages 2,039 2,045 2,053 1,917 1,989 1,890 1,825 1,925 1,905 1,897Under 20 years 467 458 498 431 403 371 350 376 336 x
Under 15 years 22 8 21 14 9 7 9 7 8 x15 to 19 years 445 450 477 417 394 364 341 369 328 321
15 to 17 years 172 187 195 171 151 128 139 138 129 12618 to 19 years 273 263 282 246 243 236 202 231 199 195
20 to 24 years 736 729 707 703 724 693 658 691 637 69125 to 29 years 423 417 431 390 425 409 418 412 434 40430 to 34 years 230 232 243 219 235 230 214 241 254 25435 to 39 years 138 165 131 134 143 136 135 145 166 164
40 years and over 38 42 43 40 59 51 50 60 78 xUnknown age group 7 2 0 0 0 0 0 0 0 0
Fetal loss 4
All ages 301 237 194 153 121 121 146 109 114 114Under 20 years 24 22 12 16 7 7 12 5 5 x
Under 15 years 1 0 0 2 0 0 1 0 0 x15 to 19 years 23 22 12 14 7 7 11 5 5 9
15 to 17 years 13 13 6 7 3 3 3 1 2 318 to 19 years 10 9 6 7 4 4 8 4 3 6
20 to 24 years 77 53 33 29 18 23 39 19 25 2225 to 29 years 71 89 59 33 40 32 26 26 39 3330 to 34 years 69 44 50 34 25 35 33 33 23 3035 to 39 years 48 21 29 32 21 21 27 17 15 1640 years and over 12 9 11 9 10 3 9 9 7 xUnknown age group 0 0 0 0 0 0 0 0 0 0
See footnotes at the end of the table.
Statistics Canada – Catalogue no. 82-224-X 15

8/12/2019 Canadian Stats
http://slidepdf.com/reader/full/canadian-stats 18/49
Pregnancy Outcomes – 2005
Table 1-4 – continued
Selected pregnancy outcomes statistics, by age group and place of residence of females — Nova Scotia
1996 1997 1998 1999 2000 2001 2002 2003 2004 2005
rate per 1,000 females
Total, pregnancies 1
All ages 52.2 49.8 48.6 48.0 46.6 45.7 44.7 45.0 44.4 45.2Under 20 years 36.9 32.9 34.0 30.6 27.0 24.1 23.9 23.1 21.3 20.4
Under 15 years 5.8 2.3 4.1 3.1 2.1 2.5 2.5 2.1 1.6 1.715 to 19 years 43.0 38.9 39.9 36.1 31.9 28.4 28.1 27.2 25.3 24.0
15 to 17 years 27.3 24.3 24.0 20.9 18.9 15.4 15.8 14.2 14.7 13.918 to 19 years 66.6 60.8 63.2 58.1 51.2 48.0 46.3 46.2 40.7 38.9
20 to 24 years 97.3 94.2 91.2 89.8 86.3 80.2 79.8 77.2 75.5 75.925 to 29 years 115.8 114.3 110.9 110.0 108.3 106.5 103.2 104.7 105.5 105.330 to 34 years 82.1 79.0 80.0 82.3 84.2 91.1 84.6 91.5 93.1 93.935 to 39 years 29.2 29.1 28.4 30.8 30.3 31.6 34.8 34.2 38.8 37.540 years and over 4.7 4.6 5.1 5.1 6.1 5.6 6.4 6.2 6.8 6.4Unknown age group ... ... ... ... ... ... ... ... ... ...
Live births 2
All ages 42.7 40.5 39.4 39.5 37.8 37.3 36.4 36.4 36.1 36.6Under 20 years 23.7 20.0 20.2 18.6 15.9 13.8 14.0 12.8 12.1 11.3
Under 15 years 2.0 1.0 0.7 0.5 0.7 1.3 0.8 1.0 0.3 1.015 to 19 years 28.0 23.8 24.1 22.1 18.9 16.3 16.6 15.1 14.5 13.3
15 to 17 years 17.5 13.5 13.0 11.1 10.5 8.3 8.0 6.7 7.6 6.8
18 to 19 years 43.8 39.0 40.3 38.1 31.3 28.4 29.4 27.5 24.6 22.820 to 24 years 72.1 69.2 67.0 65.8 62.0 56.8 57.1 54.5 54.3 53.025 to 29 years 100.7 98.7 95.5 96.7 93.3 91.9 88.1 89.6 89.3 90.430 to 34 years 74.5 71.7 71.9 74.9 76.2 82.8 76.9 82.8 84.3 84.635 to 39 years 24.6 24.5 24.4 26.7 26.3 27.6 30.4 29.7 33.5 32.040 years and over 3.3 3.3 3.7 3.9 4.4 4.2 4.9 4.5 4.7 4.9Unknown age group ... ... ... ... ... ... ... ... ... ...
Induced abortions 3
All ages 8.2 8.3 8.4 7.9 8.2 7.9 7.7 8.1 7.9 8.1Under 20 years 12.6 12.3 13.4 11.6 10.9 10.1 9.5 10.2 9.1 x
Under 15 years 3.6 1.3 3.4 2.3 1.5 1.2 1.5 1.2 1.3 x15 to 19 years 14.3 14.5 15.4 13.5 12.8 11.9 11.1 12.0 10.6 10.4
15 to 17 years 9.2 10.1 10.6 9.3 8.2 6.9 7.6 7.5 7.1 6.918 to 19 years 22.0 21.1 22.4 19.5 19.6 19.3 16.3 18.4 15.9 15.7
20 to 24 years 22.9 23.3 23.1 23.1 23.7 22.7 21.4 22.1 20.4 22.225 to 29 years 12.9 12.9 13.5 12.3 13.6 13.6 14.2 14.1 14.8 13.830 to 34 years 5.8 6.1 6.7 6.4 7.2 7.2 6.7 7.6 8.1 8.335 to 39 years 3.4 4.1 3.2 3.3 3.5 3.5 3.6 4.0 4.9 5.040 years and over 1.0 1.1 1.1 1.0 1.5 1.3 1.2 1.5 1.9 x
Unknown age group ... ... ... ... ... ... ... ... ... ...
Fetal loss 4
All ages 1.2 1.0 0.8 0.6 0.5 0.5 0.6 0.5 0.5 0.5Under 20 years 0.6 0.6 0.3 0.4 0.2 0.2 0.3 0.1 0.1 x
Under 15 years 0.2 0.0 0.0 0.3 0.0 0.0 0.2 0.0 0.0 x15 to 19 years 0.7 0.7 0.4 0.5 0.2 0.2 0.4 0.2 0.2 0.3
15 to 17 years 0.7 0.7 0.3 0.4 0.2 0.2 0.2 0.1 0.1 0.218 to 19 years 0.8 0.7 0.5 0.6 0.3 0.3 0.6 0.3 0.2 0.5
20 to 24 years 2.4 1.7 1.1 1.0 0.6 0.8 1.3 0.6 0.8 0.725 to 29 years 2.2 2.7 1.8 1.0 1.3 1.1 0.9 0.9 1.3 1.130 to 34 years 1.7 1.2 1.4 1.0 0.8 1.1 1.0 1.0 0.7 1.035 to 39 years 1.2 0.5 0.7 0.8 0.5 0.5 0.7 0.5 0.4 0.540 years and over 0.3 0.2 0.3 0.2 0.3 0.1 0.2 0.2 0.2 xUnknown age group ... ... ... ... ... ... ... ... ... ...
1. Pregnancies equal the sum of live births, fetal loss and induced abortions.
2. Live birth counts are based on registrations in the Birth Database.
3. Induced abortion counts are taken from the Therapeutic Abortion Survey that collects information on abortions performed in hospitals and clinics in Canada, as
well as on abortions performed on Canadian residents in selected American states, for data years prior to 2004.4. Fetal loss is the sum of stillbirth registrations in the Stillbirth Database and cases of miscarriages, illegal abortions and unspecified abortions reported in
the Hospital Morbidity Database.Note(s): See "Data quality, concepts and methodology — Explanatory notes for the tables " section.Source(s): Statistics Canada, Canadian Vital Statistics, Birth Database and Stillbirth Database; Canadian Institute for Health Information, Hospital Morbidity
Database and Therapeutic Abortion Database (CANSIM table 106-9002).
16 Statistics Canada – Catalogue no. 82-224-X

8/12/2019 Canadian Stats
http://slidepdf.com/reader/full/canadian-stats 19/49
Pregnancy Outcomes – 2005
Table 1-5
Selected pregnancy outcomes statistics, by age group and place of residence of females — New Brunswick
1996 1997 1998 1999 2000 2001 2002 2003 2004 2005
number of events
Total, pregnancies 1
All ages 9,628 9,393 9,254 8,956 8,694 8,417 8,286 8,214 8,058 7,987Under 20 years 968 902 968 902 847 766 711 647 583 552
Under 15 years 7 18 13 17 8 11 13 12 2 515 to 19 years 961 884 955 885 839 755 698 635 581 547
15 to 17 years 318 303 312 293 269 238 202 184 192 16218 to 19 years 643 581 643 592 570 517 496 451 389 385
20 to 24 years 2,568 2,531 2,364 2,301 2,276 2,148 2,003 1,981 1,932 1,90725 to 29 years 2,996 3,026 2,998 2,888 2,772 2,699 2,649 2,668 2,555 2,56330 to 34 years 2,261 2,161 2,056 2,051 1,936 1,960 2,029 2,012 2,054 2,09335 to 39 years 701 636 754 714 758 740 751 761 791 73440 years and over 114 119 114 100 105 104 143 145 143 134Unknown age group 20 18 0 0 0 0 0 0 0 4
Live births 2
All ages 8,176 7,922 7,885 7,615 7,347 7,195 7,046 7,117 6,959 6,892Under 20 years 700 657 676 598 557 501 458 453 413 388
Under 15 years 2 8 8 5 3 0 3 3 1 215 to 19 years 698 649 668 593 554 501 455 450 412 386
15 to 17 years 216 217 195 181 140 140 114 128 121 10718 to 19 years 482 432 473 412 414 361 341 322 291 279
20 to 24 years 2,061 2,024 1,870 1,842 1,795 1,702 1,586 1,568 1,565 1,50025 to 29 years 2,697 2,659 2,720 2,620 2,496 2,446 2,356 2,419 2,309 2,33230 to 34 years 2,045 1,958 1,891 1,852 1,768 1,804 1,878 1,868 1,885 1,91135 to 39 years 601 548 654 632 660 662 662 699 680 65340 years and over 72 76 74 71 71 80 106 110 107 104Unknown age group 0 0 0 0 0 0 0 0 0 4
Induced abortions 3
All ages 1,120 1,113 1,106 1,031 1,098 1,028 1,045 944 920 941Under 20 years 234 204 258 261 x 248 236 181 x x
Under 15 years 5 9 5 11 x 11 10 8 x x15 to 19 years 229 195 253 250 255 237 226 173 157 152
15 to 17 years 92 73 98 88 117 93 82 55 68 5218 to 19 years 137 122 155 162 138 144 144 118 89 100
20 to 24 years 428 416 422 382 418 396 363 395 327 36925 to 29 years 207 247 210 199 200 200 235 195 194 17930 to 34 years 134 134 105 112 125 102 116 103 123 14335 to 39 years 66 65 76 55 72 63 66 45 86 67
40 years and over 31 29 35 22 x 19 29 25 x xUnknown age group 20 18 0 0 0 0 0 0 0 0
Fetal loss 4
All ages 332 358 263 310 249 194 195 153 179 154Under 20 years 34 41 34 43 x 17 17 13 12 x
Under 15 years 0 1 0 1 x 0 0 1 0 x15 to 19 years 34 40 34 42 30 17 17 12 12 9
15 to 17 years 10 13 19 24 12 5 6 1 3 318 to 19 years 24 27 15 18 18 12 11 11 9 6
20 to 24 years 79 91 72 77 63 50 54 18 40 3825 to 29 years 92 120 68 69 76 53 58 54 52 5230 to 34 years 82 69 60 87 43 54 35 41 46 3935 to 39 years 34 23 24 27 26 15 23 17 25 1440 years and over 11 14 5 7 x 5 8 10 4 xUnknown age group 0 0 0 0 0 0 0 0 0 0
See footnotes at the end of the table.
Statistics Canada – Catalogue no. 82-224-X 17

8/12/2019 Canadian Stats
http://slidepdf.com/reader/full/canadian-stats 20/49
Pregnancy Outcomes – 2005
Table 1-5 – continued
Selected pregnancy outcomes statistics, by age group and place of residence of females — New Brunswick
1996 1997 1998 1999 2000 2001 2002 2003 2004 2005
rate per 1,000 females
Total, pregnancies 1
All ages 47.9 47.0 46.8 45.6 44.6 43.5 43.2 43.2 41.7 42.8Under 20 years 31.2 29.4 31.9 29.8 28.1 25.8 24.2 22.2 20.2 19.3
Under 15 years 1.4 3.5 2.6 3.4 1.6 2.3 2.8 2.5 0.4 1.115 to 19 years 36.9 34.6 37.8 35.0 33.3 30.2 28.3 26.0 24.2 23.0
15 to 17 years 20.6 19.8 20.7 19.5 17.8 15.8 13.8 12.9 13.7 11.418 to 19 years 60.7 56.6 63.3 58.0 56.8 52.2 49.1 44.6 39.0 40.0
20 to 24 years 95.6 95.8 92.1 91.4 91.7 86.8 81.9 80.9 78.2 77.725 to 29 years 113.8 115.7 115.8 112.3 109.2 108.9 108.0 110.3 106.9 108.330 to 34 years 72.0 71.4 71.0 74.0 72.9 75.7 79.0 79.0 81.2 83.835 to 39 years 22.0 19.9 23.6 22.3 23.8 23.7 25.0 26.4 28.7 27.840 years and over 3.7 3.8 3.6 3.2 3.3 3.3 4.5 4.6 4.5 4.2Unknown age group ... ... ... ... ... ... ... ... ... ...
Live births 2
All ages 40.7 39.7 39.9 38.8 37.7 37.2 36.7 37.4 36.0 37.0Under 20 years 22.5 21.4 22.3 19.8 18.5 16.9 15.6 15.6 14.3 13.6
Under 15 years 0.4 1.6 1.6 1.0 0.6 0.0 0.6 0.6 0.2 0.415 to 19 years 26.8 25.4 26.4 23.5 22.0 20.1 18.4 18.5 17.1 16.2
15 to 17 years 14.0 14.2 12.9 12.0 9.2 9.3 7.8 9.0 8.6 7.5
18 to 19 years 45.5 42.1 46.6 40.4 41.3 36.4 33.8 31.8 29.1 29.020 to 24 years 76.7 76.6 72.8 73.1 72.4 68.8 64.8 64.0 63.4 61.125 to 29 years 102.5 101.7 105.0 101.9 98.4 98.7 96.0 100.0 96.6 98.630 to 34 years 65.1 64.7 65.3 66.8 66.6 69.6 73.1 73.3 74.6 76.535 to 39 years 18.8 17.1 20.5 19.7 20.7 21.2 22.0 24.2 24.7 24.740 years and over 2.4 2.4 2.4 2.3 2.3 2.5 3.3 3.5 3.3 3.3Unknown age group ... ... ... ... ... ... ... ... ... ...
Induced abortions 3
All ages 5.6 5.6 5.6 5.3 5.6 5.3 5.4 5.0 4.8 5.0Under 20 years 7.5 6.7 8.5 8.6 x 8.4 8.0 6.2 x x
Under 15 years 1.0 1.8 1.0 2.2 x 2.3 2.2 1.7 x x15 to 19 years 8.8 7.6 10.0 9.9 10.1 9.5 9.2 7.1 6.5 6.4
15 to 17 years 6.0 4.8 6.5 5.8 7.7 6.2 5.6 3.9 4.8 3.718 to 19 years 12.9 11.9 15.3 15.9 13.8 14.5 14.3 11.7 8.9 10.4
20 to 24 years 15.9 15.7 16.4 15.2 16.8 16.0 14.8 16.1 13.2 15.025 to 29 years 7.9 9.4 8.1 7.7 7.9 8.1 9.6 8.1 8.1 7.630 to 34 years 4.3 4.4 3.6 4.0 4.7 3.9 4.5 4.0 4.9 5.735 to 39 years 2.1 2.0 2.4 1.7 2.3 2.0 2.2 1.6 3.1 2.540 years and over 1.0 0.9 1.1 0.7 x 0.6 0.9 0.8 x x
Unknown age group ... ... ... ... ... ... ... ... ... ...
Fetal loss 4
All ages 1.7 1.8 1.3 1.6 1.3 1.0 1.0 0.8 0.9 0.8Under 20 years 1.1 1.3 1.1 1.4 x 0.6 0.6 0.4 0.4 x
Under 15 years 0.0 0.2 0.0 0.2 x 0.0 0.0 0.2 0.0 x15 to 19 years 1.3 1.6 1.3 1.7 1.2 0.7 0.7 0.5 0.5 0.4
15 to 17 years 0.6 0.9 1.3 1.6 0.8 0.3 0.4 0.1 0.2 0.218 to 19 years 2.3 2.6 1.5 1.8 1.8 1.2 1.1 1.1 0.9 0.6
20 to 24 years 2.9 3.4 2.8 3.1 2.5 2.0 2.2 0.7 1.6 1.525 to 29 years 3.5 4.6 2.6 2.7 3.0 2.1 2.4 2.2 2.2 2.230 to 34 years 2.6 2.3 2.1 3.1 1.6 2.1 1.4 1.6 1.8 1.635 to 39 years 1.1 0.7 0.8 0.8 0.8 0.5 0.8 0.6 0.9 0.540 years and over 0.4 0.5 0.2 0.2 x 0.2 0.3 0.3 0.1 xUnknown age group ... ... ... ... ... ... ... ... ... ...
1. Pregnancies equal the sum of live births, fetal loss and induced abortions.
2. Live birth counts are based on registrations in the Birth Database.
3. Induced abortion counts are taken from the Therapeutic Abortion Survey that collects information on abortions performed in hospitals and clinics in Canada, as
well as on abortions performed on Canadian residents in selected American states, for data years prior to 2004.4. Fetal loss is the sum of stillbirth registrations in the Stillbirth Database and cases of miscarriages, illegal abortions and unspecified abortions reported in
the Hospital Morbidity Database.Note(s): See "Data quality, concepts and methodology — Explanatory notes for the tables " section.Source(s): Statistics Canada, Canadian Vital Statistics, Birth Database and Stillbirth Database; Canadian Institute for Health Information, Hospital Morbidity
Database and Therapeutic Abortion Database (CANSIM table 106-9002).
18 Statistics Canada – Catalogue no. 82-224-X

8/12/2019 Canadian Stats
http://slidepdf.com/reader/full/canadian-stats 21/49
Pregnancy Outcomes – 2005
Table 1-6
Selected pregnancy outcomes statistics, by age group and place of residence of females — Quebec
1996 1997 1998 1999 2000 2001 2002 2003 2004 2005
number of events
Total, pregnancies 1
All ages 117,470 112,746 109,735 106,429 105,157 106,496 105,097 106,350 106,301 107,169Under 20 years 9,682 9,329 9,768 9,770 9,368 8,832 8,356 7,847 7,746 7,547
Under 15 years 190 219 149 201 169 156 115 124 155 12915 to 19 years 9,492 9,110 9,619 9,569 9,199 8,676 8,241 7,723 7,591 7,418
15 to 17 years 3,030 2,915 3,155 2,655 2,656 2,516 2,428 2,291 2,436 2,34618 to 19 years 6,462 6,195 6,464 6,914 6,543 6,160 5,813 5,432 5,155 5,072
20 to 24 years 25,700 25,393 25,133 24,397 24,681 24,215 23,545 23,219 22,363 21,64225 to 29 years 36,327 33,906 32,537 31,557 31,027 32,096 31,974 33,327 33,470 34,49130 to 34 years 30,937 29,398 27,448 25,913 25,179 26,142 25,998 26,265 27,235 27,59535 to 39 years 12,509 12,301 12,303 12,225 12,129 12,408 12,363 12,736 12,437 12,73840 years and over 2,279 2,415 2,523 2,565 2,767 2,802 2,856 2,955 3,050 3,150Unknown age group 36 4 23 2 6 1 5 1 0 0
Live births 2
All ages 85,226 79,774 75,856 73,596 72,007 73,695 72,477 73,905 74,072 76,346Under 20 years 4,008 3,780 3,613 3,482 3,202 3,078 2,795 2,562 2,330 2,349
Under 15 years 46 35 34 25 19 21 20 16 24 1515 to 19 years 3,962 3,745 3,579 3,457 3,183 3,057 2,775 2,546 2,306 2,334
15 to 17 years 1,020 1,018 948 855 760 741 675 597 520 54418 to 19 years 2,942 2,727 2,631 2,602 2,423 2,316 2,100 1,949 1,786 1,790
20 to 24 years 16,733 15,779 15,241 14,776 14,696 14,430 13,877 13,408 12,603 12,65425 to 29 years 29,182 26,760 25,437 24,656 24,231 25,165 24,945 26,216 26,231 27,35230 to 34 years 25,091 23,556 21,697 20,601 19,894 20,785 20,798 21,046 22,120 22,77935 to 39 years 8,972 8,671 8,526 8,739 8,530 8,753 8,553 9,068 9,096 9,35640 years and over 1,227 1,227 1,336 1,341 1,452 1,483 1,509 1,605 1,692 1,856Unknown age group 13 1 6 1 2 1 0 0 0 0
Induced abortions 3
All ages 28,852 30,248 31,673 30,722 31,125 31,065 30,858 30,802 30,616 29,259Under 20 years 5,416 5,360 5,981 6,135 6,001 5,654 5,456 5,191 5,326 5,116
Under 15 years 138 177 111 175 149 134 92 107 129 11215 to 19 years 5,278 5,183 5,870 5,960 5,852 5,520 5,364 5,084 5,197 5,004
15 to 17 years 1,917 1,827 2,137 1,753 1,845 1,751 1,723 1,658 1,889 1,77718 to 19 years 3,361 3,356 3,733 4,207 4,007 3,769 3,641 3,426 3,308 3,227
20 to 24 years 8,342 9,085 9,490 9,251 9,630 9,459 9,351 9,533 9,494 8,76325 to 29 years 6,203 6,440 6,526 6,394 6,290 6,455 6,554 6,679 6,788 6,70830 to 34 years 4,955 5,139 5,206 4,749 4,789 4,904 4,788 4,804 4,677 4,39435 to 39 years 3,027 3,178 3,390 3,109 3,216 3,381 3,480 3,363 3,083 3,087
40 years and over 887 1,045 1,065 1,083 1,195 1,212 1,225 1,231 1,248 1,191Unknown age group 22 1 15 1 4 0 4 1 0 0
Fetal loss 4
All ages 3,392 2,724 2,206 2,111 2,025 1,736 1,762 1,643 1,613 1,564Under 20 years 258 189 174 153 165 100 105 94 90 82
Under 15 years 6 7 4 1 1 1 3 1 2 215 to 19 years 252 182 170 152 164 99 102 93 88 80
15 to 17 years 93 70 70 47 51 24 30 36 27 2518 to 19 years 159 112 100 105 113 75 72 57 61 55
20 to 24 years 625 529 402 370 355 326 317 278 266 22525 to 29 years 942 706 574 507 506 476 475 432 451 43130 to 34 years 891 703 545 563 496 453 412 415 438 42235 to 39 years 510 452 387 377 383 274 330 305 258 29540 years and over 165 143 122 141 120 107 122 119 110 103Unknown age group 1 2 2 0 0 0 1 0 0 0
See footnotes at the end of the table.
Statistics Canada – Catalogue no. 82-224-X 19

8/12/2019 Canadian Stats
http://slidepdf.com/reader/full/canadian-stats 22/49
Pregnancy Outcomes – 2005
Table 1-6 – continued
Selected pregnancy outcomes statistics, by age group and place of residence of females — Quebec
1996 1997 1998 1999 2000 2001 2002 2003 2004 2005
rate per 1,000 females
Total, pregnancies 1
All ages 61.0 58.8 57.6 56.1 55.6 56.5 55.8 56.6 55.2 57.2Under 20 years 33.4 32.5 34.3 34.7 34.0 32.7 31.3 29.4 28.6 27.4
Under 15 years 4.1 4.9 3.3 4.6 3.9 3.6 2.7 2.8 3.2 2.615 to 19 years 39.1 37.6 40.0 40.4 39.6 38.2 36.7 34.7 34.1 32.7
15 to 17 years 20.6 20.1 22.3 19.4 19.7 18.8 18.4 17.5 18.5 17.118 to 19 years 67.2 64.0 65.3 69.1 67.1 65.8 63.0 59.3 56.8 56.5
20 to 24 years 111.4 108.7 106.1 101.1 100.2 96.4 93.4 92.5 89.8 88.525 to 29 years 148.3 142.8 140.2 137.5 135.3 139.0 134.6 135.9 132.3 133.030 to 34 years 101.0 99.8 98.2 97.6 99.5 106.3 107.4 109.5 113.1 113.535 to 39 years 38.2 37.8 38.0 38.2 38.4 40.5 41.8 45.0 45.8 48.740 years and over 7.6 7.8 8.0 8.0 8.6 8.6 8.8 9.1 9.5 9.9Unknown age group ... ... ... ... ... ... ... ... ... ...
Live births 2
All ages 44.3 41.6 39.8 38.8 38.1 39.1 38.5 39.4 38.5 40.7Under 20 years 13.8 13.2 12.7 12.4 11.6 11.4 10.5 9.6 8.6 8.5
Under 15 years 1.0 0.8 0.8 0.6 0.4 0.5 0.5 0.4 0.5 0.315 to 19 years 16.3 15.5 14.9 14.6 13.7 13.4 12.4 11.4 10.4 10.3
15 to 17 years 6.9 7.0 6.7 6.2 5.7 5.5 5.1 4.6 3.9 4.0
18 to 19 years 30.6 28.2 26.6 26.0 24.8 24.8 22.8 21.3 19.7 19.920 to 24 years 72.5 67.5 64.3 61.2 59.7 57.4 55.1 53.4 50.6 51.825 to 29 years 119.1 112.7 109.6 107.4 105.7 109.0 105.0 106.9 103.6 105.530 to 34 years 81.9 79.9 77.6 77.6 78.6 84.5 86.0 87.8 91.9 93.735 to 39 years 27.4 26.6 26.3 27.3 27.0 28.6 28.9 32.0 33.5 35.840 years and over 4.1 4.0 4.3 4.2 4.5 4.6 4.6 4.9 5.3 5.8Unknown age group ... ... ... ... ... ... ... ... ... ...
Induced abortions 3
All ages 15.0 15.8 16.6 16.2 16.5 16.5 16.4 16.4 15.9 15.6Under 20 years 18.7 18.7 21.0 21.8 21.8 20.9 20.4 19.4 19.7 18.6
Under 15 years 3.0 3.9 2.5 4.0 3.4 3.1 2.1 2.4 2.7 2.315 to 19 years 21.7 21.4 24.4 25.1 25.2 24.3 23.9 22.8 23.3 22.1
15 to 17 years 13.0 12.6 15.1 12.8 13.7 13.1 13.0 12.7 14.3 13.018 to 19 years 35.0 34.7 37.7 42.0 41.1 40.3 39.5 37.4 36.4 35.9
20 to 24 years 36.2 38.9 40.1 38.3 39.1 37.7 37.1 38.0 38.1 35.825 to 29 years 25.3 27.1 28.1 27.9 27.4 28.0 27.6 27.2 26.8 25.930 to 34 years 16.2 17.4 18.6 17.9 18.9 19.9 19.8 20.0 19.4 18.135 to 39 years 9.2 9.8 10.5 9.7 10.2 11.0 11.8 11.9 11.4 11.840 years and over 3.0 3.4 3.4 3.4 3.7 3.7 3.8 3.8 3.9 3.7
Unknown age group ... ... ... ... ... ... ... ... ... ...
Fetal loss 4
All ages 1.8 1.4 1.2 1.1 1.1 0.9 0.9 0.9 0.8 0.8Under 20 years 0.9 0.7 0.6 0.5 0.6 0.4 0.4 0.4 0.3 0.3
Under 15 years 0.1 0.2 0.1 0.0 0.0 0.0 0.1 0.0 0.0 0.015 to 19 years 1.0 0.8 0.7 0.6 0.7 0.4 0.5 0.4 0.4 0.4
15 to 17 years 0.6 0.5 0.5 0.3 0.4 0.2 0.2 0.3 0.2 0.218 to 19 years 1.7 1.2 1.0 1.0 1.2 0.8 0.8 0.6 0.7 0.6
20 to 24 years 2.7 2.3 1.7 1.5 1.4 1.3 1.3 1.1 1.1 0.925 to 29 years 3.8 3.0 2.5 2.2 2.2 2.1 2.0 1.8 1.8 1.730 to 34 years 2.9 2.4 1.9 2.1 2.0 1.8 1.7 1.7 1.8 1.735 to 39 years 1.6 1.4 1.2 1.2 1.2 0.9 1.1 1.1 1.0 1.140 years and over 0.6 0.5 0.4 0.4 0.4 0.3 0.4 0.4 0.3 0.3Unknown age group ... ... ... ... ... ... ... ... ... ...
1. Pregnancies equal the sum of live births, fetal loss and induced abortions.
2. Live birth counts are based on registrations in the Birth Database.
3. Induced abortion counts are taken from the Therapeutic Abortion Survey that collects information on abortions performed in hospitals and clinics in Canada, as
well as on abortions performed on Canadian residents in selected American states, for data years prior to 2004.4. Fetal loss is the sum of stillbirth registrations in the Stillbirth Database and cases of miscarriages, illegal abortions and unspecified abortions reported in
the Hospital Morbidity Database.Note(s): See "Data quality, concepts and methodology — Explanatory notes for the tables " section.Source(s): Statistics Canada, Canadian Vital Statistics, Birth Database and Stillbirth Database; Canadian Institute for Health Information, Hospital Morbidity
Database and Therapeutic Abortion Database (CANSIM table 106-9002).
20 Statistics Canada – Catalogue no. 82-224-X

8/12/2019 Canadian Stats
http://slidepdf.com/reader/full/canadian-stats 23/49
Pregnancy Outcomes – 2005
Table 1-7
Selected pregnancy outcomes statistics, by age group and place of residence of females — Ontario
1996 1997 1998 1999 2000 2001 2002 2003 2004 2005
number of events
Total, pregnancies 1
All ages 191,606 181,064 178,663 174,502 170,142 173,477 169,476 170,457 170,285 169,838Under 20 years 16,197 14,686 14,473 13,325 12,905 12,324 11,762 11,096 10,018 9,620
Under 15 years 251 218 215 142 151 162 140 104 75 8415 to 19 years 15,946 14,468 14,258 13,183 12,754 12,162 11,622 10,992 9,943 9,536
15 to 17 years 5,972 5,401 5,264 4,729 4,499 4,307 4,049 3,624 3,165 2,99718 to 19 years 9,974 9,067 8,994 8,454 8,255 7,855 7,573 7,368 6,778 6,539
20 to 24 years 35,665 33,271 33,106 32,148 31,032 30,435 29,515 29,233 28,903 28,31925 to 29 years 54,763 51,308 49,673 48,320 46,372 47,124 45,911 46,247 46,323 46,29630 to 34 years 55,891 52,640 51,137 50,120 48,662 51,436 50,227 51,069 52,015 52,00535 to 39 years 24,299 24,330 25,029 25,287 25,588 26,414 26,173 26,549 26,422 26,91540 years and over 4,584 4,691 4,847 5,197 5,493 5,728 5,878 6,208 6,481 6,595Unknown age group 207 138 398 105 90 16 10 55 123 76
Live births 2
All ages 140,012 133,004 132,618 131,080 127,408 131,709 128,528 130,927 132,551 133,760Under 20 years 7,018 6,115 6,257 5,871 5,358 5,097 4,775 4,721 4,342 4,360
Under 15 years 51 48 39 35 42 26 20 15 21 2315 to 19 years 6,967 6,067 6,218 5,836 5,316 5,071 4,755 4,706 4,321 4,337
15 to 17 years 2,383 2,005 2,110 1,907 1,708 1,484 1,449 1,362 1,303 1,31218 to 19 years 4,584 4,062 4,108 3,929 3,608 3,587 3,306 3,344 3,018 3,025
20 to 24 years 21,327 19,760 20,084 19,463 18,899 18,418 17,744 17,722 17,810 17,61225 to 29 years 43,290 40,625 39,817 39,206 37,357 38,437 37,256 37,817 38,272 38,34530 to 34 years 46,685 44,372 43,271 42,821 41,511 44,365 43,383 44,506 45,648 46,09335 to 39 years 18,745 19,042 19,681 20,247 20,538 21,474 21,337 21,821 21,795 22,60640 years and over 2,762 2,967 3,112 3,367 3,655 3,906 4,024 4,286 4,563 4,670Unknown age group 185 123 396 105 90 12 9 54 121 74
Induced abortions 3
All ages 46,918 44,046 42,452 39,981 39,544 38,827 38,138 36,666 35,183 33,546Under 20 years 8,827 8,276 7,992 7,248 7,384 7,071 6,857 6,222 5,538 5,154
Under 15 years 190 163 172 106 107 135 118 84 51 6015 to 19 years 8,637 8,113 7,820 7,142 7,277 6,936 6,739 6,138 5,487 5,094
15 to 17 years 3,445 3,281 3,066 2,749 2,728 2,760 2,550 2,204 1,820 1,65018 to 19 years 5,192 4,832 4,754 4,393 4,549 4,176 4,189 3,934 3,667 3,444
20 to 24 years 13,568 12,878 12,466 12,172 11,623 11,592 11,387 11,105 10,762 10,37125 to 29 years 10,277 9,698 8,939 8,287 8,254 8,030 7,985 7,789 7,477 7,34830 to 34 years 7,907 7,134 6,874 6,317 6,275 6,245 6,053 5,769 5,651 5,20235 to 39 years 4,751 4,577 4,655 4,387 4,413 4,305 4,242 4,122 4,044 3,758
40 years and over 1,575 1,471 1,526 1,570 1,595 1,580 1,614 1,659 1,710 1,713Unknown age group 13 12 0 0 0 4 0 0 1 0
Fetal loss 4
All ages 4,676 4,014 3,593 3,441 3,190 2,941 2,810 2,864 2,551 2,532Under 20 years 352 295 224 206 163 156 130 153 138 106
Under 15 years 10 7 4 1 2 1 2 5 3 115 to 19 years 342 288 220 205 161 155 128 148 135 105
15 to 17 years 144 115 88 73 63 63 50 58 42 3518 to 19 years 198 173 132 132 98 92 78 90 93 70
20 to 24 years 770 633 556 513 510 425 384 406 331 33625 to 29 years 1,196 985 917 827 761 657 670 641 574 60330 to 34 years 1,299 1,134 992 982 876 826 791 794 716 71035 to 39 years 803 711 693 653 637 635 594 606 583 55140 years and over 247 253 209 260 243 242 240 263 208 212Unknown age group 9 3 2 0 0 0 1 1 1 2
See footnotes at the end of the table.
Statistics Canada – Catalogue no. 82-224-X 21

8/12/2019 Canadian Stats
http://slidepdf.com/reader/full/canadian-stats 24/49
Pregnancy Outcomes – 2005
Table 1-7 – continued
Selected pregnancy outcomes statistics, by age group and place of residence of females — Ontario
1996 1997 1998 1999 2000 2001 2002 2003 2004 2005
rate per 1,000 females
Total, pregnancies 1
All ages 65.0 61.1 59.9 58.1 55.9 56.1 54.0 53.7 51.8 52.6Under 20 years 38.6 34.4 33.1 29.7 28.1 26.2 24.7 23.1 20.6 19.5
Under 15 years 3.6 3.0 2.9 1.9 2.0 2.1 1.8 1.3 0.9 1.015 to 19 years 45.6 40.7 39.3 35.5 33.4 31.0 29.2 27.4 24.6 23.3
15 to 17 years 28.4 25.2 24.0 21.1 19.5 18.3 17.0 15.3 13.2 12.218 to 19 years 71.7 64.6 62.5 57.2 54.4 50.2 47.3 45.1 41.1 39.7
20 to 24 years 96.9 91.0 90.8 87.5 83.0 79.3 74.8 72.0 69.5 66.925 to 29 years 132.5 125.6 122.9 120.8 116.2 118.0 113.3 113.3 111.9 110.530 to 34 years 113.3 109.0 109.2 110.4 109.1 114.9 111.5 113.2 115.5 115.835 to 39 years 49.8 48.8 49.2 49.0 49.1 50.9 51.0 52.9 53.8 55.640 years and over 10.4 10.3 10.4 10.9 11.2 11.4 11.4 11.8 12.0 12.1Unknown age group ... ... ... ... ... ... ... ... ... ...
Live births 2
All ages 47.5 44.9 44.5 43.6 41.9 42.6 40.9 41.3 40.4 41.4Under 20 years 16.7 14.3 14.3 13.1 11.7 10.9 10.0 9.8 8.9 8.9
Under 15 years 0.7 0.7 0.5 0.5 0.5 0.3 0.3 0.2 0.3 0.315 to 19 years 19.9 17.1 17.1 15.7 13.9 12.9 11.9 11.7 10.7 10.6
15 to 17 years 11.3 9.3 9.6 8.5 7.4 6.3 6.1 5.7 5.4 5.4
18 to 19 years 32.9 28.9 28.6 26.6 23.8 22.9 20.6 20.5 18.3 18.420 to 24 years 57.9 54.1 55.1 53.0 50.6 48.0 45.0 43.7 42.8 41.625 to 29 years 104.8 99.4 98.5 98.0 93.6 96.2 92.0 92.6 92.4 91.530 to 34 years 94.7 91.9 92.4 94.3 93.0 99.1 96.3 98.7 101.4 102.635 to 39 years 38.4 38.2 38.7 39.2 39.4 41.4 41.6 43.5 44.4 46.740 years and over 6.3 6.5 6.7 7.1 7.5 7.8 7.8 8.1 8.5 8.6Unknown age group ... ... ... ... ... ... ... ... ... ...
Induced abortions 3
All ages 15.9 14.9 14.2 13.3 13.0 12.6 12.1 11.6 10.7 10.4Under 20 years 21.0 19.4 18.3 16.2 16.1 15.1 14.4 12.9 11.4 10.5
Under 15 years 2.7 2.2 2.3 1.4 1.4 1.7 1.5 1.1 0.6 0.715 to 19 years 24.7 22.8 21.5 19.2 19.0 17.7 16.9 15.3 13.6 12.4
15 to 17 years 16.4 15.3 14.0 12.3 11.8 11.7 10.7 9.3 7.6 6.718 to 19 years 37.3 34.4 33.1 29.7 30.0 26.7 26.2 24.1 22.2 20.9
20 to 24 years 36.9 35.2 34.2 33.1 31.1 30.2 28.9 27.4 25.9 24.525 to 29 years 24.9 23.7 22.1 20.7 20.7 20.1 19.7 19.1 18.1 17.530 to 34 years 16.0 14.8 14.7 13.9 14.1 14.0 13.4 12.8 12.6 11.635 to 39 years 9.7 9.2 9.2 8.5 8.5 8.3 8.3 8.2 8.2 7.840 years and over 3.6 3.2 3.3 3.3 3.3 3.1 3.1 3.1 3.2 3.1
Unknown age group ... ... ... ... ... ... ... ... ... ...
Fetal loss 4
All ages 1.6 1.4 1.2 1.1 1.0 1.0 0.9 0.9 0.8 0.8Under 20 years 0.8 0.7 0.5 0.5 0.4 0.3 0.3 0.3 0.3 0.2
Under 15 years 0.1 0.1 0.1 0.0 0.0 0.0 0.0 0.1 0.0 0.015 to 19 years 1.0 0.8 0.6 0.6 0.4 0.4 0.3 0.4 0.3 0.3
15 to 17 years 0.7 0.5 0.4 0.3 0.3 0.3 0.2 0.2 0.2 0.118 to 19 years 1.4 1.2 0.9 0.9 0.6 0.6 0.5 0.6 0.6 0.4
20 to 24 years 2.1 1.7 1.5 1.4 1.4 1.1 1.0 1.0 0.8 0.825 to 29 years 2.9 2.4 2.3 2.1 1.9 1.6 1.7 1.6 1.4 1.430 to 34 years 2.6 2.3 2.1 2.2 2.0 1.8 1.8 1.8 1.6 1.635 to 39 years 1.6 1.4 1.4 1.3 1.2 1.2 1.2 1.2 1.2 1.140 years and over 0.6 0.6 0.4 0.5 0.5 0.5 0.5 0.5 0.4 0.4Unknown age group ... ... ... ... ... ... ... ... ... ...
1. Pregnancies equal the sum of live births, fetal loss and induced abortions.
2. Live birth counts are based on registrations in the Birth Database.
3. Induced abortion counts are taken from the Therapeutic Abortion Survey that collects information on abortions performed in hospitals and clinics in Canada, as
well as on abortions performed on Canadian residents in selected American states, for data years prior to 2004.4. Fetal loss is the sum of stillbirth registrations in the Stillbirth Database and cases of miscarriages, illegal abortions and unspecified abortions reported in
the Hospital Morbidity Database.Note(s): See "Data quality, concepts and methodology — Explanatory notes for the tables " section.Source(s): Statistics Canada, Canadian Vital Statistics, Birth Database and Stillbirth Database; Canadian Institute for Health Information, Hospital Morbidity
Database and Therapeutic Abortion Database (CANSIM table 106-9002).
22 Statistics Canada – Catalogue no. 82-224-X

8/12/2019 Canadian Stats
http://slidepdf.com/reader/full/canadian-stats 25/49
Pregnancy Outcomes – 2005
Table 1-8
Selected pregnancy outcomes statistics, by age group and place of residence of females — Manitoba
1996 1997 1998 1999 2000 2001 2002 2003 2004 2005
number of events
Total, pregnancies 1
All ages 20,186 19,284 18,890 18,764 18,300 18,082 17,986 18,338 17,243 17,109Under 20 years 2,714 2,493 2,562 2,475 2,352 2,280 2,232 2,212 1,956 1,810
Under 15 years 66 56 44 48 34 28 37 40 37 3615 to 19 years 2,648 2,437 2,518 2,427 2,318 2,252 2,195 2,172 1,919 1,774
15 to 17 years 1,024 943 970 887 859 830 777 744 690 64118 to 19 years 1,624 1,494 1,548 1,540 1,459 1,422 1,418 1,428 1,229 1,133
20 to 24 years 5,036 4,733 4,659 4,679 4,583 4,419 4,463 4,549 4,105 3,91925 to 29 years 5,666 5,438 5,338 5,244 5,189 5,064 4,926 5,019 4,909 4,90930 to 34 years 4,667 4,393 4,134 4,105 4,010 4,061 4,137 4,286 4,086 4,22735 to 39 years 1,736 1,882 1,884 1,905 1,839 1,885 1,812 1,863 1,778 1,82440 years and over 363 344 312 356 326 373 416 408 409 416Unknown age group 4 1 1 0 1 0 0 1 0 0
Live births 2
All ages 15,478 14,655 14,461 14,315 14,090 14,002 13,888 13,940 13,811 14,145Under 20 years 1,578 1,416 1,519 1,420 1,340 1,330 1,300 1,237 1,218 1,219
Under 15 years 31 18 27 31 17 9 19 18 19 1815 to 19 years 1,547 1,398 1,492 1,389 1,323 1,321 1,281 1,219 1,199 1,201
15 to 17 years 589 508 548 502 486 470 447 405 424 42818 to 19 years 958 890 944 887 837 851 834 814 775 773
20 to 24 years 3,564 3,265 3,249 3,295 3,185 3,122 3,114 3,078 3,002 3,02225 to 29 years 4,658 4,462 4,452 4,335 4,369 4,216 4,080 4,150 4,211 4,27530 to 34 years 4,031 3,767 3,524 3,492 3,458 3,524 3,602 3,697 3,614 3,76535 to 39 years 1,409 1,528 1,516 1,526 1,502 1,556 1,499 1,499 1,477 1,55440 years and over 236 217 200 247 235 254 293 278 289 310Unknown age group 2 0 1 0 1 0 0 1 0 0
Induced abortions 3 , 4
All ages 3,647 3,626 3,447 3,517 3,366 3,375 3,267 3,670 2,661 2,236Under 20 years 992 942 907 937 908 854 836 879 645 489
Under 15 years 30 34 13 14 12 18 15 20 16 1315 to 19 years 962 908 894 923 896 836 821 859 629 476
15 to 17 years 380 368 361 340 345 311 303 298 226 17218 to 19 years 582 540 533 583 551 525 518 561 403 304
20 to 24 years 1,251 1,234 1,180 1,170 1,199 1,144 1,179 1,322 944 72425 to 29 years 725 730 655 680 621 671 649 692 530 47230 to 34 years 394 420 391 401 369 389 350 430 292 31735 to 39 years 205 225 241 259 210 238 180 254 185 168
40 years and over 78 74 73 70 59 79 73 93 65 66Unknown age group 2 1 0 0 0 0 0 0 0 0
Fetal loss 5
All ages 1,061 1,003 982 932 844 705 831 728 771 728Under 20 years 144 135 136 118 104 96 96 96 93 102
Under 15 years 5 4 4 3 5 1 3 2 2 515 to 19 years 139 131 132 115 99 95 93 94 91 97
15 to 17 years 55 67 61 45 28 49 27 41 40 4118 to 19 years 84 64 71 70 71 46 66 53 51 56
20 to 24 years 221 234 230 214 199 153 170 149 159 17325 to 29 years 283 246 231 229 199 177 197 177 168 16230 to 34 years 242 206 219 212 183 148 185 159 180 14535 to 39 years 122 129 127 120 127 91 133 110 116 10240 years and over 49 53 39 39 32 40 50 37 55 40Unknown age group 0 0 0 0 0 0 0 0 0 0
See footnotes at the end of the table.
Statistics Canada – Catalogue no. 82-224-X 23

8/12/2019 Canadian Stats
http://slidepdf.com/reader/full/canadian-stats 26/49
Pregnancy Outcomes – 2005
Table 1-8 – continued
Selected pregnancy outcomes statistics, by age group and place of residence of females — Manitoba
1996 1997 1998 1999 2000 2001 2002 2003 2004 2005
rate per 1,000 females
Total, pregnancies 1
All ages 70.3 67.4 66.4 65.9 64.2 63.5 63.1 64.3 58.5 59.8Under 20 years 58.6 53.8 54.9 52.3 49.1 47.2 46.1 45.2 39.4 36.2
Under 15 years 8.5 7.2 5.5 5.9 4.2 3.5 4.6 4.9 4.3 4.215 to 19 years 68.7 63.1 65.0 61.9 58.3 55.9 54.3 53.4 46.7 42.8
15 to 17 years 44.1 40.5 41.5 37.4 35.7 34.0 31.7 30.5 28.1 25.618 to 19 years 105.9 97.6 100.9 99.2 92.8 89.9 88.9 87.5 74.1 68.7
20 to 24 years 130.8 124.5 123.5 123.3 120.4 115.2 115.1 115.9 102.8 96.925 to 29 years 146.6 142.0 140.3 139.0 138.8 136.5 132.7 134.2 128.8 128.630 to 34 years 103.8 101.7 100.6 104.1 104.8 108.5 110.6 113.9 108.2 112.535 to 39 years 37.9 40.9 40.9 41.2 40.1 42.3 42.4 45.5 45.1 47.740 years and over 8.5 7.9 7.1 8.1 7.3 8.3 9.1 8.9 8.8 9.0Unknown age group ... ... ... ... ... ... ... ... ... ...
Live births 2
All ages 53.9 51.2 50.8 50.3 49.4 49.2 48.8 48.9 46.8 49.5Under 20 years 34.1 30.5 32.5 30.0 28.0 27.5 26.8 25.3 24.5 24.4
Under 15 years 4.0 2.3 3.4 3.8 2.1 1.1 2.4 2.2 2.2 2.115 to 19 years 40.1 36.2 38.5 35.4 33.2 32.8 31.7 30.0 29.2 29.0
15 to 17 years 25.4 21.8 23.4 21.2 20.2 19.2 18.2 16.6 17.3 17.1
18 to 19 years 62.5 58.1 61.5 57.1 53.2 53.8 52.3 49.9 46.7 46.920 to 24 years 92.6 85.9 86.2 86.8 83.7 81.4 80.3 78.4 75.2 74.725 to 29 years 120.5 116.6 117.0 114.9 116.9 113.7 109.9 111.0 110.5 112.030 to 34 years 89.7 87.2 85.8 88.6 90.4 94.1 96.3 98.3 95.7 100.235 to 39 years 30.8 33.2 32.9 33.0 32.8 34.9 35.0 36.6 37.5 40.740 years and over 5.5 5.0 4.5 5.6 5.3 5.6 6.4 6.0 6.2 6.7Unknown age group ... ... ... ... ... ... ... ... ... ...
Induced abortions 3 , 4
All ages 12.7 12.7 12.1 12.3 11.8 11.9 11.5 12.9 9.0 7.8Under 20 years 21.4 20.3 19.4 19.8 19.0 17.7 17.3 18.0 13.0 9.8
Under 15 years 3.9 4.4 1.6 1.7 1.5 2.2 1.9 2.4 1.9 1.515 to 19 years 25.0 23.5 23.1 23.5 22.5 20.8 20.3 21.1 15.3 11.5
15 to 17 years 16.4 15.8 15.4 14.3 14.3 12.7 12.4 12.2 9.2 6.918 to 19 years 38.0 35.3 34.7 37.6 35.0 33.2 32.5 34.4 24.3 18.4
20 to 24 years 32.5 32.5 31.3 30.8 31.5 29.8 30.4 33.7 23.6 17.925 to 29 years 18.8 19.1 17.2 18.0 16.6 18.1 17.5 18.5 13.9 12.430 to 34 years 8.8 9.7 9.5 10.2 9.6 10.4 9.4 11.4 7.7 8.435 to 39 years 4.5 4.9 5.2 5.6 4.6 5.3 4.2 6.2 4.7 4.440 years and over 1.8 1.7 1.7 1.6 1.3 1.7 1.6 2.0 1.4 1.4
Unknown age group ... ... ... ... ... ... ... ... ... ...
Fetal loss 5
All ages 3.7 3.5 3.5 3.3 3.0 2.5 2.9 2.6 2.6 2.5Under 20 years 3.1 2.9 2.9 2.5 2.2 2.0 2.0 2.0 1.9 2.0
Under 15 years 0.6 0.5 0.5 0.4 0.6 0.1 0.4 0.2 0.2 0.615 to 19 years 3.6 3.4 3.4 2.9 2.5 2.4 2.3 2.3 2.2 2.3
15 to 17 years 2.4 2.9 2.6 1.9 1.2 2.0 1.1 1.7 1.6 1.618 to 19 years 5.5 4.2 4.6 4.5 4.5 2.9 4.1 3.2 3.1 3.4
20 to 24 years 5.7 6.2 6.1 5.6 5.2 4.0 4.4 3.8 4.0 4.325 to 29 years 7.3 6.4 6.1 6.1 5.3 4.8 5.3 4.7 4.4 4.230 to 34 years 5.4 4.8 5.3 5.4 4.8 4.0 4.9 4.2 4.8 3.935 to 39 years 2.7 2.8 2.8 2.6 2.8 2.0 3.1 2.7 2.9 2.740 years and over 1.1 1.2 0.9 0.9 0.7 0.9 1.1 0.8 1.2 0.9Unknown age group ... ... ... ... ... ... ... ... ... ...
1. Pregnancies equal the sum of live births, fetal loss and induced abortions.
2. Live birth counts are based on registrations in the Birth Database.
3. Induced abortion counts are taken from the Therapeutic Abortion Survey that collects information on abortions performed in hospitals and clinics in Canada, as
well as on abortions performed on Canadian residents in selected American states, for data years prior to 2004.4. In 2004 and 2005, information on induced abortions performed in clinics in Manitoba was not submitted to the Therapeutic Abortion Survey.
5. Fetal loss is the sum of stillbirth registrations in the Stillbirth Database and cases of miscarriages, illegal abortions and unspecified abortions reported in
the Hospital Morbidity Database.Note(s): See "Data quality, concepts and methodology — Explanatory notes for the tables " section.Source(s): Statistics Canada, Canadian Vital Statistics, Birth Database and Stillbirth Database; Canadian Institute for Health Information, Hospital Morbidity
Database and Therapeutic Abortion Database (CANSIM table 106-9002).
24 Statistics Canada – Catalogue no. 82-224-X
8/12/2019 Canadian Stats
http://slidepdf.com/reader/full/canadian-stats 27/49

8/12/2019 Canadian Stats
http://slidepdf.com/reader/full/canadian-stats 28/49
Pregnancy Outcomes – 2005
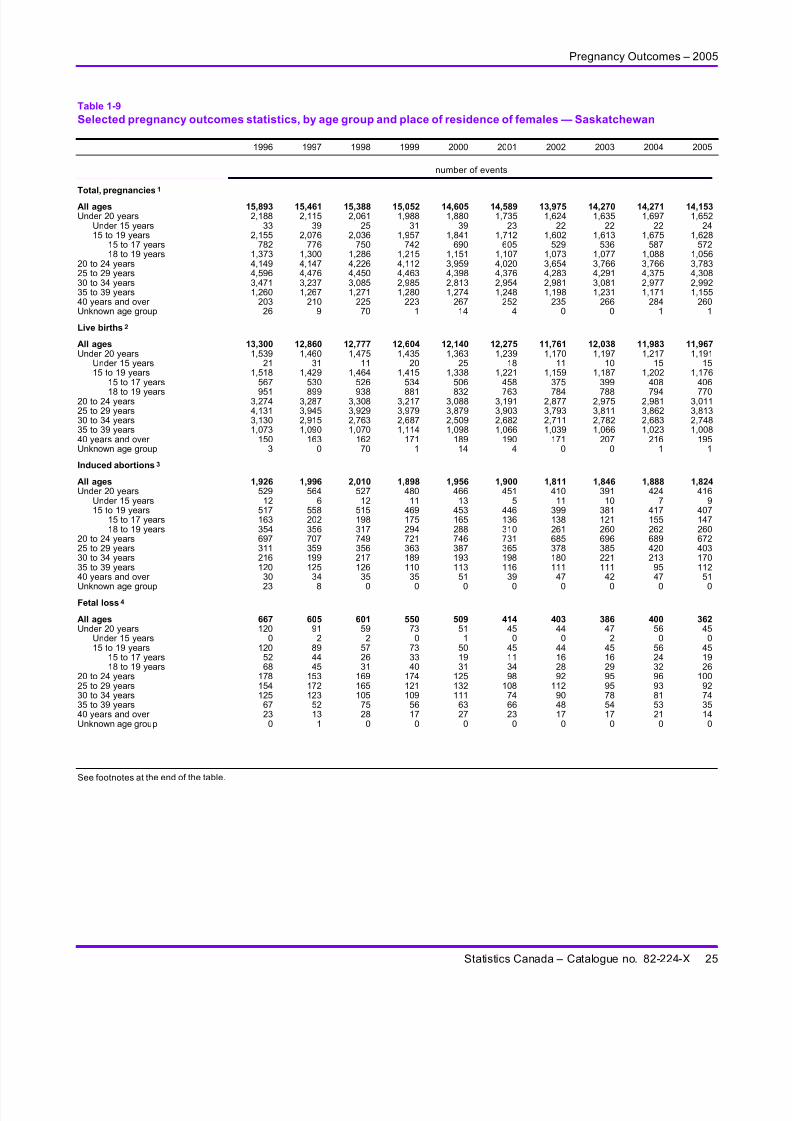
Table 1-9 – continued
Selected pregnancy outcomes statistics, by age group and place of residence of females — Saskatchewan
1996 1997 1998 1999 2000 2001 2002 2003 2004 2005
rate per 1,000 females
Total, pregnancies 1
All ages 63.6 62.0 61.7 60.5 59.2 59.7 57.6 59.0 57.4 59.5Under 20 years 47.3 45.8 44.5 42.9 40.7 37.7 35.8 35.9 37.4 36.9
Under 15 years 4.2 4.9 3.2 3.9 5.0 3.0 3.0 2.9 2.9 3.215 to 19 years 56.0 54.4 53.1 50.9 48.0 44.6 42.0 42.6 44.3 43.6
15 to 17 years 33.5 33.4 32.2 31.7 29.3 25.9 23.0 23.7 26.1 25.518 to 19 years 90.9 87.0 85.4 80.8 77.7 73.7 70.7 70.5 71.3 70.6
20 to 24 years 122.8 121.3 123.5 119.1 115.1 117.4 106.8 107.8 105.6 106.625 to 29 years 144.5 141.5 140.7 143.2 143.1 143.8 139.2 141.6 141.8 138.530 to 34 years 90.3 88.5 89.1 91.2 90.5 99.0 101.6 104.4 101.8 103.135 to 39 years 31.3 31.5 31.5 32.1 32.9 33.7 34.2 37.2 37.3 38.640 years and over 5.5 5.6 5.8 5.7 6.8 6.5 6.1 6.9 7.4 6.9Unknown age group ... ... ... ... ... ... ... ... ... ...
Live births 2
All ages 53.2 51.5 51.2 50.6 49.2 50.2 48.4 49.8 48.2 50.3Under 20 years 33.3 31.6 31.9 30.9 29.5 26.9 25.8 26.3 26.8 26.6
Under 15 years 2.7 3.9 1.4 2.5 3.2 2.4 1.5 1.3 2.0 2.015 to 19 years 39.5 37.5 38.2 36.8 34.9 31.8 30.4 31.3 31.8 31.5
15 to 17 years 24.3 22.8 22.6 22.8 21.5 19.6 16.3 17.6 18.1 18.1
18 to 19 years 63.0 60.1 62.3 58.6 56.2 50.8 51.7 51.6 52.0 51.520 to 24 years 96.9 96.1 96.7 93.2 89.8 93.2 84.1 85.2 83.6 84.825 to 29 years 129.9 124.7 124.2 127.7 126.2 128.3 123.3 125.7 125.1 122.630 to 34 years 81.4 79.7 79.8 82.1 80.7 89.9 92.4 94.2 91.7 94.735 to 39 years 26.7 27.1 26.6 28.0 28.4 28.8 29.7 32.2 32.6 33.740 years and over 4.1 4.3 4.2 4.4 4.8 4.9 4.4 5.3 5.6 5.2Unknown age group ... ... ... ... ... ... ... ... ... ...
Induced abortions 3
All ages 7.7 8.0 8.1 7.6 7.9 7.8 7.5 7.6 7.6 7.7Under 20 years 11.4 12.2 11.4 10.3 10.1 9.8 9.0 8.6 9.3 9.3
Under 15 years 1.5 0.7 1.5 1.4 1.7 0.7 1.5 1.3 0.9 1.215 to 19 years 13.4 14.6 13.4 12.2 11.8 11.6 10.5 10.1 11.0 10.9
15 to 17 years 7.0 8.7 8.5 7.5 7.0 5.8 6.0 5.3 6.9 6.618 to 19 years 23.4 23.8 21.0 19.5 19.4 20.7 17.2 17.0 17.2 17.4
20 to 24 years 20.6 20.7 21.9 20.9 21.7 21.3 20.0 19.9 19.3 18.925 to 29 years 9.8 11.4 11.3 11.6 12.6 12.0 12.3 12.7 13.6 13.030 to 34 years 5.6 5.4 6.3 5.8 6.2 6.6 6.1 7.5 7.3 5.935 to 39 years 3.0 3.1 3.1 2.8 2.9 3.1 3.2 3.4 3.0 3.740 years and over 0.8 0.9 0.9 0.9 1.3 1.0 1.2 1.1 1.2 1.4
Unknown age group ... ... ... ... ... ... ... ... ... ...
Fetal loss 4
All ages 2.7 2.4 2.4 2.2 2.1 1.7 1.7 1.6 1.6 1.5Under 20 years 2.6 2.0 1.3 1.6 1.1 1.0 1.0 1.0 1.2 1.0
Under 15 years 0.0 0.2 0.3 0.0 0.1 0.0 0.0 0.3 0.0 0.015 to 19 years 3.1 2.3 1.5 1.9 1.3 1.2 1.2 1.2 1.5 1.2
15 to 17 years 2.2 1.9 1.1 1.4 0.8 0.5 0.7 0.7 1.1 0.818 to 19 years 4.5 3.0 2.1 2.7 2.1 2.3 1.8 1.9 2.1 1.7
20 to 24 years 5.3 4.5 4.9 5.0 3.6 2.9 2.7 2.7 2.7 2.825 to 29 years 4.8 5.4 5.2 3.9 4.3 3.5 3.6 3.1 3.0 3.030 to 34 years 3.3 3.4 3.0 3.3 3.6 2.5 3.1 2.6 2.8 2.635 to 39 years 1.7 1.3 1.9 1.4 1.6 1.8 1.4 1.6 1.7 1.240 years and over 0.6 0.3 0.7 0.4 0.7 0.6 0.4 0.4 0.5 0.4Unknown age group ... ... ... ... ... ... ... ... ... ...
1. Pregnancies equal the sum of live births, fetal loss and induced abortions.
2. Live birth counts are based on registrations in the Birth Database.
3. Induced abortion counts are taken from the Therapeutic Abortion Survey that collects information on abortions performed in hospitals and clinics in Canada, as
well as on abortions performed on Canadian residents in selected American states, for data years prior to 2004.4. Fetal loss is the sum of stillbirth registrations in the Stillbirth Database and cases of miscarriages, illegal abortions and unspecified abortions reported in
the Hospital Morbidity Database.Note(s): See "Data quality, concepts and methodology — Explanatory notes for the tables " section.Source(s): Statistics Canada, Canadian Vital Statistics, Birth Database and Stillbirth Database; Canadian Institute for Health Information, Hospital Morbidity
Database and Therapeutic Abortion Database (CANSIM table 106-9002).
26 Statistics Canada – Catalogue no. 82-224-X

8/12/2019 Canadian Stats
http://slidepdf.com/reader/full/canadian-stats 29/49
Pregnancy Outcomes – 2005
Table 1-10
Selected pregnancy outcomes statistics, by age group and place of residence of females — Alberta
1996 1997 1998 1999 2000 2001 2002 2003 2004 2005
number of events
Total, pregnancies 1
All ages 49,349 49,561 50,218 50,223 49,263 49,680 51,138 52,737 53,607 54,646Under 20 years 5,120 5,185 5,330 5,079 4,888 4,838 4,401 4,033 3,973 3,978
Under 15 years 72 84 84 67 51 49 46 25 37 2615 to 19 years 5,048 5,101 5,246 5,012 4,837 4,789 4,355 4,008 3,936 3,952
15 to 17 years 1,865 1,837 1,918 1,804 1,583 1,533 1,316 1,197 1,157 1,17318 to 19 years 3,183 3,264 3,328 3,208 3,254 3,256 3,039 2,811 2,779 2,779
20 to 24 years 11,002 11,237 11,473 11,620 11,385 11,449 11,846 12,194 12,102 12,11825 to 29 years 14,525 14,517 14,471 14,380 14,095 14,092 14,681 15,326 15,900 16,20730 to 34 years 12,459 12,042 12,319 12,152 11,891 12,293 12,890 13,437 13,781 14,22435 to 39 years 5,327 5,512 5,532 5,807 5,819 5,787 5,978 6,179 6,279 6,54140 years and over 909 1,063 1,078 1,180 1,181 1,220 1,341 1,565 1,567 1,565Unknown age group 7 5 15 5 4 1 1 3 5 5
Live births 2
All ages 37,851 36,905 37,905 38,171 37,006 37,619 38,691 40,287 40,779 42,110Under 20 years 2,736 2,590 2,648 2,627 2,457 2,343 2,243 2,152 2,122 2,169
Under 15 years 31 29 25 23 16 14 18 13 20 1315 to 19 years 2,705 2,561 2,623 2,604 2,441 2,329 2,225 2,139 2,102 2,156
15 to 17 years 923 838 869 847 745 695 620 596 598 59318 to 19 years 1,782 1,723 1,754 1,757 1,696 1,634 1,605 1,543 1,504 1,563
20 to 24 years 7,629 7,442 7,807 7,953 7,565 7,636 7,885 8,103 7,961 8,10425 to 29 years 12,001 11,830 11,847 11,796 11,414 11,600 11,992 12,495 12,903 13,30130 to 34 years 10,711 10,111 10,541 10,374 10,124 10,576 10,995 11,555 11,803 12,21035 to 39 years 4,191 4,256 4,373 4,643 4,659 4,648 4,746 4,973 4,991 5,27240 years and over 583 676 674 776 786 815 830 1,008 999 1,053Unknown age group 0 0 15 2 1 1 0 1 0 1
Induced abortions 3
All ages 9,265 10,337 10,355 10,188 10,432 10,603 10,735 10,814 11,098 10,859Under 20 years 2,139 2,349 2,455 2,264 2,253 2,352 1,995 1,725 1,718 1,654
Under 15 years 37 46 57 43 33 30 25 12 16 1015 to 19 years 2,102 2,303 2,398 2,221 2,220 2,322 1,970 1,713 1,702 1,644
15 to 17 years 853 911 954 892 796 786 640 547 522 52518 to 19 years 1,249 1,392 1,444 1,329 1,424 1,536 1,330 1,166 1,180 1,119
20 to 24 years 2,917 3,280 3,268 3,293 3,459 3,488 3,585 3,778 3,814 3,69225 to 29 years 1,942 2,088 2,109 2,123 2,183 2,141 2,287 2,401 2,581 2,47930 to 34 years 1,224 1,425 1,324 1,338 1,358 1,392 1,507 1,509 1,540 1,61535 to 39 years 801 905 899 873 881 909 949 952 990 1,016
40 years and over 235 285 300 297 298 321 411 449 452 401Unknown age group 7 5 0 0 0 0 1 0 3 2
Fetal loss 4
All ages 2,233 2,319 1,958 1,864 1,825 1,458 1,712 1,636 1,730 1,677Under 20 years 245 246 227 188 178 143 163 156 133 155
Under 15 years 4 9 2 1 2 5 3 0 1 315 to 19 years 241 237 225 187 176 138 160 156 132 152
15 to 17 years 89 88 95 65 42 52 56 54 37 5518 to 19 years 152 149 130 122 134 86 104 102 95 97
20 to 24 years 456 515 398 374 361 325 376 313 327 32225 to 29 years 582 599 515 461 498 351 402 430 416 42730 to 34 years 524 506 454 440 409 325 388 373 438 39935 to 39 years 335 351 260 291 279 230 283 254 298 25340 years and over 91 102 104 107 97 84 100 108 116 111Unknown age group 0 0 0 3 3 0 0 2 2 2
See footnotes at the end of the table.
Statistics Canada – Catalogue no. 82-224-X 27

8/12/2019 Canadian Stats
http://slidepdf.com/reader/full/canadian-stats 30/49
Pregnancy Outcomes – 2005
Table 1-10 – continued
Selected pregnancy outcomes statistics, by age group and place of residence of females — Alberta
1996 1997 1998 1999 2000 2001 2002 2003 2004 2005
rate per 1,000 females
Total, pregnancies 1
All ages 65.7 64.8 64.2 63.2 61.0 60.7 61.4 62.7 61.5 63.2Under 20 years 44.1 43.3 42.8 39.8 37.5 36.6 32.8 30.0 29.3 29.0
Under 15 years 3.6 4.0 4.0 3.1 2.3 2.2 2.1 1.1 1.6 1.215 to 19 years 52.7 51.5 50.8 47.2 44.6 43.4 38.8 35.7 34.8 34.4
15 to 17 years 32.1 30.3 30.5 28.1 24.3 23.2 19.6 17.9 17.3 17.218 to 19 years 84.4 85.0 82.4 76.2 75.0 73.3 67.1 62.0 60.3 59.4
20 to 24 years 114.7 114.6 113.1 111.5 106.2 103.6 103.5 103.8 101.0 98.325 to 29 years 140.0 139.1 136.2 134.0 130.0 128.7 131.0 134.0 135.4 132.030 to 34 years 102.1 101.5 106.6 107.9 107.1 110.2 114.2 117.8 119.9 120.935 to 39 years 41.4 42.1 41.6 43.6 44.1 45.1 47.9 51.2 53.5 55.840 years and over 8.1 9.0 8.7 9.3 9.1 9.2 9.9 11.4 11.4 11.4Unknown age group ... ... ... ... ... ... ... ... ... ...
Live births 2
All ages 50.4 48.3 48.5 48.0 45.9 45.9 46.5 47.9 46.8 48.7Under 20 years 23.6 21.6 21.3 20.6 18.8 17.7 16.7 16.0 15.6 15.8
Under 15 years 1.5 1.4 1.2 1.1 0.7 0.6 0.8 0.6 0.9 0.615 to 19 years 28.2 25.9 25.4 24.5 22.5 21.1 19.8 19.1 18.6 18.7
15 to 17 years 15.9 13.8 13.8 13.2 11.4 10.5 9.3 8.9 8.9 8.7
18 to 19 years 47.2 44.8 43.5 41.7 39.1 36.8 35.5 34.0 32.6 33.420 to 24 years 79.5 75.9 76.9 76.3 70.6 69.1 68.9 69.0 66.5 65.725 to 29 years 115.7 113.3 111.5 109.9 105.3 105.9 107.0 109.3 109.9 108.430 to 34 years 87.8 85.2 91.2 92.1 91.2 94.8 97.4 101.3 102.7 103.835 to 39 years 32.5 32.5 32.9 34.8 35.3 36.2 38.1 41.2 42.5 44.940 years and over 5.2 5.7 5.5 6.1 6.0 6.1 6.1 7.4 7.3 7.7Unknown age group ... ... ... ... ... ... ... ... ... ...
Induced abortions 3
All ages 12.3 13.5 13.2 12.8 12.9 12.9 12.9 12.9 12.7 12.6Under 20 years 18.4 19.6 19.7 17.7 17.3 17.8 14.9 12.8 12.7 12.0
Under 15 years 1.8 2.2 2.7 2.0 1.5 1.4 1.1 0.5 0.7 0.415 to 19 years 21.9 23.3 23.2 20.9 20.5 21.0 17.5 15.3 15.1 14.3
15 to 17 years 14.7 15.0 15.2 13.9 12.2 11.9 9.6 8.2 7.8 7.718 to 19 years 33.1 36.2 35.8 31.6 32.8 34.6 29.4 25.7 25.6 23.9
20 to 24 years 30.4 33.4 32.2 31.6 32.3 31.5 31.3 32.1 31.8 29.925 to 29 years 18.7 20.0 19.9 19.8 20.1 19.6 20.4 21.0 22.0 20.230 to 34 years 10.0 12.0 11.5 11.9 12.2 12.5 13.3 13.2 13.4 13.735 to 39 years 6.2 6.9 6.8 6.6 6.7 7.1 7.6 7.9 8.4 8.740 years and over 2.1 2.4 2.4 2.3 2.3 2.4 3.0 3.3 3.3 2.9
Unknown age group ... ... ... ... ... ... ... ... ... ...
Fetal loss 4
All ages 3.0 3.0 2.5 2.3 2.3 1.8 2.1 1.9 2.0 1.9Under 20 years 2.1 2.1 1.8 1.5 1.4 1.1 1.2 1.2 1.0 1.1
Under 15 years 0.2 0.4 0.1 0.0 0.1 0.2 0.1 0.0 0.0 0.115 to 19 years 2.5 2.4 2.2 1.8 1.6 1.2 1.4 1.4 1.2 1.3
15 to 17 years 1.5 1.5 1.5 1.0 0.6 0.8 0.8 0.8 0.6 0.818 to 19 years 4.0 3.9 3.2 2.9 3.1 1.9 2.3 2.2 2.1 2.1
20 to 24 years 4.8 5.3 3.9 3.6 3.4 2.9 3.3 2.7 2.7 2.625 to 29 years 5.6 5.7 4.8 4.3 4.6 3.2 3.6 3.8 3.5 3.530 to 34 years 4.3 4.3 3.9 3.9 3.7 2.9 3.4 3.3 3.8 3.435 to 39 years 2.6 2.7 2.0 2.2 2.1 1.8 2.3 2.1 2.5 2.240 years and over 0.8 0.9 0.8 0.8 0.7 0.6 0.7 0.8 0.8 0.8Unknown age group ... ... ... ... ... ... ... ... ... ...
1. Pregnancies equal the sum of live births, fetal loss and induced abortions.
2. Live birth counts are based on registrations in the Birth Database.
3. Induced abortion counts are taken from the Therapeutic Abortion Survey that collects information on abortions performed in hospitals and clinics in Canada, as
well as on abortions performed on Canadian residents in selected American states, for data years prior to 2004.4. Fetal loss is the sum of stillbirth registrations in the Stillbirth Database and cases of miscarriages, illegal abortions and unspecified abortions reported in
the Hospital Morbidity Database.Note(s): See "Data quality, concepts and methodology — Explanatory notes for the tables " section.Source(s): Statistics Canada, Canadian Vital Statistics, Birth Database and Stillbirth Database; Canadian Institute for Health Information, Hospital Morbidity
Database and Therapeutic Abortion Database (CANSIM table 106-9002).
28 Statistics Canada – Catalogue no. 82-224-X

8/12/2019 Canadian Stats
http://slidepdf.com/reader/full/canadian-stats 31/49
Pregnancy Outcomes – 2005
Table 1-11
Selected pregnancy outcomes statistics, by age group and place of residence of females — British Columbia
1996 1997 1998 1999 2000 2001 2002 2003 2004 2005
number of events
Total, pregnancies 1
All ages 63,935 62,107 60,275 58,318 56,206 57,765 57,336 57,171 55,841 56,369Under 20 years 5,602 5,449 5,252 5,108 4,749 4,841 4,542 4,218 4,286 4,120
Under 15 years 117 103 108 91 67 63 59 53 74 6215 to 19 years 5,485 5,346 5,144 5,017 4,682 4,778 4,483 4,165 4,212 4,058
15 to 17 years 2,057 1,879 1,601 1,617 1,682 1,680 1,211 1,076 1,473 1,44918 to 19 years 3,428 3,467 3,543 3,400 3,000 3,098 3,272 3,089 2,739 2,609
20 to 24 years 13,264 12,562 12,375 11,498 10,928 11,046 11,094 10,895 10,544 10,80225 to 29 years 18,472 17,789 16,935 16,053 15,282 15,238 14,966 14,924 14,224 14,48130 to 34 years 17,100 16,503 15,822 15,564 15,095 15,851 15,818 16,117 15,591 15,69135 to 39 years 7,846 8,096 8,212 8,279 8,300 8,622 8,679 8,762 8,791 8,83640 years and over 1,643 1,704 1,678 1,813 1,852 2,137 2,225 2,245 2,405 2,432Unknown age group 8 4 1 3 0 30 12 10 0 0
Live births 2
All ages 46,138 44,577 43,072 41,939 40,672 40,575 40,065 40,496 40,489 40,827Under 20 years 2,371 2,236 2,111 2,040 1,850 1,786 1,617 1,482 1,424 1,338
Under 15 years 23 30 31 22 15 10 14 8 4 1315 to 19 years 2,348 2,206 2,080 2,018 1,835 1,776 1,603 1,474 1,420 1,325
15 to 17 years 809 730 719 666 548 553 502 416 431 39718 to 19 years 1,539 1,476 1,361 1,352 1,287 1,223 1,101 1,058 989 928
20 to 24 years 8,341 7,704 7,492 7,039 6,527 6,213 6,186 6,091 6,109 6,18025 to 29 years 14,408 13,834 13,143 12,413 11,952 11,567 11,298 11,323 11,086 11,23030 to 34 years 14,059 13,553 13,036 12,961 12,514 13,004 12,904 13,383 13,176 13,29435 to 39 years 5,939 6,216 6,252 6,365 6,564 6,690 6,672 6,809 7,102 7,15640 years and over 1,020 1,033 1,037 1,118 1,265 1,314 1,387 1,408 1,592 1,629Unknown age group 0 1 1 3 0 1 1 0 0 0
Induced abortions 3
All ages 15,689 15,582 15,482 14,642 14,009 15,908 15,967 15,499 14,145 14,444Under 20 years 3,046 3,062 3,021 2,954 2,791 2,977 2,850 2,674 2,806 2,727
Under 15 years 93 68 76 66 50 48 44 44 70 4815 to 19 years 2,953 2,994 2,945 2,888 2,741 2,929 2,806 2,630 2,736 2,679
15 to 17 years 1,181 1,089 828 919 1,096 1,098 683 640 1,025 1,02918 to 19 years 1,772 1,905 2,117 1,969 1,645 1,831 2,123 1,990 1,711 1,650
20 to 24 years 4,542 4,493 4,581 4,210 4,174 4,646 4,709 4,616 4,266 4,46425 to 29 years 3,526 3,460 3,363 3,181 2,960 3,350 3,360 3,328 2,859 2,99830 to 34 years 2,504 2,460 2,379 2,154 2,180 2,513 2,565 2,452 2,095 2,12035 to 39 years 1,542 1,555 1,629 1,570 1,448 1,695 1,729 1,694 1,436 1,449
40 years and over 521 550 509 573 456 698 743 725 683 686Unknown age group 8 2 0 0 0 29 11 10 0 0
Fetal loss 4
All ages 2,108 1,948 1,721 1,737 1,525 1,282 1,304 1,176 1,207 1,098Under 20 years 185 151 120 114 108 78 75 62 56 55
Under 15 years 1 5 1 3 2 5 1 1 0 115 to 19 years 184 146 119 111 106 73 74 61 56 54
15 to 17 years 67 60 54 32 38 29 26 20 17 2318 to 19 years 117 86 65 79 68 44 48 41 39 31
20 to 24 years 381 365 302 249 227 187 199 188 169 15825 to 29 years 538 495 429 459 370 321 308 273 279 25330 to 34 years 537 490 407 449 401 334 349 282 320 27735 to 39 years 365 325 331 344 288 237 278 259 253 23140 years and over 102 121 132 122 131 125 95 112 130 117Unknown age group 0 1 0 0 0 0 0 0 0 0
See footnotes at the end of the table.
Statistics Canada – Catalogue no. 82-224-X 29

8/12/2019 Canadian Stats
http://slidepdf.com/reader/full/canadian-stats 32/49
Pregnancy Outcomes – 2005
Table 1-11 – continued
Selected pregnancy outcomes statistics, by age group and place of residence of females — British Columbia
1996 1997 1998 1999 2000 2001 2002 2003 2004 2005
rate per 1,000 females
Total, pregnancies 1
All ages 61.9 59.2 57.3 55.3 53.2 54.3 53.6 53.4 50.6 52.0Under 20 years 37.9 36.0 34.0 32.6 29.9 30.0 27.9 26.0 26.4 25.3
Under 15 years 4.7 4.1 4.1 3.5 2.6 2.4 2.3 2.0 2.8 2.315 to 19 years 44.7 42.4 40.2 38.5 35.3 35.3 32.7 30.5 31.0 29.8
15 to 17 years 27.7 24.6 20.7 20.5 21.0 20.7 15.0 13.5 18.5 18.018 to 19 years 70.7 69.7 69.6 65.8 57.1 57.1 58.0 54.5 48.8 46.9
20 to 24 years 103.7 97.4 96.9 89.4 84.5 83.9 81.8 77.9 72.9 73.025 to 29 years 127.7 121.8 117.6 113.9 111.6 113.6 112.6 111.9 105.0 104.430 to 34 years 104.1 101.9 100.8 101.8 99.8 104.3 104.2 107.3 105.3 107.335 to 39 years 46.0 46.6 46.8 47.0 47.6 50.4 52.1 54.3 55.5 55.740 years and over 10.3 10.3 9.9 10.5 10.6 12.1 12.6 12.6 13.4 13.6Unknown age group ... ... ... ... ... ... ... ... ... ...
Live births 2
All ages 44.6 42.5 40.9 39.7 38.5 38.2 37.5 37.8 36.7 37.6Under 20 years 16.0 14.8 13.7 13.0 11.6 11.1 9.9 9.1 8.8 8.2
Under 15 years 0.9 1.2 1.2 0.8 0.6 0.4 0.5 0.3 0.2 0.515 to 19 years 19.1 17.5 16.2 15.5 13.8 13.1 11.7 10.8 10.4 9.7
15 to 17 years 10.9 9.6 9.3 8.5 6.8 6.8 6.2 5.2 5.4 4.9
18 to 19 years 31.8 29.7 26.8 26.2 24.5 22.5 19.5 18.7 17.6 16.720 to 24 years 65.2 59.7 58.6 54.7 50.4 47.2 45.6 43.6 42.2 41.825 to 29 years 99.6 94.7 91.3 88.1 87.3 86.3 85.0 84.9 81.8 80.930 to 34 years 85.6 83.6 83.0 84.8 82.7 85.6 85.0 89.1 89.0 90.935 to 39 years 34.9 35.7 35.6 36.2 37.7 39.1 40.0 42.2 44.8 45.140 years and over 6.4 6.2 6.1 6.5 7.3 7.5 7.8 7.9 8.9 9.1Unknown age group ... ... ... ... ... ... ... ... ... ...
Induced abortions 3
All ages 15.2 14.8 14.7 13.9 13.2 15.0 14.9 14.5 12.8 13.3Under 20 years 20.6 20.2 19.6 18.9 17.6 18.4 17.5 16.5 17.3 16.8
Under 15 years 3.7 2.7 2.9 2.5 1.9 1.8 1.7 1.7 2.6 1.815 to 19 years 24.1 23.8 23.0 22.2 20.6 21.6 20.5 19.3 20.1 19.6
15 to 17 years 15.9 14.3 10.7 11.7 13.7 13.5 8.5 8.0 12.8 12.718 to 19 years 36.6 38.3 41.6 38.1 31.3 33.7 37.7 35.1 30.5 29.7
20 to 24 years 35.5 34.8 35.9 32.7 32.3 35.3 34.7 33.0 29.5 30.225 to 29 years 24.4 23.7 23.4 22.6 21.6 25.0 25.3 24.9 21.1 21.630 to 34 years 15.2 15.2 15.2 14.1 14.4 16.5 16.9 16.3 14.2 14.535 to 39 years 9.0 8.9 9.3 8.9 8.3 9.9 10.4 10.5 9.1 9.140 years and over 3.3 3.3 3.0 3.3 2.6 4.0 4.2 4.1 3.8 3.8
Unknown age group ... ... ... ... ... ... ... ... ... ...
Fetal loss 4
All ages 2.0 1.9 1.6 1.6 1.4 1.2 1.2 1.1 1.1 1.0Under 20 years 1.3 1.0 0.8 0.7 0.7 0.5 0.5 0.4 0.3 0.3
Under 15 years 0.0 0.2 0.0 0.1 0.1 0.2 0.0 0.0 0.0 0.015 to 19 years 1.5 1.2 0.9 0.9 0.8 0.5 0.5 0.4 0.4 0.4
15 to 17 years 0.9 0.8 0.7 0.4 0.5 0.4 0.3 0.3 0.2 0.318 to 19 years 2.4 1.7 1.3 1.5 1.3 0.8 0.9 0.7 0.7 0.6
20 to 24 years 3.0 2.8 2.4 1.9 1.8 1.4 1.5 1.3 1.2 1.125 to 29 years 3.7 3.4 3.0 3.3 2.7 2.4 2.3 2.0 2.1 1.830 to 34 years 3.3 3.0 2.6 2.9 2.7 2.2 2.3 1.9 2.2 1.935 to 39 years 2.1 1.9 1.9 2.0 1.7 1.4 1.7 1.6 1.6 1.540 years and over 0.6 0.7 0.8 0.7 0.8 0.7 0.5 0.6 0.7 0.7Unknown age group ... ... ... ... ... ... ... ... ... ...
1. Pregnancies equal the sum of live births, fetal loss and induced abortions.
2. Live birth counts are based on registrations in the Birth Database.
3. Induced abortion counts are taken from the Therapeutic Abortion Survey that collects information on abortions performed in hospitals and clinics in Canada, as
well as on abortions performed on Canadian residents in selected American states, for data years prior to 2004.4. Fetal loss is the sum of stillbirth registrations in the Stillbirth Database and cases of miscarriages, illegal abortions and unspecified abortions reported in
the Hospital Morbidity Database.Note(s): See "Data quality, concepts and methodology — Explanatory notes for the tables " section.Source(s): Statistics Canada, Canadian Vital Statistics, Birth Database and Stillbirth Database; Canadian Institute for Health Information, Hospital Morbidity
Database and Therapeutic Abortion Database (CANSIM table 106-9002).
30 Statistics Canada – Catalogue no. 82-224-X

8/12/2019 Canadian Stats
http://slidepdf.com/reader/full/canadian-stats 33/49
Pregnancy Outcomes – 2005
Table 1-12
Selected pregnancy outcomes statistics, by age group and place of residence of females — Yukon Territory
1996 1997 1998 1999 2000 2001 2002 2003 2004 2005
number of events
Total, pregnancies 1
All ages 646 624 568 516 523 477 478 475 492 474Under 20 years 67 68 62 59 67 64 61 62 55 36
Under 15 years 0 1 1 0 0 3 0 0 0 015 to 19 years 67 67 61 59 67 61 61 62 55 36
15 to 17 years 20 29 21 24 24 17 19 33 20 1118 to 19 years 47 38 40 35 43 44 42 29 35 25
20 to 24 years 155 129 136 107 115 110 109 125 124 11425 to 29 years 171 190 141 124 124 109 128 109 129 12430 to 34 years 156 139 129 124 119 117 98 109 120 11735 to 39 years 77 79 83 84 84 58 63 49 50 5840 years and over 20 19 17 18 14 19 19 21 14 25Unknown age group 0 0 0 0 0 0 0 0 0 0
Live births 2
All ages 443 474 396 383 370 344 339 335 365 320Under 20 years 32 x x x x x x x x 14
Under 15 years 0 x x x x x x x x 015 to 19 years 32 32 30 31 33 28 25 27 27 14
15 to 17 years 9 12 10 11 11 7 7 13 10 618 to 19 years 23 20 20 20 22 21 18 14 17 8
20 to 24 years 95 90 82 68 70 77 68 70 87 5825 to 29 years 127 152 108 103 92 83 101 89 96 9130 to 34 years 122 125 101 101 96 98 84 94 102 9935 to 39 years 55 63 64 65 72 43 48 38 43 4240 years and over 12 x x x x x x x x 16Unknown age group 0 0 0 0 0 0 0 0 0 0
Induced abortions 3
All ages 172 121 150 111 135 122 125 129 x 140Under 20 years 30 x x x x x x x x 22
Under 15 years 0 x x x x x x x x 015 to 19 years 30 33 31 26 32 30 36 34 x 22
15 to 17 years 10 16 11 12 12 10 12 20 x 518 to 19 years 20 17 20 14 20 20 24 14 x 17
20 to 24 years 55 32 49 34 39 32 35 52 x 5125 to 29 years 39 32 29 17 30 25 25 18 x 3230 to 34 years 28 8 22 18 21 16 12 14 x 1335 to 39 years 16 12 14 14 8 13 12 9 x 15
40 years and over 4 x x x x x x x x 7Unknown age group 0 0 0 0 0 0 0 0 0 0
Fetal loss 4
All ages 31 29 22 22 18 11 14 11 x 14Under 20 years 5 x x x x x x x x 0
Under 15 years 0 x x x x x x x x 015 to 19 years 5 2 0 2 2 3 0 1 x 0
15 to 17 years 1 1 0 1 1 0 0 0 x 018 to 19 years 4 1 0 1 1 3 0 1 x 0
20 to 24 years 5 7 5 5 6 1 6 3 x 525 to 29 years 5 6 4 4 2 1 2 2 x 130 to 34 years 6 6 6 5 2 3 2 1 x 535 to 39 years 6 4 5 5 4 2 3 2 x 140 years and over 4 x x x x x x x x 2Unknown age group 0 0 0 0 0 0 0 0 0 0
See footnotes at the end of the table.
Statistics Canada – Catalogue no. 82-224-X 31
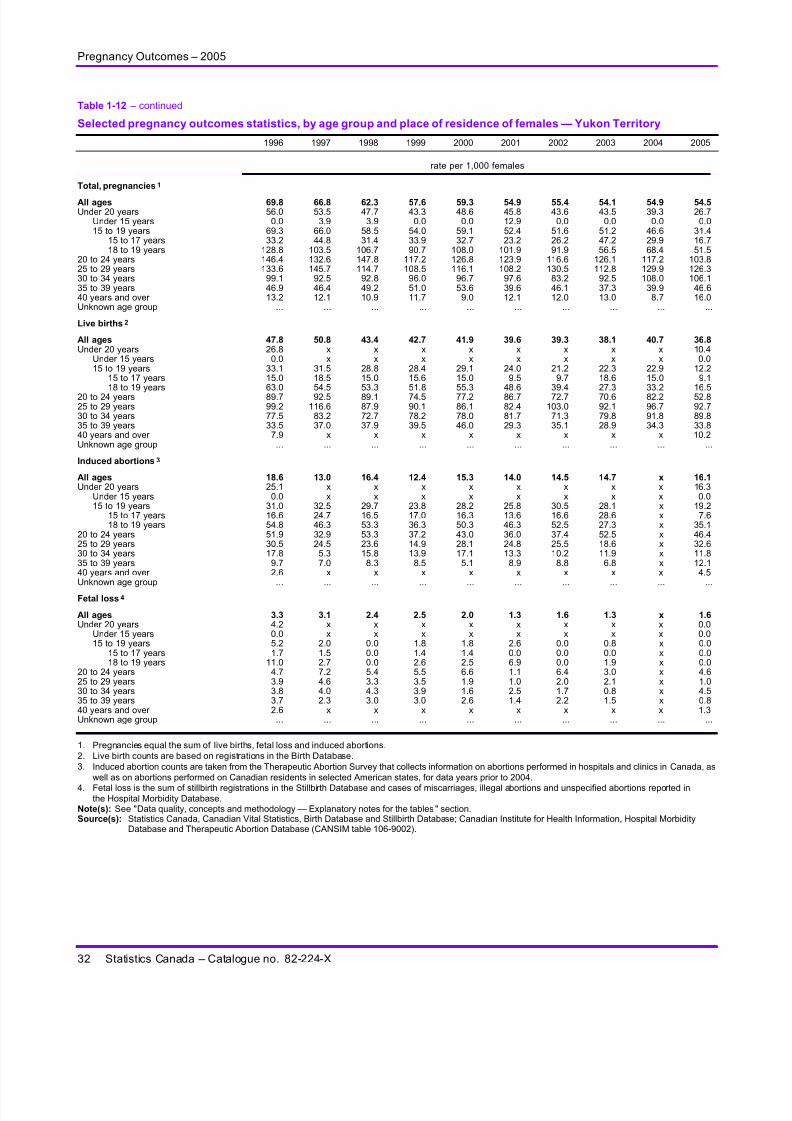
8/12/2019 Canadian Stats
http://slidepdf.com/reader/full/canadian-stats 34/49
Pregnancy Outcomes – 2005
Table 1-12 – continued
Selected pregnancy outcomes statistics, by age group and place of residence of females — Yukon Territory
1996 1997 1998 1999 2000 2001 2002 2003 2004 2005
rate per 1,000 females
Total, pregnancies 1
All ages 69.8 66.8 62.3 57.6 59.3 54.9 55.4 54.1 54.9 54.5Under 20 years 56.0 53.5 47.7 43.3 48.6 45.8 43.6 43.5 39.3 26.7
Under 15 years 0.0 3.9 3.9 0.0 0.0 12.9 0.0 0.0 0.0 0.015 to 19 years 69.3 66.0 58.5 54.0 59.1 52.4 51.6 51.2 46.6 31.4
15 to 17 years 33.2 44.8 31.4 33.9 32.7 23.2 26.2 47.2 29.9 16.718 to 19 years 128.8 103.5 106.7 90.7 108.0 101.9 91.9 56.5 68.4 51.5
20 to 24 years 146.4 132.6 147.8 117.2 126.8 123.9 116.6 126.1 117.2 103.825 to 29 years 133.6 145.7 114.7 108.5 116.1 108.2 130.5 112.8 129.9 126.330 to 34 years 99.1 92.5 92.8 96.0 96.7 97.6 83.2 92.5 108.0 106.135 to 39 years 46.9 46.4 49.2 51.0 53.6 39.6 46.1 37.3 39.9 46.640 years and over 13.2 12.1 10.9 11.7 9.0 12.1 12.0 13.0 8.7 16.0Unknown age group ... ... ... ... ... ... ... ... ... ...
Live births 2
All ages 47.8 50.8 43.4 42.7 41.9 39.6 39.3 38.1 40.7 36.8Under 20 years 26.8 x x x x x x x x 10.4
Under 15 years 0.0 x x x x x x x x 0.015 to 19 years 33.1 31.5 28.8 28.4 29.1 24.0 21.2 22.3 22.9 12.2
15 to 17 years 15.0 18.5 15.0 15.6 15.0 9.5 9.7 18.6 15.0 9.1
18 to 19 years 63.0 54.5 53.3 51.8 55.3 48.6 39.4 27.3 33.2 16.520 to 24 years 89.7 92.5 89.1 74.5 77.2 86.7 72.7 70.6 82.2 52.825 to 29 years 99.2 116.6 87.9 90.1 86.1 82.4 103.0 92.1 96.7 92.730 to 34 years 77.5 83.2 72.7 78.2 78.0 81.7 71.3 79.8 91.8 89.835 to 39 years 33.5 37.0 37.9 39.5 46.0 29.3 35.1 28.9 34.3 33.840 years and over 7.9 x x x x x x x x 10.2Unknown age group ... ... ... ... ... ... ... ... ... ...
Induced abortions 3
All ages 18.6 13.0 16.4 12.4 15.3 14.0 14.5 14.7 x 16.1Under 20 years 25.1 x x x x x x x x 16.3
Under 15 years 0.0 x x x x x x x x 0.015 to 19 years 31.0 32.5 29.7 23.8 28.2 25.8 30.5 28.1 x 19.2
15 to 17 years 16.6 24.7 16.5 17.0 16.3 13.6 16.6 28.6 x 7.618 to 19 years 54.8 46.3 53.3 36.3 50.3 46.3 52.5 27.3 x 35.1
20 to 24 years 51.9 32.9 53.3 37.2 43.0 36.0 37.4 52.5 x 46.425 to 29 years 30.5 24.5 23.6 14.9 28.1 24.8 25.5 18.6 x 32.630 to 34 years 17.8 5.3 15.8 13.9 17.1 13.3 10.2 11.9 x 11.835 to 39 years 9.7 7.0 8.3 8.5 5.1 8.9 8.8 6.8 x 12.140 years and over 2.6 x x x x x x x x 4.5
Unknown age group ... ... ... ... ... ... ... ... ... ...
Fetal loss 4
All ages 3.3 3.1 2.4 2.5 2.0 1.3 1.6 1.3 x 1.6Under 20 years 4.2 x x x x x x x x 0.0
Under 15 years 0.0 x x x x x x x x 0.015 to 19 years 5.2 2.0 0.0 1.8 1.8 2.6 0.0 0.8 x 0.0
15 to 17 years 1.7 1.5 0.0 1.4 1.4 0.0 0.0 0.0 x 0.018 to 19 years 11.0 2.7 0.0 2.6 2.5 6.9 0.0 1.9 x 0.0
20 to 24 years 4.7 7.2 5.4 5.5 6.6 1.1 6.4 3.0 x 4.625 to 29 years 3.9 4.6 3.3 3.5 1.9 1.0 2.0 2.1 x 1.030 to 34 years 3.8 4.0 4.3 3.9 1.6 2.5 1.7 0.8 x 4.535 to 39 years 3.7 2.3 3.0 3.0 2.6 1.4 2.2 1.5 x 0.840 years and over 2.6 x x x x x x x x 1.3Unknown age group ... ... ... ... ... ... ... ... ... ...
1. Pregnancies equal the sum of live births, fetal loss and induced abortions.
2. Live birth counts are based on registrations in the Birth Database.
3. Induced abortion counts are taken from the Therapeutic Abortion Survey that collects information on abortions performed in hospitals and clinics in Canada, as
well as on abortions performed on Canadian residents in selected American states, for data years prior to 2004.4. Fetal loss is the sum of stillbirth registrations in the Stillbirth Database and cases of miscarriages, illegal abortions and unspecified abortions reported in
the Hospital Morbidity Database.Note(s): See "Data quality, concepts and methodology — Explanatory notes for the tables " section.Source(s): Statistics Canada, Canadian Vital Statistics, Birth Database and Stillbirth Database; Canadian Institute for Health Information, Hospital Morbidity
Database and Therapeutic Abortion Database (CANSIM table 106-9002).
32 Statistics Canada – Catalogue no. 82-224-X

8/12/2019 Canadian Stats
http://slidepdf.com/reader/full/canadian-stats 35/49
Pregnancy Outcomes – 2005
Table 1-13
Selected pregnancy outcomes statistics, by age group and place of residence of females — Northwest Territories
including Nunavut
1996 1997 1998 1999 1 2000 2001 2002 2003 2004 2005
number of events
Total, pregnancies 2
All ages 1,944 1,866 1,702 1,859 .. .. .. .. .. ..Under 20 years 379 341 326 398 .. .. .. .. .. ..
Under 15 years 7 12 11 17 .. .. .. .. .. ..15 to 19 years 372 329 315 381 .. .. .. .. .. ..
15 to 17 years 147 159 132 160 .. .. .. .. .. ..18 to 19 years 225 170 183 221 .. .. .. .. .. ..
20 to 24 years 538 529 483 492 .. .. .. .. .. ..25 to 29 years 524 508 420 474 .. .. .. .. .. ..30 to 34 years 343 322 319 314 .. .. .. .. .. ..35 to 39 years 131 146 130 144 .. .. .. .. .. ..40 years and over 29 20 23 37 .. .. .. .. .. ..Unknown age group 0 0 1 0 .. .. .. .. .. ..
Live births 3
All ages 1,562 1,468 1,348 1,396 .. .. .. .. .. ..Under 20 years 275 x x x .. .. .. .. .. ..
Under 15 years 4 x x x .. .. .. .. .. ..
15 to 19 years 271 242 243 252 .. .. .. .. .. ..15 to 17 years 102 114 100 103 .. .. .. .. .. ..18 to 19 years 169 128 143 149 .. .. .. .. .. ..
20 to 24 years 433 413 363 377 .. .. .. .. .. ..25 to 29 years 432 407 339 378 .. .. .. .. .. ..30 to 34 years 291 262 272 242 .. .. .. .. .. ..35 to 39 years 108 118 105 110 .. .. .. .. .. ..40 years and over 23 x x x .. .. .. .. .. ..Unknown age group 0 0 1 0 .. .. .. .. .. ..
Induced abortions 4
All ages 297 317 292 393 .. .. .. .. .. ..Under 20 years 87 x x x .. .. .. .. .. ..
Under 15 years 3 x x x .. .. .. .. .. ..15 to 19 years 84 75 67 114 .. .. .. .. .. ..
15 to 17 years 37 40 30 51 .. .. .. .. .. ..18 to 19 years 47 35 37 63 .. .. .. .. .. ..
20 to 24 years 84 95 95 100 .. .. .. .. .. ..25 to 29 years 74 82 64 80 .. .. .. .. .. ..30 to 34 years 39 42 39 57 .. .. .. .. .. ..
35 to 39 years 9 18 21 28 .. .. .. .. .. ..40 years and over 4 x x x .. .. .. .. .. ..Unknown age group 0 0 0 0 .. .. .. .. .. ..
Fetal loss 5
All ages 85 81 62 70 .. .. .. .. .. ..Under 20 years 17 x x x .. .. .. .. .. ..
Under 15 years 0 x x x .. .. .. .. .. ..15 to 19 years 17 12 5 15 .. .. .. .. .. ..
15 to 17 years 8 5 2 6 .. .. .. .. .. ..18 to 19 years 9 7 3 9 .. .. .. .. .. ..
20 to 24 years 21 21 25 15 .. .. .. .. .. ..25 to 29 years 18 19 17 16 .. .. .. .. .. ..30 to 34 years 13 18 8 15 .. .. .. .. .. ..35 to 39 years 14 10 4 6 .. .. .. .. .. ..40 years and over 2 x x x .. .. .. .. .. ..Unknown age group 0 0 0 0 .. .. .. .. .. ..
See footnotes at the end of the table.
Statistics Canada – Catalogue no. 82-224-X 33

8/12/2019 Canadian Stats
http://slidepdf.com/reader/full/canadian-stats 36/49
Pregnancy Outcomes – 2005
Table 1-13 – continued
Selected pregnancy outcomes statistics, by age group and place of residence of females — Northwest Territories
including Nunavut
1996 1997 1998 1999 1 2000 2001 2002 2003 2004 2005
rate per 1,000 females
Total, pregnancies 2
All ages 106.3 102.2 94.2 102.2 .. .. .. .. .. ..Under 20 years 116.7 106.8 102.0 122.3 .. .. .. .. .. ..
Under 15 years 13.1 22.5 18.9 29.7 .. .. .. .. .. ..15 to 19 years 137.1 123.7 120.5 142.2 .. .. .. .. .. ..
15 to 17 years 89.6 98.6 84.9 98.9 .. .. .. .. .. ..18 to 19 years 209.7 162.2 172.5 207.9 .. .. .. .. .. ..
20 to 24 years 205.2 201.2 190.2 188.9 .. .. .. .. .. ..25 to 29 years 162.7 158.8 135.6 159.9 .. .. .. .. .. ..30 to 34 years 108.0 104.4 104.7 103.2 .. .. .. .. .. ..35 to 39 years 48.4 53.9 46.9 50.8 .. .. .. .. .. ..40 years and over 14.1 9.2 10.5 16.6 .. .. .. .. .. ..Unknown age group ... ... ... ... ... ... ... ... ... ...
Live births 3
All ages 85.4 80.4 74.6 76.7 .. .. .. .. .. ..Under 20 years 84.7 x x x .. .. .. .. .. ..
Under 15 years 7.5 x x x .. .. .. .. .. ..15 to 19 years 99.9 91.0 92.9 94.0 .. .. .. .. .. ..
15 to 17 years 62.2 70.7 64.4 63.7 .. .. .. .. .. ..18 to 19 years 157.5 122.1 134.8 140.2 .. .. .. .. .. ..
20 to 24 years 165.1 157.1 142.9 144.7 .. .. .. .. .. ..25 to 29 years 134.1 127.3 109.4 127.5 .. .. .. .. .. ..30 to 34 years 91.6 85.0 89.2 79.5 .. .. .. .. .. ..35 to 39 years 39.9 43.5 37.9 38.8 .. .. .. .. .. ..40 years and over 11.2 x x x .. .. .. .. .. ..Unknown age group ... ... ... ... ... ... ... ... ... ...
Induced abortions 4
All ages 16.2 17.4 16.2 21.6 .. .. .. .. .. ..Under 20 years 26.8 x x x .. .. .. .. .. ..
Under 15 years 5.6 x x x .. .. .. .. .. ..15 to 19 years 31.0 28.2 25.6 42.5 .. .. .. .. .. ..
15 to 17 years 22.6 24.8 19.3 31.5 .. .. .. .. .. ..18 to 19 years 43.8 33.4 34.9 59.3 .. .. .. .. .. ..
20 to 24 years 32.0 36.1 37.4 38.4 .. .. .. .. .. ..25 to 29 years 23.0 25.6 20.7 27.0 .. .. .. .. .. ..30 to 34 years 12.3 13.6 12.8 18.7 .. .. .. .. .. ..
35 to 39 years 3.3 6.6 7.6 9.9 .. .. .. .. .. ..40 years and over 1.9 x x x .. .. .. .. .. ..Unknown age group ... ... ... ... ... ... ... ... ... ...
Fetal loss 5
All ages 4.6 4.4 3.4 3.8 .. .. .. .. .. ..Under 20 years 5.2 x x x .. .. .. .. .. ..
Under 15 years 0.0 x x x .. .. .. .. .. ..15 to 19 years 6.3 4.5 1.9 5.6 .. .. .. .. .. ..
15 to 17 years 4.9 3.1 1.3 3.7 .. .. .. .. .. ..18 to 19 years 8.4 6.7 2.8 8.5 .. .. .. .. .. ..
20 to 24 years 8.0 8.0 9.8 5.8 .. .. .. .. .. ..25 to 29 years 5.6 5.9 5.5 5.4 .. .. .. .. .. ..30 to 34 years 4.1 5.8 2.6 4.9 .. .. .. .. .. ..35 to 39 years 5.2 3.7 1.4 2.1 .. .. .. .. .. ..40 years and over 1.0 x x x .. .. .. .. .. ..Unknown age group ... ... ... ... ... ... ... ... ... ...
1. For data year 1999, counts and rates for Nunavut and the Northwest Territories have been combined. Although Nunavut became a separate territory as of
April 1, 1999, not all sources of information (for example, the Hospital Morbidity Database) used in the calculation of pregnancy statistics contained enough
information to provide complete and separate data for Nunavut for the 1999 calendar year.
2. Pregnancies equal the sum of live births, fetal loss and induced abortions.
3. Live birth counts are based on registrations in the Birth Database.
4. Induced abortion counts are taken from the Therapeutic Abortion Survey that collects information on abortions performed in hospitals and clinics in Canada, as
well as on abortions performed on Canadian residents in selected American states, for data years prior to 2004.
5. Fetal loss is the sum of stillbirth registrations in the Stillbirth Database and cases of miscarriages, illegal abortions and unspecified abortions reported in
the Hospital Morbidity Database.Note(s): See "Data quality, concepts and methodology — Explanatory notes for the tables " section.Source(s): Statistics Canada, Canadian Vital Statistics, Birth Database and Stillbirth Database; Canadian Institute for Health Information, Hospital Morbidity
Database and Therapeutic Abortion Database (CANSIM table 106-9002).
34 Statistics Canada – Catalogue no. 82-224-X

8/12/2019 Canadian Stats
http://slidepdf.com/reader/full/canadian-stats 37/49
Pregnancy Outcomes – 2005
Table 1-14
Selected pregnancy outcomes statistics, by age group and place of residence of females — Northwest Territories
1996 1997 1998 1999 1 2000 2001 2002 2003 2004 2005
number of events
Total, pregnancies 2
All ages .. .. .. .. 995 929 918 993 1,001 1,020Under 20 years .. .. .. .. 149 143 148 136 146 123
Under 15 years .. .. .. .. 4 3 6 6 2 115 to 19 years .. .. .. .. 145 140 142 130 144 122
15 to 17 years .. .. .. .. 65 53 54 61 55 4418 to 19 years .. .. .. .. 80 87 88 69 89 78
20 to 24 years .. .. .. .. 276 250 234 262 244 26125 to 29 years .. .. .. .. 251 226 240 233 278 28430 to 34 years .. .. .. .. 187 186 189 239 210 21835 to 39 years .. .. .. .. 110 102 90 93 100 11140 years and over .. .. .. .. 22 22 17 30 22 23Unknown age group .. .. .. .. 0 0 0 0 1 0
Live births 3
All ages .. .. .. .. 673 613 635 701 698 712Under 20 years .. .. .. .. x x x x x 68
Under 15 years .. .. .. .. x x x x x 115 to 19 years .. .. .. .. 82 69 72 69 84 67
15 to 17 years .. .. .. .. 37 22 22 35 25 2018 to 19 years .. .. .. .. 45 47 50 34 59 47
20 to 24 years .. .. .. .. 160 155 145 174 159 15925 to 29 years .. .. .. .. 173 154 185 169 195 20930 to 34 years .. .. .. .. 155 141 159 187 167 18235 to 39 years .. .. .. .. 85 78 62 80 76 8040 years and over .. .. .. .. x x x x x 14Unknown age group .. .. .. .. 0 0 0 0 0 0
Induced abortions 4
All ages .. .. .. .. 281 286 245 255 261 xUnder 20 years .. .. .. .. x x x x x x
Under 15 years .. .. .. .. x x x x x x15 to 19 years .. .. .. .. 57 67 63 56 57 x
15 to 17 years .. .. .. .. 24 30 29 24 27 x18 to 19 years .. .. .. .. 33 37 34 32 30 x
20 to 24 years .. .. .. .. 104 88 76 83 78 x25 to 29 years .. .. .. .. 66 63 47 52 68 x30 to 34 years .. .. .. .. 32 40 27 42 36 x35 to 39 years .. .. .. .. 16 20 22 9 17 x
40 years and over .. .. .. .. x x x x x xUnknown age group .. .. .. .. 0 0 0 0 1 x
Fetal loss 5
All ages .. .. .. .. 41 30 38 37 42 xUnder 20 years .. .. .. .. x x x x x x
Under 15 years .. .. .. .. x x x x x x15 to 19 years .. .. .. .. 6 4 7 5 3 x
15 to 17 years .. .. .. .. 4 1 3 2 3 x18 to 19 years .. .. .. .. 2 3 4 3 0 x
20 to 24 years .. .. .. .. 12 7 13 5 7 x25 to 29 years .. .. .. .. 12 9 8 12 15 x30 to 34 years .. .. .. .. 0 5 3 10 7 x35 to 39 years .. .. .. .. 9 4 6 4 7 x40 years and over .. .. .. .. x x x x x xUnknown age group .. .. .. .. 0 0 0 0 0 x
See footnotes at the end of the table.
Statistics Canada – Catalogue no. 82-224-X 35

8/12/2019 Canadian Stats
http://slidepdf.com/reader/full/canadian-stats 38/49
Pregnancy Outcomes – 2005
Table 1-14 – continued
Selected pregnancy outcomes statistics, by age group and place of residence of females — Northwest Territories
1996 1997 1998 1999 1 2000 2001 2002 2003 2004 2005
rate per 1,000 females
Total, pregnancies 2
All ages .. .. .. .. 87.3 81.1 79.1 83.7 80.8 85.6Under 20 years .. .. .. .. 83.6 77.0 78.6 68.3 71.9 59.6
Under 15 years .. .. .. .. 12.4 8.9 17.2 17.7 5.6 2.715 to 19 years .. .. .. .. 99.2 92.0 92.6 78.7 86.1 72.0
15 to 17 years .. .. .. .. 74.0 56.9 57.3 59.9 53.3 42.818 to 19 years .. .. .. .. 137.2 147.7 148.6 109.2 138.8 117.3
20 to 24 years .. .. .. .. 184.9 165.1 151.1 165.4 147.3 159.625 to 29 years .. .. .. .. 147.9 136.2 141.9 143.6 167.3 171.730 to 34 years .. .. .. .. 100.1 101.2 103.7 129.0 114.7 127.435 to 39 years .. .. .. .. 56.2 53.2 47.0 48.8 53.4 60.140 years and over .. .. .. .. 13.9 13.3 10.0 16.8 12.0 12.1Unknown age group ... ... ... ... ... ... ... ... ... ...
Live births 3
All ages .. .. .. .. 59.1 53.5 54.7 59.1 56.4 59.7Under 20 years .. .. .. .. x x x x x 32.9
Under 15 years .. .. .. .. x x x x x 2.715 to 19 years .. .. .. .. 56.1 45.4 46.9 41.8 50.2 39.6
15 to 17 years .. .. .. .. 42.1 23.6 23.4 34.3 24.2 19.4
18 to 19 years .. .. .. .. 77.2 79.8 84.5 53.8 92.0 70.720 to 24 years .. .. .. .. 107.2 102.4 93.6 109.8 96.0 97.225 to 29 years .. .. .. .. 101.9 92.8 109.4 104.1 117.3 126.430 to 34 years .. .. .. .. 83.0 76.7 87.3 101.0 91.2 106.435 to 39 years .. .. .. .. 43.4 40.7 32.4 42.0 40.6 43.340 years and over .. .. .. .. x x x x x 7.4Unknown age group ... ... ... ... ... ... ... ... ... ...
Induced abortions 4
All ages .. .. .. .. 24.7 25.0 21.1 21.5 21.1 xUnder 20 years .. .. .. .. x x x x x x
Under 15 years .. .. .. .. x x x x x x15 to 19 years .. .. .. .. 39.0 44.0 41.1 33.9 34.1 x
15 to 17 years .. .. .. .. 27.3 32.2 30.8 23.6 26.2 x18 to 19 years .. .. .. .. 56.6 62.8 57.4 50.6 46.8 x
20 to 24 years .. .. .. .. 69.7 58.1 49.1 52.4 47.1 x25 to 29 years .. .. .. .. 38.9 38.0 27.8 32.0 40.9 x30 to 34 years .. .. .. .. 17.1 21.8 14.8 22.7 19.7 x35 to 39 years .. .. .. .. 8.2 1 0.4 11.5 4.7 9.1 x40 years and over .. .. .. .. x x x x x x
Unknown age group ... ... ... ... ... ... ... ... ... ...
Fetal loss 5
All ages .. .. .. .. 3.6 2.6 3.3 3.1 3.4 xUnder 20 years .. .. .. .. x x x x x x
Under 15 years .. .. .. .. x x x x x x15 to 19 years .. .. .. .. 4.1 2.6 4.6 3.0 1.8 x
15 to 17 years .. .. .. .. 4.6 1.1 3.2 2.0 2.9 x18 to 19 years .. .. .. .. 3.4 5.1 6.8 4.7 0.0 x
20 to 24 years .. .. .. .. 8.0 4.6 8.4 3.2 4.2 x25 to 29 years .. .. .. .. 7.1 5.4 4.7 7.4 9.0 x30 to 34 years .. .. .. .. 0.0 2.7 1.6 5.4 3.8 x35 to 39 years .. .. .. .. 4.6 2.1 3.1 2.1 3.7 x40 years and over .. .. .. .. x x x x x xUnknown age group ... ... ... ... ... ... ... ... ... ...
1. For data year 1999, counts and rates for Nunavut and the Northwest Territories have been combined. Although Nunavut became a separate territory as of
April 1, 1999, not all sources of information (for example, the Hospital Morbidity Database) used in the calculation of pregnancy statistics contained enough
information to provide complete and separate data for Nunavut for the 1999 calendar year.
2. Pregnancies equal the sum of live births, fetal loss and induced abortions.3. Live birth counts are based on registrations in the Birth Database.
4. Induced abortion counts are taken from the Therapeutic Abortion Survey that collects information on abortions performed in hospitals and clinics in Canada, as
well as on abortions performed on Canadian residents in selected American states, for data years prior to 2004.
5. Fetal loss is the sum of stillbirth registrations in the Stillbirth Database and cases of miscarriages, illegal abortions and unspecified abortions reported in
the Hospital Morbidity Database.Note(s): See "Data quality, concepts and methodology — Explanatory notes for the tables " section.Source(s): Statistics Canada, Canadian Vital Statistics, Birth Database and Stillbirth Database; Canadian Institute for Health Information, Hospital Morbidity
Database and Therapeutic Abortion Database (CANSIM table 106-9002).
36 Statistics Canada – Catalogue no. 82-224-X

8/12/2019 Canadian Stats
http://slidepdf.com/reader/full/canadian-stats 39/49
Pregnancy Outcomes – 2005
Table 1-15
Selected pregnancy outcomes statistics, by age group and place of residence of females — Nunavut
1996 1997 1998 1999 1 2000 2001 2002 2003 2004 2005
number of events
Total, pregnancies 2 , 3 , 4
All ages .. .. .. .. 916 880 740 772 955 938Under 20 years .. .. .. .. 214 205 170 171 233 230
Under 15 years .. .. .. .. 9 10 6 4 4 1115 to 19 years .. .. .. .. 205 195 164 167 229 219
15 to 17 years .. .. .. .. 98 88 63 64 116 9018 to 19 years .. .. .. .. 107 107 101 103 113 129
20 to 24 years .. .. .. .. 296 297 240 240 304 27725 to 29 years .. .. .. .. 219 194 171 183 229 22630 to 34 years .. .. .. .. 128 117 103 124 119 13635 to 39 years .. .. .. .. 48 44 47 44 62 5640 years and over .. .. .. .. 11 22 9 9 8 13Unknown age group .. .. .. .. 0 1 0 1 0 0
Live births 5
All ages .. .. .. .. 727 710 726 758 747 699Under 20 years .. .. .. .. x x x x x 162
Under 15 years .. .. .. .. x x x x x 515 to 19 years .. .. .. .. 154 150 158 165 181 157
15 to 17 years .. .. .. .. 72 69 60 64 86 5918 to 19 years .. .. .. .. 82 81 98 101 95 98
20 to 24 years .. .. .. .. 223 238 237 236 237 21225 to 29 years .. .. .. .. 190 155 167 180 175 166
30 to 34 years .. .. .. .. 106 102 103 120 97 10435 to 39 years .. .. .. .. 37 39 46 43 51 4640 years and over .. .. .. .. x x x x x 9Unknown age group .. .. .. .. 0 1 0 1 0 0
Induced abortions 3 , 6
All ages .. .. .. .. 178 148 .. .. x xUnder 20 years .. .. .. .. x x .. .. x x
Under 15 years .. .. .. .. x x .. .. x x15 to 19 years .. .. .. .. 46 41 .. .. x x
15 to 17 years .. .. .. .. 23 17 .. .. x x18 to 19 years .. .. .. .. 23 24 .. .. x x
20 to 24 years .. .. .. .. 71 50 .. .. x x25 to 29 years .. .. .. .. 29 34 .. .. x x30 to 34 years .. .. .. .. 21 12 .. .. x x35 to 39 years .. .. .. .. 10 5 .. .. x x40 years and over .. .. .. .. x x .. .. x xUnknown age group .. .. .. .. 0 0 .. .. 0 x
Fetal loss 4 , 7
All ages .. .. .. .. 11 22 14 14 x xUnder 20 years .. .. .. .. x x x x x x
Under 15 years .. .. .. .. x x x x x x15 to 19 years .. .. .. .. 5 4 6 2 x x
15 to 17 years .. .. .. .. 3 2 3 0 x x18 to 19 years .. .. .. .. 2 2 3 2 x x
20 to 24 years .. .. .. .. 2 9 3 4 x x25 to 29 years .. .. .. .. 0 5 4 3 x x30 to 34 years .. .. .. .. 1 3 0 4 x x35 to 39 years .. .. .. .. 1 0 1 1 x x40 years and over .. .. .. .. x x x x x xUnknown age group .. .. .. .. 0 0 0 0 0 x
See footnotes at the end of the table.
Statistics Canada – Catalogue no. 82-224-X 37
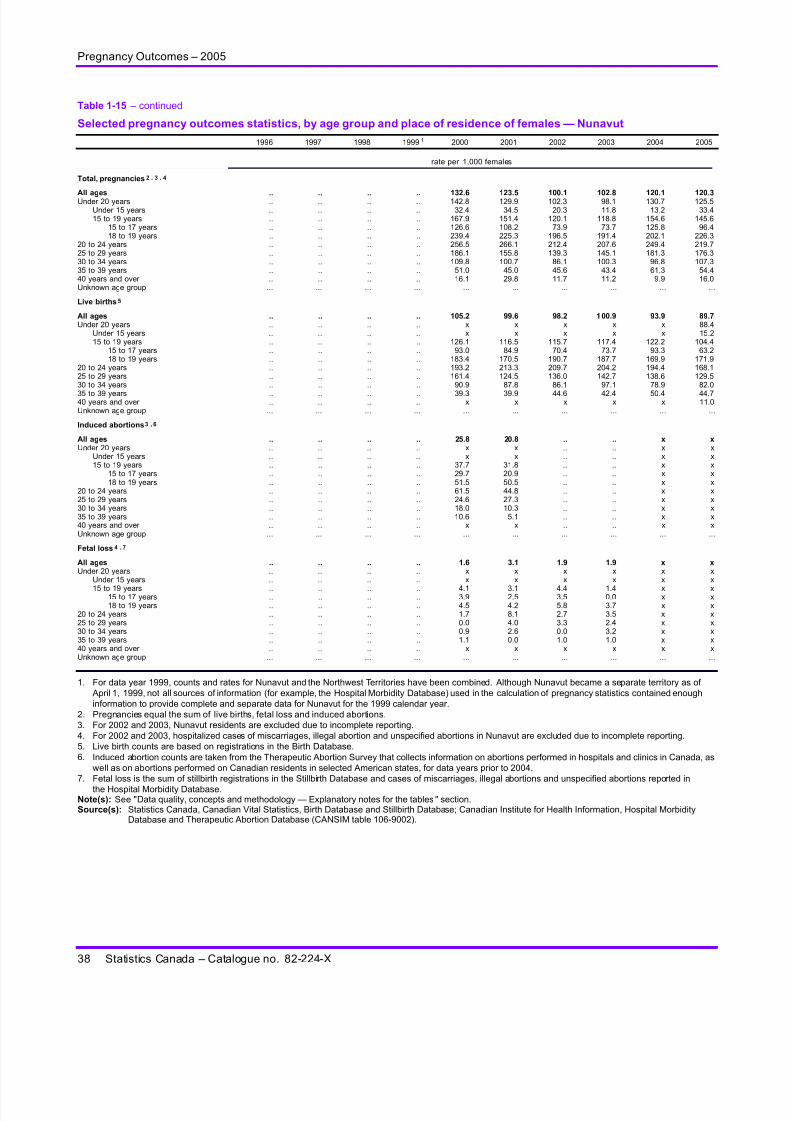
8/12/2019 Canadian Stats
http://slidepdf.com/reader/full/canadian-stats 40/49
Pregnancy Outcomes – 2005
Table 1-15 – continued
Selected pregnancy outcomes statistics, by age group and place of residence of females — Nunavut
1996 1997 1998 1999 1 2000 2001 2002 2003 2004 2005
rate per 1,000 females
Total, pregnancies 2 , 3 , 4
All ages .. .. .. .. 132.6 123.5 100.1 102.8 120.1 120.3Under 20 years .. .. .. .. 142.8 129.9 102.3 98.1 130.7 125.5
Under 15 years .. .. .. .. 32.4 34.5 20.3 11.8 13.2 33.415 to 19 years .. .. .. .. 167.9 151.4 120.1 118.8 154.6 145.6
15 to 17 years .. .. .. .. 126.6 108.2 73.9 73.7 125.8 96.418 to 19 years .. .. .. .. 239.4 225.3 196.5 191.4 202.1 226.3
20 to 24 years .. .. .. .. 256.5 266.1 212.4 207.6 249.4 219.725 to 29 years .. .. .. .. 186.1 155.8 139.3 145.1 181.3 176.330 to 34 years .. .. .. .. 109.8 100.7 86.1 100.3 96.8 107.335 to 39 years .. .. .. .. 51.0 45.0 45.6 43.4 61.3 54.440 years and over .. .. .. .. 16.1 29.8 11.7 11.2 9.9 16.0Unknown age group ... ... ... ... ... ... ... ... ... ...
Live births 5
All ages .. .. .. .. 105.2 99.6 98.2 1 00.9 93.9 89.7Under 20 years .. .. .. .. x x x x x 88.4
Under 15 years .. .. .. .. x x x x x 15.215 to 19 years .. .. .. .. 126.1 116.5 115.7 117.4 122.2 104.4
15 to 17 years .. .. .. .. 93.0 84.9 70.4 73.7 93.3 63.218 to 19 years .. .. .. .. 183.4 170.5 190.7 187.7 169.9 171.9
20 to 24 years .. .. .. .. 193.2 213.3 209.7 204.2 194.4 168.125 to 29 years .. .. .. .. 161.4 124.5 136.0 142.7 138.6 129.5
30 to 34 years .. .. .. .. 90.9 87.8 86.1 97.1 78.9 82.035 to 39 years .. .. .. .. 39.3 39.9 44.6 42.4 50.4 44.740 years and over .. .. .. .. x x x x x 11.0Unknown age group ... ... ... ... ... ... ... ... ... ...
Induced abortions 3 , 6
All ages .. .. .. .. 25.8 20.8 .. .. x xUnder 20 years .. .. .. .. x x .. .. x x
Under 15 years .. .. .. .. x x .. .. x x15 to 19 years .. .. .. .. 37.7 31.8 .. .. x x
15 to 17 years .. .. .. .. 29.7 20.9 .. .. x x18 to 19 years .. .. .. .. 51.5 50.5 .. .. x x
20 to 24 years .. .. .. .. 61.5 44.8 .. .. x x25 to 29 years .. .. .. .. 24.6 27.3 .. .. x x30 to 34 years .. .. .. .. 18.0 10.3 .. .. x x35 to 39 years .. .. .. .. 10.6 5.1 .. .. x x40 years and over .. .. .. .. x x .. .. x xUnknown age group ... ... ... ... ... ... ... ... ... ...
Fetal loss 4 , 7
All ages .. .. .. .. 1.6 3.1 1.9 1.9 x xUnder 20 years .. .. .. .. x x x x x x
Under 15 years .. .. .. .. x x x x x x15 to 19 years .. .. .. .. 4.1 3.1 4.4 1.4 x x
15 to 17 years .. .. .. .. 3.9 2.5 3.5 0.0 x x18 to 19 years .. .. .. .. 4.5 4.2 5.8 3.7 x x
20 to 24 years .. .. .. .. 1.7 8.1 2.7 3.5 x x25 to 29 years .. .. .. .. 0.0 4.0 3.3 2.4 x x30 to 34 years .. .. .. .. 0.9 2.6 0.0 3.2 x x35 to 39 years .. .. .. .. 1.1 0.0 1.0 1.0 x x40 years and over .. .. .. .. x x x x x xUnknown age group ... ... ... ... ... ... ... ... ... ...
1. For data year 1999, counts and rates for Nunavut and the Northwest Territories have been combined. Although Nunavut became a separate territory as of
April 1, 1999, not all sources of information (for example, the Hospital Morbidity Database) used in the calculation of pregnancy statistics contained enough
information to provide complete and separate data for Nunavut for the 1999 calendar year.
2. Pregnancies equal the sum of live births, fetal loss and induced abortions.
3. For 2002 and 2003, Nunavut residents are excluded due to incomplete reporting.
4. For 2002 and 2003, hospitalized cases of miscarriages, illegal abortion and unspecified abortions in Nunavut are excluded due to incomplete reporting.
5. Live birth counts are based on registrations in the Birth Database.
6. Induced abor tion counts are taken from the Therapeutic Abortion Survey that collects information on abortions performed in hospitals and clinics in Canada, as
well as on abortions performed on Canadian residents in selected American states, for data years prior to 2004.
7. Fetal loss is the sum of stillbirth registrations in the Stillbirth Database and cases of miscarriages, illegal abortions and unspecified abortions reported in
the Hospital Morbidity Database.Note(s): See "Data quality, concepts and methodology — Explanatory notes for the tables " section.Source(s): Statistics Canada, Canadian Vital Statistics, Birth Database and Stillbirth Database; Canadian Institute for Health Information, Hospital Morbidity
Database and Therapeutic Abortion Database (CANSIM table 106-9002).
38 Statistics Canada – Catalogue no. 82-224-X

8/12/2019 Canadian Stats
http://slidepdf.com/reader/full/canadian-stats 41/49
Pregnancy Outcomes – 2005
Table 1-16
Selected pregnancy outcomes statistics, by age group and place of residence of females — Unknown province
or territory
1996 1997 1998 1999 2000 2001 2002 2003 2004 2005
number of events
Total, pregnancies 1
All ages 698 1,291 349 275 274 212 198 188 21 187Under 20 years 141 254 92 77 56 45 29 44 3 10
Under 15 years 4 6 3 4 0 4 0 0 0 015 to 19 years 137 248 89 73 56 41 29 44 3 10
15 to 17 years 53 98 33 27 21 17 9 15 1 418 to 19 years 84 150 56 46 35 24 20 29 2 6
20 to 24 years 210 385 97 84 84 59 59 58 7 8125 to 29 years 146 274 66 44 56 39 36 34 7 4830 to 34 years 112 203 49 30 34 38 41 19 3 3035 to 39 years 67 131 33 26 22 20 24 21 0 1240 years and over 22 44 12 12 17 11 8 9 1 6Unknown age group 0 0 0 2 5 0 1 3 0 0
Live births 2
All ages 0 0 7 5 16 2 4 2 6 0Under 20 years 0 0 0 0 1 0 0 0 0 0
Under 15 years 0 0 0 0 0 0 0 0 0 0
15 to 19 years 0 0 0 0 1 0 0 0 0 015 to 17 years 0 0 0 0 0 0 0 0 0 018 to 19 years 0 0 0 0 1 0 0 0 0 0
20 to 24 years 0 0 3 0 3 0 3 0 2 025 to 29 years 0 0 3 1 3 0 0 1 1 030 to 34 years 0 0 1 1 2 0 1 1 2 035 to 39 years 0 0 0 1 0 2 0 0 0 040 years and over 0 0 0 0 2 0 0 0 1 0Unknown age group 0 0 0 2 5 0 0 0 0 0
Induced abortions 3
All ages 698 1,291 342 270 258 209 194 186 14 185Under 20 years 141 254 92 77 55 45 29 44 3 10
Under 15 years 4 6 3 4 0 4 0 0 0 015 to 19 years 137 248 89 73 55 41 29 44 3 10
15 to 17 years 53 98 33 27 21 17 9 15 1 418 to 19 years 84 150 56 46 34 24 20 29 2 6
20 to 24 years 210 385 94 84 81 59 56 58 5 8125 to 29 years 146 274 63 43 53 39 36 33 5 4730 to 34 years 112 203 48 29 32 37 40 18 1 30
35 to 39 years 67 131 33 25 22 18 24 21 0 1140 years and over 22 44 12 12 15 11 8 9 0 6Unknown age group 0 0 0 0 0 0 1 3 0 0
Fetal loss 4
All ages 0 0 0 0 0 1 0 0 1 2Under 20 years 0 0 0 0 0 0 0 0 0 0
Under 15 years 0 0 0 0 0 0 0 0 0 015 to 19 years 0 0 0 0 0 0 0 0 0 0
15 to 17 years 0 0 0 0 0 0 0 0 0 018 to 19 years 0 0 0 0 0 0 0 0 0 0
20 to 24 years 0 0 0 0 0 0 0 0 0 025 to 29 years 0 0 0 0 0 0 0 0 1 130 to 34 years 0 0 0 0 0 1 0 0 0 035 to 39 years 0 0 0 0 0 0 0 0 0 140 years and over 0 0 0 0 0 0 0 0 0 0Unknown age group 0 0 0 0 0 0 0 0 0 0
See footnotes at the end of the table.
Statistics Canada – Catalogue no. 82-224-X 39
8/12/2019 Canadian Stats
http://slidepdf.com/reader/full/canadian-stats 42/49
Pregnancy Outcomes – 2005
Table 1-16 – continued
Selected pregnancy outcomes statistics, by age group and place of residence of females — Unknown province
or territory
1996 1997 1998 1999 2000 2001 2002 2003 2004 2005
rate per 1,000 females
Total, pregnancies 1
All ages ... ... ... ... ... ... ... ... ... ...Under 20 years ... ... ... ... ... ... ... ... ... ...
Under 15 years ... ... ... ... ... ... ... ... ... ...15 to 19 years ... ... ... ... ... ... ... ... ... ...
15 to 17 years ... ... ... ... ... ... ... ... ... ...18 to 19 years ... ... ... ... ... ... ... ... ... ...
20 to 24 years ... ... ... ... ... ... ... ... ... ...25 to 29 years ... ... ... ... ... ... ... ... ... ...30 to 34 years ... ... ... ... ... ... ... ... ... ...35 to 39 years ... ... ... ... ... ... ... ... ... ...40 years and over ... ... ... ... ... ... ... ... ... ...Unknown age group ... ... ... ... ... ... ... ... ... ...
Live births 2
All ages ... ... ... ... ... ... ... ... ... ...Under 20 years ... ... ... ... ... ... ... ... ... ...
Under 15 years ... ... ... ... ... ... ... ... ... ...15 to 19 years ... ... ... ... ... ... ... ... ... ...
15 to 17 years ... ... ... ... ... ... ... ... ... ...18 to 19 years ... ... ... ... ... ... ... ... ... ...
20 to 24 years ... ... ... ... ... ... ... ... ... ...25 to 29 years ... ... ... ... ... ... ... ... ... ...30 to 34 years ... ... ... ... ... ... ... ... ... ...35 to 39 years ... ... ... ... ... ... ... ... ... ...40 years and over ... ... ... ... ... ... ... ... ... ...Unknown age group ... ... ... ... ... ... ... ... ... ...
Induced abortions 3
All ages ... ... ... ... ... ... ... ... ... ...Under 20 years ... ... ... ... ... ... ... ... ... ...
Under 15 years ... ... ... ... ... ... ... ... ... ...15 to 19 years ... ... ... ... ... ... ... ... ... ...
15 to 17 years ... ... ... ... ... ... ... ... ... ...18 to 19 years ... ... ... ... ... ... ... ... ... ...
20 to 24 years ... ... ... ... ... ... ... ... ... ...25 to 29 years ... ... ... ... ... ... ... ... ... ...30 to 34 years ... ... ... ... ... ... ... ... ... ...
35 to 39 years ... ... ... ... ... ... ... ... ... ...40 years and over ... ... ... ... ... ... ... ... ... ...Unknown age group ... ... ... ... ... ... ... ... ... ...
Fetal loss 4
All ages ... ... ... ... ... ... ... ... ... ...Under 20 years ... ... ... ... ... ... ... ... ... ...
Under 15 years ... ... ... ... ... ... ... ... ... ...15 to 19 years ... ... ... ... ... ... ... ... ... ...
15 to 17 years ... ... ... ... ... ... ... ... ... ...18 to 19 years ... ... ... ... ... ... ... ... ... ...
20 to 24 years ... ... ... ... ... ... ... ... ... ...25 to 29 years ... ... ... ... ... ... ... ... ... ...30 to 34 years ... ... ... ... ... ... ... ... ... ...35 to 39 years ... ... ... ... ... ... ... ... ... ...40 years and over ... ... ... ... ... ... ... ... ... ...Unknown age group ... ... ... ... ... ... ... ... ... ...
1. Pregnancies equal the sum of live births, fetal loss and induced abortions.
2. Live birth counts are based on registrations in the Birth Database.
3. Induced abortion counts are taken from the Therapeutic Abortion Survey that collects information on abortions performed in hospitals and clinics in Canada, as
well as on abortions performed on Canadian residents in selected American states, for data years prior to 2004.
4. Fetal loss is the sum of stillbirth registrations in the Stillbirth Database and cases of miscarriages, illegal abortions and unspecified abortions reported in
the Hospital Morbidity Database.Note(s): See "Data quality, concepts and methodology — Explanatory notes for the tables " section.Source(s): Statistics Canada, Canadian Vital Statistics, Birth Database and Stillbirth Database; Canadian Institute for Health Information, Hospital Morbidity
Database and Therapeutic Abortion Database (CANSIM table 106-9002).
40 Statistics Canada – Catalogue no. 82-224-X

8/12/2019 Canadian Stats
http://slidepdf.com/reader/full/canadian-stats 43/49
Definitions
Pregnancies. Pregnancies equal the sum of: live births, induced abortions, and fetal loss (including stillbirths and
hospitalized cases of miscarriages, illegally induced abortion, other and unspecified abortion). Cases of abnormal
products of conception (for example, moles, missed abortions and ectopic pregnancies) are not included. Estimates
of pregnancies are based on the date of termination and not on the date of conception.
Live births. The complete expulsion or extraction from its mother of a product of conception, irrespective of the
duration of the pregnancy, which, after such separation, breathes or shows any other evidence of life, such as
beating of the heart, pulsation of the umbilical cord, or definite movement of voluntary muscles, whether or not the
umbilical cord has been cut or the placenta is attached.
Induced abortions. Induced abortion is defined as the medical termination of pregnancy. Equivalent terms include:
artificial abortion, therapeutic abortion, voluntary termination of pregnancy, elective termination of pregnancy, and
active termination of pregnancy. The source of induced abortion data is the Therapeutic Abortion Survey whichcollects data on induced abortions performed in hospitals and clinics in Canada as well as abortions performed on
Canadian women in selected American states, for data years prior to 2004.
Fetal loss. Fetal loss includes stillbirths and hospitalized cases of miscarriages, illegal abortions and unspecified
abortions.
• Stillbirth (fetal death). Death prior to the complete expulsion or extraction from its mother of a product of
conception, irrespective of the duration of pregnancy; the death is indicated by the fact that after such separation
the fetus does not breathe or show any other evidence of life, such as beating of the heart, pulsation of the
umbilical cord, or definite movement of voluntary muscles. Only fetal deaths where the product of conception has
a birth weight of 500 grams or more or the duration of pregnancy is 20 weeks or longer are registered in Canada.
• In Quebec (and New Brunswick, prior to November 1996 and Saskatchewan prior to 2001), only fetal deaths
(stillbirths) weighing 500 or more grams must be reported, regardless of the gestation period. Until 1997, a
gestation period of at least 20 weeks was required in Prince Edward Island, regardless of birth weight.
• In New Brunswick, if the stillborn fetus is the result of an induced abortion, it is not registered as a stillbirth; the
abortion event, however, will be reported to the Therapeutic Abortion Survey.
• Hospitalized cases of miscarriages, illegal abortion and unspecified abortions. Miscarriage, also known as
spontaneous abortion, is the loss of products of conception from natural causes before the 20th week of gestation.
Only cases requiring the hospitalization of the woman can be included in the calculation of fetal loss because there
is no national data collection system or reporting requirements for miscarriages treated outside of hospital.
• Illegal abortions are those hospital cases in which the most responsible diagnosis was assigned the World Health
Organization’s International Classification of Diseases (ICD) code for illegally induced abortion.
• Unspecified abortions are those hospital cases in which the most responsible diagnosis was assigned the ICD
code for unspecified abortion. In other words, there was no indication on the patient’s medical record as to whether
the abortion was an induced abortion, spontaneous abortion or an illegal abortion.
Statistics Canada – Catalogue no. 82-224-X 41

8/12/2019 Canadian Stats
http://slidepdf.com/reader/full/canadian-stats 44/49

8/12/2019 Canadian Stats
http://slidepdf.com/reader/full/canadian-stats 45/49
Pregnancy Outcomes – 2005
Disclosure control
Before releasing annual induced abortions data to the public, Statistics Canada requests authorization from those
provinces and territories that supplied data for three or fewer hospitals or three or fewer clinics. The data from
those provinces and territories from which no authorization was received are suppressed; and if there is only one
non-authorrization, then the data from another selected province or territory are suppressed to prevent residual
disclosure.
As of 1997, cell counts of less than 5 are suppressed for induced abortion data. To prevent residual disclosure, in
addition to these cells with counts of less than 5, other selected induced abortion data cells are also suppressed.
Before 2005, the corresponding cells for births and fetal loss data were suppressed as well; but, as of 2005, only
the corresponding cells for fetal loss data are suppressed to prevent the residual disclosure of suppressed induced
abortions data.
Before 2005, to streamline the suppression process, routine suppression was performed on certain age groups
within certain provinces and territories for live births, fetal loss, and induced abortion data. Specifically, the age
groups ’Under 20’, ’Under 15’ and ’Age 40 and over’ were suppressed for Prince Edward Island, the Yukon Territory,
the Northwest Territories and Nunavut. After 2004, this routine suppression was no longer performed.
No other disclosure control is required for birth or fetal loss data, and no disclosure control is required on totalpregnancy data.
In 2005, all fetal loss and induced abortion data were suppressed for the Northwest Territories and Nunavut for
confidentiality.
Data quality
This section describes the methodology used in the compilation of pregnancy statistics, and highlights data quality
issues.
Total pregnancies
The number (count) of pregnancies is calculated by summing counts of live births, induced abortions, and fetal loss.
The counts of total pregnancies as well as the counts for the three outcomes of pregnancy are presented by age
group and province or territory of residence of the woman experiencing the pregnancy. Rates for total pregnancy
and the three outcomes of pregnancy are calculated using the population counts of women for the specified age
groups and province and territory of residence.
Pregnancy data are presented according to the calendar year in which the pregnancy terminated and not the year
in which conception took place. As a result, there is some under representation of teenage pregnancies because
there will be cases of women who became pregnant when they were 19 years old but whose pregnancy terminated
when they were 20 years old.
Due to the improvement in age group estimations for abortion data for the data years 1994 to 1997, the total
pregnancy counts by age group at the Canada level no longer match any previously produced statistics.
Although Nunavut became a separate territory as of April 1, 1999, not all sources of information (for example,
the Hospital Morbidity Data Base (HMDB)) contained enough information to provide complete and separate data
for the1999 calendar year for Nunavut. As a result, separate pregnancy data for Nunavut is available as of data
year 2000. Prior to 2000, data for Nunavut and the Northwest Territories are combined.
Statistics Canada – Catalogue no. 82-224-X 43
8/12/2019 Canadian Stats
http://slidepdf.com/reader/full/canadian-stats 46/49
Pregnancy Outcomes – 2005
Live births
Counts of live births are not estimates. They are counts of all registered live births tabulated from the vital statistics
registration system in existence in the ten provinces and three territories of Canada. Due to legal requirements,
registration of live births is considered to be virtually complete.
Induced abortions
One of the limitations of the Therapeutic Abortion Survey is that information on the age of the woman obtaining an
abortion is not always reported, especially for abortions performed in clinics. As a result, age group estimations have
to be calculated when necessary. In some cases, information on the residence of the woman is also not available,
but no estimations have been done for these cases.
Abortions performed in the United States (US) on Canadian residents
For the original statistical releases of the data years 1994 to 2001 US counts were excluded from the age distribution
and included only in the counts for ’unknown’ age group in the category ’unknown province of residence’.
In this current product, the US counts are distributed over the age groups within the category ’Unknown province of
residence’. (The abortion counts received from the US are aggregated by age group, but no information is supplied
on the province or territory of residence.)
As of the 2004 reference year data, reports of Canadian women obtaining induced abortions in the United States
are no longer obtained.
Revision of age group estimations for 1994 to 1997
For the 1994 to 1997 data years, a large number of abortions were reported to the Therapeutic Abortion Survey
without any information on the age of the woman. When these data were first released, age groups were estimated
at the Canada level in order to produce counts and rates by age group for Canadian residents. No estimations were
produced at the provincial or territorial level.
Age groups have now been estimated f or induced abortions at the provincial and territorial level. As a result of these
new estimations, any previously released age group statistics at the Canada level will not match the latest Canada
level statistics.
As well, since induced abortion is one of the outcomes included in the calculation of total pregnancy, the counts and
rates by age group at the Canada level for total pregnancy will not match previously published statistics.
Data years 1995 to 1997 (unknown residence and unknown age group)
When data years 1995, 1996 and 1997 were originally released, age estimations were not calculated for the counts
of clinic abortions where the area of residence was unknown and the age was unknown. Age estimations have now
been calculated for these counts, using the known national age distribution for hospital abortions.
Data year 1998
Ontario reported 2,795 clinic abortions with no age group information. The known proportion of Ontario residents
who obtained an abortion in hospital was used to estimate the age group of these clinic counts.
British Columbia reported 725 clinic counts with no age group information. The known proportion of British Columbia
residents who obtained an abortion in hospital was used to estimate the age group of these clinic counts.
Estimation of teen subgroups (15 to 17 and 18 to 19)
Statistics on the number of teens in the subgroups 15 to 17 and 18 to 19 rely heavily on estimation. This is particularly
a problem for clinic abortions where only the broad age group 15 to 19 has been provided or estimated. The
calculation of teen subgroups is important for analysis purposes because the experiences of young teens (15 to 17)
tend not to be the same as for older teens (18 to 19).
44 Statistics Canada – Catalogue no. 82-224-X

8/12/2019 Canadian Stats
http://slidepdf.com/reader/full/canadian-stats 47/49

8/12/2019 Canadian Stats
http://slidepdf.com/reader/full/canadian-stats 48/49
Pregnancy Outcomes – 2005
Rates
Rates are calculated by taking the number of events (total pregnancies, live births, induced abortions or fetal loss) in
a given period of time and dividing it by the female population at risk during that period of time, and then multiplying
the result by 1,000.
’All Ages’ (total) rates
‘All Ages’ (total) rates are calculated for total pregnancies as well as for each outcome of pregnancy. The ‘All Ages’
rates are defined as the number of events per 1,000 women aged 15 to 49.
It is important to note that for the Pregnancy Outcomes product, the rate for the ‘All Ages’ group for Induced Abortions
is based on the female population aged 15 to 49. Whereas, in the Induced Abortion Statistics product, the rate for
the ‘All Ages’ group is based on the female population 14 to 44 in tables where there are age breakdowns. (In
Induced Abortion tables where there are no age breakdowns, the overall rate is based on the female population
aged 15 to 44.). As a result, the ‘All Ages’ rate for abortion will be different, depending upon the product this
information is from.
Age-specific rates
Age-specific rates are calculated for total pregnancies as well as for each outcome of pregnancy. Age-specific ratesare the number of events per 1,000 females of the same age (or age group).
The age groups used in this publication are: Under 20, Under 15, 15 to 19 (plus the subgroups 15 to 17 and 18 to
19), 20 to 24, 25 to 29, 30 to 34, 35 to 39, and 40 years and over.
The rates for the ’Under 20’ age group are based on the female population aged 14 to 19; the rates for the ’Under 15’
age group are based on the female population aged 14 years; and the rates for the ’40 years and over’ age group
are based on the female population aged 40 to 44.
46 Statistics Canada – Catalogue no. 82-224-X

8/12/2019 Canadian Stats
http://slidepdf.com/reader/full/canadian-stats 49/49
Explanatory notes for the tables
Table 1
Selected pregnancy outcomes statistics, by age group and place of residence of females
Sources: Statistics Canada, Canadian Vital Statistics, Birth Database and Stillbirth Database; Canadian Institute
for Health Information, Hospital Morbidity Database and Therapeutic Abortion Database. The Statistics Canada
publication Reproductive Health: Pregnancies and Rates, Canada, 1974-1993 (catalogue no. 82-568-XPB) was
a major source of data for the years prior to 1994.
Rates for the "All Ages" group are based on the population of females aged 15 to 49 years. The numerator used
in the rate calculation is the total number of events (total pregnancies, live births, induced abortions or fetal loss)
occurring to females, regardless of their age.
Rates for the "Under 20 years" age group are based on the female population aged 14 to 19 years. Rates for
the "Under 15 years" age group are based on the female population aged 14 years. Rates for the "40 years and
over" age group are based on the female population aged 40 to 44 years.
Pregnancy rate corresponds to the number of pregnancies per 1,000 females of the same age group.
Live birth rate corresponds to the number of live births per 1,000 females of the same age group. The live birth
rate is also referred to as the fertility rate.
Fetal loss rate corresponds to the number of fetal losses (stillbirths and hospitalizations for miscarriages)
per 1,000 females of the same age group.
Induced abortion rate corresponds to the number of induced abortions per 1,000 females of the same age group.
The number of hospitalizations for miscarriages began to be included in the calculation of fetal loss for theNorthwest Territories as of 1994, and for the Yukon Territory as of 1995. Prior to these years, fetal loss for these
territories included cases of stillbirths only.
Source of population counts used in the calculation of rates: Statistics Canada, Estimates of population, by age
group and sex, Canada, provinces and territories, annual (CANSIM table 051-0001). From July 1, 1974 to 1995,
estimates are revised intercensal, final intercensal from 1996 to 2000, and final postcensal for 2001 to 2004; and
updated postcensal for 2005. The population estimates are updated quarterly. The 2005 population counts used
in the Pregnancy Outcomes table were downloaded on February 21, 2008.


