72
Cancer Incidence and Mortality in Nebraska: 2015 May 2018
Cancer Incidence and Mortality in Nebraska
2015
May 2018
The Nebraska Cancer Registry contains a wealth of information not all of which is included in this report
What types of data are available
bull Demographic age at diagnosis gender raceethnicity county of residence
bull Medical history date of diagnosis primary site cell type stage of disease at diagnosis
bull Therapy surgery radiation therapy chemotherapy immunotherapy hormone therapy
bull Follow up length of survival cause of death
Who may request data from the Nebraska Cancer Registry
bull Medical Researchers bull Health Planners bull Market Researchers bull Health Care Facility Administrators bull Physicians bull Nurses bull Health Care Facility Cancer Committees bull Oncology Conference Planners and Speakers bull Patient Care Evaluators bull Pharmaceutical Companies bull Government Officials bull Concerned Citizens bull Students
How do I make a request
Contact the Office of Health Statistics at the Nebraska Department of Health and Human Services
Division of Public Health PO Box 95026 Lincoln NE 68509-5026
Phone 402-471-2180 Monday-Friday between 8 AM and 5 PM
Please note To comply with confidentiality regulations the Nebraska Department of Health and Human Services reserves the right to limit the amount and type of data that are released in response to a request
NEBRASKA CANCER REGISTRY 2015 ANNUAL REPORT
Nebraska Department of Health and Human Services
Courtney Phillips PhD Chief Executive Officer Nebraska Department of Health and Human Services
Thomas Williams MD Chief Medical Officer Division of Public Health
Susan Strohn JD Deputy Director Division of Public Health
Ming Qu MEd PhD Administrator Epidemiology amp Informatics Unit
Michelle Hood Administrator Office of Health Statistics
Lifeng Li MPH Epidemiology Surveillance Coordinator
Norm Nelson MS Statistical Analyst
Christophe Irumva MS Health Data Coordinator
Janis Singleton Administrative Assistant
This publication was supported by Cooperative Agreement Grant Number 5NU58DP003928 from the Centers for Disease Control and Prevention (CDC) Its contents are solely the responsibility of the authors and do not necessarily represent the official view of CDC
______________________________________________________________________
Adrienne Bohnenkamp RHIT CTR Quality Assurance Coordinator
Lori Aistrope
Early Case Capture Data Coordinator
A special thank you to Nebraska Cancer Registry Advisory Committee members who provided advice and assistance to the Nebraska Cancer Registry and also reviewed this report
Nebraska Cancer Registry Advisory Committee Members
Jane Meza Senior Associate Dean College of Public Health University of Nebraska Medical Center
Daniel Lydiatt MD Methodist Cancer Center
Shinobu Watanabe-Galloway PhD College of Public Health University of Nebraska Medical Center
Marilyn J Voss RN CCM Nebraska Methodist Hospital
John Casey MD Lincoln Nebraska
Julie Nielsen RHIT LPN CTR Nebraska Cancer Registry
Stephen Dreyer MD Fremont Area Medical Center
Judy Gray CTR Consultant
F William Karrer MD Methodist Cancer Center
Shelly Spencer CTR St Elizabeth Regional Medical Center
Nagamani Narayana MS DMD University of Nebraska College of Dentistry
Alan Thorson MD FACS Colon and Rectal Surgery University of Nebraska Medical Center
Tamara Robinson MS American Cancer Society Inc
Nebraska Cancer Registry Data Collection Staff
Julie Nielsen RHIT LPN CTR Coordinator
John Werthmann NCR Abstractor
Table of Contents
EXECUTIVE SUMMARY1
INTRODUCTION3
METHODOLOGY4
Data Collection and Management4
Confidentiality 4
Quality Assurance5
Definitions6
CANCER INCIDENCE IN NEBRASKA8
CANCER MORTALITY IN NEBRASKA16
INCIDENCE AND MORTALITY FOR SELECTED PRIMARY SITES 23
Lung and Bronchus23
Breast (Female only) 25
Colon and Rectum (Colorectal)27
Prostate 29
Urinary Bladder31
Non-Hodgkin Lymphoma 33
Leukemia35
Kidney and Renal Pelvis 37
Melanoma of the Skin 39
Liver and Intrahepatic Bile Ducts 41
INCIDENCE AND MORTALITY RATE MAPS FOR SELECTED PRIMARY SITES 44
REFERENCES65
EXECUTIVE SUMMARY
The Cancer Incidence and Mortality in Nebraska annual report for 2015 provides a comprehensive overview of the impact of cancer in Nebraska The purpose of the report is to present the most recent statistics that describe cancer incidence and mortality in Nebraska for the entire state and by county and region in-depth analyses of selected cancer sites and comparisons of trends between Nebraska and the United States Findings from the report include
bull Overall Cancer Incidence In 2015 there were 9864 diagnoses of cancer among Nebraska residents This number is slightly higher than the number of cancers that were diagnosed in 2014 (9514)
bull Cancer Incidence by Gender In 2015 prostate lung and colorectal cancers were the most frequently diagnosed cases among Nebraska men while breast lung and colorectal cancers were the most frequently diagnosed cases among Nebraska women Taken together these cancers accounted for about half of all cancer cases diagnosed among Nebraska residents in 2015
bull Cancer Incidence by Age During the past five years (2011-2015) more than half (56) of all cancers in Nebraska occurred among people 65 years of age and older Less than 1 were diagnosed among children and adolescents The average age at diagnosis was 65 years of age
bull Cancer Incidence by Site During the past five years (2011-2015) cancers of the stomach liver in situ female breast and lung were diagnosed significantly less often among Nebraska residents when compared to the US as a whole while colorectal melanoma of skin and testicular cancers were diagnosed significantly more often The number of melanomas diagnosed among Nebraska residents set a new single-year record in 2015 with 523 cases
bull Cancer Incidence by Race During the past decade (2006-2015) African-Americans in Nebraska were significantly more likely to be diagnosed with myeloma colorectal kidney liver lung pancreas and prostate cancers than were whites Liver cancer diagnoses were also significantly more frequent among Native Americans Asian-AmericanPacific Islanders and Hispanics compared to whites
bull Overall Cancer Mortality In 2015 3490 Nebraska residents died from cancer which is a slight increase from the 2014 cancer death total of 3443 Cancer was the second leading cause of death in Nebraska in 2015 surpassed by heart disease by 76 deaths
bull Cancer Mortality by Site During the past five years (2011-2015) deaths from cancers of the stomach liver lung and female breast occurred significantly less often among Nebraska residents when compared to the US as a whole while deaths from kidney and invasive brain tumors occurred significantly more often Lung cancer was the leading cause of cancer mortality in Nebraska in 2015 accounting for 260 of all cancer deaths followed by colorectal cancer During
Nebraska Department of Health and Human ServicesCancer Registry 1
the past two decades prostate and female breast cancer mortality rates in Nebraska have both declined by more than 50 which is consistent with national trends
bull Cancer Incidence by County Below are the Nebraska counties where cancer incidence during 2011-2015 was significantly different (plt05) from the state (NOTE counties with fewer than 20 cases are not included)
Significantly lower Significantly higher County Primary Sites County Primary Sites
Adams Kidney amp renal pelvis Butler Urinary bladder Box Butte Lung amp bronchus Dodge Prostate Buffalo Lung amp bronchus Douglas Lung amp bronchus
Liver amp intrahepatic bile ducts Melanoma of skin
Cedar Lung amp bronchus Custer Female breast Gage Melanoma of skin Hall Female breast Holt Prostate Holt Female breast Kearney Colon amp rectum Lancaster Non-Hodgkin lymphoma Keith Female breast
Non-Hodgkin lymphoma Lincoln Female breast Madison Urinary bladder Lincoln Urinary bladder
Non-Hodgkin lymphoma Leukemia
Sarpy Prostate Scotts Bluff Lung amp bronchus
Female breast Madison Prostate Seward Lung amp bronchus Sarpy Melanoma of skin York Female breast
bull Annual Report Special Topic The special topic for this report is cancer of the liver The liver is the largest internal organ in the body located on the right side of the belly with the gallbladder sitting under it Along with the pancreas and intestines the liver functions in digesting absorbing and processing food It also filters the blood detoxifies chemicals and metabolizes drugs coming from the digestive tract Liver cirrhosis heavy alcohol use chronic viral hepatitis (types B and C) obesity exposure to arsenic and vinyl chloride and using anabolic steroids are known risk factors for cancer of the liver During the past five years (2011shy2015) liver cancer accounted for 604 new cases and 502 deaths among Nebraska residents making it the ninth leading cause of cancer deaths in Nebraska during this time
Nebraska Department of Health and Human ServicesCancer Registry 2
INTRODUCTION
This publication represents the 29th annual statistical summary of the Nebraska Cancer Registry (NCR) since it began collecting data in 1987 The purpose of this report is to present the registryrsquos most recent data to the citizens of the State of Nebraska The majority of the data covers cancer diagnoses and cancer deaths that occurred between January 1 2015 and December 31 2015 as well as during the past five years (January 1 2011-December 31 2015)
The NCR was founded in 1986 when the Nebraska Unicameral authorized funding for a state cancer registry using a portion of funds generated by the statersquos cigarette tax The establishment of the registry successfully combined the efforts of many Nebraska physicians legislators concerned citizens and the Nebraska Medical Foundation all of whom had worked for years toward this goal The Nebraska Medical Foundation also helped establish the registry with financial assistance Since 1994 the NCR has received additional funding from the Centers for Disease Control and Prevention (CDC)
The NCR is managed by the Nebraska Department of Health and Human Services (DHHS) in Lincoln However registry data is collected and edited by NCR staff in Omaha under contract to the Methodist Hospital Association Analysis of registry data and preparation of the annual statistical report are the responsibilities of DHHS
The purpose of the registry is to gather data that describes how many Nebraska residents are diagnosed with cancer what types of cancer they have how far the disease has advanced at the time of diagnosis what types of treatment they receive and how long they survive after diagnosis These data are put to a variety of uses both inside and outside of DHHS Within DHHS they are used to identify high-risk populations and longshyterm disease trends to compare Nebraskarsquos cancer experience with the rest of the nation to investigate reports of possible cancer clusters and to help plan and evaluate cancer control programs Outside of DHHS the registry provides data upon request for research studies and public information and has provided data to the North American Association of Central Cancer Registries (NAACCR) the National Cancer Institute (NCI) the American Cancer Society (ACS) CDC and the University of Nebraska Medical Center among others The NCR also contributes its data to several national cancer incidence databases (see page 5) In recognition of the accuracy and completeness of the data that it has collected NAACCR has awarded the NCR its gold standard certificate of data quality for 20 consecutive years from 1995 to 2014
All individual records in the cancer registry are kept in strict confidence as prescribed by both state and federal law The NCR follows all of the privacy safeguards in the Health Insurance Portability and Accountability Act (HIPAA) although some of the procedural requirements do not apply to the registry
DHHS welcomes inquiries about cancer from the public for aggregate statistics or general information from the registry To obtain cancer data or information about the registry not included in this report please refer to the instructions provided inside the front cover
An electronic copy of this report is available on the DHHS website at httpdhhsnegovpublichealthPagesced_cancer_indexaspx
Nebraska Department of Health and Human ServicesCancer Registry 3
METHODOLOGY
Data Collection and Management
The NCR gathers data on Nebraska residents diagnosed and treated for invasive and in situ tumors The registry does not include benign tumors (except for benign brain and other nervous system tumors which became reportable as of January 1 2004) benign polyps and basal cell and squamous cell carcinomas of the skin Information gathered from each case includes the patientrsquos name address birth date race gender and Social Security number date of diagnosis primary site of the cancer (coded according to the International Classification of Diseases for Oncology 3rd edition [ICD-O-3]) stage of disease at diagnosis facility where the initial diagnosis was made basis of staging method of diagnostic confirmation histological type (also classified according to the ICDshyO-3) and initial treatment The registry does not actively collect follow-up information on registered cases but many facilities provide it and it includes the date of last contact with the patient status of disease type of additional treatment and quality of survival The registry collects information from every hospital in the state where cancer patients are diagnosed andor treated on an inpatient basis The registry also includes Nebraska residents who are diagnosed with andor treated for cancer out of state as well as cases identified through pathology laboratories outpatient treatment facilities physician offices and death certificates Death of registered cases is ascertained using death certificates available at DHHS and from the National Death Index
Nebraska cancer mortality data are obtained from death certificates on file with DHHS Mortality data are available for every Nebraska resident who dies from cancer whether death occurs in or outside of Nebraska The mortality data presented in this report is limited to those deaths where cancer is listed as the underlying (ie primary) cause of death Causes of death are coded according to the Tenth Edition of the International Classification of Disease (ICD-10)
The US cancer incidence data presented in this report were compiled by CDCrsquos National Program of Cancer Registries (NPCR) and NCIrsquos Surveillance Epidemiology and End Results (SEER) Program NPCR provides support for cancer registries in 45 states (including Nebraska) the District of Columbia and some US territories and covers 96 of the total US population The mortality data presented in this report were compiled by the National Center for Health Statistics (NCHS) and include all US resident cancer deaths Incidence data from NPCR and mortality data from NCHS are available through 2014
Confidentiality
All data obtained by the NCR from the medical records of individual patients is held in strict confidence by DHHS As specified in state statute researchers may obtain case-specific andor patient-identifiable information from the registry by submitting a written application that describes how the data will be used for scientific study In situations where contact with a patient or patientrsquos family is proposed the applicant must substantiate the need for any such contact and submit approval from an Institutional Review Board In addition before any individualrsquos name can be given to a researcher the registry must obtain permission from the individual that they are willing to be a research subject Upon favorable review by DHHS the applicant must also agree to maintain the confidentiality
Nebraska Department of Health and Human ServicesCancer Registry 4
and security of the data throughout the course of the study to destroy or return the registry data at the end of the study and to present material to the registry prior to publication to assure that no identifiable information is released
Aggregate data (ie statistical information) from the registry are considered open to the public and are available upon request Details on how to obtain such data are provided inside the front cover of this report
Quality Assurance
The NCR and reporting facilities spend a great deal of time and energy to ensure that the information they gather is both accurate and complete and these efforts have met with consistent success For 20 consecutive years (1995-2014) the NCR has met all of the criteria necessary to earn the gold standard certificate of data quality awarded by NAACCR which is the accrediting body for all US and Canadian central cancer registries These criteria include
1) Completeness of case ascertainmentndash-The registry must find at least 95 of the total number of cases that are estimated to have occurred
2) Completeness of informationndash-The proportion of registry cases missing information on age at diagnosis gender and county of residence must be no more than 2 and the proportion missing information on race must be no more than 3
3) Data accuracyndash-Error rates based on edit checks of selected data items must be no greater than 1
4) Timelinessndash-All data for a single calendar year must be submitted to NAACCR for review no more than 23 months after the year has ended
Gold standard certification also requires that all cases pass strict edits and that the proportion of registry cases found solely through a review of death certificates must be no more than 3 and that the proportion of duplicate cases in the registry must be no more than one per 1000
Since the NCR has achieved the highest quality standards its data are included in several national cancer incidence databases These databases compile information from cancer registries throughout the United States and Canada that meet the same data quality standards as the NCR These databases include
1) Cancer in North America (httpwwwnaaccrorg)
2) United States Cancer Statistics (httpsnccdcdcgovuscs)
3) Cancer Facts amp Statistics (httpwwwcancerorgresearchcancerfactsstatisticsindex)
4) Cancer Control PLANET (httpcancercontrolplanetcancergov)
Nebraska Department of Health and Human ServicesCancer Registry 5
Definitions
Several technical terms are used in presenting the information in this report The following definitions are provided here to assist the reader
Incidence rate Incidence rate is the number of new cases of a disease that occur within a specific population during a given time period divided by the size of the population For example if 10 residents of a county with 20000 residents are diagnosed with colorectal cancer during a single year then the incidence rate of colorectal cancer for that county for that year is 0005 Since cancer incidence rates are usually expressed per 100000 population this figure is then multiplied by 100000 to yield a rate of 50 per 100000 per year
Mortality rate Mortality rate is the number of deaths that occur within a specific population during a given time period divided by the size of the population Like incidence rates mortality rates are usually expressed as the number of deaths per 100000 population per year
Age-adjusted rate Age-adjustment is a simple mathematical procedure that makes it possible to compare rates between populations that have different age distributions and to compare rates within a single population over time All of the incidence and mortality rates in this report are age-adjusted using the US population in 2000 as the standard Statewide and national rates are age-adjusted using 19 age groups (lt1 1-4 5-9 10-14 15-19 20-24 25-29 30shy34 35-39 40-44 45-49 50-54 55-59 60-64 65-69 70-74 75-79 80-84 85+ years) while county and regional rates are age-adjusted using 11 age groups (lt1 1-4 5-14 15shy24 25-34 35-44 45-54 55-64 65-74 75-84 85+ years)
Stage of Disease at Diagnosis In situ Tumors diagnosed as in situ consist of invasive cells that are growing in place In situ tumors are confined to the cell group of origin and have not penetrated the supporting structure of the organ on which they arose
Invasive Tumors diagnosed as invasive have spread beyond the cell group of the organ where they began and may have spread further The organ where a malignancy began is also known as the primary site Invasive tumors are subdivided into three categories
Localized--A localized invasive tumor has not spread beyond the organ where it started
Regional--A regional invasive tumor has spread beyond the organ where it began by direct extension to immediately adjacent organs or tissues andor by spread to regional lymph nodes
Distant--A distant invasive tumor has spread beyond the primary site to distant parts of the body
Nebraska Department of Health and Human ServicesCancer Registry 6
Data Analysis
All of the rates presented in this report were calculated using Vintage 2016 bridged-race population estimates developed by the US Census Bureau and the National Center for Health Statistics Incidence and mortality rates for multiple years (2011-2015) (see Tables 1 2 5 6 9-20) were calculated using population estimates for the years 2011-2015 combined while rates for 2006-2015 (see Tables 3 and 7) were calculated using population estimates for the years 2006-2015 combined Rates that are based on more than one year of data should be interpreted as an average annual rate
All of the data presented in this report are current through December 31 2017 However because some cases diagnosed during or even before 2015 may not yet have been reported to the registry the incidence data presented in this report should be considered subject to change In addition the incidence data reported in previous editions of this report should no longer be considered complete
Internet users should also be aware that the cancer statistics for Nebraska that are published in this report and those that are posted on non-DHHS websites (see page 5) may differ Some discrepancies may be the result of differences in the dates at which the data were compiled As noted above Nebraska incidence data published in this report include all cases reported to the registry through December 31 2017 Nebraska data available on the CDCNPCR website include cases that were reported through November 30 2015
With the exception of bladder cancer in situ female breast cancer and benign brain tumors all of the site-specific incidence rates in this report were calculated with invasive cases only to maintain comparability with statistics from the NPCR and other cancer registries throughout the United States For bladder cancer incidence rates were calculated with invasive and in situ cases combined All incidence and mortality rates in this report were calculated per 100000 population and were age-adjusted according to the age distribution of the population of the United States in 2000 Statewide rates were also calculated for males and females separately and for both sexes combined The number of cases for any county with fewer than three cases is not shown in order to reduce the possibility of identifying a specific person
To evaluate the statistical significance of the differences between rates confidence intervals for rates were calculated using the formula Cl = r + (RC x SE) where Cl = confidence interval r = rate RC = 196 (for 95 confidence intervals) or 258 (for 99 confidence intervals) and SE = standard error The standard error for a rate was determined by dividing the rate by the square root of the number of events (cancer diagnoses or deaths) A statistically significant difference exists and is indicated in those instances where the confidence intervals of a pair of rates being compared to each other do not overlap
Nebraska Department of Health and Human ServicesCancer Registry 7
CANCER INCIDENCE IN NEBRASKA
The Nebraska Cancer Registry recorded 9864 diagnoses of cancer among Nebraska residents in 2015 an increase from the 9514 diagnoses recorded in 2014 The 2015 number translates into an incidence rate of 4565 cases per 100000 population By primary site cancers of the lung breast prostate colon and rectum occurred most frequently accounting for about half (485) of all diagnoses Recent registry experience suggests that as the registry continues to record cases the final count for 2015 will probably increase by 100 to 300 cases
Table 1 presents the number and rate of cancers diagnosed among Nebraska residents during 2015 and 2011-2015 for all sites combined and for cancers of specific sites The most current estimates of US cancer incidence which cover the years 2010-2014 are also included Comparison of the most recent state and national incidence rates for the past five years shows significant differences (plt01) for cancers of the stomach liver in situ female breast and lung (Nebraska rates lower than the US) and for cancers of the colon and rectum melanoma of skin and testes (Nebraska rates higher than the US) Table 2 presents the number of cancers diagnosed in Nebraska during 2011-2015 by age at diagnosis Table 3 presents Nebraska incidence data by race and ethnicity for the years 2006-2015
Maps on pages 13-14 present cancer incidence rates for 2015 and 2011-2015 by place of residence local statistics by place of residence are also found in the appendix to this report (Table 1A [county]mdashpage 1 and Table 13A [local health department region]mdashpage 25) The graph below presents the annual incidence rates for all cancers for Nebraska and the United States since 2006
Cancer (All Sites)Incidence Rates Nebraska (2006-2015) amp US (2006-2014)
3000
3500
4000
4500
5000
5500
6000
Ag
e-a
dju
ste
d r
ate
(p
er
10
00
00
po
pu
lati
on
)
2006 2007 2008 2009 2010 2011 2012 2013 2014 2015
Nebraska 4876 4963 4834 4576 4662 4632 4461 4510 4436 4565
US 4813 4853 4813 4763 4647 4637 4500 4457 4366
Nebraska Department of Health and Human ServicesCancer Registry 8
9
Nebraska D
epartment of H
ealth and Hum
an ServicesC
ancer Registry
TABLE 1 Cancer Incidence Number of Cases and Rates by Selected Primary Site and Gender
Nebraska (2015 and 2011-2015) amp US (2010-2014)
NEBRASKA NEBRASKA US 2015 2011-2015 2010-2014
Site Male Female Total Male Female Total Male Female Total No Rate No Rate No Rate No Rate No Rate No Rate Rate Rate Rate
All Sites 4921 4840 4943 4419 9864 4565 24512 5014 23112 4213 47625 4537 5010 4177 4517
Oral Cavity amp Pharynx 179 171 90 74 269 121 872 173 358 64 1230 116 173 64 115
Esophagus 85 84 16 13 101 46 427 85 95 16 522 48 80 18 46
Stomach 74 75 43 36 117 54 365 76 160 28 525 50 92 46 67
Small Intestine 27 29 30 27 57 28 144 30 94 17 238 23 27 20 23
Colon amp Rectum 460 466 460 390 920 428 2381 494 2146 374 4527 430 458 348 398 Liver amp Intrahepatic Bile Ducts 97 88 39 32 136 59 433 84 170 29 604 55 120 42 78
Pancreas 148 146 143 120 291 132 693 144 625 108 1318 125 142 110 125
Larynx 59 52 13 11 72 31 266 52 72 13 338 31 60 13 35
Lung amp Bronchus 658 660 601 509 1259 571 3383 706 2875 501 6258 590 726 526 612
Soft Tissue 41 43 25 24 66 32 203 43 135 24 338 33 40 28 33
Melanoma of the Skin 271 282 252 242 523 256 1204 249 1031 204 2235 221 266 164 207
Breast (invasive cases only) 18 18 1406 1278 1424 675 72 15 6714 1241 6786 657 13 1235 663
Uterine Cervix --- --- 73 78 --- --- --- --- 346 76 --- --- --- 75 ---
Uterine Corpus amp Unspecified
--- --- 322 283 --- --- --- --- 1535 275 --- --- --- 259 ---
Nebraska D
epartment of H
ealth and Hum
an ServicesC
ancer Registry
10
TABLE 1 (continued) Cancer Incidence NEBRASKA NEBRASKA US
2015 2011-2015 2010-2014
Site Male
No Female
No Total
No Male
No Female
No Total
No Male Rate
Female Rate
Total Rate Rate Rate Rate Rate Rate Rate
--- --- 122 110 --- --- --- --- 593 108 --- --- --- 114 --- Ovary
1185 1095 --- --- --- --- 5881 1144 --- --- --- --- 1148 --- --- Prostate
56 62 --- --- --- --- 315 70 --- --- --- --- 55 --- --- Testis Urinary Bladder 358 88 205
337 344 127 103 464 210 1712 364 520 87 2232 209
Kidney amp Renal Pelvis 218 113 161
261 254 141 131 402 188 1148 230 626 115 1774 168
Brain amp Central Nervous System (invasive cases only)
77 56 66
71 72 65 66 136 68 396 83 314 61 710 71
Thyroid Gland 72 211 143
72 73 215 225 287 149 330 69 998 212 1328 140
Hodgkin Lymphoma 31 23 27
37 42 27 28 64 34 161 34 133 28 294 31
Non-Hodgkin Lymphoma 229 158 190 228 231 199 174 427 198 1172 247 948 168 2120 203
Myeloma 81 53 65 84 82 56 47 140 62 403 83 276 47 679 63
Leukemia 176 107 138 153 151 108 98 261 122 873 184 590 106 1463 141
Brain amp Central Nervous System (benign amp uncertain cases only) 73 73 134 123 207 99 357 74 664 127 1021 102 86 150 120
Breast (in situ cases only) --- --- 306 283 --- --- --- --- 1427 271 --- --- 01 305 161
Total rates are per 100000 population and are age-adjusted to the 2000 US population Gender-specific rates are per 100000 male or female population and are age-adjusted to the 2000 US population
on y
11
Nebraska D
epartment of H
ealth and Hum
an ServicesC
ancer Registry
TABLE 2 Cancer Incidence Number of Cases and Percentage Distribution by Selected Primary Site and Age at Diagnosis
Nebraska (2011-2015)
0-17 Yrs 18-44 Yrs 45-64 Yrs 65+ Yrs TOTAL
Number Number Number Number Number All Sites 444 09 3467 73 17087 359 26627 559 47625 1000 Oral Cavity amp Pharynx 5 04 83 67 562 457 580 472 1230 1000 Esophagus 0 00 12 23 203 389 307 588 522 1000 Stomach 0 00 28 53 172 328 325 619 525 1000 Small Intestine 0 00 22 92 94 395 122 513 238 1000 Colon amp Rectum (Colorectal) 9 02 224 49 1504 332 2790 616 4527 1000 Liver amp Intrahepatic Bile Ducts 6 10 19 31 284 470 295 488 604 1000 Pancreas 0 00 36 27 394 299 888 674 1318 1000 Larynx 0 00 9 27 151 447 178 527 338 1000 Lung amp Bronchus 0 00 62 10 1777 284 4419 706 6258 1000 Soft Tissue 21 62 60 178 113 334 144 426 338 1000 Melanoma of the Skin 3 01 374 167 880 394 978 438 2235 1000 Female Breast (invasive cases only) 0 00 580 86 2980 444 3154 470 6714 1000 Uterine Cervix 1 03 137 396 154 445 54 156 346 1000 Uterine Corpus amp Unspecified 0 00 107 70 777 506 651 424 1535 1000 Ovary 6 10 66 111 238 401 283 477 593 1000 Prostate 0 00 19 03 2407 409 3455 587 5881 1000 Testis 7 22 234 743 62 197 12 38 315 1000 Urinary Bladder 0 00 34 15 506 227 1692 758 2232 1000 Kidney amp Renal Pelvis 12 07 113 64 755 426 894 504 1774 1000 Brain amp Central Nervous System (invasive cases only) 94 132 116 163 204 287 296 417 710 1000 Thyroid Gland 19 14 484 364 541 407 284 214 1328 1000 Hodgkin Lymphoma 32 109 124 422 86 293 52 177 294 1000 Non-Hodgkin Lymphoma 22 10 158 75 672 317 1268 598 2120 1000 Myeloma 0 00 19 28 240 353 420 619 679 1000 Leukemia 112 77 136 93 384 262 831 568 1463 1000 Brain amp Central Nervous System (benign amp uncertain cases) 52 51 174 170 396 388 399 391 1021 1000
l ) Female Breast (in situ cases only) 0 00 114 80 760 533 553 388 1427 1000 NOTE Due to rounding percentages may not sum to 1000
12
Nebraska D
epartment of H
ealth and Hum
an ServicesC
ancer Registry
TABLE 3 Cancer Incidence Number of Cases and Rates All Sites and Top Ten Primary Sites by Race and Ethnicity
Nebraska (2006-2015)
White African-American Native American AsianPacific Islander Hispanic Site Number Rate Site Number Rate Site Number Rate Site Number Rate Site Number Rate
All Sites 88784 4219 All Sites 3141 4724 All Sites 494 3845 All Sites 678 2665 All Sites 1975 2641
Rank
1 Female Breast
12418 1139 Prostate 579 1867
Female Breast
77 988
Female Breast
91 564
Female Breast
257 654
2 Lung amp Bronchus
11722 549
Lung amp Bronchus
445 725
Lung amp Bronchus
75 754
Lung amp Bronchus
82 369 Prostate
195 683
3 Prostate
11719 1170 Female Breast
404 1108 Colon amp
Rectum
54 435 Colon amp
Rectum
74 312 Colon amp
Rectum
178 269
4 Colon amp Rectum
9101 425 Colon amp
Rectum 343 561 Prostate 38 729 Prostate 51 619 Lung amp
Bronchus 143 268
5 Urinary Bladder
4163 193
Kidney amp Renal Pelvis
157 242 Kidney amp
Renal Pelvis
34 210 Thyroid 50 131 Kidney amp
Renal Pelvis
114 153
Nonshy Nonshy Liver amp Liver amp Nonshy 6 Hodgkin 3959 189 Hodgkin 105 152 Intrahepatic 24 146 Intrahepatic 45 177 Hodgkin 108 147
Lymphoma Lymphoma Bile Ducts Bile Ducts Lymphoma
7 Melanoma
3632 181 Pancreas
95 157 Leukemia 20 125 Oral Cavity amp Pharynx
32 107 Thyroid 104 90
Kidney amp Liver amp Nonshy Nonshy8 Renal 3250 155 Intrahepatic 95 126 Hodgkin 17 115 Hodgkin 28 114 Leukemia 98 84
Pelvis Bile Ducts Lymphoma Lymphoma
9 Leukemia
2758 132 Myeloma 85 133
Uterine Corpus amp
Unspecified 13 150 Leukemia 23 75 Liver amp
Intrahepatic Bile Ducts
62 91
10 Uterine
Corpus amp Unspecified
2752 247 Leukemia 70 91 Thyroid 13 60 Uterine
Corpus amp Unspecified
17 107
Brain amp Central Nervous System
59 52
Rates are per 100000 population excluding gender-specific sites (prostate female breast uterine corpus) which are per 100000 male or female population All rates are age-adjusted to the 2000 US population
Cancer (all sites) Diagnoses in Nebraska 2015 Incidence Rates by County of Residence
Rates are expressed as the number of new cases per 100000 population and are age-adjusted to the 2000 US population
Incidence Rates
cJ 682 - 4109
cJ 411 0 - 4564
cJ 456 5 - 5022
502 3 - 12260 Statewide incidence rate = 4565
Nebraska D
epartment of H
ealth and Hum
an ServicesC
ancer Registry
13
Cancer (all sites) Diagnoses in Nebraska 2011-2015 Incidence Rates by County of Residence
Rates are expressed as the average annual number of new cases per 100000 population and are age-adjusted to the 2000 US population
Dawes
Box Butte
Morrill
Kimball Cheyenne
Incidence Rates
l=i 121 5 - 4083
CJ 4084 - 4536
CJ 453 7 - 4991
499 2 - 6706
Keya Paha
Sheridan Brown
Dundy
Statewide incidence rate = 4537
Nebraska D
epartment of H
ealth and Hum
an ServicesC
ancer Registry
14
This page intentionally left blank
Nebraska Department of Health and Human ServicesCancer Registry 15
CANCER MORTALITY IN NEBRASKA
In 2015 3490 Nebraska residents died from cancer an increase from the statersquos 2014 tally of 3443 cancer deaths The 2015 count translates into a rate of 1568 cancer deaths per 100000 population Cancer was the second leading cause of mortality among Nebraska residents in 2015 surpassed by heart disease by 76 deaths By primary site cancers of the lung colon and rectum breast and pancreas accounted for just under half (484) of Nebraskarsquos cancer deaths in 2015
Table 4 presents the number and rate of cancer deaths that occurred among Nebraska residents during 2015 and 2011-2015 for all sites combined and for specific sites The most recent US cancer mortality rates which cover the years 2010 through 2014 are also included Comparison of the most recent state and national mortality rates for the past five years shows significant differences (plt01) for cancers of the stomach liver lung and female breast (Nebraska rates lower than the US) and for kidney and invasive brain tumors (Nebraska rates higher than the US) Table 5 presents the number of Nebraska cancer deaths during 2011-2015 by age at death Table 6 presents Nebraska cancer mortality data by race and ethnicity for the years 2006-2015
Maps on pages 21-22 present cancer mortality rates for 2015 and 2011-2015 by place of residence local statistics by place of residence are also found in the appendix to this report (Table 2A [county]mdashpage 3 and Table 14A [local health department]mdashpage 27) The graph below shows annual mortality rates for cancer for Nebraska and the US since 2006
Cancer (All Sites)Mortality Rates Nebraska (2006-2015) amp US (2006-2014)
1000
1200
1400
1600
1800
2000
2200
Ag
e-a
dju
ste
d r
ate
(p
er
10
00
00
po
pu
lati
on
)
2006 2007 2008 2009 2010 2011 2012 2013 2014 2015
Nebraska 1767 1763 1699 1647 1666 1643 1646 1608 1589 1568
US 1820 1793 1763 1734 1717 1687 1663 1631 1613
Nebraska Department of Health and Human ServicesCancer Registry 16
17
Nebraska D
epartment of H
ealth and Hum
an ServicesC
ancer Registry
TABLE 4 Cancer Mortality Number of Deaths and Rates by Selected Primary Site and Gender
Nebraska (2015 and 2011-2015) amp US (2010-2014)
NEBRASKA 2015
NEBRASKA 2011-2015
US 2010-2014
Site Male
No Female
No Total
No Male
No Female
No Total
No Male Rate
Female Rate
Total Rate Rate Rate Rate Rate Rate Rate
All Sites 2005 1415 1661
1835 1873 1655 1349 3490 1568 9134 1941 8124 1365 17258 1606
Oral Cavity amp Pharynx 38 13 25
40 40 19 14 59 27 165 33 81 13 246 22
Esophagus 73 15 41 81 79 19 17 100 45 394 81 85 14 479 44
Stomach 35 36 24 22 59 28 134 28 80 14 214 20 44 23 32 Colon amp Rectum (Colorectal) 184 189 152 120 336 151 858 182 834 136 1692 157 177 124 148 Liver amp Intrahepatic Bile Ducts 62 61 32 26 94 42 341 68 161 28 502 47 92 37 63
Pancreas 126 95 109 108 110 106 86 214 97 591 124 525 88 1116 104
Larynx 19 04 10 20 21 4 03 24 11 97 20 21 04 118 11
Lung amp Bronchus 559 363 447 484 493 422 349 906 410 2461 523 2003 342 4464 420
Melanoma of the Skin 40 17 27 45 45 19 16 64 29 201 42 109 19 310 30
Breast 03 212 118 2 02 231 185 233 103 8 02 1174 199 1182 109
--- --- 23 22 --- --- --- --- 111 21 --- --- --- 23 --- Uterine Cervix
18
TABLE 4 (continued) Cancer Mortality Nebraska D
epartment of H
ealth and Hum
an ServicesC
ancer Registry
Site
Male No Rate
NEBRASKA 2015
Female No Rate
Total No Rate
Male No Rate
NEBRASKA 2011-2015
Female No Rate
Total No Rate
US 2010-2014
Male Female Total Rate Rate Rate
Uterine Corpus amp Unspecified --- --- 49 39 --- --- --- --- 252 43 --- --- --- 46 ---
Ovary --- --- 83 68 --- --- --- --- 389 66 --- --- --- 74 ---
Prostate 158 172 --- --- --- --- 905 202 --- --- --- ---
201 --- ---
Kidney amp Renal Pelvis 68 69 29 24 97 44 324 66 161 27 485 45 56 24 39
Urinary Bladder 65 68 26 19 91 39 307 68 129 20 436 40 76 22 44
Brain amp Other Nervous System 58 56 51 47 109 51 300 63 236 43 536 52 53 35 43 Thyroid 4 04 4 04 8 03 31 06 34 05 65 06 05 05 05 Hodgkin Lymphoma 3 03 5 04 8 04 17 04 15 02 32 03 04 03 03 Non-Hodgkin Lymphoma 76 80 56 44 132 59 340 74 294 47 634 59
76 46 59
Leukemia 82 83 66 49 148 65 432 95 325 52 757 70 91 51 68
Myeloma 43 45 33 26 76 34 212 45 149 24 361 33 42 27 33
Total rates are per 100000 population and are age-adjusted to the 2000 US population Gender-specific rates are per 100000 male or female population and are age-adjusted to the 2000 US population
19
Nebraska D
epartment of H
ealth and Hum
an ServicesC
ancer Registry
TABLE 5 Cancer Mortality Number of Deaths and Percentage Distribution by Selected Primary Site and Age at Death
Nebraska (2011-2015)
Number Number Number Number Number
All Sites 70 04 443 26 4207 244 12538 727 17258 1000 Oral Cavity amp Pharynx 0 00 8 33 80 325 158 642 246 1000 Esophagus 0 00 9 19 153 319 317 662 479 1000 Stomach 0 00 11 51 60 280 143 668 214 1000 Colon amp Rectum (Colorectal) 0 00 47 28 382 226 1263 746 1692 1000 Liver amp Intrahepatic Bile Ducts 1 02 14 28 188 375 299 596 502 1000 Pancreas 0 00 16 14 288 258 812 728 1116 1000 Lung amp Bronchus 0 00 33 07 1106 248 3325 745 4464 1000 Melanoma of the Skin 0 00 17 55 102 329 191 616 310 1000 Female Breast 0 00 58 49 354 302 762 649 1174 1000 Uterine Cervix 0 00 20 180 58 523 33 297 111 1000 Uterine Corpus amp Unspecified 0 00 5 20 68 269 179 710 252 1000 Ovary 0 00 9 23 127 326 253 650 389 1000 Prostate 0 00 1 01 75 83 829 916 905 1000 Kidney amp Renal Pelvis 1 02 8 16 157 324 319 658 485 1000 Urinary Bladder 0 00 1 02 64 147 371 851 436 1000 Brain amp Central Nervous System 27 50 50 93 163 304 296 552 536 1000 Thyroid 0 00 0 00 14 215 51 785 65 1000 Hodgkin Lymphoma 0 00 3 94 14 438 15 469 32 1000 Non-Hodgkin Lymphoma 5 08 24 38 108 170 497 784 634 1000 Leukemia 13 17 30 40 126 166 588 777 757 1000 Myeloma 0 00 2 06 64 177 295 817 361 1000
0-17 Yrs 18-44 Yrs 45-64 Yrs 65+ Yrs TOTAL
NOTE Due to rounding percentages may not sum to 1000
20
Nebraska D
epartment of H
ealth and Hum
an ServicesC
ancer Registry
TABLE 6 Cancer Mortality Number of Deaths and Rates All Sites and Top Ten Primary Sites by Race and Ethnicity
Nebraska (2006-2015)
White African-American Native American AsianPacific Islander Hispanic Site Number Rate Site Number Rate Site Number Rate Site Number Rate Site Number Rate
All Sites 32687 1500 All Sites 1135 1945 All Sites 164 1492 All Sites 214 1000 All Sites 553 954
Rank
1 Lung amp Bronchus 8573 399
Lung amp Bronchus 313 543
Lung amp Bronchus 49 517
Lung amp Bronchus 46 211
Lung amp Bronchus 92 177
2 Colon amp Rectum
3323
151 Colon amp
Rectum 132 249 Colon amp Rectum 21 149
Liver amp Intrahepatic Bile Ducts
32 129 Colon amp Rectum 44 75
3 Female Breast
2174
181 Female
Breast 85 251 Female Breast 13 123
Colon amp Rectum 20 94
Female Breast 43 127
4 Pancreas 2096 96 Pancreas 75 128
Kidney amp Renal Pelvis 7 143
Pancreas
13 66
Liver amp Intrahepatic Bile Ducts
37 69
5 Prostate 1757 195 Prostate 66 342 Leukemia 6 44 Female Breast
11 84 Leukemia 31 42
Liver amp Intrahepatic Bile Ducts
Nonshy6 Leukemia 1402 64 52 72 Stomach 6 41 Hodgkin 10 46 Stomach 30 45
Lymphoma Nonshy
7 Hodgkin 1291 58 Myeloma 42 74 Pancreas 6 41 Leukemia 8 35 Prostate 29 177 Lymphoma
8 Brain amp CNS
974
47 Esophagus 33 52
Liver amp Intrahepatic Bile Ducts
6 38 Stomach 8 25 Kidney amp
Renal Pelvis
26 40
Nonshy
9 Esophagus 881 40 Urinary
Bladder 25 49 Prostate 5 86 Oral Cavity amp Pharynx 7 24
Hodgkin Lymphoma 24 49
10 Kidney amp
Renal Pelvis
871
40 Leukemia 25 37 Oral Cavity
amp Pharynx 4 67 Ovary 6 49 Brain amp CNS 24 29
Rates are per 100000 population excluding gender-specific sites (prostate female breast ovary) which are per 100000 male or female population All rates are age-adjusted to the 2000 US population Abbreviation CNS central nervous system
Cancer (all sites) Deaths in Nebraska 2015 Mortality Rates by County of Residence
Rates are expressed as the number of deaths per 100000 population and are age-adjusted to the 2000 US population
Dawes
Sioux
Box Butte
Scotts Bluff
Morrill
Banner
Kimball Cheyenne
Mortality Rates
CJ No deaths
l=i 01 - 1254
LJ 1255 - 1567
LJ 1568 - 1882
1883 - 431 8
Sheridan Holt
Antel~
Garfield Wheeler
Boone
Statewide mortality rate = 1568
Nebraska D
epartment of H
ealth and Hum
an ServicesC
ancer Registry
21
Cancer (all sites) Deaths in Nebraska 2011-2015 Mortality Rates by County of Residence
Rates are expressed as the average annual number of deaths per 100000 population and are age-adjusted to the 2000 US population
Dawes
Box Butte
Scotts Bluff
Morrill
Kimball Cheyenne
Mortality Rates
cJ 25 6 - 1285
CJ 1286 - 1605
CJ 1606 - 1927
1928 - 2414
Sheridan Cherry
Valley
Custer
Sherman Howard
Dawson Buffalo
Hitchcock Red Willow Furnas Harlan
Statewide mortality rate = 1606
Nebraska D
epartment of H
ealth and Hum
an ServicesC
ancer Registry
22
INCIDENCE AND MORTALITY FOR SELECTED PRIMARY SITES
Lung and Bronchus
Although lung cancer was only the second most frequently diagnosed cancer among Nebraska residents in 2015 it was the yearrsquos leading cause of cancer mortality accounting for 26 of the statersquos cancer deaths During the past five years (2011-2015) lung cancer has averaged over 1200 diagnoses and almost 900 deaths in Nebraska per year Although lung cancer is more likely to strike men than women the lung cancer death rate for Nebraska men has fallen by over 40 since 1990 while remaining almost unchanged for Nebraska women Due to the small number of cases that are detected at an early stage of the disease the 5-year relative survival rate for people diagnosed with lung cancer is less than 20
Cigarette smoking is the major risk factor for lung cancer and causes about 80 of lung cancer deaths People who smoke cigarettes are 15 to 30 times more likely to die from lung cancer than non-smokers Quitting smoking at any age reduces the risk of lung cancer although the risk for smokers is higher than the risk for a lifelong non-smoker The US Preventive Services Task Force (USPSTF) and ACS have both endorsed screening for lung cancer using low-dose computed tomography (LDCT) but only for people 55-74 years of age (the USPSTF recommendation includes people 55-80) who currently smoke or who have quit within the past 15 years are in good health and have at least a 30 pack-year smoking history
Maps on pages 45-46 present lung amp bronchus cancer incidence and mortality rates by place of residence local statistics by place of residence are also found in the appendix to this report (Table 3A [county]mdashpage 5 and Tables 13A and 14A [ local health department region]mdashpages 25-27)
Lung and Bronchus CancerIncidence Rates Nebraska (2006-2015) amp US (2006-2014)
30
40
50
60
70
80
90
Ag
e-a
dju
ste
d r
ate
(p
er
10
00
00
po
pu
lati
on
)
2006 2007 2008 2009 2010 2011 2012 2013 2014 2015
Nebraska 638 673 626 581 608 577 606 621 569 571
US 688 679 673 661 639 625 615 602 583
Nebraska Department of Health and Human ServicesCancer Registry 23
Lung and Bronchus CancerMortality Rates Nebraska (2006-2015) amp US (2006-2014)shy
200
300
400
500
600
700
800 A
ge
-ad
just
ed
ra
te (
pe
r 1
00
00
0 p
op
ula
tio
n)
2006 2007 2008 2009 2010 2011 2012 2013 2014 2015
Nebraska 475 486 451 442 459 425 433 428 414 410
US 517 507 496 484 474 460 449 434 422
Lung and Bronchus CancerPercentage of Cases by Stage of Disease at Diagnosisshy
Nebraska 2011-2015shy
Local
20
Regional
23
Distant
50
Unstaged
7
Nebraska Department of Health and Human ServicesCancer Registry 24
Breast (Female only)
Breast cancer is the most common type of cancer among women and the second most frequent cause of female cancer deaths Between 2011 and 2015 6714 Nebraska women were diagnosed with invasive breast cancer (and another 1427 were diagnosed with in situ breast cancer) and 1174 women died from breast cancer Since 1990 the rate of breast cancer deaths in Nebraska and the US has declined significantly Recent declines in the rate of breast cancer diagnoses have been attributed to the decreasing use of post-menopausal hormone replacement therapy early detection through screening and increased awareness
Age is an important risk factor for breast cancer with 80 of all cases occurring among women age 50 and older Other risk factors include genetic mutations a personal or family history of breast cancer some forms of benign breast disease early menstruation late menopause never having children or having a first child after age 30 and for post-menopausal women obesity and long-term hormone replacement therapy
Screening for breast cancer is known to save lives although opinion varies on how and when to screen USPSTF guidelines recommend mammography for women 50-74 on an every-other-year schedule However ACS guidelines recommend that women 40-44 have the choice for annual mammography women 45-54 have annual mammography and women 55 and older have the choice to continue annual mammography or to have it on an every-other-year schedule continuing as long as their overall health is good and life expectancy is 10 or more years For some women who have an increased risk of breast cancer the ACS recommends annual magnetic resonance imaging (MRI) in addition to mammography usually starting at age 30
Maps on pages 47-48 present female breast cancer incidence and mortality rates by place of residence local statistics by place of residence are also found in the appendix to this report (Table 4A [county]mdashpage 7 and Table 13A and 14A [local health department]mdashpages 25-27)
Female Breast CancerIncidence Rates Nebraska (2006-2015) amp US (2006-2014)
900
1000
1100
1200
1300
1400
1500
Ag
e-a
dju
ste
d r
ate
(p
er
10
00
00
fe
ma
le p
op
ula
tio
n)
2006 2007 2008 2009 2010 2011 2012 2013 2014 2015
Nebraska 1301 1174 1301 1224 1182 1267 1190 1210 1240 1278
US 1218 1233 1245 1255 1215 1239 1235 1247 1239
Nebraska Department of Health and Human ServicesCancer Registry 25
Female Breast CancerMortality Rates Nebraska (2006-2015) amp US (2006-2014)
100
150
200
250
300
350
400 A
ge
-ad
just
ed
ra
te (
pe
r 1
00
00
0 f
em
ale
po
pu
lati
on
)
2006 2007 2008 2009 2010 2011 2012 2013 2014 2015
Nebraska 199 215 207 194 192 181 212 208 213 185
US 236 230 226 222 219 215 213 207 205
Female Breast CancerPercentage of Cases by Stage of Disease at Diagnosisshy
Nebraska 2011-2015shy
Local
52 Regional
24
Distant
4
Unstaged
2
In situ
18
Nebraska Department of Health and Human ServicesCancer Registry 26
Colon and Rectum (Colorectal)
In 2015 colorectal cancer was the fourth most frequently diagnosed cancer among Nebraska residents accounting for 920 new cases It was also the second leading cause of cancer mortality in the state accounting for 336 deaths
The risk of developing colorectal cancer increases with age More than half (616) of all colorectal cancer cases that occurred in Nebraska during 2011-2015 were 65 or older at diagnosis Other risk factors include a personal or family history of colorectal cancer or polyps a personal history of chronic inflammatory bowel disease and certain hereditary colorectal cancer syndromes Modifiable risk factors include physical inactivity obesity smoking a high-fat diet (especially fat from animal sources) and heavy alcohol use
Screening for asymptomatic polyps and tumors is known to prevent colorectal cancer cases and deaths and there are a number of recommended test options Among them include several types of stool tests flexible sigmoidoscopy colonoscopy CT colonography (virtual colonoscopy) and double-contrast barium enema Recommended frequency varies by type of test For people of average risk without symptoms the USPSTF recommends screening for those 50-75 years of age while the ACS recommends screening for anyone 45 and older However the USPSTF also recommends that people at increased risk (ie a personal or family history of colorectal cancer or polyps a personal history of chronic inflammatory bowel disease or a family history of hereditary colorectal cancer syndromes) may be advised to begin screening before age 50 andor be screened more often
Maps on pages 49-50 present incidence and mortality rates for cancers of the colon amp rectum by place of residence local statistics by place of residence are also found in the appendix to this report (Table 5A [county]mdashpage 9 and Table 13A and 14A [local health department]mdashpages 25-27)
Colon and Rectum (Colorectal) Cancer Incidence Rates Nebraska (2006-2015) amp US (2006-2014)
200
300
400
500
600
700
800
Ag
e-a
dju
ste
d r
ate
(p
er
10
00
00
po
pu
lati
on
)
2006 2007 2008 2009 2010 2011 2012 2013 2014 2015
Nebraska 560 559 529 474 462 450 439 412 422 428
US 482 470 458 436 416 407 395 388 384
Nebraska Department of Health and Human ServicesCancer Registry 27
Colon and Rectum (Colorectal) CancerMortality Rates Nebraska (2006-2015) amp US (2006-2014)
00
50
100
150
200
250
300 A
ge
-ad
just
ed
ra
te (
pe
r 1
00
00
0 p
op
ula
tio
n)
2006 2007 2008 2009 2010 2011 2012 2013 2014 2015
Nebraska 193 185 184 163 171 171 159 150 156 151
US 173 169 165 158 155 151 147 145 141
Colon and Rectum (Colorectal) CancerPercentage of Cases by Stage of Disease at Diagnosisshy
Nebraska 2011-2015shy
Local
38
Regional
34
Distant
18
Unstaged
7
In situ
3
Nebraska Department of Health and Human ServicesCancer Registry 28
Prostate
With 1185 diagnoses in 2015 prostate cancer was the most common cancer among Nebraska men accounting for over 24 of all new cancers During the past five years (2011-2015) it has also been the second leading cause of cancer deaths among Nebraska men accounting for 905 deaths Since the mid-1990s prostate cancer death rates have declined substantially both in Nebraska and throughout the United States
Little is known about what causes prostate cancer Risk increases with age (about 59 of Nebraska men diagnosed with prostate cancer during 2011-2015 were 65 or older) and is significantly greater among African-Americans During the past decade (2006-2015) the incidence of prostate cancer among African-American men in Nebraska has been 37 higher than among whites Men with a close relative (father brother or son) who have had prostate cancer especially at a young age are also at increased risk
Current ACS guidelines recommend that men make an informed decision with their health care provider about whether to be screened for prostate cancer This discussion should begin at age 50 for men who are at average risk of prostate cancer and have a life expectancy of at least 10 years This discussion should begin at age 45 for men at high risk (African-Americans and men with a father brother or son diagnosed with prostate cancer before age 65) and at age 40 for men of even higher risk (men with several first-degree relatives diagnosed before age 65) For men who choose to be screened the ACS recommends the prostate-specific antigen (PSA) test with or without a digital rectal exam By contrast the USPSTF does not recommend screening for prostate cancer
Maps on pages 51-52 present incidence and mortality rates for prostate cancer by place of residence local statistics by place of residence are also found in the appendix to this report (Table 6A [county]mdashpage 11 and Table 13A and 14A [local health department]mdash pages 25-27)
Prostate CancerIncidence Rates Nebraska (2006-2015) amp US (2006-2014)
0
50
100
150
200
250
Ag
e-a
dju
ste
d r
ate
(p
er
10
00
00
ma
le p
op
ula
tio
n)
2006 2007 2008 2009 2010 2011 2012 2013 2014 2015
Nebraska 1615 1713 1499 1278 1401 1320 1133 1104 1043 1095
US 1598 1643 1516 1434 1344 1337 1097 1041 955
Nebraska Department of Health and Human ServicesCancer Registry 29
Prostate CancerMortality Rates Nebraska (2006-2015) amp US (2006-2014)
100
150
200
250
300
350
400 A
ge
-ad
just
ed
ra
te (
pe
r 1
00
00
0 m
ale
po
pu
lati
on
)
2006 2007 2008 2009 2010 2011 2012 2013 2014 2015
Nebraska 235 248 236 230 200 221 214 217 191 172
US 242 242 230 221 218 208 196 193 191
Prostate CancerPercentage of Cases by Stage of Disease at Diagnosisshy
Nebraska 2011-2015shy
Local
72 Regional
14
Distant
6
Unstaged
8
Nebraska Department of Health and Human ServicesCancer Registry 30
Urinary Bladder
Between 2011 and 2015 2232 Nebraska residents were diagnosed with bladder cancer Bladder cancer occurs much more frequently among men than women (by about a 3-to-1 ratio) and it now ranks as the fourth most common site of cancer diagnoses among Nebraska men However deaths from bladder cancer occur far less often (436 Nebraska residents died from it during 2011-2015) which is the result of a high percentage of early-stage diagnoses and the existence of effective treatments Survival prospects have improved considerably in recent decades to the point where the most current national data show that the five-year relative survival rate for all bladder cancer patients is about 77
Cigarette smoking is the most important known risk factor for bladder cancer Smokers develop bladder cancer three times more often than non-smokers and about half of all cases are attributable to smoking Risk factors also include occupational exposures to certain chemicals used to make dyes (benzidine and beta-naphthylamine) as well as working in the manufacture of rubber and leather Like most cancers the risk of bladder cancer increases with age 76 of the cases that occurred in Nebraska during 2011-2015 were at least 65 years old when diagnosed
Maps on pages 53-54 present incidence and mortality rates for urinary bladder cancer by place of residence local statistics by place of residence are also found in the appendix to this report (Table 7A [county]mdashpage 13 and Table 13A and 14A [local health department]mdashpages 25-27)
Urinary Bladder CancerIncidence Rates Nebraska (2006-2015) amp US (2006-2014)
00
50
100
150
200
250
300
Ag
e-a
dju
ste
d r
ate
(p
er
10
00
00
po
pu
lati
on
)
2006 2007 2008 2009 2010 2011 2012 2013 2014 2015
Nebraska 203 224 203 198 216 223 209 203 195 210
US 213 215 215 213 209 208 207 203 198
Nebraska Department of Health and Human ServicesCancer Registry 31
Urinary Bladder CancerMortality Rates Nebraska (2006-2015) amp US (2006-2014)shy
00
10
20
30
40
50
60 A
ge
-ad
just
ed
ra
te (
pe
r 1
00
00
0 p
op
ula
tio
n)
2006 2007 2008 2009 2010 2011 2012 2013 2014 2015
Nebraska 43 42 40 35 43 45 40 38 37 39
US 44 44 44 44 44 44 44 44 43
Urinary Bladder CancerPercentage of Cases by Stage of Disease at Diagnosisshy
Nebraska 2011-2015shy
Local
34
Regional
7
Distant
3
Unstaged
5
In Situ
51
Nebraska Department of Health and Human ServicesCancer Registry 32
Non-Hodgkin Lymphoma
Lymphomas are cancers that affect the white blood cells of the immune system and are usually classified as either Hodgkin or Non-Hodgkin lymphoma Non-Hodgkin lymphoma is by far the more common disorder of the two accounting for 2120 diagnoses and 634 deaths among Nebraska residents between 2011 and 2015 (for Hodgkin lymphoma the comparable figures are 294 diagnoses and 32 deaths) National statistics indicate that the incidence rate for Non-Hodgkin lymphoma has increased by about 80 since the midshy1970s and some of this increase is related to the appearance of AIDS However both state and national data show that Non-Hodgkin lymphoma deaths have been increasing since at least 1950 which indicates that factors other than AIDS are also responsible
The causes of Non-Hodgkin lymphoma are unknown although there is evidence that viral exposures and reduced immune function are associated with the disease People whose immune systems have been suppressed by drugs particularly those who have received an organ transplant are at high risk of Non-Hodgkin lymphoma and it also occurs more frequently among people with congenital and acquired immunologic disorders including AIDS The increased incidence of the disease among people with congenital disorders of the immune system suggests that hereditary factors may increase risk Some studies have found that occupational exposure to certain herbicides is a risk factor as well
Maps on pages 55-56 present incidence and mortality rates for Non-Hodgkin lymphoma by place of residence local statistics by place of residence are also found in the appendix to this report (Table 8A [county]mdashpage 15 and Table 13A and 14A [local health department]mdashpages 25-27)
Non-Hodgkin LymphomaIncidence Rates Nebraska (2006-2015) amp US (2006-2014)
00
50
100
150
200
250
300
Ag
e-a
dju
ste
d r
ate
(p
er
10
00
00
po
pu
lati
on
)
2006 2007 2008 2009 2010 2011 2012 2013 2014 2015
Nebraska 211 214 198 212 209 219 195 215 186 198
US 197 197 197 198 196 191 189 188 185
Nebraska Department of Health and Human ServicesCancer Registry 33
Non-Hodgkin LymphomaMortality Rates Nebraska (2006-2015) amp US (2006-2014)shy
00
20
40
60
80
100
120 A
ge
-ad
just
ed
ra
te (
pe
r 1
00
00
0 p
op
ula
tio
n)
2006 2007 2008 2009 2010 2011 2012 2013 2014 2015
Nebraska 73 76 64 62 69 66 54 59 56 59
US 67 66 64 63 61 60 59 57 57
Non-Hodgkin LymphomaPercentage of Cases by Stage of Disease at Diagnosisshy
Nebraska 2011-2015shy
Local
25
Regional
15
Distant
49
Unstaged
11
Nebraska Department of Health and Human ServicesCancer Registry 34
Leukemia
Between 2011 and 2015 leukemia accounted for 1463 diagnoses and 757 deaths among Nebraska residents Although leukemia is one of the most common types of cancer diagnosed among children and adolescents over half (57) of the leukemia cases that occurred in Nebraska between 2011 and 2015 were 65 years of age or older at diagnosis There are many different types of leukemia acute lymphocytic leukemia is the most frequently diagnosed among children and teens while acute myeloid and chronic lymphocytic are the most common types among adults Survival times vary widely by type overall the relative five-year survival rate for all leukemia patients in the United States is over 60
The major causes of most types of leukemia are unknown Nevertheless several risk factors have been identified and include genetic abnormalities (such as Down syndrome) exposure to ionizing radiation and workplace exposure to benzene and other related solvents Adult T-cell acute lymphocytic leukemia is strongly associated with infection by a retrovirus the human T-cell lymphomaleukemia virus type I (HTLV-I) Cigarette smoking is a risk factor for acute myeloid leukemia while people who have a family history of chronic lymphocytic leukemia carry an increased risk of the disease themselves
Maps on pages 57-58 present incidence and mortality rates for leukemia by place of residence local statistics by place of residence are also found in the appendix to this report (Table 9A [county]mdashpage 17 and Table 13A and 14A [local health department]mdash pages 25-27)
LeukemiaIncidence Rates Nebraska (2006-2015) amp US (2006-2014)
00
40
80
120
160
200
240
Ag
e-a
dju
ste
d r
ate
(p
er
10
00
00
po
pu
lati
on
)
2006 2007 2008 2009 2010 2011 2012 2013 2014 2015
Nebraska 162 158 141 133 149 141 147 143 145 122
US 134 133 133 134 140 140 139 137 133
Nebraska Department of Health and Human ServicesCancer Registry 35
LeukemiaMortality Rates Nebraska (2006-2015) amp US (2006-2014)
20
40
60
80
100
120 A
ge
-ad
just
ed
ra
te (
pe
r 1
00
00
0 p
op
ula
tio
n)
00 2006 2007 2008 2009 2010 2011 2012 2013 2014 2015
Nebraska 74 68 79 62 63 70 81 65 71 65
US 72 71 71 71 69 69 68 68 66
Leukemia Number of Cases by Histologic Type Nebraska 2011-2015
Nebraska Department of Health and Human ServicesCancer Registry 36
Acute lymphocytic
Chronic lymphocytic
Other lymphocytic
Acute myeloid
Acute monocytic
Chronic myeloid
Other myeloidmonocytic
Other acute leukemia
Aleukemic subleukemic amp NOS 29
24
26
192
34
468
39
502
149
0 100 200 300 400 500
Abbreviation NOS not otherwise specified
600
Kidney and Renal Pelvis
Cancers of the kidney and renal pelvis accounted for 1774 diagnoses in Nebraska between 2011 and 2015 and also accounted for 485 deaths in Nebraska during the same years State and national trends since 1990 show a significant increase in the rate of diagnosis of these cancers but little change in the mortality rate The chances of survival for people with kidney cancer are relatively high with the most current national statistics showing that the five-year relative survival rate for cancers of the kidney and renal pelvis is now over 70
Preventable risk factors for cancer of the kidney include cigarette smoking and obesity Current estimates indicate that cigarette smoking is responsible for about 20 percent of all kidney cancer deaths Kidney cancer is more likely to strike at younger ages than most other types in Nebraska almost half (496) of all cases that were diagnosed during 2011-2015 were under the age of 65 Other non-preventable risk factors for cancer of the kidney include a family history of kidney cancer and high blood pressure However since people with high blood pressure are often treated with drugs it is unclear whether their increased risk is related to their high blood pressure or the drugs Nevertheless people who need drugs to lower their blood pressure should take them
Maps on pages 59-60 present incidence and mortality rates for cancers of the kidney amp renal pelvis by place of residence local statistics by place of residence are also found in the appendix to this report (Table 10A [county]mdashpage 19 and Table 13A and 14A [local health department]mdashpages 25-27)
Kidney and Renal Pelvis Cancer Incidence Rates Nebraska (2006-2015) amp US (2006-2014)
00
40
80
120
160
200
240
Ag
e-a
dju
ste
d r
ate
(p
er
10
00
00
po
pu
lati
on
)
2006 2007 2008 2009 2010 2011 2012 2013 2014 2015
Nebraska 162 165 188 177 183 157 155 166 173 188
US 157 160 163 163 159 160 162 162 162
Nebraska Department of Health and Human ServicesCancer Registry 37
Kidney and Renal Pelvis CancerMortality Rates Nebraska (2006-2015) amp US (2006-2014)shy
00
10
20
30
40
50
60
Ag
e-a
dju
ste
d r
ate
(p
er
10
00
00
po
pu
lati
on
)
2006 2007 2008 2009 2010 2011 2012 2013 2014 2015
Nebraska 45 40 38 48 42 51 41 41 46 44
US 40 40 40 39 39 39 38 39 38
Kidney and Renal Pelvis CancerPercentage of Cases by Stage of Disease at Diagnosisshy
Nebraska 2011-2015shy
Local
61
Regional
16
Distant
16
Unstaged
5
In Situ
2
Nebraska Department of Health and Human ServicesCancer Registry 38
Melanoma of the Skin
There are several different types of skin cancer but melanomas are the most serious Nationally melanomas comprise about 1 of all skin cancer diagnoses but the vast majority of all skin cancer deaths In Nebraska melanomas of the skin accounted for 2235 diagnoses and 310 deaths between 2011 and 2015 The incidence of melanoma continues to increase significantly in Nebraska and throughout the United States Because most melanomas are discovered early in their development and can be surgically removed the relative five-year survival rate is now over 90
Melanoma is related to exposure to ultraviolet radiation (most of which comes from the sun) particularly exposures during childhood that resulted in severe sunburns The risk of developing melanoma is particularly high among people with light skin Sun exposure is not the only risk factor Family history of melanoma and the presence of numerous dysplastic nevi (large moles with irregular coloration and shape) also increase a personrsquos risk of the disease
Skin melanomas are among the most preventable and treatable of all cancers Wearing protective clothing and using sunscreen are the best methods for preventing the disease and children in particular should have such protection In addition early detection can greatly reduce the risk of melanoma mortality Recognition of changes in skin growths or the appearance of new growths is the best way to find melanomas early in their development The ACS suggests that adults practice skin self-examination on a monthly basis and that suspicious lesions should be evaluated promptly by a physician
Maps on pages 61-62 present incidence and mortality rates for melanoma of the skin by place of residence local statistics by place of residence are also found in the appendix to this report (Table 11A [county]mdashpage 21 and Table 13A and 14A [local health department]mdashpages 25-27)
Melanoma of the SkinIncidence Rates Nebraska (2006-2015) amp US (2006-2014)
00
50
100
150
200
250
300
Ag
e-a
dju
ste
d r
ate
(p
er
10
00
00
po
pu
lati
on
)
2006 2007 2008 2009 2010 2011 2012 2013 2014 2015
Nebraska 176 179 183 192 183 197 178 236 235 256
US 191 195 199 202 199 205 205 210 214
Nebraska Department of Health and Human ServicesCancer Registry 39
Melanoma of the SkinMortality Rates Nebraska (2006-2015) amp US (2006-2014)
00
10
20
30
40
50
60 A
ge
-ad
just
ed
ra
te (
pe
r 1
00
00
0 p
op
ula
tio
n)
2006 2007 2008 2009 2010 2011 2012 2013 2014 2015
Nebraska 30 20 39 32 26 27 34 34 25 29
US 27 27 27 28 27 27 27 27 26
Melanoma of the SkinPercentage of Cases by Stage of Disease at Diagnosisshy
Nebraska 2011-2015shy
Local
44
Regional
5
Distant
3
Unstaged
7
In Situ
41
Nebraska Department of Health and Human ServicesCancer Registry 40
Liver and Intrahepatic Bile Ducts
Often when cancer is found in the liver it did not start there but has spread (metastized) from somewhere else in the body In the United States metastatic liver cancer is more common than liver cancer that originates in the liver (referred to as primary liver cancer) In Nebraska primary cancers of the liver and intrahepatic bile ducts accounted for 604 diagnoses and 502 deaths between 2011 and 2015 Diagnosis does not usually occur until the disease is well advanced due to a lack of symptoms As a result survival is poor the most recent national five-year survival rate is less than 20 Both nationally and in Nebraska the incidence and mortality rates for liver cancer have increased steadily during the past decade
The most common risk factor for liver cancer is chronic viral hepatitis (type B and C) Other preventable risk factors include cirrhosis heavy alcohol use obesity exposure to arsenic and vinyl chloride and using anabolic steroids Type 2 diabetes has also been linked with an increased risk of liver cancer usually in cases where other risk factors such as heavy alcohol use andor chronic viral hepatitis are present Non-preventable risk factors for liver cancer include gender raceethnicity and certain inherited metabolic diseases Nebraska statistics show that diagnoses among men outnumber those among women by a ratio of about 31 while incidence rates are significantly higher among African-Americans Native Americans AsianPacific Islanders and Hispanics compared to whites
Maps on pages 63-64 present incidence and mortality rates for cancers of the liver by place of residence local statistics by place of residence are also found in the appendix to this report (Table 12A [county]mdashpage 23 and Table 13A and 14A [local health department]mdashpages 25-27)
Liver amp Intrahepatic Bile Ducts CancerIncidence Rates Nebraska (2006-2015) amp US (2006-2014)
00
30
60
90
120
150
180
Ag
e-a
dju
ste
d r
ate
(p
er
10
00
00
po
pu
lati
on
)
2006 2007 2008 2009 2010 2011 2012 2013 2014 2015
Nebraska 42 42 55 50 59 57 56 58 46 59
US 63 67 69 73 74 76 79 80 81
Nebraska Department of Health and Human ServicesCancer Registry 41
Liver amp Intrahepatic Bile Ducts CancerMortality Rates Nebraska (2006-2015) amp US (2006-2014)
00
30
60
90
120
150 A
ge
-ad
just
ed
ra
te (
pe
r 1
00
00
0 p
op
ula
tio
n)
2006 2007 2008 2009 2010 2011 2012 2013 2014 2015
Nebraska 43 38 33 45 50 53 46 46 46 42
US 53 54 56 58 59 61 63 65 65
Liver amp Intrahepatic Bile Ducts CancerPercentage of Cases by Stage of Disease at Diagnosisshy
Nebraska 2011-2015shy
Local
44 Regional
27
Distant
15
Unstagedshy14shy
Nebraska Department of Health and Human ServicesCancer Registry 42
This page intentionally left blank
Nebraska Department of Health and Human ServicesCancer Registry 43
INCIDENCE amp MORTALITY RATE MAPS FOR SELECTED PRIMARY SITES
Nebraska Department of Health and Human ServicesCancer Registry 44
Primary Site Contents Page
Lung amp bronchus
Incidence Mortality
45 46
Female breast
Incidence Mortality
47 48
Colon amp rectum (colorectal)
Incidence Mortality
49 50
Prostate
Incidence Mortality
51 52
Urinary bladder
Incidence Mortality
53 54
Non-Hodgkin lymphoma
Incidence Mortality
55 56
Leukemia
Incidence Mortality
57 58
Kidney amp renal pelvis
Incidence Mortality
59 60
Melanoma of the skin
Incidence Mortality
61 62
Liver amp intrahepatic bile ducts
Incidence Mortality
63 64
Lung amp Bronchus Cancer Diagnoses in Nebraska 2011-2015 Incidence Rates by Local Health Department Region
Rates are expressed as the average annual number of new cases per 100000 population and are age-adjusted to the 2000 U S population
Incidence Rates
455 - 488
489 - 558
559 - 633
Statewide incidence rate=590 634 - 699
Nebraska D
epartment of H
ealth and Hum
an ServicesC
ancer Registry
45
Lung amp Bronchus Cancer Deaths in Nebraska 2011-2015 Mortality Rates by Local Health Department Region
Rates are expressed as the average annual number of deaths per 100000 population and age-adjusted to the 2000 U S population
Mortality Rates
305 - 369
370 - 400
433 - 491 Statew ide mortal ity rate=420
Nebraska D
epartment of H
ealth and Hum
an ServicesC
ancer Registry
46
Nebraska D
epartment of H
ealth and Hum
an ServicesC
ancer Registry
47
Nebraska D
epartment of H
ealth and Hum
an ServicesC
ancer Registry
48
Nebraska D
epartment of H
ealth and Hum
an ServicesC
ancer Registry
49
Nebraska D
epartment of H
ealth and Hum
an ServicesC
ancer Registry
50
Nebraska D
epartment of H
ealth and Hum
an ServicesC
ancer Registry
51
Nebraska D
epartment of H
ealth and Hum
an ServicesC
ancer Registry
52
Nebraska D
epartment of H
ealth and Hum
an ServicesC
ancer Registry
53
Nebraska D
epartment of H
ealth and Hum
an ServicesC
ancer Registry
54
Non-Hodgkin Lymphoma Diagnoses in Nebraska 2011-2015 Incidence Rates by Local Health Department Region
Rates are expressed as the average annual number of new cases per 100000 population and are age-adj usted to the 2000 U S population
Incidence Rates
140 - 180
181 - 209
Statewide incidence rate=203 221 - 298
Nebraska D
epartment of H
ealth and Hum
an ServicesC
ancer Registry
55
Nebraska D
epartment of H
ealth and Hum
an ServicesC
ancer Registry
56
Nebraska D
epartment of H
ealth and Hum
an ServicesC
ancer Registry
57
Nebraska D
epartment of H
ealth and Hum
an ServicesC
ancer Registry
58
Nebraska D
epartment of H
ealth and Hum
an ServicesC
ancer Registry
59
Kidney amp Renal Pelvis Cancer Deaths in Nebraska 2011-2015 Mortality Rates by Local Health Department Region
Rates are expressed as the average annual number of deaths per 100000 population and age-adjusted to the 2000 U S population
Mortality Rates
2 4 - 3 8
39 - 42
43 - 55
56 - 69 Statewide mortality rate=45
Nebraska D
epartment of H
ealth and Hum
an ServicesC
ancer Registry
60
Nebraska D
epartment of H
ealth and Hum
an ServicesC
ancer Registry
61
Nebraska D
epartment of H
ealth and Hum
an ServicesC
ancer Registry
62
Nebraska D
epartment of H
ealth and Hum
an ServicesC
ancer Registry
63
Liver amp lntrahepatic Bile Ducts Cancer Deaths in Nebraska 2011-2015 Mortality Rates by Local Health Department Region
Rates are expressed as the average annual number of deaths per 100000 population and age-adjusted to the 2000 U S population
North Central
---1 West Central
Mortality Rates
12 - 36
37-41
5 3 - 9 3 Statewide mortality rate=4 7
Nebraska D
epartment of H
ealth and Hum
an ServicesC
ancer Registry
64
REFERENCES
American Cancer Society American Cancer Society Recommendations for the Early Detection of Breast Cancer 2017 Available at httpswwwcancerorgcancerbreast-cancerscreening-testsshyand-early-detectionamerican-cancer-society-recommendations-for-the-early-detection-of-breastshycancerhtml
American Cancer Society Cancer Facts and Figures 2018 Atlanta GA American Cancer Society 2018 Available at httpswwwcancerorgcontentdamcancer-orgresearchcancer-facts-and-statisticsannualshycancer-facts-and-figures2018cancer-facts-and-figures-2018pdf
American Cancer Society Colorectal Cancer Screening Guidelines 2018 Available at httpswwwcancerorghealth-care-professionalsamerican-cancer-society-prevention-earlyshydetection-guidelinescolorectal-cancer-screening-guidelineshtml
Fritz A Percy C Jack A Shanmugaratnam K Sobin L Parkin DM Whelan S International Classification of Diseases for Oncology 3rd edition (US interim version 2000) Geneva Switzerland World Health Organization 2000
National Cancer Institute SEER Cancer Stat Facts Bethesda MD National Cancer Institute Accessed on February 21 2018 Available at httpsseercancergovstatfacts
United States Cancer Statistics 1999-2014 Incidence CDC WONDER On-line Database US Department of Health and Human Services Centers for Disease Control and Prevention and National Cancer Institute 2016 Available at httpswondercdcgovcancer-v2014HTML
United States Cancer Statistics 1999-2014 Mortality CDC WONDER On-line Database US Department of Health and Human Services Centers for Disease Control and Prevention 2016 Available at httpswondercdcgovcancermort-v2014HTML
United States Department of Health and Human Services The Health Consequences of Smoking A Report of the Surgeon General US Department of Health and Human Services Centers for Disease Control and Prevention National Center for Chronic Disease Prevention and Health Promotion Office on Smoking and Health 2004 Available at httpswwwcdcgovtobaccodata_statisticssgr2004complete_reportindexhtm
US Preventive Services Task Force Final Recommendation Statement Breast Cancer Screening November 2016 Available at httpwwwuspreventiveservicestaskforceorgPageDocumentRecommendationStatementFinalb reast-cancer-screening1
US Preventive Services Task Force Final Recommendation Statement Colorectal Cancer Screening June 2017 Available at httpswwwuspreventiveservicestaskforceorgPageDocumentRecommendationStatementFinal colorectal-cancer-screening2
US Preventive Services Task Force Final Recommendation Statement Lung Cancer Screening December 2016 Available at httpwwwuspreventiveservicestaskforceorgPageDocumentRecommendationStatementFinall ung-cancer-screening
World Health Organization Manual of the International Statistical Classification of Diseases and Related Health Problems 10th revision Geneva Switzerland World Health Organization 1992
Nebraska Department of Health and Human ServicesCancer Registry 65
REPORTING FACILITIES
Ainsworth--Brown County Hospital Albion--Boone County Health Center Alliance--Box Butte General Hospital Alma--Harlan County Health System Atkinson--West Holt Memorial Hospital Inc Auburn--Nemaha County Hospital Aurora--Memorial Hospital Bassett--Rock County Hospital Beatrice--Beatrice Community Hospital amp Health Center Inc Benkelman--Dundy County Hospital Blair--Memorial Community Hospital Bridgeport--Morrill County Community Hospital Broken Bow--Jennie Melham Memorial Medical Ctr Callaway--Callaway District Hospital Cambridge--Tri Valley Health System Central City--Litzenberg Memorial County Hospital Chadron--Chadron Community Hospital amp Health Services Columbus--Columbus Community Hospital Inc Cozad--Cozad Community Hospital Creighton--Creighton Area Health Services Crete--Crete Area Medical Center David City--Butler County Health Care Center Fairbury--Jefferson Community Health Center Inc Falls City--Community Medical Center Inc Franklin--Franklin County Memorial Hospital Fremont--Fremont Area Medical Center Friend--Warren Memorial Hospital Geneva--Fillmore County Hospital Genoa--Genoa Community HospitalLTC Gordon--Gordon Memorial Hospital District Gothenburg--Gothenburg Memorial Hospital Grand Island--CHI Health St Francis Grant--Perkins County Health Services Hastings--Mary Lanning Memorial Hospital Hebron--Thayer County Health Services Henderson--Henderson Health Care Services Holdrege--Phelps Memorial Health Center Imperial--Chase County Community Hospital Kearney--CHI Health Good Samaritan Kearney--CHI Health Good Samaritan Pathology Kimball--Kimball Health Services amp Hospital Lexington--Tri-County Area Hospital District Lincoln--Bryan-LGH Medical Center East amp West Lincoln--CHI Health Saint Elizabeth Lincoln--Pathology Medical Services Lincoln--Williamsburg Radiation Center Lincoln--CHI Health Nebraska Heart Lincoln--UNMC College of Dentistry Lynch--Niobrara Valley Hospital Corp McCook--Community Hospital Minden--Kearney County Health Services Nebraska City--CHI Health St Marys Neligh--Antelope Memorial Hospital
Norfolk--Faith Regional Health Services East amp West North Platte--Great Plains Regional Medical Center North Platte--Pathology Services Oakland--Oakland Memorial Hospital Ogallala--Ogallala Community Hospital Omaha--CHI Health Bergan Mercy Omaha--CHI Health Immanuel Omaha--Childrens Hospital Omaha--VA Nebraska-Western Iowa Health Care System Omaha--Methodist Hospital Pathology Center Omaha--Nebraska Medical Center Omaha--Nebraska Methodist Hospital Omaha--CHI Health Creighton University Med Ctr Omaha--Boys Town National Research Hospital Omaha--CHI Health Lakeside Omaha--CHI Health Bergan Mercy Pathology Omaha--Bishop Clarkson Hospital Pathology Omaha--Creighton Pathology Associates Omaha--Physicians Lab ONeill--Avera St Anthonys Hospital Ord--Valley County Hospital Osceola--Annie Jeffrey Memorial County Health Ctr Oshkosh--Garden County Health Services Osmond--Osmond General Hospital Papillion--CHI Health Midlands Pawnee City--Pawnee County Memorial Hospital Pender--Pender Community Hospital Plainview--CHI Health Plainview Red Cloud--Webster County Community Hospital Schuyler--CHI Health Schuyler Scottsbluff--Regional West Medical Center Scottsbluff--Western Pathology Consultants Seward--Memorial Hospital Sidney--Memorial Health Center St Paul--Howard County Community Hospital Superior--Brodstone Memorial Hospital Syracuse--Community Memorial Hospital Tecumseh--Johnson County Hospital Tilden--Tilden Community Hospital Valentine--Cherry County Hospital Wahoo--Saunders County Health Services Wayne--Providence Medical Center West Point--St Francis Memorial Hospital Winnebago--USPHS Indian Hospital York--York General Hospital
Other States Sioux City IA--Mercy Medical Center
State cancer registries participating in the National Interstate Data Exchange Agreement and the state cancer registries of Illinois Kansas Minnesota Missouri and South Dakota
Nebraska Department of Health and Human ServicesCancer Registry 66
THE NEBRASKA DEPARTMENT OF HEALTH AND HUMAN SERVICES IS COMMITTED TO AFFIRMATIVE ACTION
EQUAL EMPLOYMENT OPPORTUNITIES AND DOES NOT DISCRIMINATE IN DELIVERING BENEFITS OR SERVICES
AAEOEADA
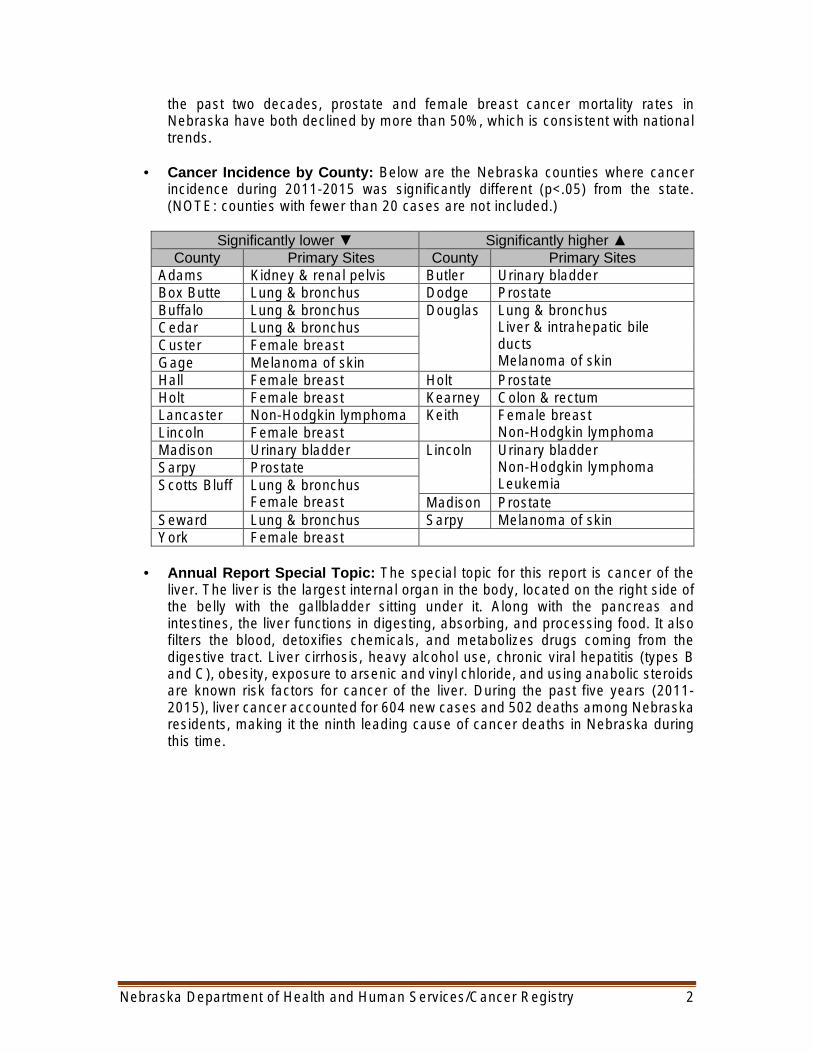
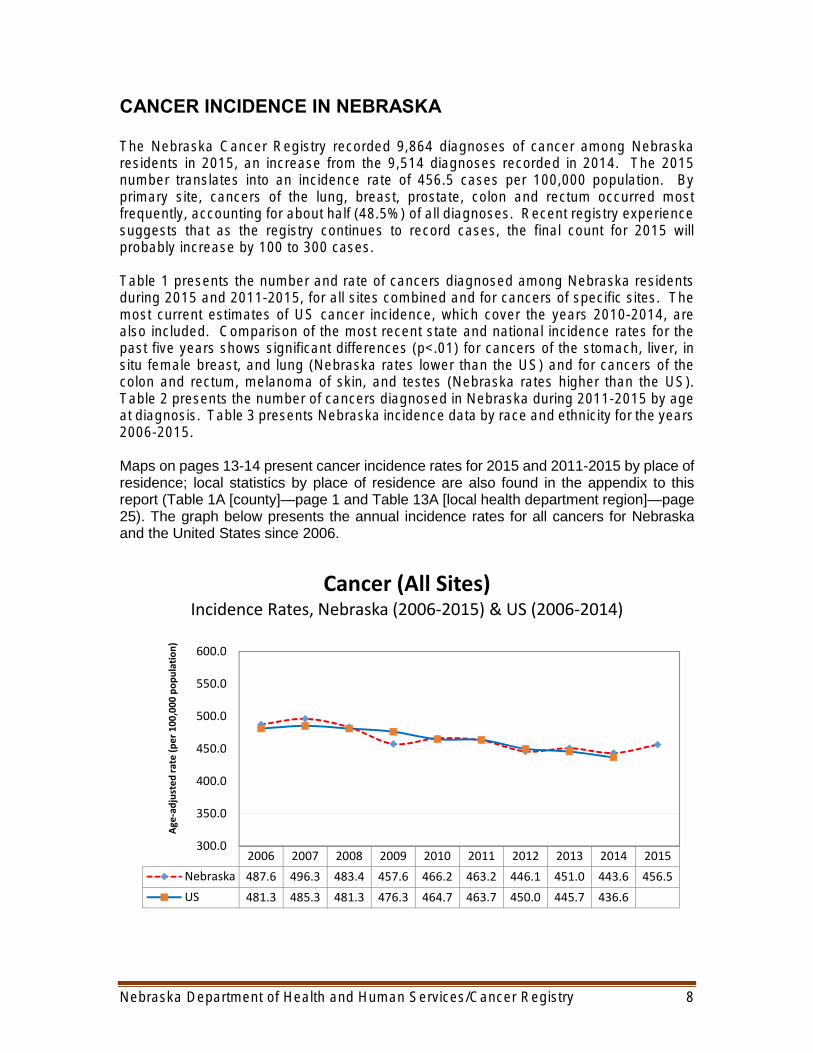
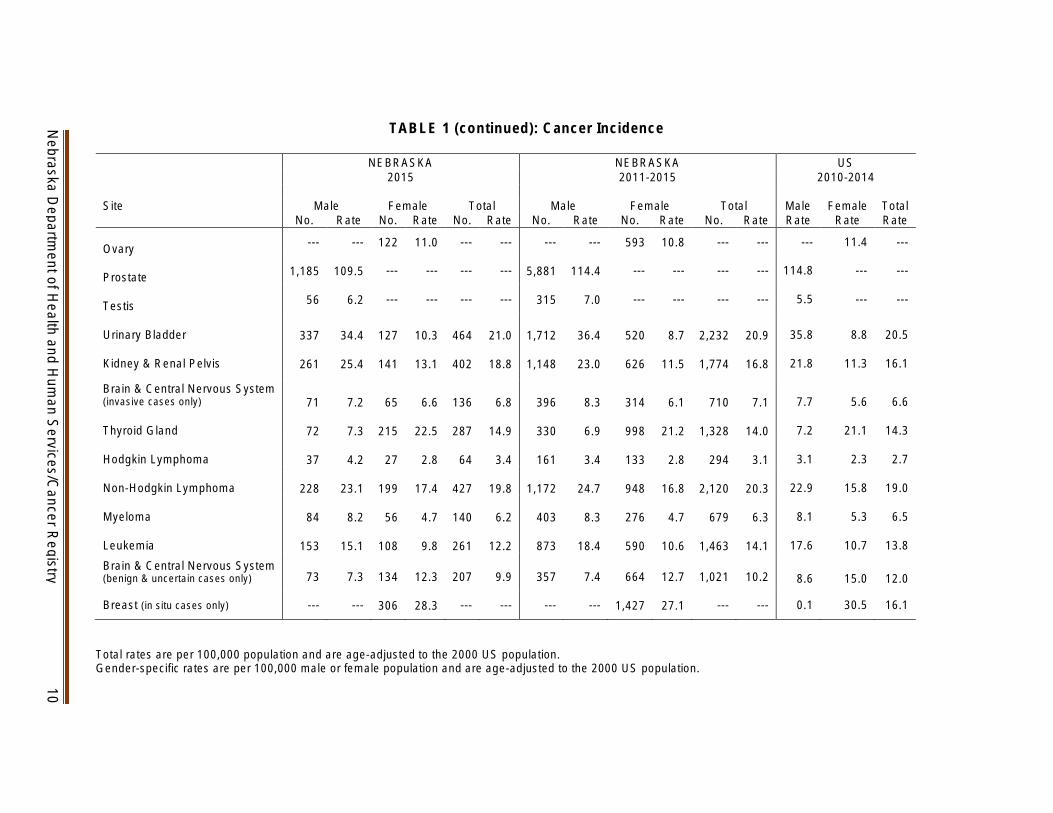
Nebraska D
epartment of H
ealth and Hum
an ServicesC
ancer Registry
10
TABLE 1 (continued) Cancer Incidence NEBRASKA NEBRASKA US
2015 2011-2015 2010-2014
Site Male
No Female
No Total
No Male
No Female
No Total
No Male Rate
Female Rate
Total Rate Rate Rate Rate Rate Rate Rate
--- --- 122 110 --- --- --- --- 593 108 --- --- --- 114 --- Ovary
1185 1095 --- --- --- --- 5881 1144 --- --- --- --- 1148 --- --- Prostate
56 62 --- --- --- --- 315 70 --- --- --- --- 55 --- --- Testis Urinary Bladder 358 88 205
337 344 127 103 464 210 1712 364 520 87 2232 209
Kidney amp Renal Pelvis 218 113 161
261 254 141 131 402 188 1148 230 626 115 1774 168
Brain amp Central Nervous System (invasive cases only)
77 56 66
71 72 65 66 136 68 396 83 314 61 710 71
Thyroid Gland 72 211 143
72 73 215 225 287 149 330 69 998 212 1328 140
Hodgkin Lymphoma 31 23 27
37 42 27 28 64 34 161 34 133 28 294 31
Non-Hodgkin Lymphoma 229 158 190 228 231 199 174 427 198 1172 247 948 168 2120 203
Myeloma 81 53 65 84 82 56 47 140 62 403 83 276 47 679 63
Leukemia 176 107 138 153 151 108 98 261 122 873 184 590 106 1463 141
Brain amp Central Nervous System (benign amp uncertain cases only) 73 73 134 123 207 99 357 74 664 127 1021 102 86 150 120
Breast (in situ cases only) --- --- 306 283 --- --- --- --- 1427 271 --- --- 01 305 161
Total rates are per 100000 population and are age-adjusted to the 2000 US population Gender-specific rates are per 100000 male or female population and are age-adjusted to the 2000 US population
on y
11
Nebraska D
epartment of H
ealth and Hum
an ServicesC
ancer Registry
TABLE 2 Cancer Incidence Number of Cases and Percentage Distribution by Selected Primary Site and Age at Diagnosis
Nebraska (2011-2015)
0-17 Yrs 18-44 Yrs 45-64 Yrs 65+ Yrs TOTAL
Number Number Number Number Number All Sites 444 09 3467 73 17087 359 26627 559 47625 1000 Oral Cavity amp Pharynx 5 04 83 67 562 457 580 472 1230 1000 Esophagus 0 00 12 23 203 389 307 588 522 1000 Stomach 0 00 28 53 172 328 325 619 525 1000 Small Intestine 0 00 22 92 94 395 122 513 238 1000 Colon amp Rectum (Colorectal) 9 02 224 49 1504 332 2790 616 4527 1000 Liver amp Intrahepatic Bile Ducts 6 10 19 31 284 470 295 488 604 1000 Pancreas 0 00 36 27 394 299 888 674 1318 1000 Larynx 0 00 9 27 151 447 178 527 338 1000 Lung amp Bronchus 0 00 62 10 1777 284 4419 706 6258 1000 Soft Tissue 21 62 60 178 113 334 144 426 338 1000 Melanoma of the Skin 3 01 374 167 880 394 978 438 2235 1000 Female Breast (invasive cases only) 0 00 580 86 2980 444 3154 470 6714 1000 Uterine Cervix 1 03 137 396 154 445 54 156 346 1000 Uterine Corpus amp Unspecified 0 00 107 70 777 506 651 424 1535 1000 Ovary 6 10 66 111 238 401 283 477 593 1000 Prostate 0 00 19 03 2407 409 3455 587 5881 1000 Testis 7 22 234 743 62 197 12 38 315 1000 Urinary Bladder 0 00 34 15 506 227 1692 758 2232 1000 Kidney amp Renal Pelvis 12 07 113 64 755 426 894 504 1774 1000 Brain amp Central Nervous System (invasive cases only) 94 132 116 163 204 287 296 417 710 1000 Thyroid Gland 19 14 484 364 541 407 284 214 1328 1000 Hodgkin Lymphoma 32 109 124 422 86 293 52 177 294 1000 Non-Hodgkin Lymphoma 22 10 158 75 672 317 1268 598 2120 1000 Myeloma 0 00 19 28 240 353 420 619 679 1000 Leukemia 112 77 136 93 384 262 831 568 1463 1000 Brain amp Central Nervous System (benign amp uncertain cases) 52 51 174 170 396 388 399 391 1021 1000
l ) Female Breast (in situ cases only) 0 00 114 80 760 533 553 388 1427 1000 NOTE Due to rounding percentages may not sum to 1000
12
Nebraska D
epartment of H
ealth and Hum
an ServicesC
ancer Registry
TABLE 3 Cancer Incidence Number of Cases and Rates All Sites and Top Ten Primary Sites by Race and Ethnicity
Nebraska (2006-2015)
White African-American Native American AsianPacific Islander Hispanic Site Number Rate Site Number Rate Site Number Rate Site Number Rate Site Number Rate
All Sites 88784 4219 All Sites 3141 4724 All Sites 494 3845 All Sites 678 2665 All Sites 1975 2641
Rank
1 Female Breast
12418 1139 Prostate 579 1867
Female Breast
77 988
Female Breast
91 564
Female Breast
257 654
2 Lung amp Bronchus
11722 549
Lung amp Bronchus
445 725
Lung amp Bronchus
75 754
Lung amp Bronchus
82 369 Prostate
195 683
3 Prostate
11719 1170 Female Breast
404 1108 Colon amp
Rectum
54 435 Colon amp
Rectum
74 312 Colon amp
Rectum
178 269
4 Colon amp Rectum
9101 425 Colon amp
Rectum 343 561 Prostate 38 729 Prostate 51 619 Lung amp
Bronchus 143 268
5 Urinary Bladder
4163 193
Kidney amp Renal Pelvis
157 242 Kidney amp
Renal Pelvis
34 210 Thyroid 50 131 Kidney amp
Renal Pelvis
114 153
Nonshy Nonshy Liver amp Liver amp Nonshy 6 Hodgkin 3959 189 Hodgkin 105 152 Intrahepatic 24 146 Intrahepatic 45 177 Hodgkin 108 147
Lymphoma Lymphoma Bile Ducts Bile Ducts Lymphoma
7 Melanoma
3632 181 Pancreas
95 157 Leukemia 20 125 Oral Cavity amp Pharynx
32 107 Thyroid 104 90
Kidney amp Liver amp Nonshy Nonshy8 Renal 3250 155 Intrahepatic 95 126 Hodgkin 17 115 Hodgkin 28 114 Leukemia 98 84
Pelvis Bile Ducts Lymphoma Lymphoma
9 Leukemia
2758 132 Myeloma 85 133
Uterine Corpus amp
Unspecified 13 150 Leukemia 23 75 Liver amp
Intrahepatic Bile Ducts
62 91
10 Uterine
Corpus amp Unspecified
2752 247 Leukemia 70 91 Thyroid 13 60 Uterine
Corpus amp Unspecified
17 107
Brain amp Central Nervous System
59 52
Rates are per 100000 population excluding gender-specific sites (prostate female breast uterine corpus) which are per 100000 male or female population All rates are age-adjusted to the 2000 US population
Cancer (all sites) Diagnoses in Nebraska 2015 Incidence Rates by County of Residence
Rates are expressed as the number of new cases per 100000 population and are age-adjusted to the 2000 US population
Incidence Rates
cJ 682 - 4109
cJ 411 0 - 4564
cJ 456 5 - 5022
502 3 - 12260 Statewide incidence rate = 4565
Nebraska D
epartment of H
ealth and Hum
an ServicesC
ancer Registry
13
Cancer (all sites) Diagnoses in Nebraska 2011-2015 Incidence Rates by County of Residence
Rates are expressed as the average annual number of new cases per 100000 population and are age-adjusted to the 2000 US population
Dawes
Box Butte
Morrill
Kimball Cheyenne
Incidence Rates
l=i 121 5 - 4083
CJ 4084 - 4536
CJ 453 7 - 4991
499 2 - 6706
Keya Paha
Sheridan Brown
Dundy
Statewide incidence rate = 4537
Nebraska D
epartment of H
ealth and Hum
an ServicesC
ancer Registry
14
This page intentionally left blank
Nebraska Department of Health and Human ServicesCancer Registry 15
CANCER MORTALITY IN NEBRASKA
In 2015 3490 Nebraska residents died from cancer an increase from the statersquos 2014 tally of 3443 cancer deaths The 2015 count translates into a rate of 1568 cancer deaths per 100000 population Cancer was the second leading cause of mortality among Nebraska residents in 2015 surpassed by heart disease by 76 deaths By primary site cancers of the lung colon and rectum breast and pancreas accounted for just under half (484) of Nebraskarsquos cancer deaths in 2015
Table 4 presents the number and rate of cancer deaths that occurred among Nebraska residents during 2015 and 2011-2015 for all sites combined and for specific sites The most recent US cancer mortality rates which cover the years 2010 through 2014 are also included Comparison of the most recent state and national mortality rates for the past five years shows significant differences (plt01) for cancers of the stomach liver lung and female breast (Nebraska rates lower than the US) and for kidney and invasive brain tumors (Nebraska rates higher than the US) Table 5 presents the number of Nebraska cancer deaths during 2011-2015 by age at death Table 6 presents Nebraska cancer mortality data by race and ethnicity for the years 2006-2015
Maps on pages 21-22 present cancer mortality rates for 2015 and 2011-2015 by place of residence local statistics by place of residence are also found in the appendix to this report (Table 2A [county]mdashpage 3 and Table 14A [local health department]mdashpage 27) The graph below shows annual mortality rates for cancer for Nebraska and the US since 2006
Cancer (All Sites)Mortality Rates Nebraska (2006-2015) amp US (2006-2014)
1000
1200
1400
1600
1800
2000
2200
Ag
e-a
dju
ste
d r
ate
(p
er
10
00
00
po
pu
lati
on
)
2006 2007 2008 2009 2010 2011 2012 2013 2014 2015
Nebraska 1767 1763 1699 1647 1666 1643 1646 1608 1589 1568
US 1820 1793 1763 1734 1717 1687 1663 1631 1613
Nebraska Department of Health and Human ServicesCancer Registry 16
17
Nebraska D
epartment of H
ealth and Hum
an ServicesC
ancer Registry
TABLE 4 Cancer Mortality Number of Deaths and Rates by Selected Primary Site and Gender
Nebraska (2015 and 2011-2015) amp US (2010-2014)
NEBRASKA 2015
NEBRASKA 2011-2015
US 2010-2014
Site Male
No Female
No Total
No Male
No Female
No Total
No Male Rate
Female Rate
Total Rate Rate Rate Rate Rate Rate Rate
All Sites 2005 1415 1661
1835 1873 1655 1349 3490 1568 9134 1941 8124 1365 17258 1606
Oral Cavity amp Pharynx 38 13 25
40 40 19 14 59 27 165 33 81 13 246 22
Esophagus 73 15 41 81 79 19 17 100 45 394 81 85 14 479 44
Stomach 35 36 24 22 59 28 134 28 80 14 214 20 44 23 32 Colon amp Rectum (Colorectal) 184 189 152 120 336 151 858 182 834 136 1692 157 177 124 148 Liver amp Intrahepatic Bile Ducts 62 61 32 26 94 42 341 68 161 28 502 47 92 37 63
Pancreas 126 95 109 108 110 106 86 214 97 591 124 525 88 1116 104
Larynx 19 04 10 20 21 4 03 24 11 97 20 21 04 118 11
Lung amp Bronchus 559 363 447 484 493 422 349 906 410 2461 523 2003 342 4464 420
Melanoma of the Skin 40 17 27 45 45 19 16 64 29 201 42 109 19 310 30
Breast 03 212 118 2 02 231 185 233 103 8 02 1174 199 1182 109
--- --- 23 22 --- --- --- --- 111 21 --- --- --- 23 --- Uterine Cervix
18
TABLE 4 (continued) Cancer Mortality Nebraska D
epartment of H
ealth and Hum
an ServicesC
ancer Registry
Site
Male No Rate
NEBRASKA 2015
Female No Rate
Total No Rate
Male No Rate
NEBRASKA 2011-2015
Female No Rate
Total No Rate
US 2010-2014
Male Female Total Rate Rate Rate
Uterine Corpus amp Unspecified --- --- 49 39 --- --- --- --- 252 43 --- --- --- 46 ---
Ovary --- --- 83 68 --- --- --- --- 389 66 --- --- --- 74 ---
Prostate 158 172 --- --- --- --- 905 202 --- --- --- ---
201 --- ---
Kidney amp Renal Pelvis 68 69 29 24 97 44 324 66 161 27 485 45 56 24 39
Urinary Bladder 65 68 26 19 91 39 307 68 129 20 436 40 76 22 44
Brain amp Other Nervous System 58 56 51 47 109 51 300 63 236 43 536 52 53 35 43 Thyroid 4 04 4 04 8 03 31 06 34 05 65 06 05 05 05 Hodgkin Lymphoma 3 03 5 04 8 04 17 04 15 02 32 03 04 03 03 Non-Hodgkin Lymphoma 76 80 56 44 132 59 340 74 294 47 634 59
76 46 59
Leukemia 82 83 66 49 148 65 432 95 325 52 757 70 91 51 68
Myeloma 43 45 33 26 76 34 212 45 149 24 361 33 42 27 33
Total rates are per 100000 population and are age-adjusted to the 2000 US population Gender-specific rates are per 100000 male or female population and are age-adjusted to the 2000 US population
19
Nebraska D
epartment of H
ealth and Hum
an ServicesC
ancer Registry
TABLE 5 Cancer Mortality Number of Deaths and Percentage Distribution by Selected Primary Site and Age at Death
Nebraska (2011-2015)
Number Number Number Number Number
All Sites 70 04 443 26 4207 244 12538 727 17258 1000 Oral Cavity amp Pharynx 0 00 8 33 80 325 158 642 246 1000 Esophagus 0 00 9 19 153 319 317 662 479 1000 Stomach 0 00 11 51 60 280 143 668 214 1000 Colon amp Rectum (Colorectal) 0 00 47 28 382 226 1263 746 1692 1000 Liver amp Intrahepatic Bile Ducts 1 02 14 28 188 375 299 596 502 1000 Pancreas 0 00 16 14 288 258 812 728 1116 1000 Lung amp Bronchus 0 00 33 07 1106 248 3325 745 4464 1000 Melanoma of the Skin 0 00 17 55 102 329 191 616 310 1000 Female Breast 0 00 58 49 354 302 762 649 1174 1000 Uterine Cervix 0 00 20 180 58 523 33 297 111 1000 Uterine Corpus amp Unspecified 0 00 5 20 68 269 179 710 252 1000 Ovary 0 00 9 23 127 326 253 650 389 1000 Prostate 0 00 1 01 75 83 829 916 905 1000 Kidney amp Renal Pelvis 1 02 8 16 157 324 319 658 485 1000 Urinary Bladder 0 00 1 02 64 147 371 851 436 1000 Brain amp Central Nervous System 27 50 50 93 163 304 296 552 536 1000 Thyroid 0 00 0 00 14 215 51 785 65 1000 Hodgkin Lymphoma 0 00 3 94 14 438 15 469 32 1000 Non-Hodgkin Lymphoma 5 08 24 38 108 170 497 784 634 1000 Leukemia 13 17 30 40 126 166 588 777 757 1000 Myeloma 0 00 2 06 64 177 295 817 361 1000
0-17 Yrs 18-44 Yrs 45-64 Yrs 65+ Yrs TOTAL
NOTE Due to rounding percentages may not sum to 1000
20
Nebraska D
epartment of H
ealth and Hum
an ServicesC
ancer Registry
TABLE 6 Cancer Mortality Number of Deaths and Rates All Sites and Top Ten Primary Sites by Race and Ethnicity
Nebraska (2006-2015)
White African-American Native American AsianPacific Islander Hispanic Site Number Rate Site Number Rate Site Number Rate Site Number Rate Site Number Rate
All Sites 32687 1500 All Sites 1135 1945 All Sites 164 1492 All Sites 214 1000 All Sites 553 954
Rank
1 Lung amp Bronchus 8573 399
Lung amp Bronchus 313 543
Lung amp Bronchus 49 517
Lung amp Bronchus 46 211
Lung amp Bronchus 92 177
2 Colon amp Rectum
3323
151 Colon amp
Rectum 132 249 Colon amp Rectum 21 149
Liver amp Intrahepatic Bile Ducts
32 129 Colon amp Rectum 44 75
3 Female Breast
2174
181 Female
Breast 85 251 Female Breast 13 123
Colon amp Rectum 20 94
Female Breast 43 127
4 Pancreas 2096 96 Pancreas 75 128
Kidney amp Renal Pelvis 7 143
Pancreas
13 66
Liver amp Intrahepatic Bile Ducts
37 69
5 Prostate 1757 195 Prostate 66 342 Leukemia 6 44 Female Breast
11 84 Leukemia 31 42
Liver amp Intrahepatic Bile Ducts
Nonshy6 Leukemia 1402 64 52 72 Stomach 6 41 Hodgkin 10 46 Stomach 30 45
Lymphoma Nonshy
7 Hodgkin 1291 58 Myeloma 42 74 Pancreas 6 41 Leukemia 8 35 Prostate 29 177 Lymphoma
8 Brain amp CNS
974
47 Esophagus 33 52
Liver amp Intrahepatic Bile Ducts
6 38 Stomach 8 25 Kidney amp
Renal Pelvis
26 40
Nonshy
9 Esophagus 881 40 Urinary
Bladder 25 49 Prostate 5 86 Oral Cavity amp Pharynx 7 24
Hodgkin Lymphoma 24 49
10 Kidney amp
Renal Pelvis
871
40 Leukemia 25 37 Oral Cavity
amp Pharynx 4 67 Ovary 6 49 Brain amp CNS 24 29
Rates are per 100000 population excluding gender-specific sites (prostate female breast ovary) which are per 100000 male or female population All rates are age-adjusted to the 2000 US population Abbreviation CNS central nervous system
Cancer (all sites) Deaths in Nebraska 2015 Mortality Rates by County of Residence
Rates are expressed as the number of deaths per 100000 population and are age-adjusted to the 2000 US population
Dawes
Sioux
Box Butte
Scotts Bluff
Morrill
Banner
Kimball Cheyenne
Mortality Rates
CJ No deaths
l=i 01 - 1254
LJ 1255 - 1567
LJ 1568 - 1882
1883 - 431 8
Sheridan Holt
Antel~
Garfield Wheeler
Boone
Statewide mortality rate = 1568
Nebraska D
epartment of H
ealth and Hum
an ServicesC
ancer Registry
21
Cancer (all sites) Deaths in Nebraska 2011-2015 Mortality Rates by County of Residence
Rates are expressed as the average annual number of deaths per 100000 population and are age-adjusted to the 2000 US population
Dawes
Box Butte
Scotts Bluff
Morrill
Kimball Cheyenne
Mortality Rates
cJ 25 6 - 1285
CJ 1286 - 1605
CJ 1606 - 1927
1928 - 2414
Sheridan Cherry
Valley
Custer
Sherman Howard
Dawson Buffalo
Hitchcock Red Willow Furnas Harlan
Statewide mortality rate = 1606
Nebraska D
epartment of H
ealth and Hum
an ServicesC
ancer Registry
22
INCIDENCE AND MORTALITY FOR SELECTED PRIMARY SITES
Lung and Bronchus
Although lung cancer was only the second most frequently diagnosed cancer among Nebraska residents in 2015 it was the yearrsquos leading cause of cancer mortality accounting for 26 of the statersquos cancer deaths During the past five years (2011-2015) lung cancer has averaged over 1200 diagnoses and almost 900 deaths in Nebraska per year Although lung cancer is more likely to strike men than women the lung cancer death rate for Nebraska men has fallen by over 40 since 1990 while remaining almost unchanged for Nebraska women Due to the small number of cases that are detected at an early stage of the disease the 5-year relative survival rate for people diagnosed with lung cancer is less than 20
Cigarette smoking is the major risk factor for lung cancer and causes about 80 of lung cancer deaths People who smoke cigarettes are 15 to 30 times more likely to die from lung cancer than non-smokers Quitting smoking at any age reduces the risk of lung cancer although the risk for smokers is higher than the risk for a lifelong non-smoker The US Preventive Services Task Force (USPSTF) and ACS have both endorsed screening for lung cancer using low-dose computed tomography (LDCT) but only for people 55-74 years of age (the USPSTF recommendation includes people 55-80) who currently smoke or who have quit within the past 15 years are in good health and have at least a 30 pack-year smoking history
Maps on pages 45-46 present lung amp bronchus cancer incidence and mortality rates by place of residence local statistics by place of residence are also found in the appendix to this report (Table 3A [county]mdashpage 5 and Tables 13A and 14A [ local health department region]mdashpages 25-27)
Lung and Bronchus CancerIncidence Rates Nebraska (2006-2015) amp US (2006-2014)
30
40
50
60
70
80
90
Ag
e-a
dju
ste
d r
ate
(p
er
10
00
00
po
pu
lati
on
)
2006 2007 2008 2009 2010 2011 2012 2013 2014 2015
Nebraska 638 673 626 581 608 577 606 621 569 571
US 688 679 673 661 639 625 615 602 583
Nebraska Department of Health and Human ServicesCancer Registry 23
Lung and Bronchus CancerMortality Rates Nebraska (2006-2015) amp US (2006-2014)shy
200
300
400
500
600
700
800 A
ge
-ad
just
ed
ra
te (
pe
r 1
00
00
0 p
op
ula
tio
n)
2006 2007 2008 2009 2010 2011 2012 2013 2014 2015
Nebraska 475 486 451 442 459 425 433 428 414 410
US 517 507 496 484 474 460 449 434 422
Lung and Bronchus CancerPercentage of Cases by Stage of Disease at Diagnosisshy
Nebraska 2011-2015shy
Local
20
Regional
23
Distant
50
Unstaged
7
Nebraska Department of Health and Human ServicesCancer Registry 24
Breast (Female only)
Breast cancer is the most common type of cancer among women and the second most frequent cause of female cancer deaths Between 2011 and 2015 6714 Nebraska women were diagnosed with invasive breast cancer (and another 1427 were diagnosed with in situ breast cancer) and 1174 women died from breast cancer Since 1990 the rate of breast cancer deaths in Nebraska and the US has declined significantly Recent declines in the rate of breast cancer diagnoses have been attributed to the decreasing use of post-menopausal hormone replacement therapy early detection through screening and increased awareness
Age is an important risk factor for breast cancer with 80 of all cases occurring among women age 50 and older Other risk factors include genetic mutations a personal or family history of breast cancer some forms of benign breast disease early menstruation late menopause never having children or having a first child after age 30 and for post-menopausal women obesity and long-term hormone replacement therapy
Screening for breast cancer is known to save lives although opinion varies on how and when to screen USPSTF guidelines recommend mammography for women 50-74 on an every-other-year schedule However ACS guidelines recommend that women 40-44 have the choice for annual mammography women 45-54 have annual mammography and women 55 and older have the choice to continue annual mammography or to have it on an every-other-year schedule continuing as long as their overall health is good and life expectancy is 10 or more years For some women who have an increased risk of breast cancer the ACS recommends annual magnetic resonance imaging (MRI) in addition to mammography usually starting at age 30
Maps on pages 47-48 present female breast cancer incidence and mortality rates by place of residence local statistics by place of residence are also found in the appendix to this report (Table 4A [county]mdashpage 7 and Table 13A and 14A [local health department]mdashpages 25-27)
Female Breast CancerIncidence Rates Nebraska (2006-2015) amp US (2006-2014)
900
1000
1100
1200
1300
1400
1500
Ag
e-a
dju
ste
d r
ate
(p
er
10
00
00
fe
ma
le p
op
ula
tio
n)
2006 2007 2008 2009 2010 2011 2012 2013 2014 2015
Nebraska 1301 1174 1301 1224 1182 1267 1190 1210 1240 1278
US 1218 1233 1245 1255 1215 1239 1235 1247 1239
Nebraska Department of Health and Human ServicesCancer Registry 25
Female Breast CancerMortality Rates Nebraska (2006-2015) amp US (2006-2014)
100
150
200
250
300
350
400 A
ge
-ad
just
ed
ra
te (
pe
r 1
00
00
0 f
em
ale
po
pu
lati
on
)
2006 2007 2008 2009 2010 2011 2012 2013 2014 2015
Nebraska 199 215 207 194 192 181 212 208 213 185
US 236 230 226 222 219 215 213 207 205
Female Breast CancerPercentage of Cases by Stage of Disease at Diagnosisshy
Nebraska 2011-2015shy
Local
52 Regional
24
Distant
4
Unstaged
2
In situ
18
Nebraska Department of Health and Human ServicesCancer Registry 26
Colon and Rectum (Colorectal)
In 2015 colorectal cancer was the fourth most frequently diagnosed cancer among Nebraska residents accounting for 920 new cases It was also the second leading cause of cancer mortality in the state accounting for 336 deaths
The risk of developing colorectal cancer increases with age More than half (616) of all colorectal cancer cases that occurred in Nebraska during 2011-2015 were 65 or older at diagnosis Other risk factors include a personal or family history of colorectal cancer or polyps a personal history of chronic inflammatory bowel disease and certain hereditary colorectal cancer syndromes Modifiable risk factors include physical inactivity obesity smoking a high-fat diet (especially fat from animal sources) and heavy alcohol use
Screening for asymptomatic polyps and tumors is known to prevent colorectal cancer cases and deaths and there are a number of recommended test options Among them include several types of stool tests flexible sigmoidoscopy colonoscopy CT colonography (virtual colonoscopy) and double-contrast barium enema Recommended frequency varies by type of test For people of average risk without symptoms the USPSTF recommends screening for those 50-75 years of age while the ACS recommends screening for anyone 45 and older However the USPSTF also recommends that people at increased risk (ie a personal or family history of colorectal cancer or polyps a personal history of chronic inflammatory bowel disease or a family history of hereditary colorectal cancer syndromes) may be advised to begin screening before age 50 andor be screened more often
Maps on pages 49-50 present incidence and mortality rates for cancers of the colon amp rectum by place of residence local statistics by place of residence are also found in the appendix to this report (Table 5A [county]mdashpage 9 and Table 13A and 14A [local health department]mdashpages 25-27)
Colon and Rectum (Colorectal) Cancer Incidence Rates Nebraska (2006-2015) amp US (2006-2014)
200
300
400
500
600
700
800
Ag
e-a
dju
ste
d r
ate
(p
er
10
00
00
po
pu
lati
on
)
2006 2007 2008 2009 2010 2011 2012 2013 2014 2015
Nebraska 560 559 529 474 462 450 439 412 422 428
US 482 470 458 436 416 407 395 388 384
Nebraska Department of Health and Human ServicesCancer Registry 27
Colon and Rectum (Colorectal) CancerMortality Rates Nebraska (2006-2015) amp US (2006-2014)
00
50
100
150
200
250
300 A
ge
-ad
just
ed
ra
te (
pe
r 1
00
00
0 p
op
ula
tio
n)
2006 2007 2008 2009 2010 2011 2012 2013 2014 2015
Nebraska 193 185 184 163 171 171 159 150 156 151
US 173 169 165 158 155 151 147 145 141
Colon and Rectum (Colorectal) CancerPercentage of Cases by Stage of Disease at Diagnosisshy
Nebraska 2011-2015shy
Local
38
Regional
34
Distant
18
Unstaged
7
In situ
3
Nebraska Department of Health and Human ServicesCancer Registry 28
Prostate
With 1185 diagnoses in 2015 prostate cancer was the most common cancer among Nebraska men accounting for over 24 of all new cancers During the past five years (2011-2015) it has also been the second leading cause of cancer deaths among Nebraska men accounting for 905 deaths Since the mid-1990s prostate cancer death rates have declined substantially both in Nebraska and throughout the United States
Little is known about what causes prostate cancer Risk increases with age (about 59 of Nebraska men diagnosed with prostate cancer during 2011-2015 were 65 or older) and is significantly greater among African-Americans During the past decade (2006-2015) the incidence of prostate cancer among African-American men in Nebraska has been 37 higher than among whites Men with a close relative (father brother or son) who have had prostate cancer especially at a young age are also at increased risk
Current ACS guidelines recommend that men make an informed decision with their health care provider about whether to be screened for prostate cancer This discussion should begin at age 50 for men who are at average risk of prostate cancer and have a life expectancy of at least 10 years This discussion should begin at age 45 for men at high risk (African-Americans and men with a father brother or son diagnosed with prostate cancer before age 65) and at age 40 for men of even higher risk (men with several first-degree relatives diagnosed before age 65) For men who choose to be screened the ACS recommends the prostate-specific antigen (PSA) test with or without a digital rectal exam By contrast the USPSTF does not recommend screening for prostate cancer
Maps on pages 51-52 present incidence and mortality rates for prostate cancer by place of residence local statistics by place of residence are also found in the appendix to this report (Table 6A [county]mdashpage 11 and Table 13A and 14A [local health department]mdash pages 25-27)
Prostate CancerIncidence Rates Nebraska (2006-2015) amp US (2006-2014)
0
50
100
150
200
250
Ag
e-a
dju
ste
d r
ate
(p
er
10
00
00
ma
le p
op
ula
tio
n)
2006 2007 2008 2009 2010 2011 2012 2013 2014 2015
Nebraska 1615 1713 1499 1278 1401 1320 1133 1104 1043 1095
US 1598 1643 1516 1434 1344 1337 1097 1041 955
Nebraska Department of Health and Human ServicesCancer Registry 29
Prostate CancerMortality Rates Nebraska (2006-2015) amp US (2006-2014)
100
150
200
250
300
350
400 A
ge
-ad
just
ed
ra
te (
pe
r 1
00
00
0 m
ale
po
pu
lati
on
)
2006 2007 2008 2009 2010 2011 2012 2013 2014 2015
Nebraska 235 248 236 230 200 221 214 217 191 172
US 242 242 230 221 218 208 196 193 191
Prostate CancerPercentage of Cases by Stage of Disease at Diagnosisshy
Nebraska 2011-2015shy
Local
72 Regional
14
Distant
6
Unstaged
8
Nebraska Department of Health and Human ServicesCancer Registry 30
Urinary Bladder
Between 2011 and 2015 2232 Nebraska residents were diagnosed with bladder cancer Bladder cancer occurs much more frequently among men than women (by about a 3-to-1 ratio) and it now ranks as the fourth most common site of cancer diagnoses among Nebraska men However deaths from bladder cancer occur far less often (436 Nebraska residents died from it during 2011-2015) which is the result of a high percentage of early-stage diagnoses and the existence of effective treatments Survival prospects have improved considerably in recent decades to the point where the most current national data show that the five-year relative survival rate for all bladder cancer patients is about 77
Cigarette smoking is the most important known risk factor for bladder cancer Smokers develop bladder cancer three times more often than non-smokers and about half of all cases are attributable to smoking Risk factors also include occupational exposures to certain chemicals used to make dyes (benzidine and beta-naphthylamine) as well as working in the manufacture of rubber and leather Like most cancers the risk of bladder cancer increases with age 76 of the cases that occurred in Nebraska during 2011-2015 were at least 65 years old when diagnosed
Maps on pages 53-54 present incidence and mortality rates for urinary bladder cancer by place of residence local statistics by place of residence are also found in the appendix to this report (Table 7A [county]mdashpage 13 and Table 13A and 14A [local health department]mdashpages 25-27)
Urinary Bladder CancerIncidence Rates Nebraska (2006-2015) amp US (2006-2014)
00
50
100
150
200
250
300
Ag
e-a
dju
ste
d r
ate
(p
er
10
00
00
po
pu
lati
on
)
2006 2007 2008 2009 2010 2011 2012 2013 2014 2015
Nebraska 203 224 203 198 216 223 209 203 195 210
US 213 215 215 213 209 208 207 203 198
Nebraska Department of Health and Human ServicesCancer Registry 31
Urinary Bladder CancerMortality Rates Nebraska (2006-2015) amp US (2006-2014)shy
00
10
20
30
40
50
60 A
ge
-ad
just
ed
ra
te (
pe
r 1
00
00
0 p
op
ula
tio
n)
2006 2007 2008 2009 2010 2011 2012 2013 2014 2015
Nebraska 43 42 40 35 43 45 40 38 37 39
US 44 44 44 44 44 44 44 44 43
Urinary Bladder CancerPercentage of Cases by Stage of Disease at Diagnosisshy
Nebraska 2011-2015shy
Local
34
Regional
7
Distant
3
Unstaged
5
In Situ
51
Nebraska Department of Health and Human ServicesCancer Registry 32
Non-Hodgkin Lymphoma
Lymphomas are cancers that affect the white blood cells of the immune system and are usually classified as either Hodgkin or Non-Hodgkin lymphoma Non-Hodgkin lymphoma is by far the more common disorder of the two accounting for 2120 diagnoses and 634 deaths among Nebraska residents between 2011 and 2015 (for Hodgkin lymphoma the comparable figures are 294 diagnoses and 32 deaths) National statistics indicate that the incidence rate for Non-Hodgkin lymphoma has increased by about 80 since the midshy1970s and some of this increase is related to the appearance of AIDS However both state and national data show that Non-Hodgkin lymphoma deaths have been increasing since at least 1950 which indicates that factors other than AIDS are also responsible
The causes of Non-Hodgkin lymphoma are unknown although there is evidence that viral exposures and reduced immune function are associated with the disease People whose immune systems have been suppressed by drugs particularly those who have received an organ transplant are at high risk of Non-Hodgkin lymphoma and it also occurs more frequently among people with congenital and acquired immunologic disorders including AIDS The increased incidence of the disease among people with congenital disorders of the immune system suggests that hereditary factors may increase risk Some studies have found that occupational exposure to certain herbicides is a risk factor as well
Maps on pages 55-56 present incidence and mortality rates for Non-Hodgkin lymphoma by place of residence local statistics by place of residence are also found in the appendix to this report (Table 8A [county]mdashpage 15 and Table 13A and 14A [local health department]mdashpages 25-27)
Non-Hodgkin LymphomaIncidence Rates Nebraska (2006-2015) amp US (2006-2014)
00
50
100
150
200
250
300
Ag
e-a
dju
ste
d r
ate
(p
er
10
00
00
po
pu
lati
on
)
2006 2007 2008 2009 2010 2011 2012 2013 2014 2015
Nebraska 211 214 198 212 209 219 195 215 186 198
US 197 197 197 198 196 191 189 188 185
Nebraska Department of Health and Human ServicesCancer Registry 33
Non-Hodgkin LymphomaMortality Rates Nebraska (2006-2015) amp US (2006-2014)shy
00
20
40
60
80
100
120 A
ge
-ad
just
ed
ra
te (
pe
r 1
00
00
0 p
op
ula
tio
n)
2006 2007 2008 2009 2010 2011 2012 2013 2014 2015
Nebraska 73 76 64 62 69 66 54 59 56 59
US 67 66 64 63 61 60 59 57 57
Non-Hodgkin LymphomaPercentage of Cases by Stage of Disease at Diagnosisshy
Nebraska 2011-2015shy
Local
25
Regional
15
Distant
49
Unstaged
11
Nebraska Department of Health and Human ServicesCancer Registry 34
Leukemia
Between 2011 and 2015 leukemia accounted for 1463 diagnoses and 757 deaths among Nebraska residents Although leukemia is one of the most common types of cancer diagnosed among children and adolescents over half (57) of the leukemia cases that occurred in Nebraska between 2011 and 2015 were 65 years of age or older at diagnosis There are many different types of leukemia acute lymphocytic leukemia is the most frequently diagnosed among children and teens while acute myeloid and chronic lymphocytic are the most common types among adults Survival times vary widely by type overall the relative five-year survival rate for all leukemia patients in the United States is over 60
The major causes of most types of leukemia are unknown Nevertheless several risk factors have been identified and include genetic abnormalities (such as Down syndrome) exposure to ionizing radiation and workplace exposure to benzene and other related solvents Adult T-cell acute lymphocytic leukemia is strongly associated with infection by a retrovirus the human T-cell lymphomaleukemia virus type I (HTLV-I) Cigarette smoking is a risk factor for acute myeloid leukemia while people who have a family history of chronic lymphocytic leukemia carry an increased risk of the disease themselves
Maps on pages 57-58 present incidence and mortality rates for leukemia by place of residence local statistics by place of residence are also found in the appendix to this report (Table 9A [county]mdashpage 17 and Table 13A and 14A [local health department]mdash pages 25-27)
LeukemiaIncidence Rates Nebraska (2006-2015) amp US (2006-2014)
00
40
80
120
160
200
240
Ag
e-a
dju
ste
d r
ate
(p
er
10
00
00
po
pu
lati
on
)
2006 2007 2008 2009 2010 2011 2012 2013 2014 2015
Nebraska 162 158 141 133 149 141 147 143 145 122
US 134 133 133 134 140 140 139 137 133
Nebraska Department of Health and Human ServicesCancer Registry 35
LeukemiaMortality Rates Nebraska (2006-2015) amp US (2006-2014)
20
40
60
80
100
120 A
ge
-ad
just
ed
ra
te (
pe
r 1
00
00
0 p
op
ula
tio
n)
00 2006 2007 2008 2009 2010 2011 2012 2013 2014 2015
Nebraska 74 68 79 62 63 70 81 65 71 65
US 72 71 71 71 69 69 68 68 66
Leukemia Number of Cases by Histologic Type Nebraska 2011-2015
Nebraska Department of Health and Human ServicesCancer Registry 36
Acute lymphocytic
Chronic lymphocytic
Other lymphocytic
Acute myeloid
Acute monocytic
Chronic myeloid
Other myeloidmonocytic
Other acute leukemia
Aleukemic subleukemic amp NOS 29
24
26
192
34
468
39
502
149
0 100 200 300 400 500
Abbreviation NOS not otherwise specified
600
Kidney and Renal Pelvis
Cancers of the kidney and renal pelvis accounted for 1774 diagnoses in Nebraska between 2011 and 2015 and also accounted for 485 deaths in Nebraska during the same years State and national trends since 1990 show a significant increase in the rate of diagnosis of these cancers but little change in the mortality rate The chances of survival for people with kidney cancer are relatively high with the most current national statistics showing that the five-year relative survival rate for cancers of the kidney and renal pelvis is now over 70
Preventable risk factors for cancer of the kidney include cigarette smoking and obesity Current estimates indicate that cigarette smoking is responsible for about 20 percent of all kidney cancer deaths Kidney cancer is more likely to strike at younger ages than most other types in Nebraska almost half (496) of all cases that were diagnosed during 2011-2015 were under the age of 65 Other non-preventable risk factors for cancer of the kidney include a family history of kidney cancer and high blood pressure However since people with high blood pressure are often treated with drugs it is unclear whether their increased risk is related to their high blood pressure or the drugs Nevertheless people who need drugs to lower their blood pressure should take them
Maps on pages 59-60 present incidence and mortality rates for cancers of the kidney amp renal pelvis by place of residence local statistics by place of residence are also found in the appendix to this report (Table 10A [county]mdashpage 19 and Table 13A and 14A [local health department]mdashpages 25-27)
Kidney and Renal Pelvis Cancer Incidence Rates Nebraska (2006-2015) amp US (2006-2014)
00
40
80
120
160
200
240
Ag
e-a
dju
ste
d r
ate
(p
er
10
00
00
po
pu
lati
on
)
2006 2007 2008 2009 2010 2011 2012 2013 2014 2015
Nebraska 162 165 188 177 183 157 155 166 173 188
US 157 160 163 163 159 160 162 162 162
Nebraska Department of Health and Human ServicesCancer Registry 37
Kidney and Renal Pelvis CancerMortality Rates Nebraska (2006-2015) amp US (2006-2014)shy
00
10
20
30
40
50
60
Ag
e-a
dju
ste
d r
ate
(p
er
10
00
00
po
pu
lati
on
)
2006 2007 2008 2009 2010 2011 2012 2013 2014 2015
Nebraska 45 40 38 48 42 51 41 41 46 44
US 40 40 40 39 39 39 38 39 38
Kidney and Renal Pelvis CancerPercentage of Cases by Stage of Disease at Diagnosisshy
Nebraska 2011-2015shy
Local
61
Regional
16
Distant
16
Unstaged
5
In Situ
2
Nebraska Department of Health and Human ServicesCancer Registry 38
Melanoma of the Skin
There are several different types of skin cancer but melanomas are the most serious Nationally melanomas comprise about 1 of all skin cancer diagnoses but the vast majority of all skin cancer deaths In Nebraska melanomas of the skin accounted for 2235 diagnoses and 310 deaths between 2011 and 2015 The incidence of melanoma continues to increase significantly in Nebraska and throughout the United States Because most melanomas are discovered early in their development and can be surgically removed the relative five-year survival rate is now over 90
Melanoma is related to exposure to ultraviolet radiation (most of which comes from the sun) particularly exposures during childhood that resulted in severe sunburns The risk of developing melanoma is particularly high among people with light skin Sun exposure is not the only risk factor Family history of melanoma and the presence of numerous dysplastic nevi (large moles with irregular coloration and shape) also increase a personrsquos risk of the disease
Skin melanomas are among the most preventable and treatable of all cancers Wearing protective clothing and using sunscreen are the best methods for preventing the disease and children in particular should have such protection In addition early detection can greatly reduce the risk of melanoma mortality Recognition of changes in skin growths or the appearance of new growths is the best way to find melanomas early in their development The ACS suggests that adults practice skin self-examination on a monthly basis and that suspicious lesions should be evaluated promptly by a physician
Maps on pages 61-62 present incidence and mortality rates for melanoma of the skin by place of residence local statistics by place of residence are also found in the appendix to this report (Table 11A [county]mdashpage 21 and Table 13A and 14A [local health department]mdashpages 25-27)
Melanoma of the SkinIncidence Rates Nebraska (2006-2015) amp US (2006-2014)
00
50
100
150
200
250
300
Ag
e-a
dju
ste
d r
ate
(p
er
10
00
00
po
pu
lati
on
)
2006 2007 2008 2009 2010 2011 2012 2013 2014 2015
Nebraska 176 179 183 192 183 197 178 236 235 256
US 191 195 199 202 199 205 205 210 214
Nebraska Department of Health and Human ServicesCancer Registry 39
Melanoma of the SkinMortality Rates Nebraska (2006-2015) amp US (2006-2014)
00
10
20
30
40
50
60 A
ge
-ad
just
ed
ra
te (
pe
r 1
00
00
0 p
op
ula
tio
n)
2006 2007 2008 2009 2010 2011 2012 2013 2014 2015
Nebraska 30 20 39 32 26 27 34 34 25 29
US 27 27 27 28 27 27 27 27 26
Melanoma of the SkinPercentage of Cases by Stage of Disease at Diagnosisshy
Nebraska 2011-2015shy
Local
44
Regional
5
Distant
3
Unstaged
7
In Situ
41
Nebraska Department of Health and Human ServicesCancer Registry 40
Liver and Intrahepatic Bile Ducts
Often when cancer is found in the liver it did not start there but has spread (metastized) from somewhere else in the body In the United States metastatic liver cancer is more common than liver cancer that originates in the liver (referred to as primary liver cancer) In Nebraska primary cancers of the liver and intrahepatic bile ducts accounted for 604 diagnoses and 502 deaths between 2011 and 2015 Diagnosis does not usually occur until the disease is well advanced due to a lack of symptoms As a result survival is poor the most recent national five-year survival rate is less than 20 Both nationally and in Nebraska the incidence and mortality rates for liver cancer have increased steadily during the past decade
The most common risk factor for liver cancer is chronic viral hepatitis (type B and C) Other preventable risk factors include cirrhosis heavy alcohol use obesity exposure to arsenic and vinyl chloride and using anabolic steroids Type 2 diabetes has also been linked with an increased risk of liver cancer usually in cases where other risk factors such as heavy alcohol use andor chronic viral hepatitis are present Non-preventable risk factors for liver cancer include gender raceethnicity and certain inherited metabolic diseases Nebraska statistics show that diagnoses among men outnumber those among women by a ratio of about 31 while incidence rates are significantly higher among African-Americans Native Americans AsianPacific Islanders and Hispanics compared to whites
Maps on pages 63-64 present incidence and mortality rates for cancers of the liver by place of residence local statistics by place of residence are also found in the appendix to this report (Table 12A [county]mdashpage 23 and Table 13A and 14A [local health department]mdashpages 25-27)
Liver amp Intrahepatic Bile Ducts CancerIncidence Rates Nebraska (2006-2015) amp US (2006-2014)
00
30
60
90
120
150
180
Ag
e-a
dju
ste
d r
ate
(p
er
10
00
00
po
pu
lati
on
)
2006 2007 2008 2009 2010 2011 2012 2013 2014 2015
Nebraska 42 42 55 50 59 57 56 58 46 59
US 63 67 69 73 74 76 79 80 81
Nebraska Department of Health and Human ServicesCancer Registry 41
Liver amp Intrahepatic Bile Ducts CancerMortality Rates Nebraska (2006-2015) amp US (2006-2014)
00
30
60
90
120
150 A
ge
-ad
just
ed
ra
te (
pe
r 1
00
00
0 p
op
ula
tio
n)
2006 2007 2008 2009 2010 2011 2012 2013 2014 2015
Nebraska 43 38 33 45 50 53 46 46 46 42
US 53 54 56 58 59 61 63 65 65
Liver amp Intrahepatic Bile Ducts CancerPercentage of Cases by Stage of Disease at Diagnosisshy
Nebraska 2011-2015shy
Local
44 Regional
27
Distant
15
Unstagedshy14shy
Nebraska Department of Health and Human ServicesCancer Registry 42
This page intentionally left blank
Nebraska Department of Health and Human ServicesCancer Registry 43
INCIDENCE amp MORTALITY RATE MAPS FOR SELECTED PRIMARY SITES
Nebraska Department of Health and Human ServicesCancer Registry 44
Primary Site Contents Page
Lung amp bronchus
Incidence Mortality
45 46
Female breast
Incidence Mortality
47 48
Colon amp rectum (colorectal)
Incidence Mortality
49 50
Prostate
Incidence Mortality
51 52
Urinary bladder
Incidence Mortality
53 54
Non-Hodgkin lymphoma
Incidence Mortality
55 56
Leukemia
Incidence Mortality
57 58
Kidney amp renal pelvis
Incidence Mortality
59 60
Melanoma of the skin
Incidence Mortality
61 62
Liver amp intrahepatic bile ducts
Incidence Mortality
63 64
Lung amp Bronchus Cancer Diagnoses in Nebraska 2011-2015 Incidence Rates by Local Health Department Region
Rates are expressed as the average annual number of new cases per 100000 population and are age-adjusted to the 2000 U S population
Incidence Rates
455 - 488
489 - 558
559 - 633
Statewide incidence rate=590 634 - 699
Nebraska D
epartment of H
ealth and Hum
an ServicesC
ancer Registry
45
Lung amp Bronchus Cancer Deaths in Nebraska 2011-2015 Mortality Rates by Local Health Department Region
Rates are expressed as the average annual number of deaths per 100000 population and age-adjusted to the 2000 U S population
Mortality Rates
305 - 369
370 - 400
433 - 491 Statew ide mortal ity rate=420
Nebraska D
epartment of H
ealth and Hum
an ServicesC
ancer Registry
46
Nebraska D
epartment of H
ealth and Hum
an ServicesC
ancer Registry
47
Nebraska D
epartment of H
ealth and Hum
an ServicesC
ancer Registry
48
Nebraska D
epartment of H
ealth and Hum
an ServicesC
ancer Registry
49
Nebraska D
epartment of H
ealth and Hum
an ServicesC
ancer Registry
50
Nebraska D
epartment of H
ealth and Hum
an ServicesC
ancer Registry
51
Nebraska D
epartment of H
ealth and Hum
an ServicesC
ancer Registry
52
Nebraska D
epartment of H
ealth and Hum
an ServicesC
ancer Registry
53
Nebraska D
epartment of H
ealth and Hum
an ServicesC
ancer Registry
54
Non-Hodgkin Lymphoma Diagnoses in Nebraska 2011-2015 Incidence Rates by Local Health Department Region
Rates are expressed as the average annual number of new cases per 100000 population and are age-adj usted to the 2000 U S population
Incidence Rates
140 - 180
181 - 209
Statewide incidence rate=203 221 - 298
Nebraska D
epartment of H
ealth and Hum
an ServicesC
ancer Registry
55
Nebraska D
epartment of H
ealth and Hum
an ServicesC
ancer Registry
56
Nebraska D
epartment of H
ealth and Hum
an ServicesC
ancer Registry
57
Nebraska D
epartment of H
ealth and Hum
an ServicesC
ancer Registry
58
Nebraska D
epartment of H
ealth and Hum
an ServicesC
ancer Registry
59
Kidney amp Renal Pelvis Cancer Deaths in Nebraska 2011-2015 Mortality Rates by Local Health Department Region
Rates are expressed as the average annual number of deaths per 100000 population and age-adjusted to the 2000 U S population
Mortality Rates
2 4 - 3 8
39 - 42
43 - 55
56 - 69 Statewide mortality rate=45
Nebraska D
epartment of H
ealth and Hum
an ServicesC
ancer Registry
60
Nebraska D
epartment of H
ealth and Hum
an ServicesC
ancer Registry
61
Nebraska D
epartment of H
ealth and Hum
an ServicesC
ancer Registry
62
Nebraska D
epartment of H
ealth and Hum
an ServicesC
ancer Registry
63
Liver amp lntrahepatic Bile Ducts Cancer Deaths in Nebraska 2011-2015 Mortality Rates by Local Health Department Region
Rates are expressed as the average annual number of deaths per 100000 population and age-adjusted to the 2000 U S population
North Central
---1 West Central
Mortality Rates
12 - 36
37-41
5 3 - 9 3 Statewide mortality rate=4 7
Nebraska D
epartment of H
ealth and Hum
an ServicesC
ancer Registry
64
REFERENCES
American Cancer Society American Cancer Society Recommendations for the Early Detection of Breast Cancer 2017 Available at httpswwwcancerorgcancerbreast-cancerscreening-testsshyand-early-detectionamerican-cancer-society-recommendations-for-the-early-detection-of-breastshycancerhtml
American Cancer Society Cancer Facts and Figures 2018 Atlanta GA American Cancer Society 2018 Available at httpswwwcancerorgcontentdamcancer-orgresearchcancer-facts-and-statisticsannualshycancer-facts-and-figures2018cancer-facts-and-figures-2018pdf
American Cancer Society Colorectal Cancer Screening Guidelines 2018 Available at httpswwwcancerorghealth-care-professionalsamerican-cancer-society-prevention-earlyshydetection-guidelinescolorectal-cancer-screening-guidelineshtml
Fritz A Percy C Jack A Shanmugaratnam K Sobin L Parkin DM Whelan S International Classification of Diseases for Oncology 3rd edition (US interim version 2000) Geneva Switzerland World Health Organization 2000
National Cancer Institute SEER Cancer Stat Facts Bethesda MD National Cancer Institute Accessed on February 21 2018 Available at httpsseercancergovstatfacts
United States Cancer Statistics 1999-2014 Incidence CDC WONDER On-line Database US Department of Health and Human Services Centers for Disease Control and Prevention and National Cancer Institute 2016 Available at httpswondercdcgovcancer-v2014HTML
United States Cancer Statistics 1999-2014 Mortality CDC WONDER On-line Database US Department of Health and Human Services Centers for Disease Control and Prevention 2016 Available at httpswondercdcgovcancermort-v2014HTML
United States Department of Health and Human Services The Health Consequences of Smoking A Report of the Surgeon General US Department of Health and Human Services Centers for Disease Control and Prevention National Center for Chronic Disease Prevention and Health Promotion Office on Smoking and Health 2004 Available at httpswwwcdcgovtobaccodata_statisticssgr2004complete_reportindexhtm
US Preventive Services Task Force Final Recommendation Statement Breast Cancer Screening November 2016 Available at httpwwwuspreventiveservicestaskforceorgPageDocumentRecommendationStatementFinalb reast-cancer-screening1
US Preventive Services Task Force Final Recommendation Statement Colorectal Cancer Screening June 2017 Available at httpswwwuspreventiveservicestaskforceorgPageDocumentRecommendationStatementFinal colorectal-cancer-screening2
US Preventive Services Task Force Final Recommendation Statement Lung Cancer Screening December 2016 Available at httpwwwuspreventiveservicestaskforceorgPageDocumentRecommendationStatementFinall ung-cancer-screening
World Health Organization Manual of the International Statistical Classification of Diseases and Related Health Problems 10th revision Geneva Switzerland World Health Organization 1992
Nebraska Department of Health and Human ServicesCancer Registry 65
REPORTING FACILITIES
Ainsworth--Brown County Hospital Albion--Boone County Health Center Alliance--Box Butte General Hospital Alma--Harlan County Health System Atkinson--West Holt Memorial Hospital Inc Auburn--Nemaha County Hospital Aurora--Memorial Hospital Bassett--Rock County Hospital Beatrice--Beatrice Community Hospital amp Health Center Inc Benkelman--Dundy County Hospital Blair--Memorial Community Hospital Bridgeport--Morrill County Community Hospital Broken Bow--Jennie Melham Memorial Medical Ctr Callaway--Callaway District Hospital Cambridge--Tri Valley Health System Central City--Litzenberg Memorial County Hospital Chadron--Chadron Community Hospital amp Health Services Columbus--Columbus Community Hospital Inc Cozad--Cozad Community Hospital Creighton--Creighton Area Health Services Crete--Crete Area Medical Center David City--Butler County Health Care Center Fairbury--Jefferson Community Health Center Inc Falls City--Community Medical Center Inc Franklin--Franklin County Memorial Hospital Fremont--Fremont Area Medical Center Friend--Warren Memorial Hospital Geneva--Fillmore County Hospital Genoa--Genoa Community HospitalLTC Gordon--Gordon Memorial Hospital District Gothenburg--Gothenburg Memorial Hospital Grand Island--CHI Health St Francis Grant--Perkins County Health Services Hastings--Mary Lanning Memorial Hospital Hebron--Thayer County Health Services Henderson--Henderson Health Care Services Holdrege--Phelps Memorial Health Center Imperial--Chase County Community Hospital Kearney--CHI Health Good Samaritan Kearney--CHI Health Good Samaritan Pathology Kimball--Kimball Health Services amp Hospital Lexington--Tri-County Area Hospital District Lincoln--Bryan-LGH Medical Center East amp West Lincoln--CHI Health Saint Elizabeth Lincoln--Pathology Medical Services Lincoln--Williamsburg Radiation Center Lincoln--CHI Health Nebraska Heart Lincoln--UNMC College of Dentistry Lynch--Niobrara Valley Hospital Corp McCook--Community Hospital Minden--Kearney County Health Services Nebraska City--CHI Health St Marys Neligh--Antelope Memorial Hospital
Norfolk--Faith Regional Health Services East amp West North Platte--Great Plains Regional Medical Center North Platte--Pathology Services Oakland--Oakland Memorial Hospital Ogallala--Ogallala Community Hospital Omaha--CHI Health Bergan Mercy Omaha--CHI Health Immanuel Omaha--Childrens Hospital Omaha--VA Nebraska-Western Iowa Health Care System Omaha--Methodist Hospital Pathology Center Omaha--Nebraska Medical Center Omaha--Nebraska Methodist Hospital Omaha--CHI Health Creighton University Med Ctr Omaha--Boys Town National Research Hospital Omaha--CHI Health Lakeside Omaha--CHI Health Bergan Mercy Pathology Omaha--Bishop Clarkson Hospital Pathology Omaha--Creighton Pathology Associates Omaha--Physicians Lab ONeill--Avera St Anthonys Hospital Ord--Valley County Hospital Osceola--Annie Jeffrey Memorial County Health Ctr Oshkosh--Garden County Health Services Osmond--Osmond General Hospital Papillion--CHI Health Midlands Pawnee City--Pawnee County Memorial Hospital Pender--Pender Community Hospital Plainview--CHI Health Plainview Red Cloud--Webster County Community Hospital Schuyler--CHI Health Schuyler Scottsbluff--Regional West Medical Center Scottsbluff--Western Pathology Consultants Seward--Memorial Hospital Sidney--Memorial Health Center St Paul--Howard County Community Hospital Superior--Brodstone Memorial Hospital Syracuse--Community Memorial Hospital Tecumseh--Johnson County Hospital Tilden--Tilden Community Hospital Valentine--Cherry County Hospital Wahoo--Saunders County Health Services Wayne--Providence Medical Center West Point--St Francis Memorial Hospital Winnebago--USPHS Indian Hospital York--York General Hospital
Other States Sioux City IA--Mercy Medical Center
State cancer registries participating in the National Interstate Data Exchange Agreement and the state cancer registries of Illinois Kansas Minnesota Missouri and South Dakota
Nebraska Department of Health and Human ServicesCancer Registry 66
THE NEBRASKA DEPARTMENT OF HEALTH AND HUMAN SERVICES IS COMMITTED TO AFFIRMATIVE ACTION
EQUAL EMPLOYMENT OPPORTUNITIES AND DOES NOT DISCRIMINATE IN DELIVERING BENEFITS OR SERVICES
AAEOEADA
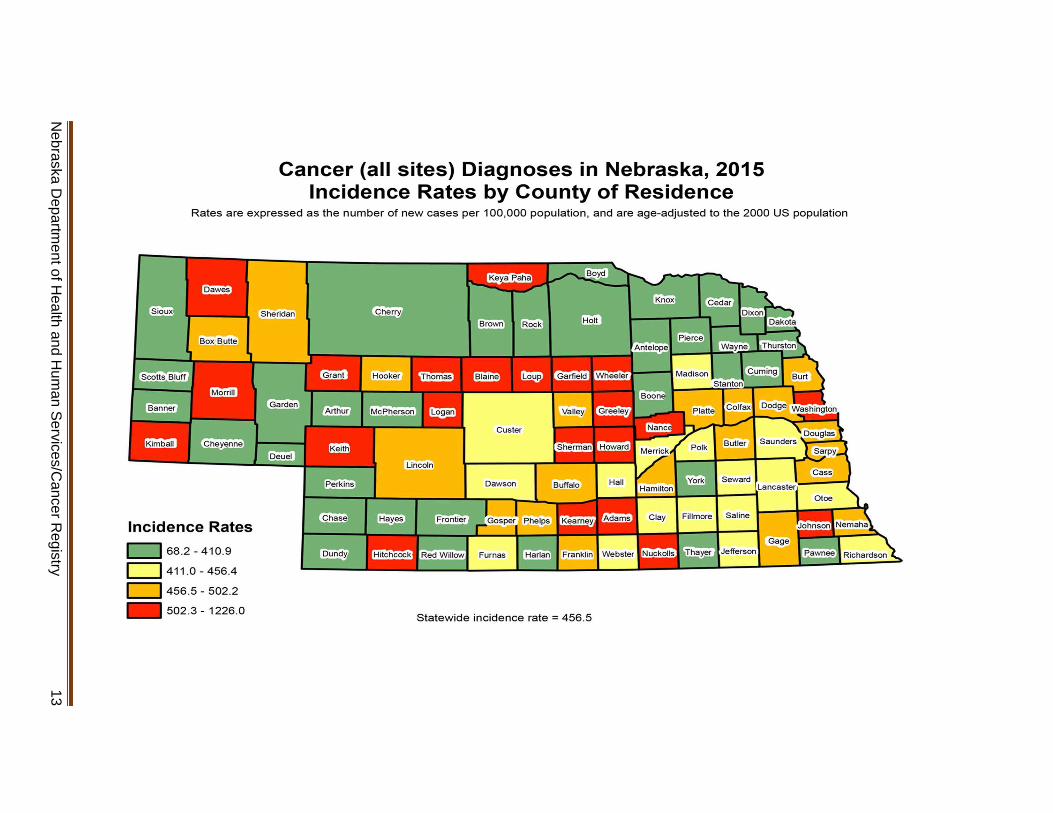

This page intentionally left blank
Nebraska Department of Health and Human ServicesCancer Registry 15
CANCER MORTALITY IN NEBRASKA
In 2015 3490 Nebraska residents died from cancer an increase from the statersquos 2014 tally of 3443 cancer deaths The 2015 count translates into a rate of 1568 cancer deaths per 100000 population Cancer was the second leading cause of mortality among Nebraska residents in 2015 surpassed by heart disease by 76 deaths By primary site cancers of the lung colon and rectum breast and pancreas accounted for just under half (484) of Nebraskarsquos cancer deaths in 2015
Table 4 presents the number and rate of cancer deaths that occurred among Nebraska residents during 2015 and 2011-2015 for all sites combined and for specific sites The most recent US cancer mortality rates which cover the years 2010 through 2014 are also included Comparison of the most recent state and national mortality rates for the past five years shows significant differences (plt01) for cancers of the stomach liver lung and female breast (Nebraska rates lower than the US) and for kidney and invasive brain tumors (Nebraska rates higher than the US) Table 5 presents the number of Nebraska cancer deaths during 2011-2015 by age at death Table 6 presents Nebraska cancer mortality data by race and ethnicity for the years 2006-2015
Maps on pages 21-22 present cancer mortality rates for 2015 and 2011-2015 by place of residence local statistics by place of residence are also found in the appendix to this report (Table 2A [county]mdashpage 3 and Table 14A [local health department]mdashpage 27) The graph below shows annual mortality rates for cancer for Nebraska and the US since 2006
Cancer (All Sites)Mortality Rates Nebraska (2006-2015) amp US (2006-2014)
1000
1200
1400
1600
1800
2000
2200
Ag
e-a
dju
ste
d r
ate
(p
er
10
00
00
po
pu
lati
on
)
2006 2007 2008 2009 2010 2011 2012 2013 2014 2015
Nebraska 1767 1763 1699 1647 1666 1643 1646 1608 1589 1568
US 1820 1793 1763 1734 1717 1687 1663 1631 1613
Nebraska Department of Health and Human ServicesCancer Registry 16
17
Nebraska D
epartment of H
ealth and Hum
an ServicesC
ancer Registry
TABLE 4 Cancer Mortality Number of Deaths and Rates by Selected Primary Site and Gender
Nebraska (2015 and 2011-2015) amp US (2010-2014)
NEBRASKA 2015
NEBRASKA 2011-2015
US 2010-2014
Site Male
No Female
No Total
No Male
No Female
No Total
No Male Rate
Female Rate
Total Rate Rate Rate Rate Rate Rate Rate
All Sites 2005 1415 1661
1835 1873 1655 1349 3490 1568 9134 1941 8124 1365 17258 1606
Oral Cavity amp Pharynx 38 13 25
40 40 19 14 59 27 165 33 81 13 246 22
Esophagus 73 15 41 81 79 19 17 100 45 394 81 85 14 479 44
Stomach 35 36 24 22 59 28 134 28 80 14 214 20 44 23 32 Colon amp Rectum (Colorectal) 184 189 152 120 336 151 858 182 834 136 1692 157 177 124 148 Liver amp Intrahepatic Bile Ducts 62 61 32 26 94 42 341 68 161 28 502 47 92 37 63
Pancreas 126 95 109 108 110 106 86 214 97 591 124 525 88 1116 104
Larynx 19 04 10 20 21 4 03 24 11 97 20 21 04 118 11
Lung amp Bronchus 559 363 447 484 493 422 349 906 410 2461 523 2003 342 4464 420
Melanoma of the Skin 40 17 27 45 45 19 16 64 29 201 42 109 19 310 30
Breast 03 212 118 2 02 231 185 233 103 8 02 1174 199 1182 109
--- --- 23 22 --- --- --- --- 111 21 --- --- --- 23 --- Uterine Cervix
18
TABLE 4 (continued) Cancer Mortality Nebraska D
epartment of H
ealth and Hum
an ServicesC
ancer Registry
Site
Male No Rate
NEBRASKA 2015
Female No Rate
Total No Rate
Male No Rate
NEBRASKA 2011-2015
Female No Rate
Total No Rate
US 2010-2014
Male Female Total Rate Rate Rate
Uterine Corpus amp Unspecified --- --- 49 39 --- --- --- --- 252 43 --- --- --- 46 ---
Ovary --- --- 83 68 --- --- --- --- 389 66 --- --- --- 74 ---
Prostate 158 172 --- --- --- --- 905 202 --- --- --- ---
201 --- ---
Kidney amp Renal Pelvis 68 69 29 24 97 44 324 66 161 27 485 45 56 24 39
Urinary Bladder 65 68 26 19 91 39 307 68 129 20 436 40 76 22 44
Brain amp Other Nervous System 58 56 51 47 109 51 300 63 236 43 536 52 53 35 43 Thyroid 4 04 4 04 8 03 31 06 34 05 65 06 05 05 05 Hodgkin Lymphoma 3 03 5 04 8 04 17 04 15 02 32 03 04 03 03 Non-Hodgkin Lymphoma 76 80 56 44 132 59 340 74 294 47 634 59
76 46 59
Leukemia 82 83 66 49 148 65 432 95 325 52 757 70 91 51 68
Myeloma 43 45 33 26 76 34 212 45 149 24 361 33 42 27 33
Total rates are per 100000 population and are age-adjusted to the 2000 US population Gender-specific rates are per 100000 male or female population and are age-adjusted to the 2000 US population
19
Nebraska D
epartment of H
ealth and Hum
an ServicesC
ancer Registry
TABLE 5 Cancer Mortality Number of Deaths and Percentage Distribution by Selected Primary Site and Age at Death
Nebraska (2011-2015)
Number Number Number Number Number
All Sites 70 04 443 26 4207 244 12538 727 17258 1000 Oral Cavity amp Pharynx 0 00 8 33 80 325 158 642 246 1000 Esophagus 0 00 9 19 153 319 317 662 479 1000 Stomach 0 00 11 51 60 280 143 668 214 1000 Colon amp Rectum (Colorectal) 0 00 47 28 382 226 1263 746 1692 1000 Liver amp Intrahepatic Bile Ducts 1 02 14 28 188 375 299 596 502 1000 Pancreas 0 00 16 14 288 258 812 728 1116 1000 Lung amp Bronchus 0 00 33 07 1106 248 3325 745 4464 1000 Melanoma of the Skin 0 00 17 55 102 329 191 616 310 1000 Female Breast 0 00 58 49 354 302 762 649 1174 1000 Uterine Cervix 0 00 20 180 58 523 33 297 111 1000 Uterine Corpus amp Unspecified 0 00 5 20 68 269 179 710 252 1000 Ovary 0 00 9 23 127 326 253 650 389 1000 Prostate 0 00 1 01 75 83 829 916 905 1000 Kidney amp Renal Pelvis 1 02 8 16 157 324 319 658 485 1000 Urinary Bladder 0 00 1 02 64 147 371 851 436 1000 Brain amp Central Nervous System 27 50 50 93 163 304 296 552 536 1000 Thyroid 0 00 0 00 14 215 51 785 65 1000 Hodgkin Lymphoma 0 00 3 94 14 438 15 469 32 1000 Non-Hodgkin Lymphoma 5 08 24 38 108 170 497 784 634 1000 Leukemia 13 17 30 40 126 166 588 777 757 1000 Myeloma 0 00 2 06 64 177 295 817 361 1000
0-17 Yrs 18-44 Yrs 45-64 Yrs 65+ Yrs TOTAL
NOTE Due to rounding percentages may not sum to 1000
20
Nebraska D
epartment of H
ealth and Hum
an ServicesC
ancer Registry
TABLE 6 Cancer Mortality Number of Deaths and Rates All Sites and Top Ten Primary Sites by Race and Ethnicity
Nebraska (2006-2015)
White African-American Native American AsianPacific Islander Hispanic Site Number Rate Site Number Rate Site Number Rate Site Number Rate Site Number Rate
All Sites 32687 1500 All Sites 1135 1945 All Sites 164 1492 All Sites 214 1000 All Sites 553 954
Rank
1 Lung amp Bronchus 8573 399
Lung amp Bronchus 313 543
Lung amp Bronchus 49 517
Lung amp Bronchus 46 211
Lung amp Bronchus 92 177
2 Colon amp Rectum
3323
151 Colon amp
Rectum 132 249 Colon amp Rectum 21 149
Liver amp Intrahepatic Bile Ducts
32 129 Colon amp Rectum 44 75
3 Female Breast
2174
181 Female
Breast 85 251 Female Breast 13 123
Colon amp Rectum 20 94
Female Breast 43 127
4 Pancreas 2096 96 Pancreas 75 128
Kidney amp Renal Pelvis 7 143
Pancreas
13 66
Liver amp Intrahepatic Bile Ducts
37 69
5 Prostate 1757 195 Prostate 66 342 Leukemia 6 44 Female Breast
11 84 Leukemia 31 42
Liver amp Intrahepatic Bile Ducts
Nonshy6 Leukemia 1402 64 52 72 Stomach 6 41 Hodgkin 10 46 Stomach 30 45
Lymphoma Nonshy
7 Hodgkin 1291 58 Myeloma 42 74 Pancreas 6 41 Leukemia 8 35 Prostate 29 177 Lymphoma
8 Brain amp CNS
974
47 Esophagus 33 52
Liver amp Intrahepatic Bile Ducts
6 38 Stomach 8 25 Kidney amp
Renal Pelvis
26 40
Nonshy
9 Esophagus 881 40 Urinary
Bladder 25 49 Prostate 5 86 Oral Cavity amp Pharynx 7 24
Hodgkin Lymphoma 24 49
10 Kidney amp
Renal Pelvis
871
40 Leukemia 25 37 Oral Cavity
amp Pharynx 4 67 Ovary 6 49 Brain amp CNS 24 29
Rates are per 100000 population excluding gender-specific sites (prostate female breast ovary) which are per 100000 male or female population All rates are age-adjusted to the 2000 US population Abbreviation CNS central nervous system
Cancer (all sites) Deaths in Nebraska 2015 Mortality Rates by County of Residence
Rates are expressed as the number of deaths per 100000 population and are age-adjusted to the 2000 US population
Dawes
Sioux
Box Butte
Scotts Bluff
Morrill
Banner
Kimball Cheyenne
Mortality Rates
CJ No deaths
l=i 01 - 1254
LJ 1255 - 1567
LJ 1568 - 1882
1883 - 431 8
Sheridan Holt
Antel~
Garfield Wheeler
Boone
Statewide mortality rate = 1568
Nebraska D
epartment of H
ealth and Hum
an ServicesC
ancer Registry
21
Cancer (all sites) Deaths in Nebraska 2011-2015 Mortality Rates by County of Residence
Rates are expressed as the average annual number of deaths per 100000 population and are age-adjusted to the 2000 US population
Dawes
Box Butte
Scotts Bluff
Morrill
Kimball Cheyenne
Mortality Rates
cJ 25 6 - 1285
CJ 1286 - 1605
CJ 1606 - 1927
1928 - 2414
Sheridan Cherry
Valley
Custer
Sherman Howard
Dawson Buffalo
Hitchcock Red Willow Furnas Harlan
Statewide mortality rate = 1606
Nebraska D
epartment of H
ealth and Hum
an ServicesC
ancer Registry
22
INCIDENCE AND MORTALITY FOR SELECTED PRIMARY SITES
Lung and Bronchus
Although lung cancer was only the second most frequently diagnosed cancer among Nebraska residents in 2015 it was the yearrsquos leading cause of cancer mortality accounting for 26 of the statersquos cancer deaths During the past five years (2011-2015) lung cancer has averaged over 1200 diagnoses and almost 900 deaths in Nebraska per year Although lung cancer is more likely to strike men than women the lung cancer death rate for Nebraska men has fallen by over 40 since 1990 while remaining almost unchanged for Nebraska women Due to the small number of cases that are detected at an early stage of the disease the 5-year relative survival rate for people diagnosed with lung cancer is less than 20
Cigarette smoking is the major risk factor for lung cancer and causes about 80 of lung cancer deaths People who smoke cigarettes are 15 to 30 times more likely to die from lung cancer than non-smokers Quitting smoking at any age reduces the risk of lung cancer although the risk for smokers is higher than the risk for a lifelong non-smoker The US Preventive Services Task Force (USPSTF) and ACS have both endorsed screening for lung cancer using low-dose computed tomography (LDCT) but only for people 55-74 years of age (the USPSTF recommendation includes people 55-80) who currently smoke or who have quit within the past 15 years are in good health and have at least a 30 pack-year smoking history
Maps on pages 45-46 present lung amp bronchus cancer incidence and mortality rates by place of residence local statistics by place of residence are also found in the appendix to this report (Table 3A [county]mdashpage 5 and Tables 13A and 14A [ local health department region]mdashpages 25-27)
Lung and Bronchus CancerIncidence Rates Nebraska (2006-2015) amp US (2006-2014)
30
40
50
60
70
80
90
Ag
e-a
dju
ste
d r
ate
(p
er
10
00
00
po
pu
lati
on
)
2006 2007 2008 2009 2010 2011 2012 2013 2014 2015
Nebraska 638 673 626 581 608 577 606 621 569 571
US 688 679 673 661 639 625 615 602 583
Nebraska Department of Health and Human ServicesCancer Registry 23
Lung and Bronchus CancerMortality Rates Nebraska (2006-2015) amp US (2006-2014)shy
200
300
400
500
600
700
800 A
ge
-ad
just
ed
ra
te (
pe
r 1
00
00
0 p
op
ula
tio
n)
2006 2007 2008 2009 2010 2011 2012 2013 2014 2015
Nebraska 475 486 451 442 459 425 433 428 414 410
US 517 507 496 484 474 460 449 434 422
Lung and Bronchus CancerPercentage of Cases by Stage of Disease at Diagnosisshy
Nebraska 2011-2015shy
Local
20
Regional
23
Distant
50
Unstaged
7
Nebraska Department of Health and Human ServicesCancer Registry 24
Breast (Female only)
Breast cancer is the most common type of cancer among women and the second most frequent cause of female cancer deaths Between 2011 and 2015 6714 Nebraska women were diagnosed with invasive breast cancer (and another 1427 were diagnosed with in situ breast cancer) and 1174 women died from breast cancer Since 1990 the rate of breast cancer deaths in Nebraska and the US has declined significantly Recent declines in the rate of breast cancer diagnoses have been attributed to the decreasing use of post-menopausal hormone replacement therapy early detection through screening and increased awareness
Age is an important risk factor for breast cancer with 80 of all cases occurring among women age 50 and older Other risk factors include genetic mutations a personal or family history of breast cancer some forms of benign breast disease early menstruation late menopause never having children or having a first child after age 30 and for post-menopausal women obesity and long-term hormone replacement therapy
Screening for breast cancer is known to save lives although opinion varies on how and when to screen USPSTF guidelines recommend mammography for women 50-74 on an every-other-year schedule However ACS guidelines recommend that women 40-44 have the choice for annual mammography women 45-54 have annual mammography and women 55 and older have the choice to continue annual mammography or to have it on an every-other-year schedule continuing as long as their overall health is good and life expectancy is 10 or more years For some women who have an increased risk of breast cancer the ACS recommends annual magnetic resonance imaging (MRI) in addition to mammography usually starting at age 30
Maps on pages 47-48 present female breast cancer incidence and mortality rates by place of residence local statistics by place of residence are also found in the appendix to this report (Table 4A [county]mdashpage 7 and Table 13A and 14A [local health department]mdashpages 25-27)
Female Breast CancerIncidence Rates Nebraska (2006-2015) amp US (2006-2014)
900
1000
1100
1200
1300
1400
1500
Ag
e-a
dju
ste
d r
ate
(p
er
10
00
00
fe
ma
le p
op
ula
tio
n)
2006 2007 2008 2009 2010 2011 2012 2013 2014 2015
Nebraska 1301 1174 1301 1224 1182 1267 1190 1210 1240 1278
US 1218 1233 1245 1255 1215 1239 1235 1247 1239
Nebraska Department of Health and Human ServicesCancer Registry 25
Female Breast CancerMortality Rates Nebraska (2006-2015) amp US (2006-2014)
100
150
200
250
300
350
400 A
ge
-ad
just
ed
ra
te (
pe
r 1
00
00
0 f
em
ale
po
pu
lati
on
)
2006 2007 2008 2009 2010 2011 2012 2013 2014 2015
Nebraska 199 215 207 194 192 181 212 208 213 185
US 236 230 226 222 219 215 213 207 205
Female Breast CancerPercentage of Cases by Stage of Disease at Diagnosisshy
Nebraska 2011-2015shy
Local
52 Regional
24
Distant
4
Unstaged
2
In situ
18
Nebraska Department of Health and Human ServicesCancer Registry 26
Colon and Rectum (Colorectal)
In 2015 colorectal cancer was the fourth most frequently diagnosed cancer among Nebraska residents accounting for 920 new cases It was also the second leading cause of cancer mortality in the state accounting for 336 deaths
The risk of developing colorectal cancer increases with age More than half (616) of all colorectal cancer cases that occurred in Nebraska during 2011-2015 were 65 or older at diagnosis Other risk factors include a personal or family history of colorectal cancer or polyps a personal history of chronic inflammatory bowel disease and certain hereditary colorectal cancer syndromes Modifiable risk factors include physical inactivity obesity smoking a high-fat diet (especially fat from animal sources) and heavy alcohol use
Screening for asymptomatic polyps and tumors is known to prevent colorectal cancer cases and deaths and there are a number of recommended test options Among them include several types of stool tests flexible sigmoidoscopy colonoscopy CT colonography (virtual colonoscopy) and double-contrast barium enema Recommended frequency varies by type of test For people of average risk without symptoms the USPSTF recommends screening for those 50-75 years of age while the ACS recommends screening for anyone 45 and older However the USPSTF also recommends that people at increased risk (ie a personal or family history of colorectal cancer or polyps a personal history of chronic inflammatory bowel disease or a family history of hereditary colorectal cancer syndromes) may be advised to begin screening before age 50 andor be screened more often
Maps on pages 49-50 present incidence and mortality rates for cancers of the colon amp rectum by place of residence local statistics by place of residence are also found in the appendix to this report (Table 5A [county]mdashpage 9 and Table 13A and 14A [local health department]mdashpages 25-27)
Colon and Rectum (Colorectal) Cancer Incidence Rates Nebraska (2006-2015) amp US (2006-2014)
200
300
400
500
600
700
800
Ag
e-a
dju
ste
d r
ate
(p
er
10
00
00
po
pu
lati
on
)
2006 2007 2008 2009 2010 2011 2012 2013 2014 2015
Nebraska 560 559 529 474 462 450 439 412 422 428
US 482 470 458 436 416 407 395 388 384
Nebraska Department of Health and Human ServicesCancer Registry 27
Colon and Rectum (Colorectal) CancerMortality Rates Nebraska (2006-2015) amp US (2006-2014)
00
50
100
150
200
250
300 A
ge
-ad
just
ed
ra
te (
pe
r 1
00
00
0 p
op
ula
tio
n)
2006 2007 2008 2009 2010 2011 2012 2013 2014 2015
Nebraska 193 185 184 163 171 171 159 150 156 151
US 173 169 165 158 155 151 147 145 141
Colon and Rectum (Colorectal) CancerPercentage of Cases by Stage of Disease at Diagnosisshy
Nebraska 2011-2015shy
Local
38
Regional
34
Distant
18
Unstaged
7
In situ
3
Nebraska Department of Health and Human ServicesCancer Registry 28
Prostate
With 1185 diagnoses in 2015 prostate cancer was the most common cancer among Nebraska men accounting for over 24 of all new cancers During the past five years (2011-2015) it has also been the second leading cause of cancer deaths among Nebraska men accounting for 905 deaths Since the mid-1990s prostate cancer death rates have declined substantially both in Nebraska and throughout the United States
Little is known about what causes prostate cancer Risk increases with age (about 59 of Nebraska men diagnosed with prostate cancer during 2011-2015 were 65 or older) and is significantly greater among African-Americans During the past decade (2006-2015) the incidence of prostate cancer among African-American men in Nebraska has been 37 higher than among whites Men with a close relative (father brother or son) who have had prostate cancer especially at a young age are also at increased risk
Current ACS guidelines recommend that men make an informed decision with their health care provider about whether to be screened for prostate cancer This discussion should begin at age 50 for men who are at average risk of prostate cancer and have a life expectancy of at least 10 years This discussion should begin at age 45 for men at high risk (African-Americans and men with a father brother or son diagnosed with prostate cancer before age 65) and at age 40 for men of even higher risk (men with several first-degree relatives diagnosed before age 65) For men who choose to be screened the ACS recommends the prostate-specific antigen (PSA) test with or without a digital rectal exam By contrast the USPSTF does not recommend screening for prostate cancer
Maps on pages 51-52 present incidence and mortality rates for prostate cancer by place of residence local statistics by place of residence are also found in the appendix to this report (Table 6A [county]mdashpage 11 and Table 13A and 14A [local health department]mdash pages 25-27)
Prostate CancerIncidence Rates Nebraska (2006-2015) amp US (2006-2014)
0
50
100
150
200
250
Ag
e-a
dju
ste
d r
ate
(p
er
10
00
00
ma
le p
op
ula
tio
n)
2006 2007 2008 2009 2010 2011 2012 2013 2014 2015
Nebraska 1615 1713 1499 1278 1401 1320 1133 1104 1043 1095
US 1598 1643 1516 1434 1344 1337 1097 1041 955
Nebraska Department of Health and Human ServicesCancer Registry 29
Prostate CancerMortality Rates Nebraska (2006-2015) amp US (2006-2014)
100
150
200
250
300
350
400 A
ge
-ad
just
ed
ra
te (
pe
r 1
00
00
0 m
ale
po
pu
lati
on
)
2006 2007 2008 2009 2010 2011 2012 2013 2014 2015
Nebraska 235 248 236 230 200 221 214 217 191 172
US 242 242 230 221 218 208 196 193 191
Prostate CancerPercentage of Cases by Stage of Disease at Diagnosisshy
Nebraska 2011-2015shy
Local
72 Regional
14
Distant
6
Unstaged
8
Nebraska Department of Health and Human ServicesCancer Registry 30
Urinary Bladder
Between 2011 and 2015 2232 Nebraska residents were diagnosed with bladder cancer Bladder cancer occurs much more frequently among men than women (by about a 3-to-1 ratio) and it now ranks as the fourth most common site of cancer diagnoses among Nebraska men However deaths from bladder cancer occur far less often (436 Nebraska residents died from it during 2011-2015) which is the result of a high percentage of early-stage diagnoses and the existence of effective treatments Survival prospects have improved considerably in recent decades to the point where the most current national data show that the five-year relative survival rate for all bladder cancer patients is about 77
Cigarette smoking is the most important known risk factor for bladder cancer Smokers develop bladder cancer three times more often than non-smokers and about half of all cases are attributable to smoking Risk factors also include occupational exposures to certain chemicals used to make dyes (benzidine and beta-naphthylamine) as well as working in the manufacture of rubber and leather Like most cancers the risk of bladder cancer increases with age 76 of the cases that occurred in Nebraska during 2011-2015 were at least 65 years old when diagnosed
Maps on pages 53-54 present incidence and mortality rates for urinary bladder cancer by place of residence local statistics by place of residence are also found in the appendix to this report (Table 7A [county]mdashpage 13 and Table 13A and 14A [local health department]mdashpages 25-27)
Urinary Bladder CancerIncidence Rates Nebraska (2006-2015) amp US (2006-2014)
00
50
100
150
200
250
300
Ag
e-a
dju
ste
d r
ate
(p
er
10
00
00
po
pu
lati
on
)
2006 2007 2008 2009 2010 2011 2012 2013 2014 2015
Nebraska 203 224 203 198 216 223 209 203 195 210
US 213 215 215 213 209 208 207 203 198
Nebraska Department of Health and Human ServicesCancer Registry 31
Urinary Bladder CancerMortality Rates Nebraska (2006-2015) amp US (2006-2014)shy
00
10
20
30
40
50
60 A
ge
-ad
just
ed
ra
te (
pe
r 1
00
00
0 p
op
ula
tio
n)
2006 2007 2008 2009 2010 2011 2012 2013 2014 2015
Nebraska 43 42 40 35 43 45 40 38 37 39
US 44 44 44 44 44 44 44 44 43
Urinary Bladder CancerPercentage of Cases by Stage of Disease at Diagnosisshy
Nebraska 2011-2015shy
Local
34
Regional
7
Distant
3
Unstaged
5
In Situ
51
Nebraska Department of Health and Human ServicesCancer Registry 32
Non-Hodgkin Lymphoma
Lymphomas are cancers that affect the white blood cells of the immune system and are usually classified as either Hodgkin or Non-Hodgkin lymphoma Non-Hodgkin lymphoma is by far the more common disorder of the two accounting for 2120 diagnoses and 634 deaths among Nebraska residents between 2011 and 2015 (for Hodgkin lymphoma the comparable figures are 294 diagnoses and 32 deaths) National statistics indicate that the incidence rate for Non-Hodgkin lymphoma has increased by about 80 since the midshy1970s and some of this increase is related to the appearance of AIDS However both state and national data show that Non-Hodgkin lymphoma deaths have been increasing since at least 1950 which indicates that factors other than AIDS are also responsible
The causes of Non-Hodgkin lymphoma are unknown although there is evidence that viral exposures and reduced immune function are associated with the disease People whose immune systems have been suppressed by drugs particularly those who have received an organ transplant are at high risk of Non-Hodgkin lymphoma and it also occurs more frequently among people with congenital and acquired immunologic disorders including AIDS The increased incidence of the disease among people with congenital disorders of the immune system suggests that hereditary factors may increase risk Some studies have found that occupational exposure to certain herbicides is a risk factor as well
Maps on pages 55-56 present incidence and mortality rates for Non-Hodgkin lymphoma by place of residence local statistics by place of residence are also found in the appendix to this report (Table 8A [county]mdashpage 15 and Table 13A and 14A [local health department]mdashpages 25-27)
Non-Hodgkin LymphomaIncidence Rates Nebraska (2006-2015) amp US (2006-2014)
00
50
100
150
200
250
300
Ag
e-a
dju
ste
d r
ate
(p
er
10
00
00
po
pu
lati
on
)
2006 2007 2008 2009 2010 2011 2012 2013 2014 2015
Nebraska 211 214 198 212 209 219 195 215 186 198
US 197 197 197 198 196 191 189 188 185
Nebraska Department of Health and Human ServicesCancer Registry 33
Non-Hodgkin LymphomaMortality Rates Nebraska (2006-2015) amp US (2006-2014)shy
00
20
40
60
80
100
120 A
ge
-ad
just
ed
ra
te (
pe
r 1
00
00
0 p
op
ula
tio
n)
2006 2007 2008 2009 2010 2011 2012 2013 2014 2015
Nebraska 73 76 64 62 69 66 54 59 56 59
US 67 66 64 63 61 60 59 57 57
Non-Hodgkin LymphomaPercentage of Cases by Stage of Disease at Diagnosisshy
Nebraska 2011-2015shy
Local
25
Regional
15
Distant
49
Unstaged
11
Nebraska Department of Health and Human ServicesCancer Registry 34
Leukemia
Between 2011 and 2015 leukemia accounted for 1463 diagnoses and 757 deaths among Nebraska residents Although leukemia is one of the most common types of cancer diagnosed among children and adolescents over half (57) of the leukemia cases that occurred in Nebraska between 2011 and 2015 were 65 years of age or older at diagnosis There are many different types of leukemia acute lymphocytic leukemia is the most frequently diagnosed among children and teens while acute myeloid and chronic lymphocytic are the most common types among adults Survival times vary widely by type overall the relative five-year survival rate for all leukemia patients in the United States is over 60
The major causes of most types of leukemia are unknown Nevertheless several risk factors have been identified and include genetic abnormalities (such as Down syndrome) exposure to ionizing radiation and workplace exposure to benzene and other related solvents Adult T-cell acute lymphocytic leukemia is strongly associated with infection by a retrovirus the human T-cell lymphomaleukemia virus type I (HTLV-I) Cigarette smoking is a risk factor for acute myeloid leukemia while people who have a family history of chronic lymphocytic leukemia carry an increased risk of the disease themselves
Maps on pages 57-58 present incidence and mortality rates for leukemia by place of residence local statistics by place of residence are also found in the appendix to this report (Table 9A [county]mdashpage 17 and Table 13A and 14A [local health department]mdash pages 25-27)
LeukemiaIncidence Rates Nebraska (2006-2015) amp US (2006-2014)
00
40
80
120
160
200
240
Ag
e-a
dju
ste
d r
ate
(p
er
10
00
00
po
pu
lati
on
)
2006 2007 2008 2009 2010 2011 2012 2013 2014 2015
Nebraska 162 158 141 133 149 141 147 143 145 122
US 134 133 133 134 140 140 139 137 133
Nebraska Department of Health and Human ServicesCancer Registry 35
LeukemiaMortality Rates Nebraska (2006-2015) amp US (2006-2014)
20
40
60
80
100
120 A
ge
-ad
just
ed
ra
te (
pe
r 1
00
00
0 p
op
ula
tio
n)
00 2006 2007 2008 2009 2010 2011 2012 2013 2014 2015
Nebraska 74 68 79 62 63 70 81 65 71 65
US 72 71 71 71 69 69 68 68 66
Leukemia Number of Cases by Histologic Type Nebraska 2011-2015
Nebraska Department of Health and Human ServicesCancer Registry 36
Acute lymphocytic
Chronic lymphocytic
Other lymphocytic
Acute myeloid
Acute monocytic
Chronic myeloid
Other myeloidmonocytic
Other acute leukemia
Aleukemic subleukemic amp NOS 29
24
26
192
34
468
39
502
149
0 100 200 300 400 500
Abbreviation NOS not otherwise specified
600
Kidney and Renal Pelvis
Cancers of the kidney and renal pelvis accounted for 1774 diagnoses in Nebraska between 2011 and 2015 and also accounted for 485 deaths in Nebraska during the same years State and national trends since 1990 show a significant increase in the rate of diagnosis of these cancers but little change in the mortality rate The chances of survival for people with kidney cancer are relatively high with the most current national statistics showing that the five-year relative survival rate for cancers of the kidney and renal pelvis is now over 70
Preventable risk factors for cancer of the kidney include cigarette smoking and obesity Current estimates indicate that cigarette smoking is responsible for about 20 percent of all kidney cancer deaths Kidney cancer is more likely to strike at younger ages than most other types in Nebraska almost half (496) of all cases that were diagnosed during 2011-2015 were under the age of 65 Other non-preventable risk factors for cancer of the kidney include a family history of kidney cancer and high blood pressure However since people with high blood pressure are often treated with drugs it is unclear whether their increased risk is related to their high blood pressure or the drugs Nevertheless people who need drugs to lower their blood pressure should take them
Maps on pages 59-60 present incidence and mortality rates for cancers of the kidney amp renal pelvis by place of residence local statistics by place of residence are also found in the appendix to this report (Table 10A [county]mdashpage 19 and Table 13A and 14A [local health department]mdashpages 25-27)
Kidney and Renal Pelvis Cancer Incidence Rates Nebraska (2006-2015) amp US (2006-2014)
00
40
80
120
160
200
240
Ag
e-a
dju
ste
d r
ate
(p
er
10
00
00
po
pu
lati
on
)
2006 2007 2008 2009 2010 2011 2012 2013 2014 2015
Nebraska 162 165 188 177 183 157 155 166 173 188
US 157 160 163 163 159 160 162 162 162
Nebraska Department of Health and Human ServicesCancer Registry 37
Kidney and Renal Pelvis CancerMortality Rates Nebraska (2006-2015) amp US (2006-2014)shy
00
10
20
30
40
50
60
Ag
e-a
dju
ste
d r
ate
(p
er
10
00
00
po
pu
lati
on
)
2006 2007 2008 2009 2010 2011 2012 2013 2014 2015
Nebraska 45 40 38 48 42 51 41 41 46 44
US 40 40 40 39 39 39 38 39 38
Kidney and Renal Pelvis CancerPercentage of Cases by Stage of Disease at Diagnosisshy
Nebraska 2011-2015shy
Local
61
Regional
16
Distant
16
Unstaged
5
In Situ
2
Nebraska Department of Health and Human ServicesCancer Registry 38
Melanoma of the Skin
There are several different types of skin cancer but melanomas are the most serious Nationally melanomas comprise about 1 of all skin cancer diagnoses but the vast majority of all skin cancer deaths In Nebraska melanomas of the skin accounted for 2235 diagnoses and 310 deaths between 2011 and 2015 The incidence of melanoma continues to increase significantly in Nebraska and throughout the United States Because most melanomas are discovered early in their development and can be surgically removed the relative five-year survival rate is now over 90
Melanoma is related to exposure to ultraviolet radiation (most of which comes from the sun) particularly exposures during childhood that resulted in severe sunburns The risk of developing melanoma is particularly high among people with light skin Sun exposure is not the only risk factor Family history of melanoma and the presence of numerous dysplastic nevi (large moles with irregular coloration and shape) also increase a personrsquos risk of the disease
Skin melanomas are among the most preventable and treatable of all cancers Wearing protective clothing and using sunscreen are the best methods for preventing the disease and children in particular should have such protection In addition early detection can greatly reduce the risk of melanoma mortality Recognition of changes in skin growths or the appearance of new growths is the best way to find melanomas early in their development The ACS suggests that adults practice skin self-examination on a monthly basis and that suspicious lesions should be evaluated promptly by a physician
Maps on pages 61-62 present incidence and mortality rates for melanoma of the skin by place of residence local statistics by place of residence are also found in the appendix to this report (Table 11A [county]mdashpage 21 and Table 13A and 14A [local health department]mdashpages 25-27)
Melanoma of the SkinIncidence Rates Nebraska (2006-2015) amp US (2006-2014)
00
50
100
150
200
250
300
Ag
e-a
dju
ste
d r
ate
(p
er
10
00
00
po
pu
lati
on
)
2006 2007 2008 2009 2010 2011 2012 2013 2014 2015
Nebraska 176 179 183 192 183 197 178 236 235 256
US 191 195 199 202 199 205 205 210 214
Nebraska Department of Health and Human ServicesCancer Registry 39
Melanoma of the SkinMortality Rates Nebraska (2006-2015) amp US (2006-2014)
00
10
20
30
40
50
60 A
ge
-ad
just
ed
ra
te (
pe
r 1
00
00
0 p
op
ula
tio
n)
2006 2007 2008 2009 2010 2011 2012 2013 2014 2015
Nebraska 30 20 39 32 26 27 34 34 25 29
US 27 27 27 28 27 27 27 27 26
Melanoma of the SkinPercentage of Cases by Stage of Disease at Diagnosisshy
Nebraska 2011-2015shy
Local
44
Regional
5
Distant
3
Unstaged
7
In Situ
41
Nebraska Department of Health and Human ServicesCancer Registry 40
Liver and Intrahepatic Bile Ducts
Often when cancer is found in the liver it did not start there but has spread (metastized) from somewhere else in the body In the United States metastatic liver cancer is more common than liver cancer that originates in the liver (referred to as primary liver cancer) In Nebraska primary cancers of the liver and intrahepatic bile ducts accounted for 604 diagnoses and 502 deaths between 2011 and 2015 Diagnosis does not usually occur until the disease is well advanced due to a lack of symptoms As a result survival is poor the most recent national five-year survival rate is less than 20 Both nationally and in Nebraska the incidence and mortality rates for liver cancer have increased steadily during the past decade
The most common risk factor for liver cancer is chronic viral hepatitis (type B and C) Other preventable risk factors include cirrhosis heavy alcohol use obesity exposure to arsenic and vinyl chloride and using anabolic steroids Type 2 diabetes has also been linked with an increased risk of liver cancer usually in cases where other risk factors such as heavy alcohol use andor chronic viral hepatitis are present Non-preventable risk factors for liver cancer include gender raceethnicity and certain inherited metabolic diseases Nebraska statistics show that diagnoses among men outnumber those among women by a ratio of about 31 while incidence rates are significantly higher among African-Americans Native Americans AsianPacific Islanders and Hispanics compared to whites
Maps on pages 63-64 present incidence and mortality rates for cancers of the liver by place of residence local statistics by place of residence are also found in the appendix to this report (Table 12A [county]mdashpage 23 and Table 13A and 14A [local health department]mdashpages 25-27)
Liver amp Intrahepatic Bile Ducts CancerIncidence Rates Nebraska (2006-2015) amp US (2006-2014)
00
30
60
90
120
150
180
Ag
e-a
dju
ste
d r
ate
(p
er
10
00
00
po
pu
lati
on
)
2006 2007 2008 2009 2010 2011 2012 2013 2014 2015
Nebraska 42 42 55 50 59 57 56 58 46 59
US 63 67 69 73 74 76 79 80 81
Nebraska Department of Health and Human ServicesCancer Registry 41
Liver amp Intrahepatic Bile Ducts CancerMortality Rates Nebraska (2006-2015) amp US (2006-2014)
00
30
60
90
120
150 A
ge
-ad
just
ed
ra
te (
pe
r 1
00
00
0 p
op
ula
tio
n)
2006 2007 2008 2009 2010 2011 2012 2013 2014 2015
Nebraska 43 38 33 45 50 53 46 46 46 42
US 53 54 56 58 59 61 63 65 65
Liver amp Intrahepatic Bile Ducts CancerPercentage of Cases by Stage of Disease at Diagnosisshy
Nebraska 2011-2015shy
Local
44 Regional
27
Distant
15
Unstagedshy14shy
Nebraska Department of Health and Human ServicesCancer Registry 42
This page intentionally left blank
Nebraska Department of Health and Human ServicesCancer Registry 43
INCIDENCE amp MORTALITY RATE MAPS FOR SELECTED PRIMARY SITES
Nebraska Department of Health and Human ServicesCancer Registry 44
Primary Site Contents Page
Lung amp bronchus
Incidence Mortality
45 46
Female breast
Incidence Mortality
47 48
Colon amp rectum (colorectal)
Incidence Mortality
49 50
Prostate
Incidence Mortality
51 52
Urinary bladder
Incidence Mortality
53 54
Non-Hodgkin lymphoma
Incidence Mortality
55 56
Leukemia
Incidence Mortality
57 58
Kidney amp renal pelvis
Incidence Mortality
59 60
Melanoma of the skin
Incidence Mortality
61 62
Liver amp intrahepatic bile ducts
Incidence Mortality
63 64
Lung amp Bronchus Cancer Diagnoses in Nebraska 2011-2015 Incidence Rates by Local Health Department Region
Rates are expressed as the average annual number of new cases per 100000 population and are age-adjusted to the 2000 U S population
Incidence Rates
455 - 488
489 - 558
559 - 633
Statewide incidence rate=590 634 - 699
Nebraska D
epartment of H
ealth and Hum
an ServicesC
ancer Registry
45
Lung amp Bronchus Cancer Deaths in Nebraska 2011-2015 Mortality Rates by Local Health Department Region
Rates are expressed as the average annual number of deaths per 100000 population and age-adjusted to the 2000 U S population
Mortality Rates
305 - 369
370 - 400
433 - 491 Statew ide mortal ity rate=420
Nebraska D
epartment of H
ealth and Hum
an ServicesC
ancer Registry
46
Nebraska D
epartment of H
ealth and Hum
an ServicesC
ancer Registry
47
Nebraska D
epartment of H
ealth and Hum
an ServicesC
ancer Registry
48
Nebraska D
epartment of H
ealth and Hum
an ServicesC
ancer Registry
49
Nebraska D
epartment of H
ealth and Hum
an ServicesC
ancer Registry
50
Nebraska D
epartment of H
ealth and Hum
an ServicesC
ancer Registry
51
Nebraska D
epartment of H
ealth and Hum
an ServicesC
ancer Registry
52
Nebraska D
epartment of H
ealth and Hum
an ServicesC
ancer Registry
53
Nebraska D
epartment of H
ealth and Hum
an ServicesC
ancer Registry
54
Non-Hodgkin Lymphoma Diagnoses in Nebraska 2011-2015 Incidence Rates by Local Health Department Region
Rates are expressed as the average annual number of new cases per 100000 population and are age-adj usted to the 2000 U S population
Incidence Rates
140 - 180
181 - 209
Statewide incidence rate=203 221 - 298
Nebraska D
epartment of H
ealth and Hum
an ServicesC
ancer Registry
55
Nebraska D
epartment of H
ealth and Hum
an ServicesC
ancer Registry
56
Nebraska D
epartment of H
ealth and Hum
an ServicesC
ancer Registry
57
Nebraska D
epartment of H
ealth and Hum
an ServicesC
ancer Registry
58
Nebraska D
epartment of H
ealth and Hum
an ServicesC
ancer Registry
59
Kidney amp Renal Pelvis Cancer Deaths in Nebraska 2011-2015 Mortality Rates by Local Health Department Region
Rates are expressed as the average annual number of deaths per 100000 population and age-adjusted to the 2000 U S population
Mortality Rates
2 4 - 3 8
39 - 42
43 - 55
56 - 69 Statewide mortality rate=45
Nebraska D
epartment of H
ealth and Hum
an ServicesC
ancer Registry
60
Nebraska D
epartment of H
ealth and Hum
an ServicesC
ancer Registry
61
Nebraska D
epartment of H
ealth and Hum
an ServicesC
ancer Registry
62
Nebraska D
epartment of H
ealth and Hum
an ServicesC
ancer Registry
63
Liver amp lntrahepatic Bile Ducts Cancer Deaths in Nebraska 2011-2015 Mortality Rates by Local Health Department Region
Rates are expressed as the average annual number of deaths per 100000 population and age-adjusted to the 2000 U S population
North Central
---1 West Central
Mortality Rates
12 - 36
37-41
5 3 - 9 3 Statewide mortality rate=4 7
Nebraska D
epartment of H
ealth and Hum
an ServicesC
ancer Registry
64
REFERENCES
American Cancer Society American Cancer Society Recommendations for the Early Detection of Breast Cancer 2017 Available at httpswwwcancerorgcancerbreast-cancerscreening-testsshyand-early-detectionamerican-cancer-society-recommendations-for-the-early-detection-of-breastshycancerhtml
American Cancer Society Cancer Facts and Figures 2018 Atlanta GA American Cancer Society 2018 Available at httpswwwcancerorgcontentdamcancer-orgresearchcancer-facts-and-statisticsannualshycancer-facts-and-figures2018cancer-facts-and-figures-2018pdf
American Cancer Society Colorectal Cancer Screening Guidelines 2018 Available at httpswwwcancerorghealth-care-professionalsamerican-cancer-society-prevention-earlyshydetection-guidelinescolorectal-cancer-screening-guidelineshtml
Fritz A Percy C Jack A Shanmugaratnam K Sobin L Parkin DM Whelan S International Classification of Diseases for Oncology 3rd edition (US interim version 2000) Geneva Switzerland World Health Organization 2000
National Cancer Institute SEER Cancer Stat Facts Bethesda MD National Cancer Institute Accessed on February 21 2018 Available at httpsseercancergovstatfacts
United States Cancer Statistics 1999-2014 Incidence CDC WONDER On-line Database US Department of Health and Human Services Centers for Disease Control and Prevention and National Cancer Institute 2016 Available at httpswondercdcgovcancer-v2014HTML
United States Cancer Statistics 1999-2014 Mortality CDC WONDER On-line Database US Department of Health and Human Services Centers for Disease Control and Prevention 2016 Available at httpswondercdcgovcancermort-v2014HTML
United States Department of Health and Human Services The Health Consequences of Smoking A Report of the Surgeon General US Department of Health and Human Services Centers for Disease Control and Prevention National Center for Chronic Disease Prevention and Health Promotion Office on Smoking and Health 2004 Available at httpswwwcdcgovtobaccodata_statisticssgr2004complete_reportindexhtm
US Preventive Services Task Force Final Recommendation Statement Breast Cancer Screening November 2016 Available at httpwwwuspreventiveservicestaskforceorgPageDocumentRecommendationStatementFinalb reast-cancer-screening1
US Preventive Services Task Force Final Recommendation Statement Colorectal Cancer Screening June 2017 Available at httpswwwuspreventiveservicestaskforceorgPageDocumentRecommendationStatementFinal colorectal-cancer-screening2
US Preventive Services Task Force Final Recommendation Statement Lung Cancer Screening December 2016 Available at httpwwwuspreventiveservicestaskforceorgPageDocumentRecommendationStatementFinall ung-cancer-screening
World Health Organization Manual of the International Statistical Classification of Diseases and Related Health Problems 10th revision Geneva Switzerland World Health Organization 1992
Nebraska Department of Health and Human ServicesCancer Registry 65
REPORTING FACILITIES
Ainsworth--Brown County Hospital Albion--Boone County Health Center Alliance--Box Butte General Hospital Alma--Harlan County Health System Atkinson--West Holt Memorial Hospital Inc Auburn--Nemaha County Hospital Aurora--Memorial Hospital Bassett--Rock County Hospital Beatrice--Beatrice Community Hospital amp Health Center Inc Benkelman--Dundy County Hospital Blair--Memorial Community Hospital Bridgeport--Morrill County Community Hospital Broken Bow--Jennie Melham Memorial Medical Ctr Callaway--Callaway District Hospital Cambridge--Tri Valley Health System Central City--Litzenberg Memorial County Hospital Chadron--Chadron Community Hospital amp Health Services Columbus--Columbus Community Hospital Inc Cozad--Cozad Community Hospital Creighton--Creighton Area Health Services Crete--Crete Area Medical Center David City--Butler County Health Care Center Fairbury--Jefferson Community Health Center Inc Falls City--Community Medical Center Inc Franklin--Franklin County Memorial Hospital Fremont--Fremont Area Medical Center Friend--Warren Memorial Hospital Geneva--Fillmore County Hospital Genoa--Genoa Community HospitalLTC Gordon--Gordon Memorial Hospital District Gothenburg--Gothenburg Memorial Hospital Grand Island--CHI Health St Francis Grant--Perkins County Health Services Hastings--Mary Lanning Memorial Hospital Hebron--Thayer County Health Services Henderson--Henderson Health Care Services Holdrege--Phelps Memorial Health Center Imperial--Chase County Community Hospital Kearney--CHI Health Good Samaritan Kearney--CHI Health Good Samaritan Pathology Kimball--Kimball Health Services amp Hospital Lexington--Tri-County Area Hospital District Lincoln--Bryan-LGH Medical Center East amp West Lincoln--CHI Health Saint Elizabeth Lincoln--Pathology Medical Services Lincoln--Williamsburg Radiation Center Lincoln--CHI Health Nebraska Heart Lincoln--UNMC College of Dentistry Lynch--Niobrara Valley Hospital Corp McCook--Community Hospital Minden--Kearney County Health Services Nebraska City--CHI Health St Marys Neligh--Antelope Memorial Hospital
Norfolk--Faith Regional Health Services East amp West North Platte--Great Plains Regional Medical Center North Platte--Pathology Services Oakland--Oakland Memorial Hospital Ogallala--Ogallala Community Hospital Omaha--CHI Health Bergan Mercy Omaha--CHI Health Immanuel Omaha--Childrens Hospital Omaha--VA Nebraska-Western Iowa Health Care System Omaha--Methodist Hospital Pathology Center Omaha--Nebraska Medical Center Omaha--Nebraska Methodist Hospital Omaha--CHI Health Creighton University Med Ctr Omaha--Boys Town National Research Hospital Omaha--CHI Health Lakeside Omaha--CHI Health Bergan Mercy Pathology Omaha--Bishop Clarkson Hospital Pathology Omaha--Creighton Pathology Associates Omaha--Physicians Lab ONeill--Avera St Anthonys Hospital Ord--Valley County Hospital Osceola--Annie Jeffrey Memorial County Health Ctr Oshkosh--Garden County Health Services Osmond--Osmond General Hospital Papillion--CHI Health Midlands Pawnee City--Pawnee County Memorial Hospital Pender--Pender Community Hospital Plainview--CHI Health Plainview Red Cloud--Webster County Community Hospital Schuyler--CHI Health Schuyler Scottsbluff--Regional West Medical Center Scottsbluff--Western Pathology Consultants Seward--Memorial Hospital Sidney--Memorial Health Center St Paul--Howard County Community Hospital Superior--Brodstone Memorial Hospital Syracuse--Community Memorial Hospital Tecumseh--Johnson County Hospital Tilden--Tilden Community Hospital Valentine--Cherry County Hospital Wahoo--Saunders County Health Services Wayne--Providence Medical Center West Point--St Francis Memorial Hospital Winnebago--USPHS Indian Hospital York--York General Hospital
Other States Sioux City IA--Mercy Medical Center
State cancer registries participating in the National Interstate Data Exchange Agreement and the state cancer registries of Illinois Kansas Minnesota Missouri and South Dakota
Nebraska Department of Health and Human ServicesCancer Registry 66
THE NEBRASKA DEPARTMENT OF HEALTH AND HUMAN SERVICES IS COMMITTED TO AFFIRMATIVE ACTION
EQUAL EMPLOYMENT OPPORTUNITIES AND DOES NOT DISCRIMINATE IN DELIVERING BENEFITS OR SERVICES
AAEOEADA
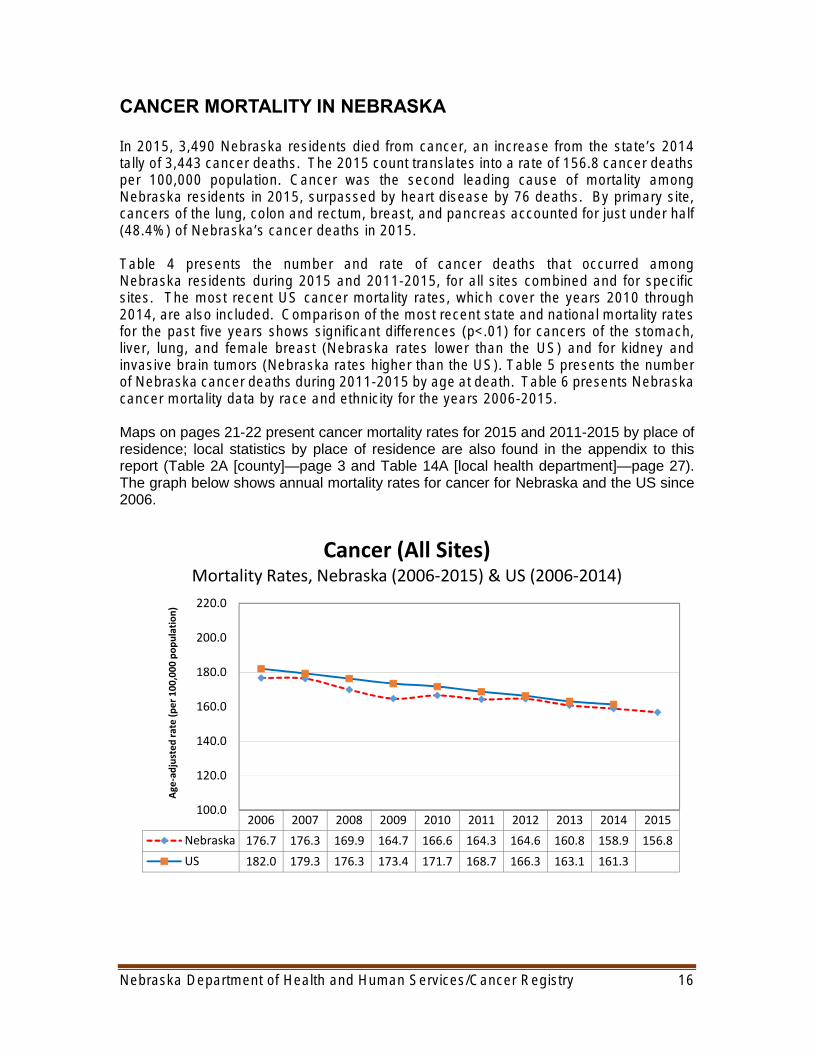
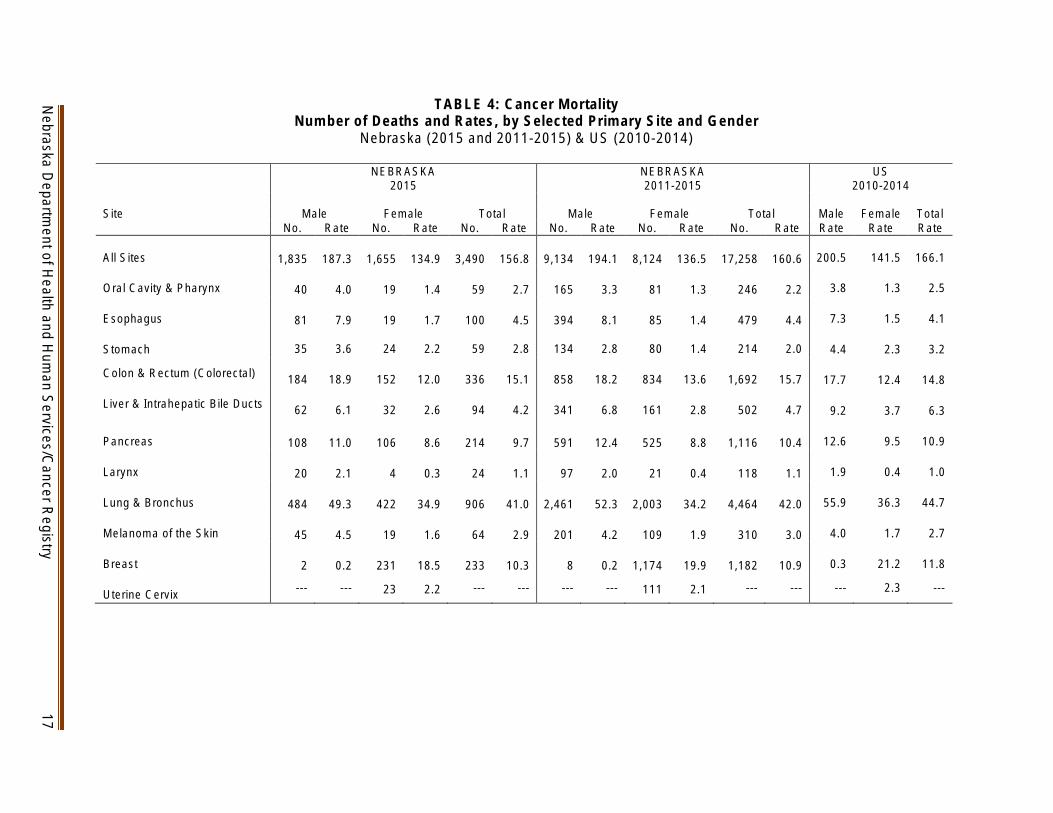
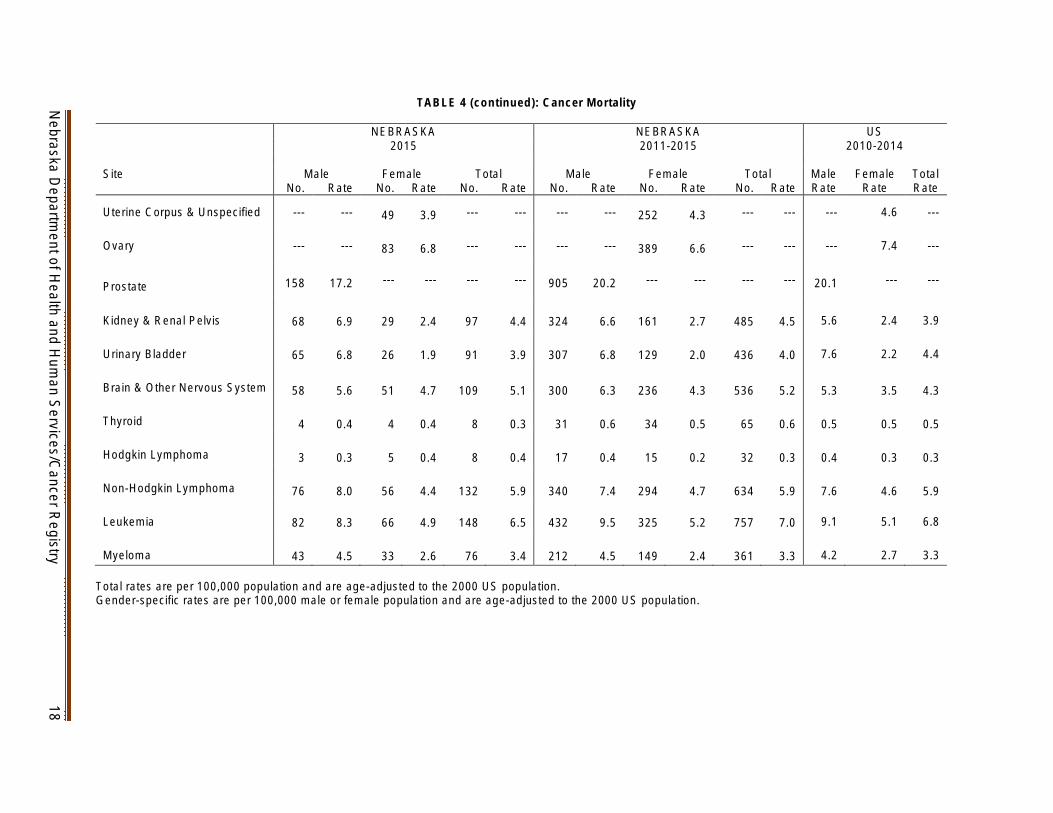
18
TABLE 4 (continued) Cancer Mortality Nebraska D
epartment of H
ealth and Hum
an ServicesC
ancer Registry
Site
Male No Rate
NEBRASKA 2015
Female No Rate
Total No Rate
Male No Rate
NEBRASKA 2011-2015
Female No Rate
Total No Rate
US 2010-2014
Male Female Total Rate Rate Rate
Uterine Corpus amp Unspecified --- --- 49 39 --- --- --- --- 252 43 --- --- --- 46 ---
Ovary --- --- 83 68 --- --- --- --- 389 66 --- --- --- 74 ---
Prostate 158 172 --- --- --- --- 905 202 --- --- --- ---
201 --- ---
Kidney amp Renal Pelvis 68 69 29 24 97 44 324 66 161 27 485 45 56 24 39
Urinary Bladder 65 68 26 19 91 39 307 68 129 20 436 40 76 22 44
Brain amp Other Nervous System 58 56 51 47 109 51 300 63 236 43 536 52 53 35 43 Thyroid 4 04 4 04 8 03 31 06 34 05 65 06 05 05 05 Hodgkin Lymphoma 3 03 5 04 8 04 17 04 15 02 32 03 04 03 03 Non-Hodgkin Lymphoma 76 80 56 44 132 59 340 74 294 47 634 59
76 46 59
Leukemia 82 83 66 49 148 65 432 95 325 52 757 70 91 51 68
Myeloma 43 45 33 26 76 34 212 45 149 24 361 33 42 27 33
Total rates are per 100000 population and are age-adjusted to the 2000 US population Gender-specific rates are per 100000 male or female population and are age-adjusted to the 2000 US population
19
Nebraska D
epartment of H
ealth and Hum
an ServicesC
ancer Registry
TABLE 5 Cancer Mortality Number of Deaths and Percentage Distribution by Selected Primary Site and Age at Death
Nebraska (2011-2015)
Number Number Number Number Number
All Sites 70 04 443 26 4207 244 12538 727 17258 1000 Oral Cavity amp Pharynx 0 00 8 33 80 325 158 642 246 1000 Esophagus 0 00 9 19 153 319 317 662 479 1000 Stomach 0 00 11 51 60 280 143 668 214 1000 Colon amp Rectum (Colorectal) 0 00 47 28 382 226 1263 746 1692 1000 Liver amp Intrahepatic Bile Ducts 1 02 14 28 188 375 299 596 502 1000 Pancreas 0 00 16 14 288 258 812 728 1116 1000 Lung amp Bronchus 0 00 33 07 1106 248 3325 745 4464 1000 Melanoma of the Skin 0 00 17 55 102 329 191 616 310 1000 Female Breast 0 00 58 49 354 302 762 649 1174 1000 Uterine Cervix 0 00 20 180 58 523 33 297 111 1000 Uterine Corpus amp Unspecified 0 00 5 20 68 269 179 710 252 1000 Ovary 0 00 9 23 127 326 253 650 389 1000 Prostate 0 00 1 01 75 83 829 916 905 1000 Kidney amp Renal Pelvis 1 02 8 16 157 324 319 658 485 1000 Urinary Bladder 0 00 1 02 64 147 371 851 436 1000 Brain amp Central Nervous System 27 50 50 93 163 304 296 552 536 1000 Thyroid 0 00 0 00 14 215 51 785 65 1000 Hodgkin Lymphoma 0 00 3 94 14 438 15 469 32 1000 Non-Hodgkin Lymphoma 5 08 24 38 108 170 497 784 634 1000 Leukemia 13 17 30 40 126 166 588 777 757 1000 Myeloma 0 00 2 06 64 177 295 817 361 1000
0-17 Yrs 18-44 Yrs 45-64 Yrs 65+ Yrs TOTAL
NOTE Due to rounding percentages may not sum to 1000
20
Nebraska D
epartment of H
ealth and Hum
an ServicesC
ancer Registry
TABLE 6 Cancer Mortality Number of Deaths and Rates All Sites and Top Ten Primary Sites by Race and Ethnicity
Nebraska (2006-2015)
White African-American Native American AsianPacific Islander Hispanic Site Number Rate Site Number Rate Site Number Rate Site Number Rate Site Number Rate
All Sites 32687 1500 All Sites 1135 1945 All Sites 164 1492 All Sites 214 1000 All Sites 553 954
Rank
1 Lung amp Bronchus 8573 399
Lung amp Bronchus 313 543
Lung amp Bronchus 49 517
Lung amp Bronchus 46 211
Lung amp Bronchus 92 177
2 Colon amp Rectum
3323
151 Colon amp
Rectum 132 249 Colon amp Rectum 21 149
Liver amp Intrahepatic Bile Ducts
32 129 Colon amp Rectum 44 75
3 Female Breast
2174
181 Female
Breast 85 251 Female Breast 13 123
Colon amp Rectum 20 94
Female Breast 43 127
4 Pancreas 2096 96 Pancreas 75 128
Kidney amp Renal Pelvis 7 143
Pancreas
13 66
Liver amp Intrahepatic Bile Ducts
37 69
5 Prostate 1757 195 Prostate 66 342 Leukemia 6 44 Female Breast
11 84 Leukemia 31 42
Liver amp Intrahepatic Bile Ducts
Nonshy6 Leukemia 1402 64 52 72 Stomach 6 41 Hodgkin 10 46 Stomach 30 45
Lymphoma Nonshy
7 Hodgkin 1291 58 Myeloma 42 74 Pancreas 6 41 Leukemia 8 35 Prostate 29 177 Lymphoma
8 Brain amp CNS
974
47 Esophagus 33 52
Liver amp Intrahepatic Bile Ducts
6 38 Stomach 8 25 Kidney amp
Renal Pelvis
26 40
Nonshy
9 Esophagus 881 40 Urinary
Bladder 25 49 Prostate 5 86 Oral Cavity amp Pharynx 7 24
Hodgkin Lymphoma 24 49
10 Kidney amp
Renal Pelvis
871
40 Leukemia 25 37 Oral Cavity
amp Pharynx 4 67 Ovary 6 49 Brain amp CNS 24 29
Rates are per 100000 population excluding gender-specific sites (prostate female breast ovary) which are per 100000 male or female population All rates are age-adjusted to the 2000 US population Abbreviation CNS central nervous system
Cancer (all sites) Deaths in Nebraska 2015 Mortality Rates by County of Residence
Rates are expressed as the number of deaths per 100000 population and are age-adjusted to the 2000 US population
Dawes
Sioux
Box Butte
Scotts Bluff
Morrill
Banner
Kimball Cheyenne
Mortality Rates
CJ No deaths
l=i 01 - 1254
LJ 1255 - 1567
LJ 1568 - 1882
1883 - 431 8
Sheridan Holt
Antel~
Garfield Wheeler
Boone
Statewide mortality rate = 1568
Nebraska D
epartment of H
ealth and Hum
an ServicesC
ancer Registry
21
Cancer (all sites) Deaths in Nebraska 2011-2015 Mortality Rates by County of Residence
Rates are expressed as the average annual number of deaths per 100000 population and are age-adjusted to the 2000 US population
Dawes
Box Butte
Scotts Bluff
Morrill
Kimball Cheyenne
Mortality Rates
cJ 25 6 - 1285
CJ 1286 - 1605
CJ 1606 - 1927
1928 - 2414
Sheridan Cherry
Valley
Custer
Sherman Howard
Dawson Buffalo
Hitchcock Red Willow Furnas Harlan
Statewide mortality rate = 1606
Nebraska D
epartment of H
ealth and Hum
an ServicesC
ancer Registry
22
INCIDENCE AND MORTALITY FOR SELECTED PRIMARY SITES
Lung and Bronchus
Although lung cancer was only the second most frequently diagnosed cancer among Nebraska residents in 2015 it was the yearrsquos leading cause of cancer mortality accounting for 26 of the statersquos cancer deaths During the past five years (2011-2015) lung cancer has averaged over 1200 diagnoses and almost 900 deaths in Nebraska per year Although lung cancer is more likely to strike men than women the lung cancer death rate for Nebraska men has fallen by over 40 since 1990 while remaining almost unchanged for Nebraska women Due to the small number of cases that are detected at an early stage of the disease the 5-year relative survival rate for people diagnosed with lung cancer is less than 20
Cigarette smoking is the major risk factor for lung cancer and causes about 80 of lung cancer deaths People who smoke cigarettes are 15 to 30 times more likely to die from lung cancer than non-smokers Quitting smoking at any age reduces the risk of lung cancer although the risk for smokers is higher than the risk for a lifelong non-smoker The US Preventive Services Task Force (USPSTF) and ACS have both endorsed screening for lung cancer using low-dose computed tomography (LDCT) but only for people 55-74 years of age (the USPSTF recommendation includes people 55-80) who currently smoke or who have quit within the past 15 years are in good health and have at least a 30 pack-year smoking history
Maps on pages 45-46 present lung amp bronchus cancer incidence and mortality rates by place of residence local statistics by place of residence are also found in the appendix to this report (Table 3A [county]mdashpage 5 and Tables 13A and 14A [ local health department region]mdashpages 25-27)
Lung and Bronchus CancerIncidence Rates Nebraska (2006-2015) amp US (2006-2014)
30
40
50
60
70
80
90
Ag
e-a
dju
ste
d r
ate
(p
er
10
00
00
po
pu
lati
on
)
2006 2007 2008 2009 2010 2011 2012 2013 2014 2015
Nebraska 638 673 626 581 608 577 606 621 569 571
US 688 679 673 661 639 625 615 602 583
Nebraska Department of Health and Human ServicesCancer Registry 23
Lung and Bronchus CancerMortality Rates Nebraska (2006-2015) amp US (2006-2014)shy
200
300
400
500
600
700
800 A
ge
-ad
just
ed
ra
te (
pe
r 1
00
00
0 p
op
ula
tio
n)
2006 2007 2008 2009 2010 2011 2012 2013 2014 2015
Nebraska 475 486 451 442 459 425 433 428 414 410
US 517 507 496 484 474 460 449 434 422
Lung and Bronchus CancerPercentage of Cases by Stage of Disease at Diagnosisshy
Nebraska 2011-2015shy
Local
20
Regional
23
Distant
50
Unstaged
7
Nebraska Department of Health and Human ServicesCancer Registry 24
Breast (Female only)
Breast cancer is the most common type of cancer among women and the second most frequent cause of female cancer deaths Between 2011 and 2015 6714 Nebraska women were diagnosed with invasive breast cancer (and another 1427 were diagnosed with in situ breast cancer) and 1174 women died from breast cancer Since 1990 the rate of breast cancer deaths in Nebraska and the US has declined significantly Recent declines in the rate of breast cancer diagnoses have been attributed to the decreasing use of post-menopausal hormone replacement therapy early detection through screening and increased awareness
Age is an important risk factor for breast cancer with 80 of all cases occurring among women age 50 and older Other risk factors include genetic mutations a personal or family history of breast cancer some forms of benign breast disease early menstruation late menopause never having children or having a first child after age 30 and for post-menopausal women obesity and long-term hormone replacement therapy
Screening for breast cancer is known to save lives although opinion varies on how and when to screen USPSTF guidelines recommend mammography for women 50-74 on an every-other-year schedule However ACS guidelines recommend that women 40-44 have the choice for annual mammography women 45-54 have annual mammography and women 55 and older have the choice to continue annual mammography or to have it on an every-other-year schedule continuing as long as their overall health is good and life expectancy is 10 or more years For some women who have an increased risk of breast cancer the ACS recommends annual magnetic resonance imaging (MRI) in addition to mammography usually starting at age 30
Maps on pages 47-48 present female breast cancer incidence and mortality rates by place of residence local statistics by place of residence are also found in the appendix to this report (Table 4A [county]mdashpage 7 and Table 13A and 14A [local health department]mdashpages 25-27)
Female Breast CancerIncidence Rates Nebraska (2006-2015) amp US (2006-2014)
900
1000
1100
1200
1300
1400
1500
Ag
e-a
dju
ste
d r
ate
(p
er
10
00
00
fe
ma
le p
op
ula
tio
n)
2006 2007 2008 2009 2010 2011 2012 2013 2014 2015
Nebraska 1301 1174 1301 1224 1182 1267 1190 1210 1240 1278
US 1218 1233 1245 1255 1215 1239 1235 1247 1239
Nebraska Department of Health and Human ServicesCancer Registry 25
Female Breast CancerMortality Rates Nebraska (2006-2015) amp US (2006-2014)
100
150
200
250
300
350
400 A
ge
-ad
just
ed
ra
te (
pe
r 1
00
00
0 f
em
ale
po
pu
lati
on
)
2006 2007 2008 2009 2010 2011 2012 2013 2014 2015
Nebraska 199 215 207 194 192 181 212 208 213 185
US 236 230 226 222 219 215 213 207 205
Female Breast CancerPercentage of Cases by Stage of Disease at Diagnosisshy
Nebraska 2011-2015shy
Local
52 Regional
24
Distant
4
Unstaged
2
In situ
18
Nebraska Department of Health and Human ServicesCancer Registry 26
Colon and Rectum (Colorectal)
In 2015 colorectal cancer was the fourth most frequently diagnosed cancer among Nebraska residents accounting for 920 new cases It was also the second leading cause of cancer mortality in the state accounting for 336 deaths
The risk of developing colorectal cancer increases with age More than half (616) of all colorectal cancer cases that occurred in Nebraska during 2011-2015 were 65 or older at diagnosis Other risk factors include a personal or family history of colorectal cancer or polyps a personal history of chronic inflammatory bowel disease and certain hereditary colorectal cancer syndromes Modifiable risk factors include physical inactivity obesity smoking a high-fat diet (especially fat from animal sources) and heavy alcohol use
Screening for asymptomatic polyps and tumors is known to prevent colorectal cancer cases and deaths and there are a number of recommended test options Among them include several types of stool tests flexible sigmoidoscopy colonoscopy CT colonography (virtual colonoscopy) and double-contrast barium enema Recommended frequency varies by type of test For people of average risk without symptoms the USPSTF recommends screening for those 50-75 years of age while the ACS recommends screening for anyone 45 and older However the USPSTF also recommends that people at increased risk (ie a personal or family history of colorectal cancer or polyps a personal history of chronic inflammatory bowel disease or a family history of hereditary colorectal cancer syndromes) may be advised to begin screening before age 50 andor be screened more often
Maps on pages 49-50 present incidence and mortality rates for cancers of the colon amp rectum by place of residence local statistics by place of residence are also found in the appendix to this report (Table 5A [county]mdashpage 9 and Table 13A and 14A [local health department]mdashpages 25-27)
Colon and Rectum (Colorectal) Cancer Incidence Rates Nebraska (2006-2015) amp US (2006-2014)
200
300
400
500
600
700
800
Ag
e-a
dju
ste
d r
ate
(p
er
10
00
00
po
pu
lati
on
)
2006 2007 2008 2009 2010 2011 2012 2013 2014 2015
Nebraska 560 559 529 474 462 450 439 412 422 428
US 482 470 458 436 416 407 395 388 384
Nebraska Department of Health and Human ServicesCancer Registry 27
Colon and Rectum (Colorectal) CancerMortality Rates Nebraska (2006-2015) amp US (2006-2014)
00
50
100
150
200
250
300 A
ge
-ad
just
ed
ra
te (
pe
r 1
00
00
0 p
op
ula
tio
n)
2006 2007 2008 2009 2010 2011 2012 2013 2014 2015
Nebraska 193 185 184 163 171 171 159 150 156 151
US 173 169 165 158 155 151 147 145 141
Colon and Rectum (Colorectal) CancerPercentage of Cases by Stage of Disease at Diagnosisshy
Nebraska 2011-2015shy
Local
38
Regional
34
Distant
18
Unstaged
7
In situ
3
Nebraska Department of Health and Human ServicesCancer Registry 28
Prostate
With 1185 diagnoses in 2015 prostate cancer was the most common cancer among Nebraska men accounting for over 24 of all new cancers During the past five years (2011-2015) it has also been the second leading cause of cancer deaths among Nebraska men accounting for 905 deaths Since the mid-1990s prostate cancer death rates have declined substantially both in Nebraska and throughout the United States
Little is known about what causes prostate cancer Risk increases with age (about 59 of Nebraska men diagnosed with prostate cancer during 2011-2015 were 65 or older) and is significantly greater among African-Americans During the past decade (2006-2015) the incidence of prostate cancer among African-American men in Nebraska has been 37 higher than among whites Men with a close relative (father brother or son) who have had prostate cancer especially at a young age are also at increased risk
Current ACS guidelines recommend that men make an informed decision with their health care provider about whether to be screened for prostate cancer This discussion should begin at age 50 for men who are at average risk of prostate cancer and have a life expectancy of at least 10 years This discussion should begin at age 45 for men at high risk (African-Americans and men with a father brother or son diagnosed with prostate cancer before age 65) and at age 40 for men of even higher risk (men with several first-degree relatives diagnosed before age 65) For men who choose to be screened the ACS recommends the prostate-specific antigen (PSA) test with or without a digital rectal exam By contrast the USPSTF does not recommend screening for prostate cancer
Maps on pages 51-52 present incidence and mortality rates for prostate cancer by place of residence local statistics by place of residence are also found in the appendix to this report (Table 6A [county]mdashpage 11 and Table 13A and 14A [local health department]mdash pages 25-27)
Prostate CancerIncidence Rates Nebraska (2006-2015) amp US (2006-2014)
0
50
100
150
200
250
Ag
e-a
dju
ste
d r
ate
(p
er
10
00
00
ma
le p
op
ula
tio
n)
2006 2007 2008 2009 2010 2011 2012 2013 2014 2015
Nebraska 1615 1713 1499 1278 1401 1320 1133 1104 1043 1095
US 1598 1643 1516 1434 1344 1337 1097 1041 955
Nebraska Department of Health and Human ServicesCancer Registry 29
Prostate CancerMortality Rates Nebraska (2006-2015) amp US (2006-2014)
100
150
200
250
300
350
400 A
ge
-ad
just
ed
ra
te (
pe
r 1
00
00
0 m
ale
po
pu
lati
on
)
2006 2007 2008 2009 2010 2011 2012 2013 2014 2015
Nebraska 235 248 236 230 200 221 214 217 191 172
US 242 242 230 221 218 208 196 193 191
Prostate CancerPercentage of Cases by Stage of Disease at Diagnosisshy
Nebraska 2011-2015shy
Local
72 Regional
14
Distant
6
Unstaged
8
Nebraska Department of Health and Human ServicesCancer Registry 30
Urinary Bladder
Between 2011 and 2015 2232 Nebraska residents were diagnosed with bladder cancer Bladder cancer occurs much more frequently among men than women (by about a 3-to-1 ratio) and it now ranks as the fourth most common site of cancer diagnoses among Nebraska men However deaths from bladder cancer occur far less often (436 Nebraska residents died from it during 2011-2015) which is the result of a high percentage of early-stage diagnoses and the existence of effective treatments Survival prospects have improved considerably in recent decades to the point where the most current national data show that the five-year relative survival rate for all bladder cancer patients is about 77
Cigarette smoking is the most important known risk factor for bladder cancer Smokers develop bladder cancer three times more often than non-smokers and about half of all cases are attributable to smoking Risk factors also include occupational exposures to certain chemicals used to make dyes (benzidine and beta-naphthylamine) as well as working in the manufacture of rubber and leather Like most cancers the risk of bladder cancer increases with age 76 of the cases that occurred in Nebraska during 2011-2015 were at least 65 years old when diagnosed
Maps on pages 53-54 present incidence and mortality rates for urinary bladder cancer by place of residence local statistics by place of residence are also found in the appendix to this report (Table 7A [county]mdashpage 13 and Table 13A and 14A [local health department]mdashpages 25-27)
Urinary Bladder CancerIncidence Rates Nebraska (2006-2015) amp US (2006-2014)
00
50
100
150
200
250
300
Ag
e-a
dju
ste
d r
ate
(p
er
10
00
00
po
pu
lati
on
)
2006 2007 2008 2009 2010 2011 2012 2013 2014 2015
Nebraska 203 224 203 198 216 223 209 203 195 210
US 213 215 215 213 209 208 207 203 198
Nebraska Department of Health and Human ServicesCancer Registry 31
Urinary Bladder CancerMortality Rates Nebraska (2006-2015) amp US (2006-2014)shy
00
10
20
30
40
50
60 A
ge
-ad
just
ed
ra
te (
pe
r 1
00
00
0 p
op
ula
tio
n)
2006 2007 2008 2009 2010 2011 2012 2013 2014 2015
Nebraska 43 42 40 35 43 45 40 38 37 39
US 44 44 44 44 44 44 44 44 43
Urinary Bladder CancerPercentage of Cases by Stage of Disease at Diagnosisshy
Nebraska 2011-2015shy
Local
34
Regional
7
Distant
3
Unstaged
5
In Situ
51
Nebraska Department of Health and Human ServicesCancer Registry 32
Non-Hodgkin Lymphoma
Lymphomas are cancers that affect the white blood cells of the immune system and are usually classified as either Hodgkin or Non-Hodgkin lymphoma Non-Hodgkin lymphoma is by far the more common disorder of the two accounting for 2120 diagnoses and 634 deaths among Nebraska residents between 2011 and 2015 (for Hodgkin lymphoma the comparable figures are 294 diagnoses and 32 deaths) National statistics indicate that the incidence rate for Non-Hodgkin lymphoma has increased by about 80 since the midshy1970s and some of this increase is related to the appearance of AIDS However both state and national data show that Non-Hodgkin lymphoma deaths have been increasing since at least 1950 which indicates that factors other than AIDS are also responsible
The causes of Non-Hodgkin lymphoma are unknown although there is evidence that viral exposures and reduced immune function are associated with the disease People whose immune systems have been suppressed by drugs particularly those who have received an organ transplant are at high risk of Non-Hodgkin lymphoma and it also occurs more frequently among people with congenital and acquired immunologic disorders including AIDS The increased incidence of the disease among people with congenital disorders of the immune system suggests that hereditary factors may increase risk Some studies have found that occupational exposure to certain herbicides is a risk factor as well
Maps on pages 55-56 present incidence and mortality rates for Non-Hodgkin lymphoma by place of residence local statistics by place of residence are also found in the appendix to this report (Table 8A [county]mdashpage 15 and Table 13A and 14A [local health department]mdashpages 25-27)
Non-Hodgkin LymphomaIncidence Rates Nebraska (2006-2015) amp US (2006-2014)
00
50
100
150
200
250
300
Ag
e-a
dju
ste
d r
ate
(p
er
10
00
00
po
pu
lati
on
)
2006 2007 2008 2009 2010 2011 2012 2013 2014 2015
Nebraska 211 214 198 212 209 219 195 215 186 198
US 197 197 197 198 196 191 189 188 185
Nebraska Department of Health and Human ServicesCancer Registry 33
Non-Hodgkin LymphomaMortality Rates Nebraska (2006-2015) amp US (2006-2014)shy
00
20
40
60
80
100
120 A
ge
-ad
just
ed
ra
te (
pe
r 1
00
00
0 p
op
ula
tio
n)
2006 2007 2008 2009 2010 2011 2012 2013 2014 2015
Nebraska 73 76 64 62 69 66 54 59 56 59
US 67 66 64 63 61 60 59 57 57
Non-Hodgkin LymphomaPercentage of Cases by Stage of Disease at Diagnosisshy
Nebraska 2011-2015shy
Local
25
Regional
15
Distant
49
Unstaged
11
Nebraska Department of Health and Human ServicesCancer Registry 34
Leukemia
Between 2011 and 2015 leukemia accounted for 1463 diagnoses and 757 deaths among Nebraska residents Although leukemia is one of the most common types of cancer diagnosed among children and adolescents over half (57) of the leukemia cases that occurred in Nebraska between 2011 and 2015 were 65 years of age or older at diagnosis There are many different types of leukemia acute lymphocytic leukemia is the most frequently diagnosed among children and teens while acute myeloid and chronic lymphocytic are the most common types among adults Survival times vary widely by type overall the relative five-year survival rate for all leukemia patients in the United States is over 60
The major causes of most types of leukemia are unknown Nevertheless several risk factors have been identified and include genetic abnormalities (such as Down syndrome) exposure to ionizing radiation and workplace exposure to benzene and other related solvents Adult T-cell acute lymphocytic leukemia is strongly associated with infection by a retrovirus the human T-cell lymphomaleukemia virus type I (HTLV-I) Cigarette smoking is a risk factor for acute myeloid leukemia while people who have a family history of chronic lymphocytic leukemia carry an increased risk of the disease themselves
Maps on pages 57-58 present incidence and mortality rates for leukemia by place of residence local statistics by place of residence are also found in the appendix to this report (Table 9A [county]mdashpage 17 and Table 13A and 14A [local health department]mdash pages 25-27)
LeukemiaIncidence Rates Nebraska (2006-2015) amp US (2006-2014)
00
40
80
120
160
200
240
Ag
e-a
dju
ste
d r
ate
(p
er
10
00
00
po
pu
lati
on
)
2006 2007 2008 2009 2010 2011 2012 2013 2014 2015
Nebraska 162 158 141 133 149 141 147 143 145 122
US 134 133 133 134 140 140 139 137 133
Nebraska Department of Health and Human ServicesCancer Registry 35
LeukemiaMortality Rates Nebraska (2006-2015) amp US (2006-2014)
20
40
60
80
100
120 A
ge
-ad
just
ed
ra
te (
pe
r 1
00
00
0 p
op
ula
tio
n)
00 2006 2007 2008 2009 2010 2011 2012 2013 2014 2015
Nebraska 74 68 79 62 63 70 81 65 71 65
US 72 71 71 71 69 69 68 68 66
Leukemia Number of Cases by Histologic Type Nebraska 2011-2015
Nebraska Department of Health and Human ServicesCancer Registry 36
Acute lymphocytic
Chronic lymphocytic
Other lymphocytic
Acute myeloid
Acute monocytic
Chronic myeloid
Other myeloidmonocytic
Other acute leukemia
Aleukemic subleukemic amp NOS 29
24
26
192
34
468
39
502
149
0 100 200 300 400 500
Abbreviation NOS not otherwise specified
600
Kidney and Renal Pelvis
Cancers of the kidney and renal pelvis accounted for 1774 diagnoses in Nebraska between 2011 and 2015 and also accounted for 485 deaths in Nebraska during the same years State and national trends since 1990 show a significant increase in the rate of diagnosis of these cancers but little change in the mortality rate The chances of survival for people with kidney cancer are relatively high with the most current national statistics showing that the five-year relative survival rate for cancers of the kidney and renal pelvis is now over 70
Preventable risk factors for cancer of the kidney include cigarette smoking and obesity Current estimates indicate that cigarette smoking is responsible for about 20 percent of all kidney cancer deaths Kidney cancer is more likely to strike at younger ages than most other types in Nebraska almost half (496) of all cases that were diagnosed during 2011-2015 were under the age of 65 Other non-preventable risk factors for cancer of the kidney include a family history of kidney cancer and high blood pressure However since people with high blood pressure are often treated with drugs it is unclear whether their increased risk is related to their high blood pressure or the drugs Nevertheless people who need drugs to lower their blood pressure should take them
Maps on pages 59-60 present incidence and mortality rates for cancers of the kidney amp renal pelvis by place of residence local statistics by place of residence are also found in the appendix to this report (Table 10A [county]mdashpage 19 and Table 13A and 14A [local health department]mdashpages 25-27)
Kidney and Renal Pelvis Cancer Incidence Rates Nebraska (2006-2015) amp US (2006-2014)
00
40
80
120
160
200
240
Ag
e-a
dju
ste
d r
ate
(p
er
10
00
00
po
pu
lati
on
)
2006 2007 2008 2009 2010 2011 2012 2013 2014 2015
Nebraska 162 165 188 177 183 157 155 166 173 188
US 157 160 163 163 159 160 162 162 162
Nebraska Department of Health and Human ServicesCancer Registry 37
Kidney and Renal Pelvis CancerMortality Rates Nebraska (2006-2015) amp US (2006-2014)shy
00
10
20
30
40
50
60
Ag
e-a
dju
ste
d r
ate
(p
er
10
00
00
po
pu
lati
on
)
2006 2007 2008 2009 2010 2011 2012 2013 2014 2015
Nebraska 45 40 38 48 42 51 41 41 46 44
US 40 40 40 39 39 39 38 39 38
Kidney and Renal Pelvis CancerPercentage of Cases by Stage of Disease at Diagnosisshy
Nebraska 2011-2015shy
Local
61
Regional
16
Distant
16
Unstaged
5
In Situ
2
Nebraska Department of Health and Human ServicesCancer Registry 38
Melanoma of the Skin
There are several different types of skin cancer but melanomas are the most serious Nationally melanomas comprise about 1 of all skin cancer diagnoses but the vast majority of all skin cancer deaths In Nebraska melanomas of the skin accounted for 2235 diagnoses and 310 deaths between 2011 and 2015 The incidence of melanoma continues to increase significantly in Nebraska and throughout the United States Because most melanomas are discovered early in their development and can be surgically removed the relative five-year survival rate is now over 90
Melanoma is related to exposure to ultraviolet radiation (most of which comes from the sun) particularly exposures during childhood that resulted in severe sunburns The risk of developing melanoma is particularly high among people with light skin Sun exposure is not the only risk factor Family history of melanoma and the presence of numerous dysplastic nevi (large moles with irregular coloration and shape) also increase a personrsquos risk of the disease
Skin melanomas are among the most preventable and treatable of all cancers Wearing protective clothing and using sunscreen are the best methods for preventing the disease and children in particular should have such protection In addition early detection can greatly reduce the risk of melanoma mortality Recognition of changes in skin growths or the appearance of new growths is the best way to find melanomas early in their development The ACS suggests that adults practice skin self-examination on a monthly basis and that suspicious lesions should be evaluated promptly by a physician
Maps on pages 61-62 present incidence and mortality rates for melanoma of the skin by place of residence local statistics by place of residence are also found in the appendix to this report (Table 11A [county]mdashpage 21 and Table 13A and 14A [local health department]mdashpages 25-27)
Melanoma of the SkinIncidence Rates Nebraska (2006-2015) amp US (2006-2014)
00
50
100
150
200
250
300
Ag
e-a
dju
ste
d r
ate
(p
er
10
00
00
po
pu
lati
on
)
2006 2007 2008 2009 2010 2011 2012 2013 2014 2015
Nebraska 176 179 183 192 183 197 178 236 235 256
US 191 195 199 202 199 205 205 210 214
Nebraska Department of Health and Human ServicesCancer Registry 39
Melanoma of the SkinMortality Rates Nebraska (2006-2015) amp US (2006-2014)
00
10
20
30
40
50
60 A
ge
-ad
just
ed
ra
te (
pe
r 1
00
00
0 p
op
ula
tio
n)
2006 2007 2008 2009 2010 2011 2012 2013 2014 2015
Nebraska 30 20 39 32 26 27 34 34 25 29
US 27 27 27 28 27 27 27 27 26
Melanoma of the SkinPercentage of Cases by Stage of Disease at Diagnosisshy
Nebraska 2011-2015shy
Local
44
Regional
5
Distant
3
Unstaged
7
In Situ
41
Nebraska Department of Health and Human ServicesCancer Registry 40
Liver and Intrahepatic Bile Ducts
Often when cancer is found in the liver it did not start there but has spread (metastized) from somewhere else in the body In the United States metastatic liver cancer is more common than liver cancer that originates in the liver (referred to as primary liver cancer) In Nebraska primary cancers of the liver and intrahepatic bile ducts accounted for 604 diagnoses and 502 deaths between 2011 and 2015 Diagnosis does not usually occur until the disease is well advanced due to a lack of symptoms As a result survival is poor the most recent national five-year survival rate is less than 20 Both nationally and in Nebraska the incidence and mortality rates for liver cancer have increased steadily during the past decade
The most common risk factor for liver cancer is chronic viral hepatitis (type B and C) Other preventable risk factors include cirrhosis heavy alcohol use obesity exposure to arsenic and vinyl chloride and using anabolic steroids Type 2 diabetes has also been linked with an increased risk of liver cancer usually in cases where other risk factors such as heavy alcohol use andor chronic viral hepatitis are present Non-preventable risk factors for liver cancer include gender raceethnicity and certain inherited metabolic diseases Nebraska statistics show that diagnoses among men outnumber those among women by a ratio of about 31 while incidence rates are significantly higher among African-Americans Native Americans AsianPacific Islanders and Hispanics compared to whites
Maps on pages 63-64 present incidence and mortality rates for cancers of the liver by place of residence local statistics by place of residence are also found in the appendix to this report (Table 12A [county]mdashpage 23 and Table 13A and 14A [local health department]mdashpages 25-27)
Liver amp Intrahepatic Bile Ducts CancerIncidence Rates Nebraska (2006-2015) amp US (2006-2014)
00
30
60
90
120
150
180
Ag
e-a
dju
ste
d r
ate
(p
er
10
00
00
po
pu
lati
on
)
2006 2007 2008 2009 2010 2011 2012 2013 2014 2015
Nebraska 42 42 55 50 59 57 56 58 46 59
US 63 67 69 73 74 76 79 80 81
Nebraska Department of Health and Human ServicesCancer Registry 41
Liver amp Intrahepatic Bile Ducts CancerMortality Rates Nebraska (2006-2015) amp US (2006-2014)
00
30
60
90
120
150 A
ge
-ad
just
ed
ra
te (
pe
r 1
00
00
0 p
op
ula
tio
n)
2006 2007 2008 2009 2010 2011 2012 2013 2014 2015
Nebraska 43 38 33 45 50 53 46 46 46 42
US 53 54 56 58 59 61 63 65 65
Liver amp Intrahepatic Bile Ducts CancerPercentage of Cases by Stage of Disease at Diagnosisshy
Nebraska 2011-2015shy
Local
44 Regional
27
Distant
15
Unstagedshy14shy
Nebraska Department of Health and Human ServicesCancer Registry 42
This page intentionally left blank
Nebraska Department of Health and Human ServicesCancer Registry 43
INCIDENCE amp MORTALITY RATE MAPS FOR SELECTED PRIMARY SITES
Nebraska Department of Health and Human ServicesCancer Registry 44
Primary Site Contents Page
Lung amp bronchus
Incidence Mortality
45 46
Female breast
Incidence Mortality
47 48
Colon amp rectum (colorectal)
Incidence Mortality
49 50
Prostate
Incidence Mortality
51 52
Urinary bladder
Incidence Mortality
53 54
Non-Hodgkin lymphoma
Incidence Mortality
55 56
Leukemia
Incidence Mortality
57 58
Kidney amp renal pelvis
Incidence Mortality
59 60
Melanoma of the skin
Incidence Mortality
61 62
Liver amp intrahepatic bile ducts
Incidence Mortality
63 64
Lung amp Bronchus Cancer Diagnoses in Nebraska 2011-2015 Incidence Rates by Local Health Department Region
Rates are expressed as the average annual number of new cases per 100000 population and are age-adjusted to the 2000 U S population
Incidence Rates
455 - 488
489 - 558
559 - 633
Statewide incidence rate=590 634 - 699
Nebraska D
epartment of H
ealth and Hum
an ServicesC
ancer Registry
45
Lung amp Bronchus Cancer Deaths in Nebraska 2011-2015 Mortality Rates by Local Health Department Region
Rates are expressed as the average annual number of deaths per 100000 population and age-adjusted to the 2000 U S population
Mortality Rates
305 - 369
370 - 400
433 - 491 Statew ide mortal ity rate=420
Nebraska D
epartment of H
ealth and Hum
an ServicesC
ancer Registry
46
Nebraska D
epartment of H
ealth and Hum
an ServicesC
ancer Registry
47
Nebraska D
epartment of H
ealth and Hum
an ServicesC
ancer Registry
48
Nebraska D
epartment of H
ealth and Hum
an ServicesC
ancer Registry
49
Nebraska D
epartment of H
ealth and Hum
an ServicesC
ancer Registry
50
Nebraska D
epartment of H
ealth and Hum
an ServicesC
ancer Registry
51
Nebraska D
epartment of H
ealth and Hum
an ServicesC
ancer Registry
52
Nebraska D
epartment of H
ealth and Hum
an ServicesC
ancer Registry
53
Nebraska D
epartment of H
ealth and Hum
an ServicesC
ancer Registry
54
Non-Hodgkin Lymphoma Diagnoses in Nebraska 2011-2015 Incidence Rates by Local Health Department Region
Rates are expressed as the average annual number of new cases per 100000 population and are age-adj usted to the 2000 U S population
Incidence Rates
140 - 180
181 - 209
Statewide incidence rate=203 221 - 298
Nebraska D
epartment of H
ealth and Hum
an ServicesC
ancer Registry
55
Nebraska D
epartment of H
ealth and Hum
an ServicesC
ancer Registry
56
Nebraska D
epartment of H
ealth and Hum
an ServicesC
ancer Registry
57
Nebraska D
epartment of H
ealth and Hum
an ServicesC
ancer Registry
58
Nebraska D
epartment of H
ealth and Hum
an ServicesC
ancer Registry
59
Kidney amp Renal Pelvis Cancer Deaths in Nebraska 2011-2015 Mortality Rates by Local Health Department Region
Rates are expressed as the average annual number of deaths per 100000 population and age-adjusted to the 2000 U S population
Mortality Rates
2 4 - 3 8
39 - 42
43 - 55
56 - 69 Statewide mortality rate=45
Nebraska D
epartment of H
ealth and Hum
an ServicesC
ancer Registry
60
Nebraska D
epartment of H
ealth and Hum
an ServicesC
ancer Registry
61
Nebraska D
epartment of H
ealth and Hum
an ServicesC
ancer Registry
62
Nebraska D
epartment of H
ealth and Hum
an ServicesC
ancer Registry
63
Liver amp lntrahepatic Bile Ducts Cancer Deaths in Nebraska 2011-2015 Mortality Rates by Local Health Department Region
Rates are expressed as the average annual number of deaths per 100000 population and age-adjusted to the 2000 U S population
North Central
---1 West Central
Mortality Rates
12 - 36
37-41
5 3 - 9 3 Statewide mortality rate=4 7
Nebraska D
epartment of H
ealth and Hum
an ServicesC
ancer Registry
64
REFERENCES
American Cancer Society American Cancer Society Recommendations for the Early Detection of Breast Cancer 2017 Available at httpswwwcancerorgcancerbreast-cancerscreening-testsshyand-early-detectionamerican-cancer-society-recommendations-for-the-early-detection-of-breastshycancerhtml
American Cancer Society Cancer Facts and Figures 2018 Atlanta GA American Cancer Society 2018 Available at httpswwwcancerorgcontentdamcancer-orgresearchcancer-facts-and-statisticsannualshycancer-facts-and-figures2018cancer-facts-and-figures-2018pdf
American Cancer Society Colorectal Cancer Screening Guidelines 2018 Available at httpswwwcancerorghealth-care-professionalsamerican-cancer-society-prevention-earlyshydetection-guidelinescolorectal-cancer-screening-guidelineshtml
Fritz A Percy C Jack A Shanmugaratnam K Sobin L Parkin DM Whelan S International Classification of Diseases for Oncology 3rd edition (US interim version 2000) Geneva Switzerland World Health Organization 2000
National Cancer Institute SEER Cancer Stat Facts Bethesda MD National Cancer Institute Accessed on February 21 2018 Available at httpsseercancergovstatfacts
United States Cancer Statistics 1999-2014 Incidence CDC WONDER On-line Database US Department of Health and Human Services Centers for Disease Control and Prevention and National Cancer Institute 2016 Available at httpswondercdcgovcancer-v2014HTML
United States Cancer Statistics 1999-2014 Mortality CDC WONDER On-line Database US Department of Health and Human Services Centers for Disease Control and Prevention 2016 Available at httpswondercdcgovcancermort-v2014HTML
United States Department of Health and Human Services The Health Consequences of Smoking A Report of the Surgeon General US Department of Health and Human Services Centers for Disease Control and Prevention National Center for Chronic Disease Prevention and Health Promotion Office on Smoking and Health 2004 Available at httpswwwcdcgovtobaccodata_statisticssgr2004complete_reportindexhtm
US Preventive Services Task Force Final Recommendation Statement Breast Cancer Screening November 2016 Available at httpwwwuspreventiveservicestaskforceorgPageDocumentRecommendationStatementFinalb reast-cancer-screening1
US Preventive Services Task Force Final Recommendation Statement Colorectal Cancer Screening June 2017 Available at httpswwwuspreventiveservicestaskforceorgPageDocumentRecommendationStatementFinal colorectal-cancer-screening2
US Preventive Services Task Force Final Recommendation Statement Lung Cancer Screening December 2016 Available at httpwwwuspreventiveservicestaskforceorgPageDocumentRecommendationStatementFinall ung-cancer-screening
World Health Organization Manual of the International Statistical Classification of Diseases and Related Health Problems 10th revision Geneva Switzerland World Health Organization 1992
Nebraska Department of Health and Human ServicesCancer Registry 65
REPORTING FACILITIES
Ainsworth--Brown County Hospital Albion--Boone County Health Center Alliance--Box Butte General Hospital Alma--Harlan County Health System Atkinson--West Holt Memorial Hospital Inc Auburn--Nemaha County Hospital Aurora--Memorial Hospital Bassett--Rock County Hospital Beatrice--Beatrice Community Hospital amp Health Center Inc Benkelman--Dundy County Hospital Blair--Memorial Community Hospital Bridgeport--Morrill County Community Hospital Broken Bow--Jennie Melham Memorial Medical Ctr Callaway--Callaway District Hospital Cambridge--Tri Valley Health System Central City--Litzenberg Memorial County Hospital Chadron--Chadron Community Hospital amp Health Services Columbus--Columbus Community Hospital Inc Cozad--Cozad Community Hospital Creighton--Creighton Area Health Services Crete--Crete Area Medical Center David City--Butler County Health Care Center Fairbury--Jefferson Community Health Center Inc Falls City--Community Medical Center Inc Franklin--Franklin County Memorial Hospital Fremont--Fremont Area Medical Center Friend--Warren Memorial Hospital Geneva--Fillmore County Hospital Genoa--Genoa Community HospitalLTC Gordon--Gordon Memorial Hospital District Gothenburg--Gothenburg Memorial Hospital Grand Island--CHI Health St Francis Grant--Perkins County Health Services Hastings--Mary Lanning Memorial Hospital Hebron--Thayer County Health Services Henderson--Henderson Health Care Services Holdrege--Phelps Memorial Health Center Imperial--Chase County Community Hospital Kearney--CHI Health Good Samaritan Kearney--CHI Health Good Samaritan Pathology Kimball--Kimball Health Services amp Hospital Lexington--Tri-County Area Hospital District Lincoln--Bryan-LGH Medical Center East amp West Lincoln--CHI Health Saint Elizabeth Lincoln--Pathology Medical Services Lincoln--Williamsburg Radiation Center Lincoln--CHI Health Nebraska Heart Lincoln--UNMC College of Dentistry Lynch--Niobrara Valley Hospital Corp McCook--Community Hospital Minden--Kearney County Health Services Nebraska City--CHI Health St Marys Neligh--Antelope Memorial Hospital
Norfolk--Faith Regional Health Services East amp West North Platte--Great Plains Regional Medical Center North Platte--Pathology Services Oakland--Oakland Memorial Hospital Ogallala--Ogallala Community Hospital Omaha--CHI Health Bergan Mercy Omaha--CHI Health Immanuel Omaha--Childrens Hospital Omaha--VA Nebraska-Western Iowa Health Care System Omaha--Methodist Hospital Pathology Center Omaha--Nebraska Medical Center Omaha--Nebraska Methodist Hospital Omaha--CHI Health Creighton University Med Ctr Omaha--Boys Town National Research Hospital Omaha--CHI Health Lakeside Omaha--CHI Health Bergan Mercy Pathology Omaha--Bishop Clarkson Hospital Pathology Omaha--Creighton Pathology Associates Omaha--Physicians Lab ONeill--Avera St Anthonys Hospital Ord--Valley County Hospital Osceola--Annie Jeffrey Memorial County Health Ctr Oshkosh--Garden County Health Services Osmond--Osmond General Hospital Papillion--CHI Health Midlands Pawnee City--Pawnee County Memorial Hospital Pender--Pender Community Hospital Plainview--CHI Health Plainview Red Cloud--Webster County Community Hospital Schuyler--CHI Health Schuyler Scottsbluff--Regional West Medical Center Scottsbluff--Western Pathology Consultants Seward--Memorial Hospital Sidney--Memorial Health Center St Paul--Howard County Community Hospital Superior--Brodstone Memorial Hospital Syracuse--Community Memorial Hospital Tecumseh--Johnson County Hospital Tilden--Tilden Community Hospital Valentine--Cherry County Hospital Wahoo--Saunders County Health Services Wayne--Providence Medical Center West Point--St Francis Memorial Hospital Winnebago--USPHS Indian Hospital York--York General Hospital
Other States Sioux City IA--Mercy Medical Center
State cancer registries participating in the National Interstate Data Exchange Agreement and the state cancer registries of Illinois Kansas Minnesota Missouri and South Dakota
Nebraska Department of Health and Human ServicesCancer Registry 66
THE NEBRASKA DEPARTMENT OF HEALTH AND HUMAN SERVICES IS COMMITTED TO AFFIRMATIVE ACTION
EQUAL EMPLOYMENT OPPORTUNITIES AND DOES NOT DISCRIMINATE IN DELIVERING BENEFITS OR SERVICES
AAEOEADA

20
Nebraska D
epartment of H
ealth and Hum
an ServicesC
ancer Registry
TABLE 6 Cancer Mortality Number of Deaths and Rates All Sites and Top Ten Primary Sites by Race and Ethnicity
Nebraska (2006-2015)
White African-American Native American AsianPacific Islander Hispanic Site Number Rate Site Number Rate Site Number Rate Site Number Rate Site Number Rate
All Sites 32687 1500 All Sites 1135 1945 All Sites 164 1492 All Sites 214 1000 All Sites 553 954
Rank
1 Lung amp Bronchus 8573 399
Lung amp Bronchus 313 543
Lung amp Bronchus 49 517
Lung amp Bronchus 46 211
Lung amp Bronchus 92 177
2 Colon amp Rectum
3323
151 Colon amp
Rectum 132 249 Colon amp Rectum 21 149
Liver amp Intrahepatic Bile Ducts
32 129 Colon amp Rectum 44 75
3 Female Breast
2174
181 Female
Breast 85 251 Female Breast 13 123
Colon amp Rectum 20 94
Female Breast 43 127
4 Pancreas 2096 96 Pancreas 75 128
Kidney amp Renal Pelvis 7 143
Pancreas
13 66
Liver amp Intrahepatic Bile Ducts
37 69
5 Prostate 1757 195 Prostate 66 342 Leukemia 6 44 Female Breast
11 84 Leukemia 31 42
Liver amp Intrahepatic Bile Ducts
Nonshy6 Leukemia 1402 64 52 72 Stomach 6 41 Hodgkin 10 46 Stomach 30 45
Lymphoma Nonshy
7 Hodgkin 1291 58 Myeloma 42 74 Pancreas 6 41 Leukemia 8 35 Prostate 29 177 Lymphoma
8 Brain amp CNS
974
47 Esophagus 33 52
Liver amp Intrahepatic Bile Ducts
6 38 Stomach 8 25 Kidney amp
Renal Pelvis
26 40
Nonshy
9 Esophagus 881 40 Urinary
Bladder 25 49 Prostate 5 86 Oral Cavity amp Pharynx 7 24
Hodgkin Lymphoma 24 49
10 Kidney amp
Renal Pelvis
871
40 Leukemia 25 37 Oral Cavity
amp Pharynx 4 67 Ovary 6 49 Brain amp CNS 24 29
Rates are per 100000 population excluding gender-specific sites (prostate female breast ovary) which are per 100000 male or female population All rates are age-adjusted to the 2000 US population Abbreviation CNS central nervous system
Cancer (all sites) Deaths in Nebraska 2015 Mortality Rates by County of Residence
Rates are expressed as the number of deaths per 100000 population and are age-adjusted to the 2000 US population
Dawes
Sioux
Box Butte
Scotts Bluff
Morrill
Banner
Kimball Cheyenne
Mortality Rates
CJ No deaths
l=i 01 - 1254
LJ 1255 - 1567
LJ 1568 - 1882
1883 - 431 8
Sheridan Holt
Antel~
Garfield Wheeler
Boone
Statewide mortality rate = 1568
Nebraska D
epartment of H
ealth and Hum
an ServicesC
ancer Registry
21
Cancer (all sites) Deaths in Nebraska 2011-2015 Mortality Rates by County of Residence
Rates are expressed as the average annual number of deaths per 100000 population and are age-adjusted to the 2000 US population
Dawes
Box Butte
Scotts Bluff
Morrill
Kimball Cheyenne
Mortality Rates
cJ 25 6 - 1285
CJ 1286 - 1605
CJ 1606 - 1927
1928 - 2414
Sheridan Cherry
Valley
Custer
Sherman Howard
Dawson Buffalo
Hitchcock Red Willow Furnas Harlan
Statewide mortality rate = 1606
Nebraska D
epartment of H
ealth and Hum
an ServicesC
ancer Registry
22
INCIDENCE AND MORTALITY FOR SELECTED PRIMARY SITES
Lung and Bronchus
Although lung cancer was only the second most frequently diagnosed cancer among Nebraska residents in 2015 it was the yearrsquos leading cause of cancer mortality accounting for 26 of the statersquos cancer deaths During the past five years (2011-2015) lung cancer has averaged over 1200 diagnoses and almost 900 deaths in Nebraska per year Although lung cancer is more likely to strike men than women the lung cancer death rate for Nebraska men has fallen by over 40 since 1990 while remaining almost unchanged for Nebraska women Due to the small number of cases that are detected at an early stage of the disease the 5-year relative survival rate for people diagnosed with lung cancer is less than 20
Cigarette smoking is the major risk factor for lung cancer and causes about 80 of lung cancer deaths People who smoke cigarettes are 15 to 30 times more likely to die from lung cancer than non-smokers Quitting smoking at any age reduces the risk of lung cancer although the risk for smokers is higher than the risk for a lifelong non-smoker The US Preventive Services Task Force (USPSTF) and ACS have both endorsed screening for lung cancer using low-dose computed tomography (LDCT) but only for people 55-74 years of age (the USPSTF recommendation includes people 55-80) who currently smoke or who have quit within the past 15 years are in good health and have at least a 30 pack-year smoking history
Maps on pages 45-46 present lung amp bronchus cancer incidence and mortality rates by place of residence local statistics by place of residence are also found in the appendix to this report (Table 3A [county]mdashpage 5 and Tables 13A and 14A [ local health department region]mdashpages 25-27)
Lung and Bronchus CancerIncidence Rates Nebraska (2006-2015) amp US (2006-2014)
30
40
50
60
70
80
90
Ag
e-a
dju
ste
d r
ate
(p
er
10
00
00
po
pu
lati
on
)
2006 2007 2008 2009 2010 2011 2012 2013 2014 2015
Nebraska 638 673 626 581 608 577 606 621 569 571
US 688 679 673 661 639 625 615 602 583
Nebraska Department of Health and Human ServicesCancer Registry 23
Lung and Bronchus CancerMortality Rates Nebraska (2006-2015) amp US (2006-2014)shy
200
300
400
500
600
700
800 A
ge
-ad
just
ed
ra
te (
pe
r 1
00
00
0 p
op
ula
tio
n)
2006 2007 2008 2009 2010 2011 2012 2013 2014 2015
Nebraska 475 486 451 442 459 425 433 428 414 410
US 517 507 496 484 474 460 449 434 422
Lung and Bronchus CancerPercentage of Cases by Stage of Disease at Diagnosisshy
Nebraska 2011-2015shy
Local
20
Regional
23
Distant
50
Unstaged
7
Nebraska Department of Health and Human ServicesCancer Registry 24
Breast (Female only)
Breast cancer is the most common type of cancer among women and the second most frequent cause of female cancer deaths Between 2011 and 2015 6714 Nebraska women were diagnosed with invasive breast cancer (and another 1427 were diagnosed with in situ breast cancer) and 1174 women died from breast cancer Since 1990 the rate of breast cancer deaths in Nebraska and the US has declined significantly Recent declines in the rate of breast cancer diagnoses have been attributed to the decreasing use of post-menopausal hormone replacement therapy early detection through screening and increased awareness
Age is an important risk factor for breast cancer with 80 of all cases occurring among women age 50 and older Other risk factors include genetic mutations a personal or family history of breast cancer some forms of benign breast disease early menstruation late menopause never having children or having a first child after age 30 and for post-menopausal women obesity and long-term hormone replacement therapy
Screening for breast cancer is known to save lives although opinion varies on how and when to screen USPSTF guidelines recommend mammography for women 50-74 on an every-other-year schedule However ACS guidelines recommend that women 40-44 have the choice for annual mammography women 45-54 have annual mammography and women 55 and older have the choice to continue annual mammography or to have it on an every-other-year schedule continuing as long as their overall health is good and life expectancy is 10 or more years For some women who have an increased risk of breast cancer the ACS recommends annual magnetic resonance imaging (MRI) in addition to mammography usually starting at age 30
Maps on pages 47-48 present female breast cancer incidence and mortality rates by place of residence local statistics by place of residence are also found in the appendix to this report (Table 4A [county]mdashpage 7 and Table 13A and 14A [local health department]mdashpages 25-27)
Female Breast CancerIncidence Rates Nebraska (2006-2015) amp US (2006-2014)
900
1000
1100
1200
1300
1400
1500
Ag
e-a
dju
ste
d r
ate
(p
er
10
00
00
fe
ma
le p
op
ula
tio
n)
2006 2007 2008 2009 2010 2011 2012 2013 2014 2015
Nebraska 1301 1174 1301 1224 1182 1267 1190 1210 1240 1278
US 1218 1233 1245 1255 1215 1239 1235 1247 1239
Nebraska Department of Health and Human ServicesCancer Registry 25
Female Breast CancerMortality Rates Nebraska (2006-2015) amp US (2006-2014)
100
150
200
250
300
350
400 A
ge
-ad
just
ed
ra
te (
pe
r 1
00
00
0 f
em
ale
po
pu
lati
on
)
2006 2007 2008 2009 2010 2011 2012 2013 2014 2015
Nebraska 199 215 207 194 192 181 212 208 213 185
US 236 230 226 222 219 215 213 207 205
Female Breast CancerPercentage of Cases by Stage of Disease at Diagnosisshy
Nebraska 2011-2015shy
Local
52 Regional
24
Distant
4
Unstaged
2
In situ
18
Nebraska Department of Health and Human ServicesCancer Registry 26
Colon and Rectum (Colorectal)
In 2015 colorectal cancer was the fourth most frequently diagnosed cancer among Nebraska residents accounting for 920 new cases It was also the second leading cause of cancer mortality in the state accounting for 336 deaths
The risk of developing colorectal cancer increases with age More than half (616) of all colorectal cancer cases that occurred in Nebraska during 2011-2015 were 65 or older at diagnosis Other risk factors include a personal or family history of colorectal cancer or polyps a personal history of chronic inflammatory bowel disease and certain hereditary colorectal cancer syndromes Modifiable risk factors include physical inactivity obesity smoking a high-fat diet (especially fat from animal sources) and heavy alcohol use
Screening for asymptomatic polyps and tumors is known to prevent colorectal cancer cases and deaths and there are a number of recommended test options Among them include several types of stool tests flexible sigmoidoscopy colonoscopy CT colonography (virtual colonoscopy) and double-contrast barium enema Recommended frequency varies by type of test For people of average risk without symptoms the USPSTF recommends screening for those 50-75 years of age while the ACS recommends screening for anyone 45 and older However the USPSTF also recommends that people at increased risk (ie a personal or family history of colorectal cancer or polyps a personal history of chronic inflammatory bowel disease or a family history of hereditary colorectal cancer syndromes) may be advised to begin screening before age 50 andor be screened more often
Maps on pages 49-50 present incidence and mortality rates for cancers of the colon amp rectum by place of residence local statistics by place of residence are also found in the appendix to this report (Table 5A [county]mdashpage 9 and Table 13A and 14A [local health department]mdashpages 25-27)
Colon and Rectum (Colorectal) Cancer Incidence Rates Nebraska (2006-2015) amp US (2006-2014)
200
300
400
500
600
700
800
Ag
e-a
dju
ste
d r
ate
(p
er
10
00
00
po
pu
lati
on
)
2006 2007 2008 2009 2010 2011 2012 2013 2014 2015
Nebraska 560 559 529 474 462 450 439 412 422 428
US 482 470 458 436 416 407 395 388 384
Nebraska Department of Health and Human ServicesCancer Registry 27
Colon and Rectum (Colorectal) CancerMortality Rates Nebraska (2006-2015) amp US (2006-2014)
00
50
100
150
200
250
300 A
ge
-ad
just
ed
ra
te (
pe
r 1
00
00
0 p
op
ula
tio
n)
2006 2007 2008 2009 2010 2011 2012 2013 2014 2015
Nebraska 193 185 184 163 171 171 159 150 156 151
US 173 169 165 158 155 151 147 145 141
Colon and Rectum (Colorectal) CancerPercentage of Cases by Stage of Disease at Diagnosisshy
Nebraska 2011-2015shy
Local
38
Regional
34
Distant
18
Unstaged
7
In situ
3
Nebraska Department of Health and Human ServicesCancer Registry 28
Prostate
With 1185 diagnoses in 2015 prostate cancer was the most common cancer among Nebraska men accounting for over 24 of all new cancers During the past five years (2011-2015) it has also been the second leading cause of cancer deaths among Nebraska men accounting for 905 deaths Since the mid-1990s prostate cancer death rates have declined substantially both in Nebraska and throughout the United States
Little is known about what causes prostate cancer Risk increases with age (about 59 of Nebraska men diagnosed with prostate cancer during 2011-2015 were 65 or older) and is significantly greater among African-Americans During the past decade (2006-2015) the incidence of prostate cancer among African-American men in Nebraska has been 37 higher than among whites Men with a close relative (father brother or son) who have had prostate cancer especially at a young age are also at increased risk
Current ACS guidelines recommend that men make an informed decision with their health care provider about whether to be screened for prostate cancer This discussion should begin at age 50 for men who are at average risk of prostate cancer and have a life expectancy of at least 10 years This discussion should begin at age 45 for men at high risk (African-Americans and men with a father brother or son diagnosed with prostate cancer before age 65) and at age 40 for men of even higher risk (men with several first-degree relatives diagnosed before age 65) For men who choose to be screened the ACS recommends the prostate-specific antigen (PSA) test with or without a digital rectal exam By contrast the USPSTF does not recommend screening for prostate cancer
Maps on pages 51-52 present incidence and mortality rates for prostate cancer by place of residence local statistics by place of residence are also found in the appendix to this report (Table 6A [county]mdashpage 11 and Table 13A and 14A [local health department]mdash pages 25-27)
Prostate CancerIncidence Rates Nebraska (2006-2015) amp US (2006-2014)
0
50
100
150
200
250
Ag
e-a
dju
ste
d r
ate
(p
er
10
00
00
ma
le p
op
ula
tio
n)
2006 2007 2008 2009 2010 2011 2012 2013 2014 2015
Nebraska 1615 1713 1499 1278 1401 1320 1133 1104 1043 1095
US 1598 1643 1516 1434 1344 1337 1097 1041 955
Nebraska Department of Health and Human ServicesCancer Registry 29
Prostate CancerMortality Rates Nebraska (2006-2015) amp US (2006-2014)
100
150
200
250
300
350
400 A
ge
-ad
just
ed
ra
te (
pe
r 1
00
00
0 m
ale
po
pu
lati
on
)
2006 2007 2008 2009 2010 2011 2012 2013 2014 2015
Nebraska 235 248 236 230 200 221 214 217 191 172
US 242 242 230 221 218 208 196 193 191
Prostate CancerPercentage of Cases by Stage of Disease at Diagnosisshy
Nebraska 2011-2015shy
Local
72 Regional
14
Distant
6
Unstaged
8
Nebraska Department of Health and Human ServicesCancer Registry 30
Urinary Bladder
Between 2011 and 2015 2232 Nebraska residents were diagnosed with bladder cancer Bladder cancer occurs much more frequently among men than women (by about a 3-to-1 ratio) and it now ranks as the fourth most common site of cancer diagnoses among Nebraska men However deaths from bladder cancer occur far less often (436 Nebraska residents died from it during 2011-2015) which is the result of a high percentage of early-stage diagnoses and the existence of effective treatments Survival prospects have improved considerably in recent decades to the point where the most current national data show that the five-year relative survival rate for all bladder cancer patients is about 77
Cigarette smoking is the most important known risk factor for bladder cancer Smokers develop bladder cancer three times more often than non-smokers and about half of all cases are attributable to smoking Risk factors also include occupational exposures to certain chemicals used to make dyes (benzidine and beta-naphthylamine) as well as working in the manufacture of rubber and leather Like most cancers the risk of bladder cancer increases with age 76 of the cases that occurred in Nebraska during 2011-2015 were at least 65 years old when diagnosed
Maps on pages 53-54 present incidence and mortality rates for urinary bladder cancer by place of residence local statistics by place of residence are also found in the appendix to this report (Table 7A [county]mdashpage 13 and Table 13A and 14A [local health department]mdashpages 25-27)
Urinary Bladder CancerIncidence Rates Nebraska (2006-2015) amp US (2006-2014)
00
50
100
150
200
250
300
Ag
e-a
dju
ste
d r
ate
(p
er
10
00
00
po
pu
lati
on
)
2006 2007 2008 2009 2010 2011 2012 2013 2014 2015
Nebraska 203 224 203 198 216 223 209 203 195 210
US 213 215 215 213 209 208 207 203 198
Nebraska Department of Health and Human ServicesCancer Registry 31
Urinary Bladder CancerMortality Rates Nebraska (2006-2015) amp US (2006-2014)shy
00
10
20
30
40
50
60 A
ge
-ad
just
ed
ra
te (
pe
r 1
00
00
0 p
op
ula
tio
n)
2006 2007 2008 2009 2010 2011 2012 2013 2014 2015
Nebraska 43 42 40 35 43 45 40 38 37 39
US 44 44 44 44 44 44 44 44 43
Urinary Bladder CancerPercentage of Cases by Stage of Disease at Diagnosisshy
Nebraska 2011-2015shy
Local
34
Regional
7
Distant
3
Unstaged
5
In Situ
51
Nebraska Department of Health and Human ServicesCancer Registry 32
Non-Hodgkin Lymphoma
Lymphomas are cancers that affect the white blood cells of the immune system and are usually classified as either Hodgkin or Non-Hodgkin lymphoma Non-Hodgkin lymphoma is by far the more common disorder of the two accounting for 2120 diagnoses and 634 deaths among Nebraska residents between 2011 and 2015 (for Hodgkin lymphoma the comparable figures are 294 diagnoses and 32 deaths) National statistics indicate that the incidence rate for Non-Hodgkin lymphoma has increased by about 80 since the midshy1970s and some of this increase is related to the appearance of AIDS However both state and national data show that Non-Hodgkin lymphoma deaths have been increasing since at least 1950 which indicates that factors other than AIDS are also responsible
The causes of Non-Hodgkin lymphoma are unknown although there is evidence that viral exposures and reduced immune function are associated with the disease People whose immune systems have been suppressed by drugs particularly those who have received an organ transplant are at high risk of Non-Hodgkin lymphoma and it also occurs more frequently among people with congenital and acquired immunologic disorders including AIDS The increased incidence of the disease among people with congenital disorders of the immune system suggests that hereditary factors may increase risk Some studies have found that occupational exposure to certain herbicides is a risk factor as well
Maps on pages 55-56 present incidence and mortality rates for Non-Hodgkin lymphoma by place of residence local statistics by place of residence are also found in the appendix to this report (Table 8A [county]mdashpage 15 and Table 13A and 14A [local health department]mdashpages 25-27)
Non-Hodgkin LymphomaIncidence Rates Nebraska (2006-2015) amp US (2006-2014)
00
50
100
150
200
250
300
Ag
e-a
dju
ste
d r
ate
(p
er
10
00
00
po
pu
lati
on
)
2006 2007 2008 2009 2010 2011 2012 2013 2014 2015
Nebraska 211 214 198 212 209 219 195 215 186 198
US 197 197 197 198 196 191 189 188 185
Nebraska Department of Health and Human ServicesCancer Registry 33
Non-Hodgkin LymphomaMortality Rates Nebraska (2006-2015) amp US (2006-2014)shy
00
20
40
60
80
100
120 A
ge
-ad
just
ed
ra
te (
pe
r 1
00
00
0 p
op
ula
tio
n)
2006 2007 2008 2009 2010 2011 2012 2013 2014 2015
Nebraska 73 76 64 62 69 66 54 59 56 59
US 67 66 64 63 61 60 59 57 57
Non-Hodgkin LymphomaPercentage of Cases by Stage of Disease at Diagnosisshy
Nebraska 2011-2015shy
Local
25
Regional
15
Distant
49
Unstaged
11
Nebraska Department of Health and Human ServicesCancer Registry 34
Leukemia
Between 2011 and 2015 leukemia accounted for 1463 diagnoses and 757 deaths among Nebraska residents Although leukemia is one of the most common types of cancer diagnosed among children and adolescents over half (57) of the leukemia cases that occurred in Nebraska between 2011 and 2015 were 65 years of age or older at diagnosis There are many different types of leukemia acute lymphocytic leukemia is the most frequently diagnosed among children and teens while acute myeloid and chronic lymphocytic are the most common types among adults Survival times vary widely by type overall the relative five-year survival rate for all leukemia patients in the United States is over 60
The major causes of most types of leukemia are unknown Nevertheless several risk factors have been identified and include genetic abnormalities (such as Down syndrome) exposure to ionizing radiation and workplace exposure to benzene and other related solvents Adult T-cell acute lymphocytic leukemia is strongly associated with infection by a retrovirus the human T-cell lymphomaleukemia virus type I (HTLV-I) Cigarette smoking is a risk factor for acute myeloid leukemia while people who have a family history of chronic lymphocytic leukemia carry an increased risk of the disease themselves
Maps on pages 57-58 present incidence and mortality rates for leukemia by place of residence local statistics by place of residence are also found in the appendix to this report (Table 9A [county]mdashpage 17 and Table 13A and 14A [local health department]mdash pages 25-27)
LeukemiaIncidence Rates Nebraska (2006-2015) amp US (2006-2014)
00
40
80
120
160
200
240
Ag
e-a
dju
ste
d r
ate
(p
er
10
00
00
po
pu
lati
on
)
2006 2007 2008 2009 2010 2011 2012 2013 2014 2015
Nebraska 162 158 141 133 149 141 147 143 145 122
US 134 133 133 134 140 140 139 137 133
Nebraska Department of Health and Human ServicesCancer Registry 35
LeukemiaMortality Rates Nebraska (2006-2015) amp US (2006-2014)
20
40
60
80
100
120 A
ge
-ad
just
ed
ra
te (
pe
r 1
00
00
0 p
op
ula
tio
n)
00 2006 2007 2008 2009 2010 2011 2012 2013 2014 2015
Nebraska 74 68 79 62 63 70 81 65 71 65
US 72 71 71 71 69 69 68 68 66
Leukemia Number of Cases by Histologic Type Nebraska 2011-2015
Nebraska Department of Health and Human ServicesCancer Registry 36
Acute lymphocytic
Chronic lymphocytic
Other lymphocytic
Acute myeloid
Acute monocytic
Chronic myeloid
Other myeloidmonocytic
Other acute leukemia
Aleukemic subleukemic amp NOS 29
24
26
192
34
468
39
502
149
0 100 200 300 400 500
Abbreviation NOS not otherwise specified
600
Kidney and Renal Pelvis
Cancers of the kidney and renal pelvis accounted for 1774 diagnoses in Nebraska between 2011 and 2015 and also accounted for 485 deaths in Nebraska during the same years State and national trends since 1990 show a significant increase in the rate of diagnosis of these cancers but little change in the mortality rate The chances of survival for people with kidney cancer are relatively high with the most current national statistics showing that the five-year relative survival rate for cancers of the kidney and renal pelvis is now over 70
Preventable risk factors for cancer of the kidney include cigarette smoking and obesity Current estimates indicate that cigarette smoking is responsible for about 20 percent of all kidney cancer deaths Kidney cancer is more likely to strike at younger ages than most other types in Nebraska almost half (496) of all cases that were diagnosed during 2011-2015 were under the age of 65 Other non-preventable risk factors for cancer of the kidney include a family history of kidney cancer and high blood pressure However since people with high blood pressure are often treated with drugs it is unclear whether their increased risk is related to their high blood pressure or the drugs Nevertheless people who need drugs to lower their blood pressure should take them
Maps on pages 59-60 present incidence and mortality rates for cancers of the kidney amp renal pelvis by place of residence local statistics by place of residence are also found in the appendix to this report (Table 10A [county]mdashpage 19 and Table 13A and 14A [local health department]mdashpages 25-27)
Kidney and Renal Pelvis Cancer Incidence Rates Nebraska (2006-2015) amp US (2006-2014)
00
40
80
120
160
200
240
Ag
e-a
dju
ste
d r
ate
(p
er
10
00
00
po
pu
lati
on
)
2006 2007 2008 2009 2010 2011 2012 2013 2014 2015
Nebraska 162 165 188 177 183 157 155 166 173 188
US 157 160 163 163 159 160 162 162 162
Nebraska Department of Health and Human ServicesCancer Registry 37
Kidney and Renal Pelvis CancerMortality Rates Nebraska (2006-2015) amp US (2006-2014)shy
00
10
20
30
40
50
60
Ag
e-a
dju
ste
d r
ate
(p
er
10
00
00
po
pu
lati
on
)
2006 2007 2008 2009 2010 2011 2012 2013 2014 2015
Nebraska 45 40 38 48 42 51 41 41 46 44
US 40 40 40 39 39 39 38 39 38
Kidney and Renal Pelvis CancerPercentage of Cases by Stage of Disease at Diagnosisshy
Nebraska 2011-2015shy
Local
61
Regional
16
Distant
16
Unstaged
5
In Situ
2
Nebraska Department of Health and Human ServicesCancer Registry 38
Melanoma of the Skin
There are several different types of skin cancer but melanomas are the most serious Nationally melanomas comprise about 1 of all skin cancer diagnoses but the vast majority of all skin cancer deaths In Nebraska melanomas of the skin accounted for 2235 diagnoses and 310 deaths between 2011 and 2015 The incidence of melanoma continues to increase significantly in Nebraska and throughout the United States Because most melanomas are discovered early in their development and can be surgically removed the relative five-year survival rate is now over 90
Melanoma is related to exposure to ultraviolet radiation (most of which comes from the sun) particularly exposures during childhood that resulted in severe sunburns The risk of developing melanoma is particularly high among people with light skin Sun exposure is not the only risk factor Family history of melanoma and the presence of numerous dysplastic nevi (large moles with irregular coloration and shape) also increase a personrsquos risk of the disease
Skin melanomas are among the most preventable and treatable of all cancers Wearing protective clothing and using sunscreen are the best methods for preventing the disease and children in particular should have such protection In addition early detection can greatly reduce the risk of melanoma mortality Recognition of changes in skin growths or the appearance of new growths is the best way to find melanomas early in their development The ACS suggests that adults practice skin self-examination on a monthly basis and that suspicious lesions should be evaluated promptly by a physician
Maps on pages 61-62 present incidence and mortality rates for melanoma of the skin by place of residence local statistics by place of residence are also found in the appendix to this report (Table 11A [county]mdashpage 21 and Table 13A and 14A [local health department]mdashpages 25-27)
Melanoma of the SkinIncidence Rates Nebraska (2006-2015) amp US (2006-2014)
00
50
100
150
200
250
300
Ag
e-a
dju
ste
d r
ate
(p
er
10
00
00
po
pu
lati
on
)
2006 2007 2008 2009 2010 2011 2012 2013 2014 2015
Nebraska 176 179 183 192 183 197 178 236 235 256
US 191 195 199 202 199 205 205 210 214
Nebraska Department of Health and Human ServicesCancer Registry 39
Melanoma of the SkinMortality Rates Nebraska (2006-2015) amp US (2006-2014)
00
10
20
30
40
50
60 A
ge
-ad
just
ed
ra
te (
pe
r 1
00
00
0 p
op
ula
tio
n)
2006 2007 2008 2009 2010 2011 2012 2013 2014 2015
Nebraska 30 20 39 32 26 27 34 34 25 29
US 27 27 27 28 27 27 27 27 26
Melanoma of the SkinPercentage of Cases by Stage of Disease at Diagnosisshy
Nebraska 2011-2015shy
Local
44
Regional
5
Distant
3
Unstaged
7
In Situ
41
Nebraska Department of Health and Human ServicesCancer Registry 40
Liver and Intrahepatic Bile Ducts
Often when cancer is found in the liver it did not start there but has spread (metastized) from somewhere else in the body In the United States metastatic liver cancer is more common than liver cancer that originates in the liver (referred to as primary liver cancer) In Nebraska primary cancers of the liver and intrahepatic bile ducts accounted for 604 diagnoses and 502 deaths between 2011 and 2015 Diagnosis does not usually occur until the disease is well advanced due to a lack of symptoms As a result survival is poor the most recent national five-year survival rate is less than 20 Both nationally and in Nebraska the incidence and mortality rates for liver cancer have increased steadily during the past decade
The most common risk factor for liver cancer is chronic viral hepatitis (type B and C) Other preventable risk factors include cirrhosis heavy alcohol use obesity exposure to arsenic and vinyl chloride and using anabolic steroids Type 2 diabetes has also been linked with an increased risk of liver cancer usually in cases where other risk factors such as heavy alcohol use andor chronic viral hepatitis are present Non-preventable risk factors for liver cancer include gender raceethnicity and certain inherited metabolic diseases Nebraska statistics show that diagnoses among men outnumber those among women by a ratio of about 31 while incidence rates are significantly higher among African-Americans Native Americans AsianPacific Islanders and Hispanics compared to whites
Maps on pages 63-64 present incidence and mortality rates for cancers of the liver by place of residence local statistics by place of residence are also found in the appendix to this report (Table 12A [county]mdashpage 23 and Table 13A and 14A [local health department]mdashpages 25-27)
Liver amp Intrahepatic Bile Ducts CancerIncidence Rates Nebraska (2006-2015) amp US (2006-2014)
00
30
60
90
120
150
180
Ag
e-a
dju
ste
d r
ate
(p
er
10
00
00
po
pu
lati
on
)
2006 2007 2008 2009 2010 2011 2012 2013 2014 2015
Nebraska 42 42 55 50 59 57 56 58 46 59
US 63 67 69 73 74 76 79 80 81
Nebraska Department of Health and Human ServicesCancer Registry 41
Liver amp Intrahepatic Bile Ducts CancerMortality Rates Nebraska (2006-2015) amp US (2006-2014)
00
30
60
90
120
150 A
ge
-ad
just
ed
ra
te (
pe
r 1
00
00
0 p
op
ula
tio
n)
2006 2007 2008 2009 2010 2011 2012 2013 2014 2015
Nebraska 43 38 33 45 50 53 46 46 46 42
US 53 54 56 58 59 61 63 65 65
Liver amp Intrahepatic Bile Ducts CancerPercentage of Cases by Stage of Disease at Diagnosisshy
Nebraska 2011-2015shy
Local
44 Regional
27
Distant
15
Unstagedshy14shy
Nebraska Department of Health and Human ServicesCancer Registry 42
This page intentionally left blank
Nebraska Department of Health and Human ServicesCancer Registry 43
INCIDENCE amp MORTALITY RATE MAPS FOR SELECTED PRIMARY SITES
Nebraska Department of Health and Human ServicesCancer Registry 44
Primary Site Contents Page
Lung amp bronchus
Incidence Mortality
45 46
Female breast
Incidence Mortality
47 48
Colon amp rectum (colorectal)
Incidence Mortality
49 50
Prostate
Incidence Mortality
51 52
Urinary bladder
Incidence Mortality
53 54
Non-Hodgkin lymphoma
Incidence Mortality
55 56
Leukemia
Incidence Mortality
57 58
Kidney amp renal pelvis
Incidence Mortality
59 60
Melanoma of the skin
Incidence Mortality
61 62
Liver amp intrahepatic bile ducts
Incidence Mortality
63 64
Lung amp Bronchus Cancer Diagnoses in Nebraska 2011-2015 Incidence Rates by Local Health Department Region
Rates are expressed as the average annual number of new cases per 100000 population and are age-adjusted to the 2000 U S population
Incidence Rates
455 - 488
489 - 558
559 - 633
Statewide incidence rate=590 634 - 699
Nebraska D
epartment of H
ealth and Hum
an ServicesC
ancer Registry
45
Lung amp Bronchus Cancer Deaths in Nebraska 2011-2015 Mortality Rates by Local Health Department Region
Rates are expressed as the average annual number of deaths per 100000 population and age-adjusted to the 2000 U S population
Mortality Rates
305 - 369
370 - 400
433 - 491 Statew ide mortal ity rate=420
Nebraska D
epartment of H
ealth and Hum
an ServicesC
ancer Registry
46
Nebraska D
epartment of H
ealth and Hum
an ServicesC
ancer Registry
47
Nebraska D
epartment of H
ealth and Hum
an ServicesC
ancer Registry
48
Nebraska D
epartment of H
ealth and Hum
an ServicesC
ancer Registry
49
Nebraska D
epartment of H
ealth and Hum
an ServicesC
ancer Registry
50
Nebraska D
epartment of H
ealth and Hum
an ServicesC
ancer Registry
51
Nebraska D
epartment of H
ealth and Hum
an ServicesC
ancer Registry
52
Nebraska D
epartment of H
ealth and Hum
an ServicesC
ancer Registry
53
Nebraska D
epartment of H
ealth and Hum
an ServicesC
ancer Registry
54
Non-Hodgkin Lymphoma Diagnoses in Nebraska 2011-2015 Incidence Rates by Local Health Department Region
Rates are expressed as the average annual number of new cases per 100000 population and are age-adj usted to the 2000 U S population
Incidence Rates
140 - 180
181 - 209
Statewide incidence rate=203 221 - 298
Nebraska D
epartment of H
ealth and Hum
an ServicesC
ancer Registry
55
Nebraska D
epartment of H
ealth and Hum
an ServicesC
ancer Registry
56
Nebraska D
epartment of H
ealth and Hum
an ServicesC
ancer Registry
57
Nebraska D
epartment of H
ealth and Hum
an ServicesC
ancer Registry
58
Nebraska D
epartment of H
ealth and Hum
an ServicesC
ancer Registry
59
Kidney amp Renal Pelvis Cancer Deaths in Nebraska 2011-2015 Mortality Rates by Local Health Department Region
Rates are expressed as the average annual number of deaths per 100000 population and age-adjusted to the 2000 U S population
Mortality Rates
2 4 - 3 8
39 - 42
43 - 55
56 - 69 Statewide mortality rate=45
Nebraska D
epartment of H
ealth and Hum
an ServicesC
ancer Registry
60
Nebraska D
epartment of H
ealth and Hum
an ServicesC
ancer Registry
61
Nebraska D
epartment of H
ealth and Hum
an ServicesC
ancer Registry
62
Nebraska D
epartment of H
ealth and Hum
an ServicesC
ancer Registry
63
Liver amp lntrahepatic Bile Ducts Cancer Deaths in Nebraska 2011-2015 Mortality Rates by Local Health Department Region
Rates are expressed as the average annual number of deaths per 100000 population and age-adjusted to the 2000 U S population
North Central
---1 West Central
Mortality Rates
12 - 36
37-41
5 3 - 9 3 Statewide mortality rate=4 7
Nebraska D
epartment of H
ealth and Hum
an ServicesC
ancer Registry
64
REFERENCES
American Cancer Society American Cancer Society Recommendations for the Early Detection of Breast Cancer 2017 Available at httpswwwcancerorgcancerbreast-cancerscreening-testsshyand-early-detectionamerican-cancer-society-recommendations-for-the-early-detection-of-breastshycancerhtml
American Cancer Society Cancer Facts and Figures 2018 Atlanta GA American Cancer Society 2018 Available at httpswwwcancerorgcontentdamcancer-orgresearchcancer-facts-and-statisticsannualshycancer-facts-and-figures2018cancer-facts-and-figures-2018pdf
American Cancer Society Colorectal Cancer Screening Guidelines 2018 Available at httpswwwcancerorghealth-care-professionalsamerican-cancer-society-prevention-earlyshydetection-guidelinescolorectal-cancer-screening-guidelineshtml
Fritz A Percy C Jack A Shanmugaratnam K Sobin L Parkin DM Whelan S International Classification of Diseases for Oncology 3rd edition (US interim version 2000) Geneva Switzerland World Health Organization 2000
National Cancer Institute SEER Cancer Stat Facts Bethesda MD National Cancer Institute Accessed on February 21 2018 Available at httpsseercancergovstatfacts
United States Cancer Statistics 1999-2014 Incidence CDC WONDER On-line Database US Department of Health and Human Services Centers for Disease Control and Prevention and National Cancer Institute 2016 Available at httpswondercdcgovcancer-v2014HTML
United States Cancer Statistics 1999-2014 Mortality CDC WONDER On-line Database US Department of Health and Human Services Centers for Disease Control and Prevention 2016 Available at httpswondercdcgovcancermort-v2014HTML
United States Department of Health and Human Services The Health Consequences of Smoking A Report of the Surgeon General US Department of Health and Human Services Centers for Disease Control and Prevention National Center for Chronic Disease Prevention and Health Promotion Office on Smoking and Health 2004 Available at httpswwwcdcgovtobaccodata_statisticssgr2004complete_reportindexhtm
US Preventive Services Task Force Final Recommendation Statement Breast Cancer Screening November 2016 Available at httpwwwuspreventiveservicestaskforceorgPageDocumentRecommendationStatementFinalb reast-cancer-screening1
US Preventive Services Task Force Final Recommendation Statement Colorectal Cancer Screening June 2017 Available at httpswwwuspreventiveservicestaskforceorgPageDocumentRecommendationStatementFinal colorectal-cancer-screening2
US Preventive Services Task Force Final Recommendation Statement Lung Cancer Screening December 2016 Available at httpwwwuspreventiveservicestaskforceorgPageDocumentRecommendationStatementFinall ung-cancer-screening
World Health Organization Manual of the International Statistical Classification of Diseases and Related Health Problems 10th revision Geneva Switzerland World Health Organization 1992
Nebraska Department of Health and Human ServicesCancer Registry 65
REPORTING FACILITIES
Ainsworth--Brown County Hospital Albion--Boone County Health Center Alliance--Box Butte General Hospital Alma--Harlan County Health System Atkinson--West Holt Memorial Hospital Inc Auburn--Nemaha County Hospital Aurora--Memorial Hospital Bassett--Rock County Hospital Beatrice--Beatrice Community Hospital amp Health Center Inc Benkelman--Dundy County Hospital Blair--Memorial Community Hospital Bridgeport--Morrill County Community Hospital Broken Bow--Jennie Melham Memorial Medical Ctr Callaway--Callaway District Hospital Cambridge--Tri Valley Health System Central City--Litzenberg Memorial County Hospital Chadron--Chadron Community Hospital amp Health Services Columbus--Columbus Community Hospital Inc Cozad--Cozad Community Hospital Creighton--Creighton Area Health Services Crete--Crete Area Medical Center David City--Butler County Health Care Center Fairbury--Jefferson Community Health Center Inc Falls City--Community Medical Center Inc Franklin--Franklin County Memorial Hospital Fremont--Fremont Area Medical Center Friend--Warren Memorial Hospital Geneva--Fillmore County Hospital Genoa--Genoa Community HospitalLTC Gordon--Gordon Memorial Hospital District Gothenburg--Gothenburg Memorial Hospital Grand Island--CHI Health St Francis Grant--Perkins County Health Services Hastings--Mary Lanning Memorial Hospital Hebron--Thayer County Health Services Henderson--Henderson Health Care Services Holdrege--Phelps Memorial Health Center Imperial--Chase County Community Hospital Kearney--CHI Health Good Samaritan Kearney--CHI Health Good Samaritan Pathology Kimball--Kimball Health Services amp Hospital Lexington--Tri-County Area Hospital District Lincoln--Bryan-LGH Medical Center East amp West Lincoln--CHI Health Saint Elizabeth Lincoln--Pathology Medical Services Lincoln--Williamsburg Radiation Center Lincoln--CHI Health Nebraska Heart Lincoln--UNMC College of Dentistry Lynch--Niobrara Valley Hospital Corp McCook--Community Hospital Minden--Kearney County Health Services Nebraska City--CHI Health St Marys Neligh--Antelope Memorial Hospital
Norfolk--Faith Regional Health Services East amp West North Platte--Great Plains Regional Medical Center North Platte--Pathology Services Oakland--Oakland Memorial Hospital Ogallala--Ogallala Community Hospital Omaha--CHI Health Bergan Mercy Omaha--CHI Health Immanuel Omaha--Childrens Hospital Omaha--VA Nebraska-Western Iowa Health Care System Omaha--Methodist Hospital Pathology Center Omaha--Nebraska Medical Center Omaha--Nebraska Methodist Hospital Omaha--CHI Health Creighton University Med Ctr Omaha--Boys Town National Research Hospital Omaha--CHI Health Lakeside Omaha--CHI Health Bergan Mercy Pathology Omaha--Bishop Clarkson Hospital Pathology Omaha--Creighton Pathology Associates Omaha--Physicians Lab ONeill--Avera St Anthonys Hospital Ord--Valley County Hospital Osceola--Annie Jeffrey Memorial County Health Ctr Oshkosh--Garden County Health Services Osmond--Osmond General Hospital Papillion--CHI Health Midlands Pawnee City--Pawnee County Memorial Hospital Pender--Pender Community Hospital Plainview--CHI Health Plainview Red Cloud--Webster County Community Hospital Schuyler--CHI Health Schuyler Scottsbluff--Regional West Medical Center Scottsbluff--Western Pathology Consultants Seward--Memorial Hospital Sidney--Memorial Health Center St Paul--Howard County Community Hospital Superior--Brodstone Memorial Hospital Syracuse--Community Memorial Hospital Tecumseh--Johnson County Hospital Tilden--Tilden Community Hospital Valentine--Cherry County Hospital Wahoo--Saunders County Health Services Wayne--Providence Medical Center West Point--St Francis Memorial Hospital Winnebago--USPHS Indian Hospital York--York General Hospital
Other States Sioux City IA--Mercy Medical Center
State cancer registries participating in the National Interstate Data Exchange Agreement and the state cancer registries of Illinois Kansas Minnesota Missouri and South Dakota
Nebraska Department of Health and Human ServicesCancer Registry 66
THE NEBRASKA DEPARTMENT OF HEALTH AND HUMAN SERVICES IS COMMITTED TO AFFIRMATIVE ACTION
EQUAL EMPLOYMENT OPPORTUNITIES AND DOES NOT DISCRIMINATE IN DELIVERING BENEFITS OR SERVICES
AAEOEADA
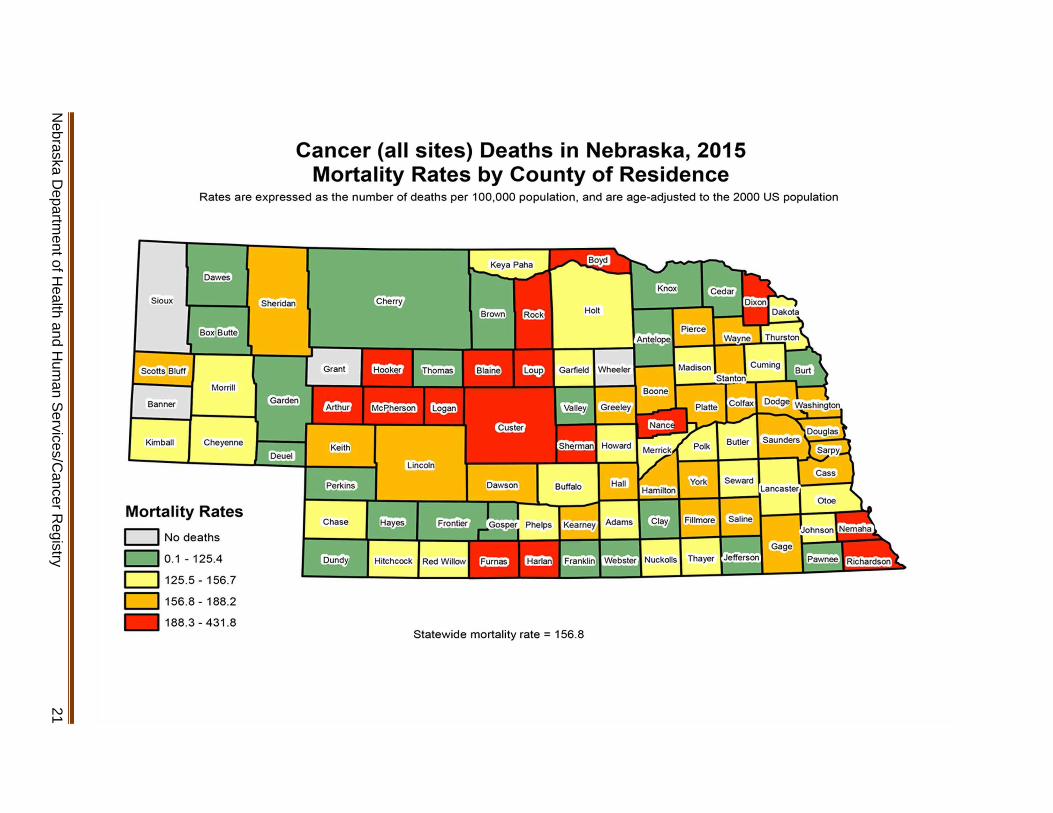
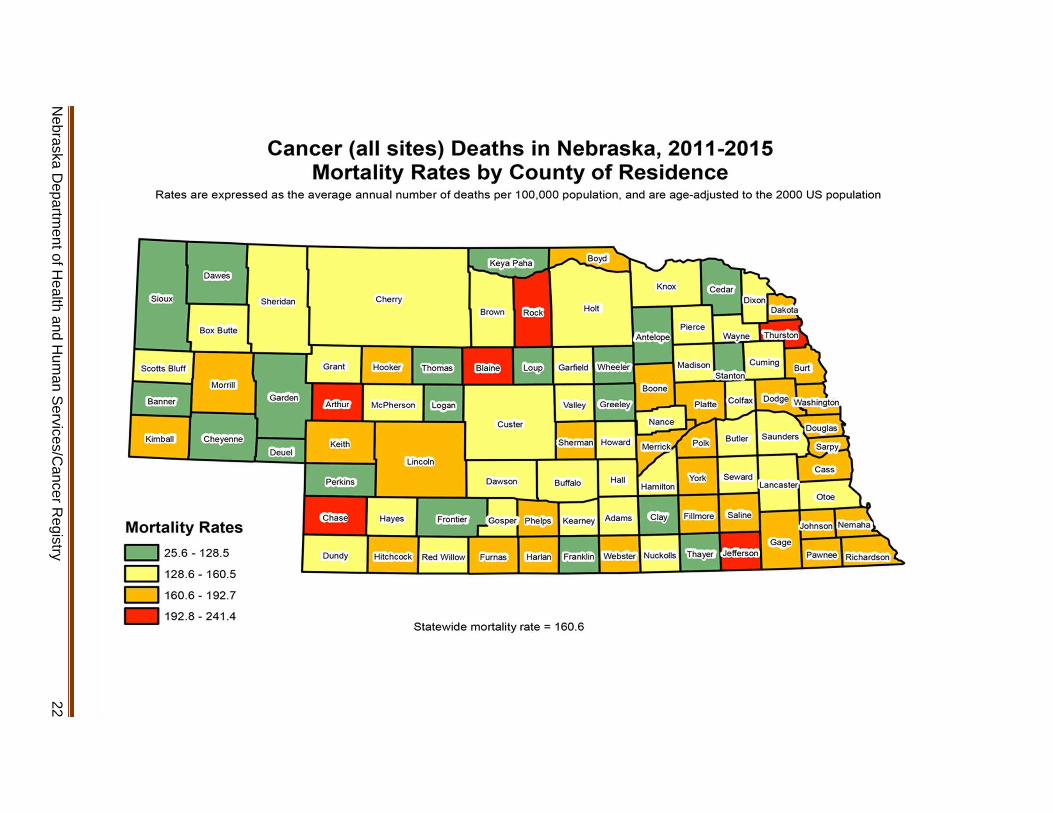
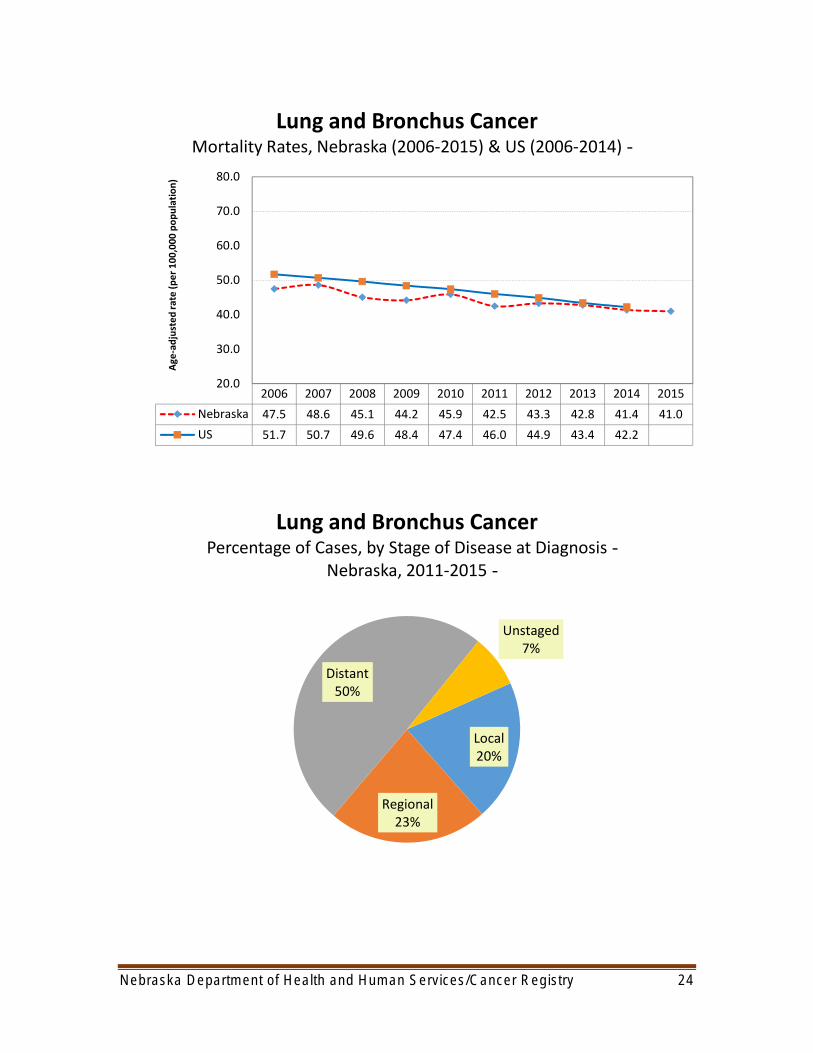
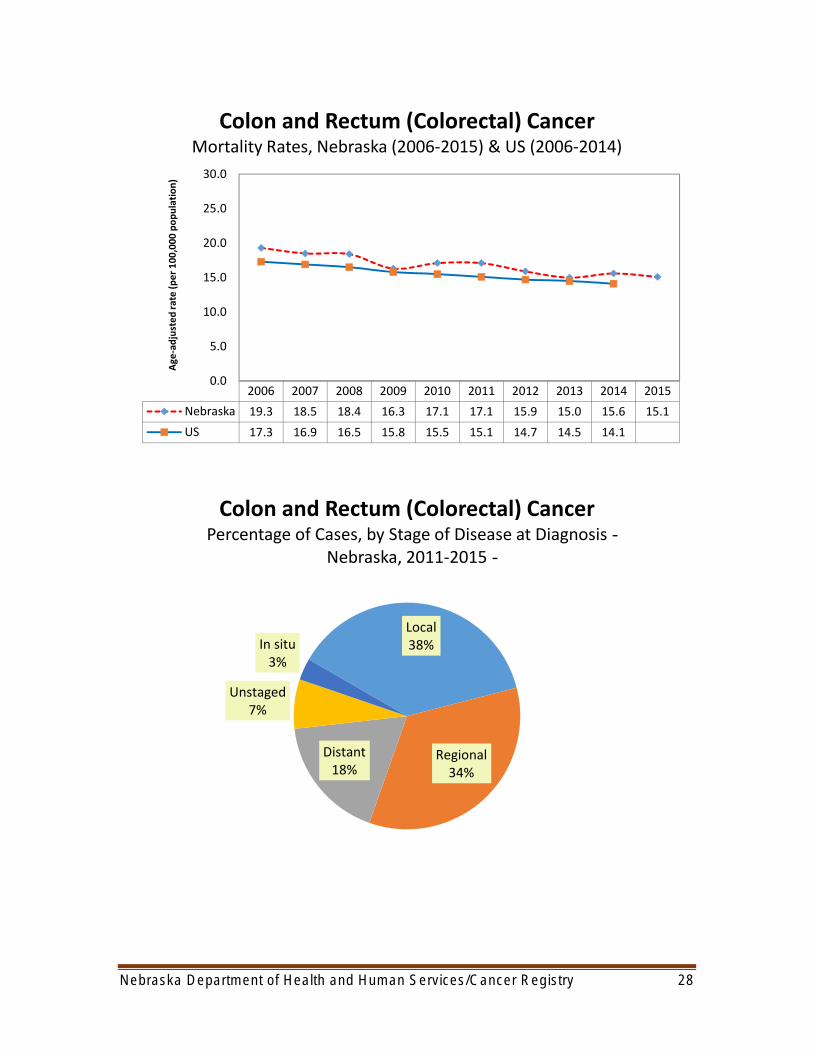
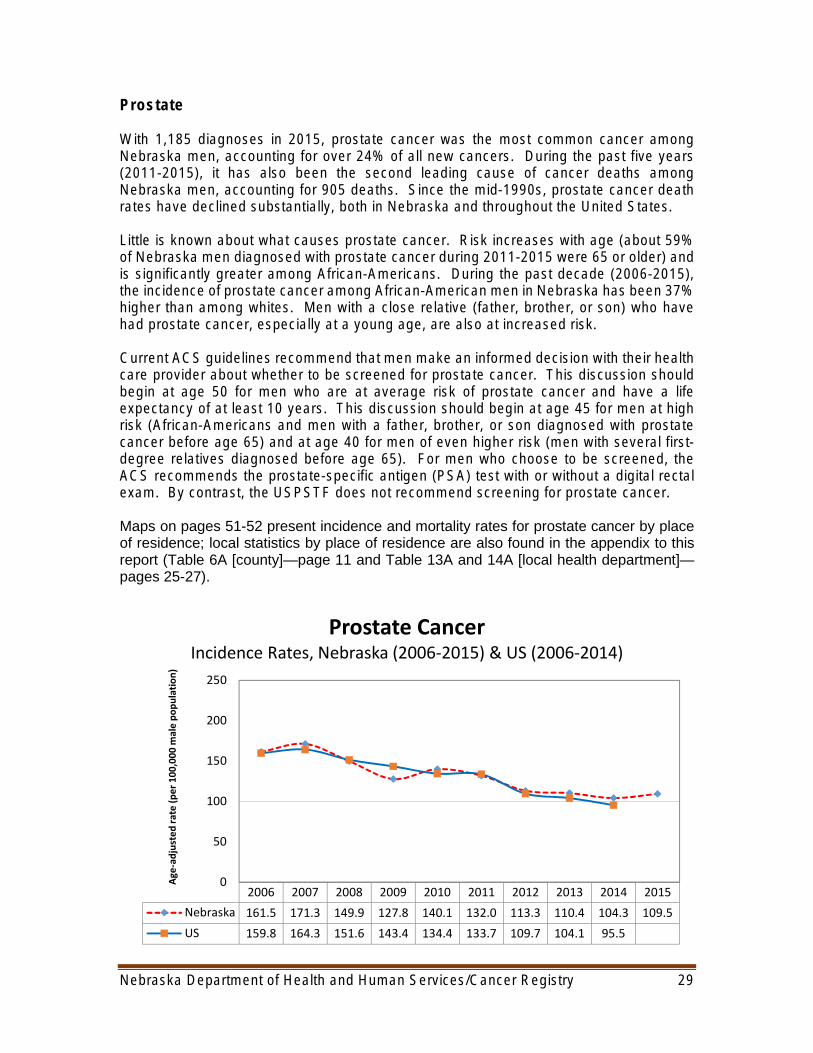
Prostate
With 1185 diagnoses in 2015 prostate cancer was the most common cancer among Nebraska men accounting for over 24 of all new cancers During the past five years (2011-2015) it has also been the second leading cause of cancer deaths among Nebraska men accounting for 905 deaths Since the mid-1990s prostate cancer death rates have declined substantially both in Nebraska and throughout the United States
Little is known about what causes prostate cancer Risk increases with age (about 59 of Nebraska men diagnosed with prostate cancer during 2011-2015 were 65 or older) and is significantly greater among African-Americans During the past decade (2006-2015) the incidence of prostate cancer among African-American men in Nebraska has been 37 higher than among whites Men with a close relative (father brother or son) who have had prostate cancer especially at a young age are also at increased risk
Current ACS guidelines recommend that men make an informed decision with their health care provider about whether to be screened for prostate cancer This discussion should begin at age 50 for men who are at average risk of prostate cancer and have a life expectancy of at least 10 years This discussion should begin at age 45 for men at high risk (African-Americans and men with a father brother or son diagnosed with prostate cancer before age 65) and at age 40 for men of even higher risk (men with several first-degree relatives diagnosed before age 65) For men who choose to be screened the ACS recommends the prostate-specific antigen (PSA) test with or without a digital rectal exam By contrast the USPSTF does not recommend screening for prostate cancer
Maps on pages 51-52 present incidence and mortality rates for prostate cancer by place of residence local statistics by place of residence are also found in the appendix to this report (Table 6A [county]mdashpage 11 and Table 13A and 14A [local health department]mdash pages 25-27)
Prostate CancerIncidence Rates Nebraska (2006-2015) amp US (2006-2014)
0
50
100
150
200
250
Ag
e-a
dju
ste
d r
ate
(p
er
10
00
00
ma
le p
op
ula
tio
n)
2006 2007 2008 2009 2010 2011 2012 2013 2014 2015
Nebraska 1615 1713 1499 1278 1401 1320 1133 1104 1043 1095
US 1598 1643 1516 1434 1344 1337 1097 1041 955
Nebraska Department of Health and Human ServicesCancer Registry 29
Prostate CancerMortality Rates Nebraska (2006-2015) amp US (2006-2014)
100
150
200
250
300
350
400 A
ge
-ad
just
ed
ra
te (
pe
r 1
00
00
0 m
ale
po
pu
lati
on
)
2006 2007 2008 2009 2010 2011 2012 2013 2014 2015
Nebraska 235 248 236 230 200 221 214 217 191 172
US 242 242 230 221 218 208 196 193 191
Prostate CancerPercentage of Cases by Stage of Disease at Diagnosisshy
Nebraska 2011-2015shy
Local
72 Regional
14
Distant
6
Unstaged
8
Nebraska Department of Health and Human ServicesCancer Registry 30
Urinary Bladder
Between 2011 and 2015 2232 Nebraska residents were diagnosed with bladder cancer Bladder cancer occurs much more frequently among men than women (by about a 3-to-1 ratio) and it now ranks as the fourth most common site of cancer diagnoses among Nebraska men However deaths from bladder cancer occur far less often (436 Nebraska residents died from it during 2011-2015) which is the result of a high percentage of early-stage diagnoses and the existence of effective treatments Survival prospects have improved considerably in recent decades to the point where the most current national data show that the five-year relative survival rate for all bladder cancer patients is about 77
Cigarette smoking is the most important known risk factor for bladder cancer Smokers develop bladder cancer three times more often than non-smokers and about half of all cases are attributable to smoking Risk factors also include occupational exposures to certain chemicals used to make dyes (benzidine and beta-naphthylamine) as well as working in the manufacture of rubber and leather Like most cancers the risk of bladder cancer increases with age 76 of the cases that occurred in Nebraska during 2011-2015 were at least 65 years old when diagnosed
Maps on pages 53-54 present incidence and mortality rates for urinary bladder cancer by place of residence local statistics by place of residence are also found in the appendix to this report (Table 7A [county]mdashpage 13 and Table 13A and 14A [local health department]mdashpages 25-27)
Urinary Bladder CancerIncidence Rates Nebraska (2006-2015) amp US (2006-2014)
00
50
100
150
200
250
300
Ag
e-a
dju
ste
d r
ate
(p
er
10
00
00
po
pu
lati
on
)
2006 2007 2008 2009 2010 2011 2012 2013 2014 2015
Nebraska 203 224 203 198 216 223 209 203 195 210
US 213 215 215 213 209 208 207 203 198
Nebraska Department of Health and Human ServicesCancer Registry 31
Urinary Bladder CancerMortality Rates Nebraska (2006-2015) amp US (2006-2014)shy
00
10
20
30
40
50
60 A
ge
-ad
just
ed
ra
te (
pe
r 1
00
00
0 p
op
ula
tio
n)
2006 2007 2008 2009 2010 2011 2012 2013 2014 2015
Nebraska 43 42 40 35 43 45 40 38 37 39
US 44 44 44 44 44 44 44 44 43
Urinary Bladder CancerPercentage of Cases by Stage of Disease at Diagnosisshy
Nebraska 2011-2015shy
Local
34
Regional
7
Distant
3
Unstaged
5
In Situ
51
Nebraska Department of Health and Human ServicesCancer Registry 32
Non-Hodgkin Lymphoma
Lymphomas are cancers that affect the white blood cells of the immune system and are usually classified as either Hodgkin or Non-Hodgkin lymphoma Non-Hodgkin lymphoma is by far the more common disorder of the two accounting for 2120 diagnoses and 634 deaths among Nebraska residents between 2011 and 2015 (for Hodgkin lymphoma the comparable figures are 294 diagnoses and 32 deaths) National statistics indicate that the incidence rate for Non-Hodgkin lymphoma has increased by about 80 since the midshy1970s and some of this increase is related to the appearance of AIDS However both state and national data show that Non-Hodgkin lymphoma deaths have been increasing since at least 1950 which indicates that factors other than AIDS are also responsible
The causes of Non-Hodgkin lymphoma are unknown although there is evidence that viral exposures and reduced immune function are associated with the disease People whose immune systems have been suppressed by drugs particularly those who have received an organ transplant are at high risk of Non-Hodgkin lymphoma and it also occurs more frequently among people with congenital and acquired immunologic disorders including AIDS The increased incidence of the disease among people with congenital disorders of the immune system suggests that hereditary factors may increase risk Some studies have found that occupational exposure to certain herbicides is a risk factor as well
Maps on pages 55-56 present incidence and mortality rates for Non-Hodgkin lymphoma by place of residence local statistics by place of residence are also found in the appendix to this report (Table 8A [county]mdashpage 15 and Table 13A and 14A [local health department]mdashpages 25-27)
Non-Hodgkin LymphomaIncidence Rates Nebraska (2006-2015) amp US (2006-2014)
00
50
100
150
200
250
300
Ag
e-a
dju
ste
d r
ate
(p
er
10
00
00
po
pu
lati
on
)
2006 2007 2008 2009 2010 2011 2012 2013 2014 2015
Nebraska 211 214 198 212 209 219 195 215 186 198
US 197 197 197 198 196 191 189 188 185
Nebraska Department of Health and Human ServicesCancer Registry 33
Non-Hodgkin LymphomaMortality Rates Nebraska (2006-2015) amp US (2006-2014)shy
00
20
40
60
80
100
120 A
ge
-ad
just
ed
ra
te (
pe
r 1
00
00
0 p
op
ula
tio
n)
2006 2007 2008 2009 2010 2011 2012 2013 2014 2015
Nebraska 73 76 64 62 69 66 54 59 56 59
US 67 66 64 63 61 60 59 57 57
Non-Hodgkin LymphomaPercentage of Cases by Stage of Disease at Diagnosisshy
Nebraska 2011-2015shy
Local
25
Regional
15
Distant
49
Unstaged
11
Nebraska Department of Health and Human ServicesCancer Registry 34
Leukemia
Between 2011 and 2015 leukemia accounted for 1463 diagnoses and 757 deaths among Nebraska residents Although leukemia is one of the most common types of cancer diagnosed among children and adolescents over half (57) of the leukemia cases that occurred in Nebraska between 2011 and 2015 were 65 years of age or older at diagnosis There are many different types of leukemia acute lymphocytic leukemia is the most frequently diagnosed among children and teens while acute myeloid and chronic lymphocytic are the most common types among adults Survival times vary widely by type overall the relative five-year survival rate for all leukemia patients in the United States is over 60
The major causes of most types of leukemia are unknown Nevertheless several risk factors have been identified and include genetic abnormalities (such as Down syndrome) exposure to ionizing radiation and workplace exposure to benzene and other related solvents Adult T-cell acute lymphocytic leukemia is strongly associated with infection by a retrovirus the human T-cell lymphomaleukemia virus type I (HTLV-I) Cigarette smoking is a risk factor for acute myeloid leukemia while people who have a family history of chronic lymphocytic leukemia carry an increased risk of the disease themselves
Maps on pages 57-58 present incidence and mortality rates for leukemia by place of residence local statistics by place of residence are also found in the appendix to this report (Table 9A [county]mdashpage 17 and Table 13A and 14A [local health department]mdash pages 25-27)
LeukemiaIncidence Rates Nebraska (2006-2015) amp US (2006-2014)
00
40
80
120
160
200
240
Ag
e-a
dju
ste
d r
ate
(p
er
10
00
00
po
pu
lati
on
)
2006 2007 2008 2009 2010 2011 2012 2013 2014 2015
Nebraska 162 158 141 133 149 141 147 143 145 122
US 134 133 133 134 140 140 139 137 133
Nebraska Department of Health and Human ServicesCancer Registry 35
LeukemiaMortality Rates Nebraska (2006-2015) amp US (2006-2014)
20
40
60
80
100
120 A
ge
-ad
just
ed
ra
te (
pe
r 1
00
00
0 p
op
ula
tio
n)
00 2006 2007 2008 2009 2010 2011 2012 2013 2014 2015
Nebraska 74 68 79 62 63 70 81 65 71 65
US 72 71 71 71 69 69 68 68 66
Leukemia Number of Cases by Histologic Type Nebraska 2011-2015
Nebraska Department of Health and Human ServicesCancer Registry 36
Acute lymphocytic
Chronic lymphocytic
Other lymphocytic
Acute myeloid
Acute monocytic
Chronic myeloid
Other myeloidmonocytic
Other acute leukemia
Aleukemic subleukemic amp NOS 29
24
26
192
34
468
39
502
149
0 100 200 300 400 500
Abbreviation NOS not otherwise specified
600
Kidney and Renal Pelvis
Cancers of the kidney and renal pelvis accounted for 1774 diagnoses in Nebraska between 2011 and 2015 and also accounted for 485 deaths in Nebraska during the same years State and national trends since 1990 show a significant increase in the rate of diagnosis of these cancers but little change in the mortality rate The chances of survival for people with kidney cancer are relatively high with the most current national statistics showing that the five-year relative survival rate for cancers of the kidney and renal pelvis is now over 70
Preventable risk factors for cancer of the kidney include cigarette smoking and obesity Current estimates indicate that cigarette smoking is responsible for about 20 percent of all kidney cancer deaths Kidney cancer is more likely to strike at younger ages than most other types in Nebraska almost half (496) of all cases that were diagnosed during 2011-2015 were under the age of 65 Other non-preventable risk factors for cancer of the kidney include a family history of kidney cancer and high blood pressure However since people with high blood pressure are often treated with drugs it is unclear whether their increased risk is related to their high blood pressure or the drugs Nevertheless people who need drugs to lower their blood pressure should take them
Maps on pages 59-60 present incidence and mortality rates for cancers of the kidney amp renal pelvis by place of residence local statistics by place of residence are also found in the appendix to this report (Table 10A [county]mdashpage 19 and Table 13A and 14A [local health department]mdashpages 25-27)
Kidney and Renal Pelvis Cancer Incidence Rates Nebraska (2006-2015) amp US (2006-2014)
00
40
80
120
160
200
240
Ag
e-a
dju
ste
d r
ate
(p
er
10
00
00
po
pu
lati
on
)
2006 2007 2008 2009 2010 2011 2012 2013 2014 2015
Nebraska 162 165 188 177 183 157 155 166 173 188
US 157 160 163 163 159 160 162 162 162
Nebraska Department of Health and Human ServicesCancer Registry 37
Kidney and Renal Pelvis CancerMortality Rates Nebraska (2006-2015) amp US (2006-2014)shy
00
10
20
30
40
50
60
Ag
e-a
dju
ste
d r
ate
(p
er
10
00
00
po
pu
lati
on
)
2006 2007 2008 2009 2010 2011 2012 2013 2014 2015
Nebraska 45 40 38 48 42 51 41 41 46 44
US 40 40 40 39 39 39 38 39 38
Kidney and Renal Pelvis CancerPercentage of Cases by Stage of Disease at Diagnosisshy
Nebraska 2011-2015shy
Local
61
Regional
16
Distant
16
Unstaged
5
In Situ
2
Nebraska Department of Health and Human ServicesCancer Registry 38
Melanoma of the Skin
There are several different types of skin cancer but melanomas are the most serious Nationally melanomas comprise about 1 of all skin cancer diagnoses but the vast majority of all skin cancer deaths In Nebraska melanomas of the skin accounted for 2235 diagnoses and 310 deaths between 2011 and 2015 The incidence of melanoma continues to increase significantly in Nebraska and throughout the United States Because most melanomas are discovered early in their development and can be surgically removed the relative five-year survival rate is now over 90
Melanoma is related to exposure to ultraviolet radiation (most of which comes from the sun) particularly exposures during childhood that resulted in severe sunburns The risk of developing melanoma is particularly high among people with light skin Sun exposure is not the only risk factor Family history of melanoma and the presence of numerous dysplastic nevi (large moles with irregular coloration and shape) also increase a personrsquos risk of the disease
Skin melanomas are among the most preventable and treatable of all cancers Wearing protective clothing and using sunscreen are the best methods for preventing the disease and children in particular should have such protection In addition early detection can greatly reduce the risk of melanoma mortality Recognition of changes in skin growths or the appearance of new growths is the best way to find melanomas early in their development The ACS suggests that adults practice skin self-examination on a monthly basis and that suspicious lesions should be evaluated promptly by a physician
Maps on pages 61-62 present incidence and mortality rates for melanoma of the skin by place of residence local statistics by place of residence are also found in the appendix to this report (Table 11A [county]mdashpage 21 and Table 13A and 14A [local health department]mdashpages 25-27)
Melanoma of the SkinIncidence Rates Nebraska (2006-2015) amp US (2006-2014)
00
50
100
150
200
250
300
Ag
e-a
dju
ste
d r
ate
(p
er
10
00
00
po
pu
lati
on
)
2006 2007 2008 2009 2010 2011 2012 2013 2014 2015
Nebraska 176 179 183 192 183 197 178 236 235 256
US 191 195 199 202 199 205 205 210 214
Nebraska Department of Health and Human ServicesCancer Registry 39
Melanoma of the SkinMortality Rates Nebraska (2006-2015) amp US (2006-2014)
00
10
20
30
40
50
60 A
ge
-ad
just
ed
ra
te (
pe
r 1
00
00
0 p
op
ula
tio
n)
2006 2007 2008 2009 2010 2011 2012 2013 2014 2015
Nebraska 30 20 39 32 26 27 34 34 25 29
US 27 27 27 28 27 27 27 27 26
Melanoma of the SkinPercentage of Cases by Stage of Disease at Diagnosisshy
Nebraska 2011-2015shy
Local
44
Regional
5
Distant
3
Unstaged
7
In Situ
41
Nebraska Department of Health and Human ServicesCancer Registry 40
Liver and Intrahepatic Bile Ducts
Often when cancer is found in the liver it did not start there but has spread (metastized) from somewhere else in the body In the United States metastatic liver cancer is more common than liver cancer that originates in the liver (referred to as primary liver cancer) In Nebraska primary cancers of the liver and intrahepatic bile ducts accounted for 604 diagnoses and 502 deaths between 2011 and 2015 Diagnosis does not usually occur until the disease is well advanced due to a lack of symptoms As a result survival is poor the most recent national five-year survival rate is less than 20 Both nationally and in Nebraska the incidence and mortality rates for liver cancer have increased steadily during the past decade
The most common risk factor for liver cancer is chronic viral hepatitis (type B and C) Other preventable risk factors include cirrhosis heavy alcohol use obesity exposure to arsenic and vinyl chloride and using anabolic steroids Type 2 diabetes has also been linked with an increased risk of liver cancer usually in cases where other risk factors such as heavy alcohol use andor chronic viral hepatitis are present Non-preventable risk factors for liver cancer include gender raceethnicity and certain inherited metabolic diseases Nebraska statistics show that diagnoses among men outnumber those among women by a ratio of about 31 while incidence rates are significantly higher among African-Americans Native Americans AsianPacific Islanders and Hispanics compared to whites
Maps on pages 63-64 present incidence and mortality rates for cancers of the liver by place of residence local statistics by place of residence are also found in the appendix to this report (Table 12A [county]mdashpage 23 and Table 13A and 14A [local health department]mdashpages 25-27)
Liver amp Intrahepatic Bile Ducts CancerIncidence Rates Nebraska (2006-2015) amp US (2006-2014)
00
30
60
90
120
150
180
Ag
e-a
dju
ste
d r
ate
(p
er
10
00
00
po
pu
lati
on
)
2006 2007 2008 2009 2010 2011 2012 2013 2014 2015
Nebraska 42 42 55 50 59 57 56 58 46 59
US 63 67 69 73 74 76 79 80 81
Nebraska Department of Health and Human ServicesCancer Registry 41
Liver amp Intrahepatic Bile Ducts CancerMortality Rates Nebraska (2006-2015) amp US (2006-2014)
00
30
60
90
120
150 A
ge
-ad
just
ed
ra
te (
pe
r 1
00
00
0 p
op
ula
tio
n)
2006 2007 2008 2009 2010 2011 2012 2013 2014 2015
Nebraska 43 38 33 45 50 53 46 46 46 42
US 53 54 56 58 59 61 63 65 65
Liver amp Intrahepatic Bile Ducts CancerPercentage of Cases by Stage of Disease at Diagnosisshy
Nebraska 2011-2015shy
Local
44 Regional
27
Distant
15
Unstagedshy14shy
Nebraska Department of Health and Human ServicesCancer Registry 42
This page intentionally left blank
Nebraska Department of Health and Human ServicesCancer Registry 43
INCIDENCE amp MORTALITY RATE MAPS FOR SELECTED PRIMARY SITES
Nebraska Department of Health and Human ServicesCancer Registry 44
Primary Site Contents Page
Lung amp bronchus
Incidence Mortality
45 46
Female breast
Incidence Mortality
47 48
Colon amp rectum (colorectal)
Incidence Mortality
49 50
Prostate
Incidence Mortality
51 52
Urinary bladder
Incidence Mortality
53 54
Non-Hodgkin lymphoma
Incidence Mortality
55 56
Leukemia
Incidence Mortality
57 58
Kidney amp renal pelvis
Incidence Mortality
59 60
Melanoma of the skin
Incidence Mortality
61 62
Liver amp intrahepatic bile ducts
Incidence Mortality
63 64
Lung amp Bronchus Cancer Diagnoses in Nebraska 2011-2015 Incidence Rates by Local Health Department Region
Rates are expressed as the average annual number of new cases per 100000 population and are age-adjusted to the 2000 U S population
Incidence Rates
455 - 488
489 - 558
559 - 633
Statewide incidence rate=590 634 - 699
Nebraska D
epartment of H
ealth and Hum
an ServicesC
ancer Registry
45
Lung amp Bronchus Cancer Deaths in Nebraska 2011-2015 Mortality Rates by Local Health Department Region
Rates are expressed as the average annual number of deaths per 100000 population and age-adjusted to the 2000 U S population
Mortality Rates
305 - 369
370 - 400
433 - 491 Statew ide mortal ity rate=420
Nebraska D
epartment of H
ealth and Hum
an ServicesC
ancer Registry
46
Nebraska D
epartment of H
ealth and Hum
an ServicesC
ancer Registry
47
Nebraska D
epartment of H
ealth and Hum
an ServicesC
ancer Registry
48
Nebraska D
epartment of H
ealth and Hum
an ServicesC
ancer Registry
49
Nebraska D
epartment of H
ealth and Hum
an ServicesC
ancer Registry
50
Nebraska D
epartment of H
ealth and Hum
an ServicesC
ancer Registry
51
Nebraska D
epartment of H
ealth and Hum
an ServicesC
ancer Registry
52
Nebraska D
epartment of H
ealth and Hum
an ServicesC
ancer Registry
53
Nebraska D
epartment of H
ealth and Hum
an ServicesC
ancer Registry
54
Non-Hodgkin Lymphoma Diagnoses in Nebraska 2011-2015 Incidence Rates by Local Health Department Region
Rates are expressed as the average annual number of new cases per 100000 population and are age-adj usted to the 2000 U S population
Incidence Rates
140 - 180
181 - 209
Statewide incidence rate=203 221 - 298
Nebraska D
epartment of H
ealth and Hum
an ServicesC
ancer Registry
55
Nebraska D
epartment of H
ealth and Hum
an ServicesC
ancer Registry
56
Nebraska D
epartment of H
ealth and Hum
an ServicesC
ancer Registry
57
Nebraska D
epartment of H
ealth and Hum
an ServicesC
ancer Registry
58
Nebraska D
epartment of H
ealth and Hum
an ServicesC
ancer Registry
59
Kidney amp Renal Pelvis Cancer Deaths in Nebraska 2011-2015 Mortality Rates by Local Health Department Region
Rates are expressed as the average annual number of deaths per 100000 population and age-adjusted to the 2000 U S population
Mortality Rates
2 4 - 3 8
39 - 42
43 - 55
56 - 69 Statewide mortality rate=45
Nebraska D
epartment of H
ealth and Hum
an ServicesC
ancer Registry
60
Nebraska D
epartment of H
ealth and Hum
an ServicesC
ancer Registry
61
Nebraska D
epartment of H
ealth and Hum
an ServicesC
ancer Registry
62
Nebraska D
epartment of H
ealth and Hum
an ServicesC
ancer Registry
63
Liver amp lntrahepatic Bile Ducts Cancer Deaths in Nebraska 2011-2015 Mortality Rates by Local Health Department Region
Rates are expressed as the average annual number of deaths per 100000 population and age-adjusted to the 2000 U S population
North Central
---1 West Central
Mortality Rates
12 - 36
37-41
5 3 - 9 3 Statewide mortality rate=4 7
Nebraska D
epartment of H
ealth and Hum
an ServicesC
ancer Registry
64
REFERENCES
American Cancer Society American Cancer Society Recommendations for the Early Detection of Breast Cancer 2017 Available at httpswwwcancerorgcancerbreast-cancerscreening-testsshyand-early-detectionamerican-cancer-society-recommendations-for-the-early-detection-of-breastshycancerhtml
American Cancer Society Cancer Facts and Figures 2018 Atlanta GA American Cancer Society 2018 Available at httpswwwcancerorgcontentdamcancer-orgresearchcancer-facts-and-statisticsannualshycancer-facts-and-figures2018cancer-facts-and-figures-2018pdf
American Cancer Society Colorectal Cancer Screening Guidelines 2018 Available at httpswwwcancerorghealth-care-professionalsamerican-cancer-society-prevention-earlyshydetection-guidelinescolorectal-cancer-screening-guidelineshtml
Fritz A Percy C Jack A Shanmugaratnam K Sobin L Parkin DM Whelan S International Classification of Diseases for Oncology 3rd edition (US interim version 2000) Geneva Switzerland World Health Organization 2000
National Cancer Institute SEER Cancer Stat Facts Bethesda MD National Cancer Institute Accessed on February 21 2018 Available at httpsseercancergovstatfacts
United States Cancer Statistics 1999-2014 Incidence CDC WONDER On-line Database US Department of Health and Human Services Centers for Disease Control and Prevention and National Cancer Institute 2016 Available at httpswondercdcgovcancer-v2014HTML
United States Cancer Statistics 1999-2014 Mortality CDC WONDER On-line Database US Department of Health and Human Services Centers for Disease Control and Prevention 2016 Available at httpswondercdcgovcancermort-v2014HTML
United States Department of Health and Human Services The Health Consequences of Smoking A Report of the Surgeon General US Department of Health and Human Services Centers for Disease Control and Prevention National Center for Chronic Disease Prevention and Health Promotion Office on Smoking and Health 2004 Available at httpswwwcdcgovtobaccodata_statisticssgr2004complete_reportindexhtm
US Preventive Services Task Force Final Recommendation Statement Breast Cancer Screening November 2016 Available at httpwwwuspreventiveservicestaskforceorgPageDocumentRecommendationStatementFinalb reast-cancer-screening1
US Preventive Services Task Force Final Recommendation Statement Colorectal Cancer Screening June 2017 Available at httpswwwuspreventiveservicestaskforceorgPageDocumentRecommendationStatementFinal colorectal-cancer-screening2
US Preventive Services Task Force Final Recommendation Statement Lung Cancer Screening December 2016 Available at httpwwwuspreventiveservicestaskforceorgPageDocumentRecommendationStatementFinall ung-cancer-screening
World Health Organization Manual of the International Statistical Classification of Diseases and Related Health Problems 10th revision Geneva Switzerland World Health Organization 1992
Nebraska Department of Health and Human ServicesCancer Registry 65
REPORTING FACILITIES
Ainsworth--Brown County Hospital Albion--Boone County Health Center Alliance--Box Butte General Hospital Alma--Harlan County Health System Atkinson--West Holt Memorial Hospital Inc Auburn--Nemaha County Hospital Aurora--Memorial Hospital Bassett--Rock County Hospital Beatrice--Beatrice Community Hospital amp Health Center Inc Benkelman--Dundy County Hospital Blair--Memorial Community Hospital Bridgeport--Morrill County Community Hospital Broken Bow--Jennie Melham Memorial Medical Ctr Callaway--Callaway District Hospital Cambridge--Tri Valley Health System Central City--Litzenberg Memorial County Hospital Chadron--Chadron Community Hospital amp Health Services Columbus--Columbus Community Hospital Inc Cozad--Cozad Community Hospital Creighton--Creighton Area Health Services Crete--Crete Area Medical Center David City--Butler County Health Care Center Fairbury--Jefferson Community Health Center Inc Falls City--Community Medical Center Inc Franklin--Franklin County Memorial Hospital Fremont--Fremont Area Medical Center Friend--Warren Memorial Hospital Geneva--Fillmore County Hospital Genoa--Genoa Community HospitalLTC Gordon--Gordon Memorial Hospital District Gothenburg--Gothenburg Memorial Hospital Grand Island--CHI Health St Francis Grant--Perkins County Health Services Hastings--Mary Lanning Memorial Hospital Hebron--Thayer County Health Services Henderson--Henderson Health Care Services Holdrege--Phelps Memorial Health Center Imperial--Chase County Community Hospital Kearney--CHI Health Good Samaritan Kearney--CHI Health Good Samaritan Pathology Kimball--Kimball Health Services amp Hospital Lexington--Tri-County Area Hospital District Lincoln--Bryan-LGH Medical Center East amp West Lincoln--CHI Health Saint Elizabeth Lincoln--Pathology Medical Services Lincoln--Williamsburg Radiation Center Lincoln--CHI Health Nebraska Heart Lincoln--UNMC College of Dentistry Lynch--Niobrara Valley Hospital Corp McCook--Community Hospital Minden--Kearney County Health Services Nebraska City--CHI Health St Marys Neligh--Antelope Memorial Hospital
Norfolk--Faith Regional Health Services East amp West North Platte--Great Plains Regional Medical Center North Platte--Pathology Services Oakland--Oakland Memorial Hospital Ogallala--Ogallala Community Hospital Omaha--CHI Health Bergan Mercy Omaha--CHI Health Immanuel Omaha--Childrens Hospital Omaha--VA Nebraska-Western Iowa Health Care System Omaha--Methodist Hospital Pathology Center Omaha--Nebraska Medical Center Omaha--Nebraska Methodist Hospital Omaha--CHI Health Creighton University Med Ctr Omaha--Boys Town National Research Hospital Omaha--CHI Health Lakeside Omaha--CHI Health Bergan Mercy Pathology Omaha--Bishop Clarkson Hospital Pathology Omaha--Creighton Pathology Associates Omaha--Physicians Lab ONeill--Avera St Anthonys Hospital Ord--Valley County Hospital Osceola--Annie Jeffrey Memorial County Health Ctr Oshkosh--Garden County Health Services Osmond--Osmond General Hospital Papillion--CHI Health Midlands Pawnee City--Pawnee County Memorial Hospital Pender--Pender Community Hospital Plainview--CHI Health Plainview Red Cloud--Webster County Community Hospital Schuyler--CHI Health Schuyler Scottsbluff--Regional West Medical Center Scottsbluff--Western Pathology Consultants Seward--Memorial Hospital Sidney--Memorial Health Center St Paul--Howard County Community Hospital Superior--Brodstone Memorial Hospital Syracuse--Community Memorial Hospital Tecumseh--Johnson County Hospital Tilden--Tilden Community Hospital Valentine--Cherry County Hospital Wahoo--Saunders County Health Services Wayne--Providence Medical Center West Point--St Francis Memorial Hospital Winnebago--USPHS Indian Hospital York--York General Hospital
Other States Sioux City IA--Mercy Medical Center
State cancer registries participating in the National Interstate Data Exchange Agreement and the state cancer registries of Illinois Kansas Minnesota Missouri and South Dakota
Nebraska Department of Health and Human ServicesCancer Registry 66
THE NEBRASKA DEPARTMENT OF HEALTH AND HUMAN SERVICES IS COMMITTED TO AFFIRMATIVE ACTION
EQUAL EMPLOYMENT OPPORTUNITIES AND DOES NOT DISCRIMINATE IN DELIVERING BENEFITS OR SERVICES
AAEOEADA
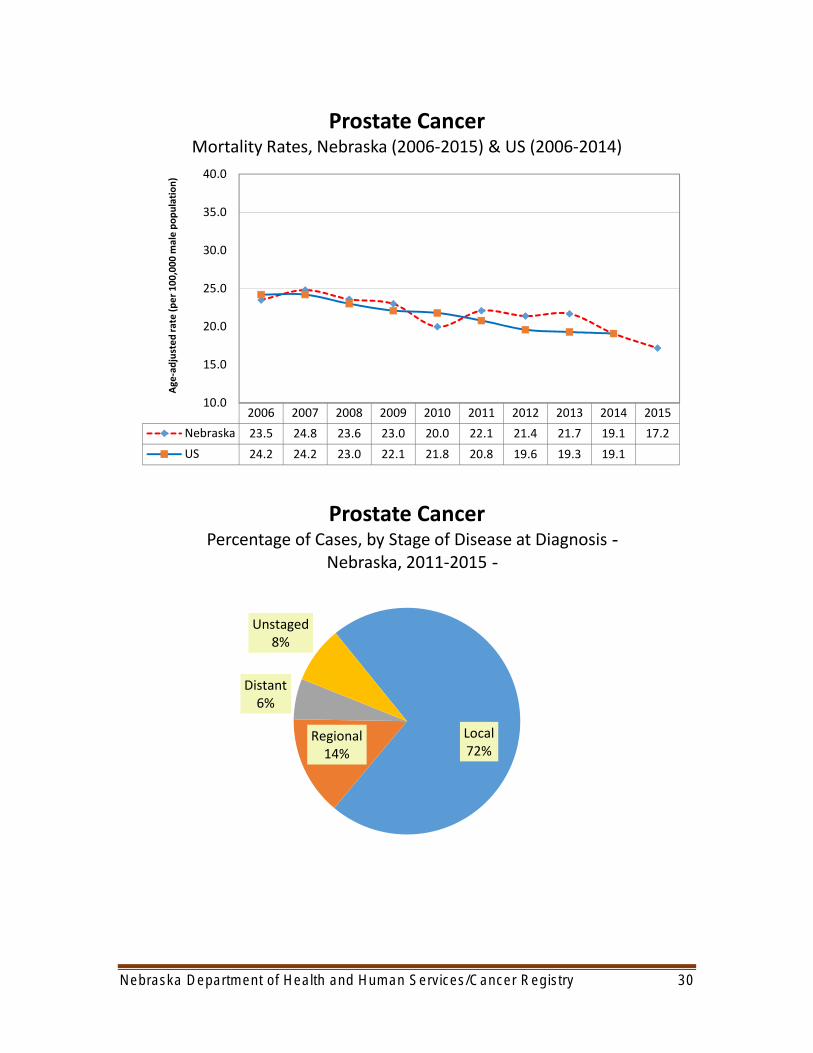
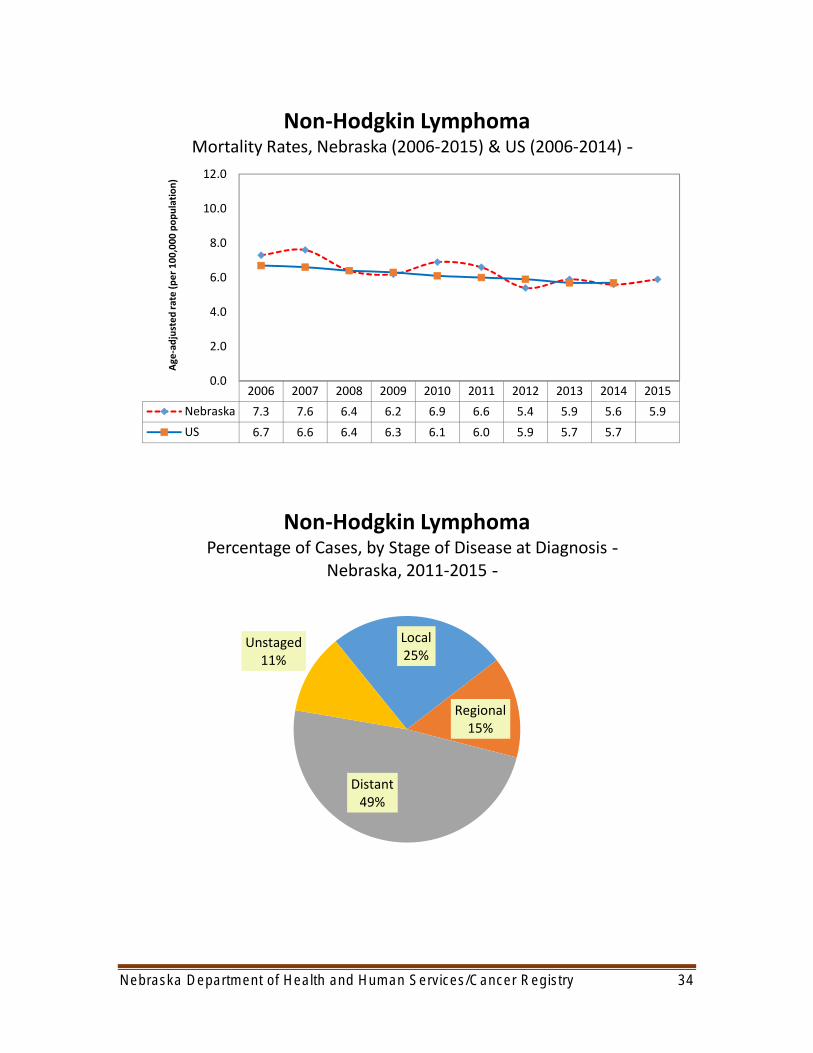

Leukemia
Between 2011 and 2015 leukemia accounted for 1463 diagnoses and 757 deaths among Nebraska residents Although leukemia is one of the most common types of cancer diagnosed among children and adolescents over half (57) of the leukemia cases that occurred in Nebraska between 2011 and 2015 were 65 years of age or older at diagnosis There are many different types of leukemia acute lymphocytic leukemia is the most frequently diagnosed among children and teens while acute myeloid and chronic lymphocytic are the most common types among adults Survival times vary widely by type overall the relative five-year survival rate for all leukemia patients in the United States is over 60
The major causes of most types of leukemia are unknown Nevertheless several risk factors have been identified and include genetic abnormalities (such as Down syndrome) exposure to ionizing radiation and workplace exposure to benzene and other related solvents Adult T-cell acute lymphocytic leukemia is strongly associated with infection by a retrovirus the human T-cell lymphomaleukemia virus type I (HTLV-I) Cigarette smoking is a risk factor for acute myeloid leukemia while people who have a family history of chronic lymphocytic leukemia carry an increased risk of the disease themselves
Maps on pages 57-58 present incidence and mortality rates for leukemia by place of residence local statistics by place of residence are also found in the appendix to this report (Table 9A [county]mdashpage 17 and Table 13A and 14A [local health department]mdash pages 25-27)
LeukemiaIncidence Rates Nebraska (2006-2015) amp US (2006-2014)
00
40
80
120
160
200
240
Ag
e-a
dju
ste
d r
ate
(p
er
10
00
00
po
pu
lati
on
)
2006 2007 2008 2009 2010 2011 2012 2013 2014 2015
Nebraska 162 158 141 133 149 141 147 143 145 122
US 134 133 133 134 140 140 139 137 133
Nebraska Department of Health and Human ServicesCancer Registry 35
LeukemiaMortality Rates Nebraska (2006-2015) amp US (2006-2014)
20
40
60
80
100
120 A
ge
-ad
just
ed
ra
te (
pe
r 1
00
00
0 p
op
ula
tio
n)
00 2006 2007 2008 2009 2010 2011 2012 2013 2014 2015
Nebraska 74 68 79 62 63 70 81 65 71 65
US 72 71 71 71 69 69 68 68 66
Leukemia Number of Cases by Histologic Type Nebraska 2011-2015
Nebraska Department of Health and Human ServicesCancer Registry 36
Acute lymphocytic
Chronic lymphocytic
Other lymphocytic
Acute myeloid
Acute monocytic
Chronic myeloid
Other myeloidmonocytic
Other acute leukemia
Aleukemic subleukemic amp NOS 29
24
26
192
34
468
39
502
149
0 100 200 300 400 500
Abbreviation NOS not otherwise specified
600
Kidney and Renal Pelvis
Cancers of the kidney and renal pelvis accounted for 1774 diagnoses in Nebraska between 2011 and 2015 and also accounted for 485 deaths in Nebraska during the same years State and national trends since 1990 show a significant increase in the rate of diagnosis of these cancers but little change in the mortality rate The chances of survival for people with kidney cancer are relatively high with the most current national statistics showing that the five-year relative survival rate for cancers of the kidney and renal pelvis is now over 70
Preventable risk factors for cancer of the kidney include cigarette smoking and obesity Current estimates indicate that cigarette smoking is responsible for about 20 percent of all kidney cancer deaths Kidney cancer is more likely to strike at younger ages than most other types in Nebraska almost half (496) of all cases that were diagnosed during 2011-2015 were under the age of 65 Other non-preventable risk factors for cancer of the kidney include a family history of kidney cancer and high blood pressure However since people with high blood pressure are often treated with drugs it is unclear whether their increased risk is related to their high blood pressure or the drugs Nevertheless people who need drugs to lower their blood pressure should take them
Maps on pages 59-60 present incidence and mortality rates for cancers of the kidney amp renal pelvis by place of residence local statistics by place of residence are also found in the appendix to this report (Table 10A [county]mdashpage 19 and Table 13A and 14A [local health department]mdashpages 25-27)
Kidney and Renal Pelvis Cancer Incidence Rates Nebraska (2006-2015) amp US (2006-2014)
00
40
80
120
160
200
240
Ag
e-a
dju
ste
d r
ate
(p
er
10
00
00
po
pu
lati
on
)
2006 2007 2008 2009 2010 2011 2012 2013 2014 2015
Nebraska 162 165 188 177 183 157 155 166 173 188
US 157 160 163 163 159 160 162 162 162
Nebraska Department of Health and Human ServicesCancer Registry 37
Kidney and Renal Pelvis CancerMortality Rates Nebraska (2006-2015) amp US (2006-2014)shy
00
10
20
30
40
50
60
Ag
e-a
dju
ste
d r
ate
(p
er
10
00
00
po
pu
lati
on
)
2006 2007 2008 2009 2010 2011 2012 2013 2014 2015
Nebraska 45 40 38 48 42 51 41 41 46 44
US 40 40 40 39 39 39 38 39 38
Kidney and Renal Pelvis CancerPercentage of Cases by Stage of Disease at Diagnosisshy
Nebraska 2011-2015shy
Local
61
Regional
16
Distant
16
Unstaged
5
In Situ
2
Nebraska Department of Health and Human ServicesCancer Registry 38
Melanoma of the Skin
There are several different types of skin cancer but melanomas are the most serious Nationally melanomas comprise about 1 of all skin cancer diagnoses but the vast majority of all skin cancer deaths In Nebraska melanomas of the skin accounted for 2235 diagnoses and 310 deaths between 2011 and 2015 The incidence of melanoma continues to increase significantly in Nebraska and throughout the United States Because most melanomas are discovered early in their development and can be surgically removed the relative five-year survival rate is now over 90
Melanoma is related to exposure to ultraviolet radiation (most of which comes from the sun) particularly exposures during childhood that resulted in severe sunburns The risk of developing melanoma is particularly high among people with light skin Sun exposure is not the only risk factor Family history of melanoma and the presence of numerous dysplastic nevi (large moles with irregular coloration and shape) also increase a personrsquos risk of the disease
Skin melanomas are among the most preventable and treatable of all cancers Wearing protective clothing and using sunscreen are the best methods for preventing the disease and children in particular should have such protection In addition early detection can greatly reduce the risk of melanoma mortality Recognition of changes in skin growths or the appearance of new growths is the best way to find melanomas early in their development The ACS suggests that adults practice skin self-examination on a monthly basis and that suspicious lesions should be evaluated promptly by a physician
Maps on pages 61-62 present incidence and mortality rates for melanoma of the skin by place of residence local statistics by place of residence are also found in the appendix to this report (Table 11A [county]mdashpage 21 and Table 13A and 14A [local health department]mdashpages 25-27)
Melanoma of the SkinIncidence Rates Nebraska (2006-2015) amp US (2006-2014)
00
50
100
150
200
250
300
Ag
e-a
dju
ste
d r
ate
(p
er
10
00
00
po
pu
lati
on
)
2006 2007 2008 2009 2010 2011 2012 2013 2014 2015
Nebraska 176 179 183 192 183 197 178 236 235 256
US 191 195 199 202 199 205 205 210 214
Nebraska Department of Health and Human ServicesCancer Registry 39
Melanoma of the SkinMortality Rates Nebraska (2006-2015) amp US (2006-2014)
00
10
20
30
40
50
60 A
ge
-ad
just
ed
ra
te (
pe
r 1
00
00
0 p
op
ula
tio
n)
2006 2007 2008 2009 2010 2011 2012 2013 2014 2015
Nebraska 30 20 39 32 26 27 34 34 25 29
US 27 27 27 28 27 27 27 27 26
Melanoma of the SkinPercentage of Cases by Stage of Disease at Diagnosisshy
Nebraska 2011-2015shy
Local
44
Regional
5
Distant
3
Unstaged
7
In Situ
41
Nebraska Department of Health and Human ServicesCancer Registry 40
Liver and Intrahepatic Bile Ducts
Often when cancer is found in the liver it did not start there but has spread (metastized) from somewhere else in the body In the United States metastatic liver cancer is more common than liver cancer that originates in the liver (referred to as primary liver cancer) In Nebraska primary cancers of the liver and intrahepatic bile ducts accounted for 604 diagnoses and 502 deaths between 2011 and 2015 Diagnosis does not usually occur until the disease is well advanced due to a lack of symptoms As a result survival is poor the most recent national five-year survival rate is less than 20 Both nationally and in Nebraska the incidence and mortality rates for liver cancer have increased steadily during the past decade
The most common risk factor for liver cancer is chronic viral hepatitis (type B and C) Other preventable risk factors include cirrhosis heavy alcohol use obesity exposure to arsenic and vinyl chloride and using anabolic steroids Type 2 diabetes has also been linked with an increased risk of liver cancer usually in cases where other risk factors such as heavy alcohol use andor chronic viral hepatitis are present Non-preventable risk factors for liver cancer include gender raceethnicity and certain inherited metabolic diseases Nebraska statistics show that diagnoses among men outnumber those among women by a ratio of about 31 while incidence rates are significantly higher among African-Americans Native Americans AsianPacific Islanders and Hispanics compared to whites
Maps on pages 63-64 present incidence and mortality rates for cancers of the liver by place of residence local statistics by place of residence are also found in the appendix to this report (Table 12A [county]mdashpage 23 and Table 13A and 14A [local health department]mdashpages 25-27)
Liver amp Intrahepatic Bile Ducts CancerIncidence Rates Nebraska (2006-2015) amp US (2006-2014)
00
30
60
90
120
150
180
Ag
e-a
dju
ste
d r
ate
(p
er
10
00
00
po
pu
lati
on
)
2006 2007 2008 2009 2010 2011 2012 2013 2014 2015
Nebraska 42 42 55 50 59 57 56 58 46 59
US 63 67 69 73 74 76 79 80 81
Nebraska Department of Health and Human ServicesCancer Registry 41
Liver amp Intrahepatic Bile Ducts CancerMortality Rates Nebraska (2006-2015) amp US (2006-2014)
00
30
60
90
120
150 A
ge
-ad
just
ed
ra
te (
pe
r 1
00
00
0 p
op
ula
tio
n)
2006 2007 2008 2009 2010 2011 2012 2013 2014 2015
Nebraska 43 38 33 45 50 53 46 46 46 42
US 53 54 56 58 59 61 63 65 65
Liver amp Intrahepatic Bile Ducts CancerPercentage of Cases by Stage of Disease at Diagnosisshy
Nebraska 2011-2015shy
Local
44 Regional
27
Distant
15
Unstagedshy14shy
Nebraska Department of Health and Human ServicesCancer Registry 42
This page intentionally left blank
Nebraska Department of Health and Human ServicesCancer Registry 43
INCIDENCE amp MORTALITY RATE MAPS FOR SELECTED PRIMARY SITES
Nebraska Department of Health and Human ServicesCancer Registry 44
Primary Site Contents Page
Lung amp bronchus
Incidence Mortality
45 46
Female breast
Incidence Mortality
47 48
Colon amp rectum (colorectal)
Incidence Mortality
49 50
Prostate
Incidence Mortality
51 52
Urinary bladder
Incidence Mortality
53 54
Non-Hodgkin lymphoma
Incidence Mortality
55 56
Leukemia
Incidence Mortality
57 58
Kidney amp renal pelvis
Incidence Mortality
59 60
Melanoma of the skin
Incidence Mortality
61 62
Liver amp intrahepatic bile ducts
Incidence Mortality
63 64
Lung amp Bronchus Cancer Diagnoses in Nebraska 2011-2015 Incidence Rates by Local Health Department Region
Rates are expressed as the average annual number of new cases per 100000 population and are age-adjusted to the 2000 U S population
Incidence Rates
455 - 488
489 - 558
559 - 633
Statewide incidence rate=590 634 - 699
Nebraska D
epartment of H
ealth and Hum
an ServicesC
ancer Registry
45
Lung amp Bronchus Cancer Deaths in Nebraska 2011-2015 Mortality Rates by Local Health Department Region
Rates are expressed as the average annual number of deaths per 100000 population and age-adjusted to the 2000 U S population
Mortality Rates
305 - 369
370 - 400
433 - 491 Statew ide mortal ity rate=420
Nebraska D
epartment of H
ealth and Hum
an ServicesC
ancer Registry
46
Nebraska D
epartment of H
ealth and Hum
an ServicesC
ancer Registry
47
Nebraska D
epartment of H
ealth and Hum
an ServicesC
ancer Registry
48
Nebraska D
epartment of H
ealth and Hum
an ServicesC
ancer Registry
49
Nebraska D
epartment of H
ealth and Hum
an ServicesC
ancer Registry
50
Nebraska D
epartment of H
ealth and Hum
an ServicesC
ancer Registry
51
Nebraska D
epartment of H
ealth and Hum
an ServicesC
ancer Registry
52
Nebraska D
epartment of H
ealth and Hum
an ServicesC
ancer Registry
53
Nebraska D
epartment of H
ealth and Hum
an ServicesC
ancer Registry
54
Non-Hodgkin Lymphoma Diagnoses in Nebraska 2011-2015 Incidence Rates by Local Health Department Region
Rates are expressed as the average annual number of new cases per 100000 population and are age-adj usted to the 2000 U S population
Incidence Rates
140 - 180
181 - 209
Statewide incidence rate=203 221 - 298
Nebraska D
epartment of H
ealth and Hum
an ServicesC
ancer Registry
55
Nebraska D
epartment of H
ealth and Hum
an ServicesC
ancer Registry
56
Nebraska D
epartment of H
ealth and Hum
an ServicesC
ancer Registry
57
Nebraska D
epartment of H
ealth and Hum
an ServicesC
ancer Registry
58
Nebraska D
epartment of H
ealth and Hum
an ServicesC
ancer Registry
59
Kidney amp Renal Pelvis Cancer Deaths in Nebraska 2011-2015 Mortality Rates by Local Health Department Region
Rates are expressed as the average annual number of deaths per 100000 population and age-adjusted to the 2000 U S population
Mortality Rates
2 4 - 3 8
39 - 42
43 - 55
56 - 69 Statewide mortality rate=45
Nebraska D
epartment of H
ealth and Hum
an ServicesC
ancer Registry
60
Nebraska D
epartment of H
ealth and Hum
an ServicesC
ancer Registry
61
Nebraska D
epartment of H
ealth and Hum
an ServicesC
ancer Registry
62
Nebraska D
epartment of H
ealth and Hum
an ServicesC
ancer Registry
63
Liver amp lntrahepatic Bile Ducts Cancer Deaths in Nebraska 2011-2015 Mortality Rates by Local Health Department Region
Rates are expressed as the average annual number of deaths per 100000 population and age-adjusted to the 2000 U S population
North Central
---1 West Central
Mortality Rates
12 - 36
37-41
5 3 - 9 3 Statewide mortality rate=4 7
Nebraska D
epartment of H
ealth and Hum
an ServicesC
ancer Registry
64
REFERENCES
American Cancer Society American Cancer Society Recommendations for the Early Detection of Breast Cancer 2017 Available at httpswwwcancerorgcancerbreast-cancerscreening-testsshyand-early-detectionamerican-cancer-society-recommendations-for-the-early-detection-of-breastshycancerhtml
American Cancer Society Cancer Facts and Figures 2018 Atlanta GA American Cancer Society 2018 Available at httpswwwcancerorgcontentdamcancer-orgresearchcancer-facts-and-statisticsannualshycancer-facts-and-figures2018cancer-facts-and-figures-2018pdf
American Cancer Society Colorectal Cancer Screening Guidelines 2018 Available at httpswwwcancerorghealth-care-professionalsamerican-cancer-society-prevention-earlyshydetection-guidelinescolorectal-cancer-screening-guidelineshtml
Fritz A Percy C Jack A Shanmugaratnam K Sobin L Parkin DM Whelan S International Classification of Diseases for Oncology 3rd edition (US interim version 2000) Geneva Switzerland World Health Organization 2000
National Cancer Institute SEER Cancer Stat Facts Bethesda MD National Cancer Institute Accessed on February 21 2018 Available at httpsseercancergovstatfacts
United States Cancer Statistics 1999-2014 Incidence CDC WONDER On-line Database US Department of Health and Human Services Centers for Disease Control and Prevention and National Cancer Institute 2016 Available at httpswondercdcgovcancer-v2014HTML
United States Cancer Statistics 1999-2014 Mortality CDC WONDER On-line Database US Department of Health and Human Services Centers for Disease Control and Prevention 2016 Available at httpswondercdcgovcancermort-v2014HTML
United States Department of Health and Human Services The Health Consequences of Smoking A Report of the Surgeon General US Department of Health and Human Services Centers for Disease Control and Prevention National Center for Chronic Disease Prevention and Health Promotion Office on Smoking and Health 2004 Available at httpswwwcdcgovtobaccodata_statisticssgr2004complete_reportindexhtm
US Preventive Services Task Force Final Recommendation Statement Breast Cancer Screening November 2016 Available at httpwwwuspreventiveservicestaskforceorgPageDocumentRecommendationStatementFinalb reast-cancer-screening1
US Preventive Services Task Force Final Recommendation Statement Colorectal Cancer Screening June 2017 Available at httpswwwuspreventiveservicestaskforceorgPageDocumentRecommendationStatementFinal colorectal-cancer-screening2
US Preventive Services Task Force Final Recommendation Statement Lung Cancer Screening December 2016 Available at httpwwwuspreventiveservicestaskforceorgPageDocumentRecommendationStatementFinall ung-cancer-screening
World Health Organization Manual of the International Statistical Classification of Diseases and Related Health Problems 10th revision Geneva Switzerland World Health Organization 1992
Nebraska Department of Health and Human ServicesCancer Registry 65
REPORTING FACILITIES
Ainsworth--Brown County Hospital Albion--Boone County Health Center Alliance--Box Butte General Hospital Alma--Harlan County Health System Atkinson--West Holt Memorial Hospital Inc Auburn--Nemaha County Hospital Aurora--Memorial Hospital Bassett--Rock County Hospital Beatrice--Beatrice Community Hospital amp Health Center Inc Benkelman--Dundy County Hospital Blair--Memorial Community Hospital Bridgeport--Morrill County Community Hospital Broken Bow--Jennie Melham Memorial Medical Ctr Callaway--Callaway District Hospital Cambridge--Tri Valley Health System Central City--Litzenberg Memorial County Hospital Chadron--Chadron Community Hospital amp Health Services Columbus--Columbus Community Hospital Inc Cozad--Cozad Community Hospital Creighton--Creighton Area Health Services Crete--Crete Area Medical Center David City--Butler County Health Care Center Fairbury--Jefferson Community Health Center Inc Falls City--Community Medical Center Inc Franklin--Franklin County Memorial Hospital Fremont--Fremont Area Medical Center Friend--Warren Memorial Hospital Geneva--Fillmore County Hospital Genoa--Genoa Community HospitalLTC Gordon--Gordon Memorial Hospital District Gothenburg--Gothenburg Memorial Hospital Grand Island--CHI Health St Francis Grant--Perkins County Health Services Hastings--Mary Lanning Memorial Hospital Hebron--Thayer County Health Services Henderson--Henderson Health Care Services Holdrege--Phelps Memorial Health Center Imperial--Chase County Community Hospital Kearney--CHI Health Good Samaritan Kearney--CHI Health Good Samaritan Pathology Kimball--Kimball Health Services amp Hospital Lexington--Tri-County Area Hospital District Lincoln--Bryan-LGH Medical Center East amp West Lincoln--CHI Health Saint Elizabeth Lincoln--Pathology Medical Services Lincoln--Williamsburg Radiation Center Lincoln--CHI Health Nebraska Heart Lincoln--UNMC College of Dentistry Lynch--Niobrara Valley Hospital Corp McCook--Community Hospital Minden--Kearney County Health Services Nebraska City--CHI Health St Marys Neligh--Antelope Memorial Hospital
Norfolk--Faith Regional Health Services East amp West North Platte--Great Plains Regional Medical Center North Platte--Pathology Services Oakland--Oakland Memorial Hospital Ogallala--Ogallala Community Hospital Omaha--CHI Health Bergan Mercy Omaha--CHI Health Immanuel Omaha--Childrens Hospital Omaha--VA Nebraska-Western Iowa Health Care System Omaha--Methodist Hospital Pathology Center Omaha--Nebraska Medical Center Omaha--Nebraska Methodist Hospital Omaha--CHI Health Creighton University Med Ctr Omaha--Boys Town National Research Hospital Omaha--CHI Health Lakeside Omaha--CHI Health Bergan Mercy Pathology Omaha--Bishop Clarkson Hospital Pathology Omaha--Creighton Pathology Associates Omaha--Physicians Lab ONeill--Avera St Anthonys Hospital Ord--Valley County Hospital Osceola--Annie Jeffrey Memorial County Health Ctr Oshkosh--Garden County Health Services Osmond--Osmond General Hospital Papillion--CHI Health Midlands Pawnee City--Pawnee County Memorial Hospital Pender--Pender Community Hospital Plainview--CHI Health Plainview Red Cloud--Webster County Community Hospital Schuyler--CHI Health Schuyler Scottsbluff--Regional West Medical Center Scottsbluff--Western Pathology Consultants Seward--Memorial Hospital Sidney--Memorial Health Center St Paul--Howard County Community Hospital Superior--Brodstone Memorial Hospital Syracuse--Community Memorial Hospital Tecumseh--Johnson County Hospital Tilden--Tilden Community Hospital Valentine--Cherry County Hospital Wahoo--Saunders County Health Services Wayne--Providence Medical Center West Point--St Francis Memorial Hospital Winnebago--USPHS Indian Hospital York--York General Hospital
Other States Sioux City IA--Mercy Medical Center
State cancer registries participating in the National Interstate Data Exchange Agreement and the state cancer registries of Illinois Kansas Minnesota Missouri and South Dakota
Nebraska Department of Health and Human ServicesCancer Registry 66
THE NEBRASKA DEPARTMENT OF HEALTH AND HUMAN SERVICES IS COMMITTED TO AFFIRMATIVE ACTION
EQUAL EMPLOYMENT OPPORTUNITIES AND DOES NOT DISCRIMINATE IN DELIVERING BENEFITS OR SERVICES
AAEOEADA
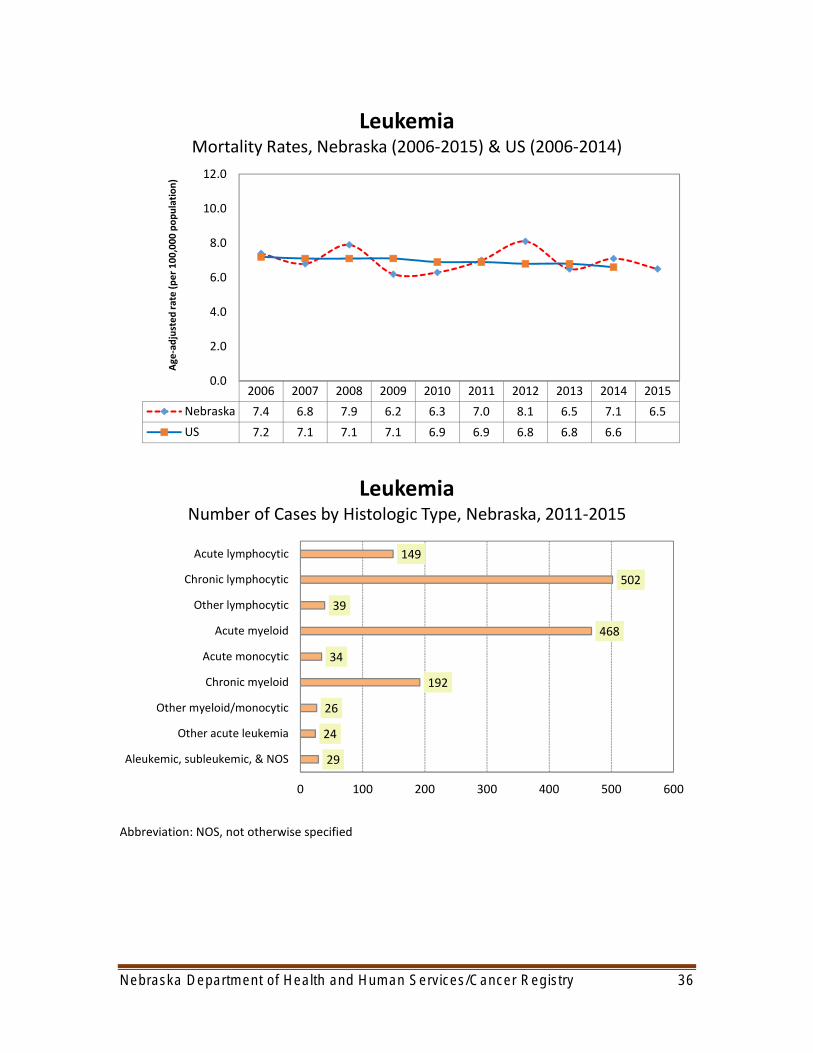
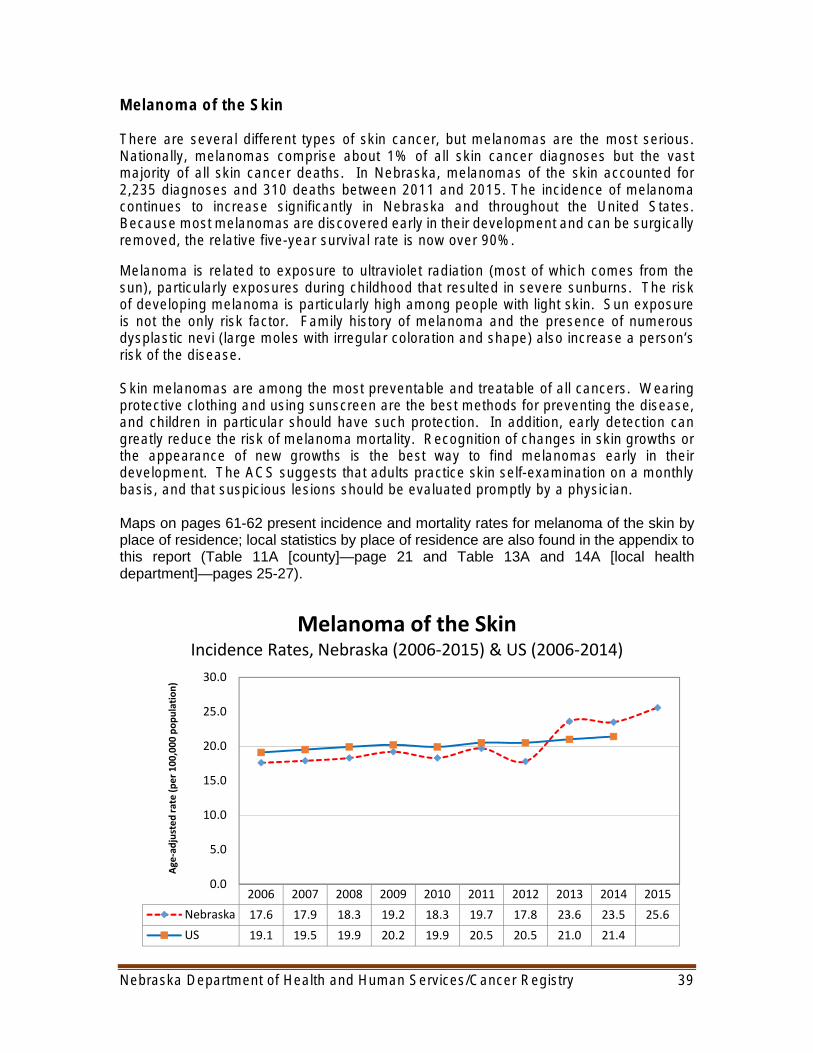
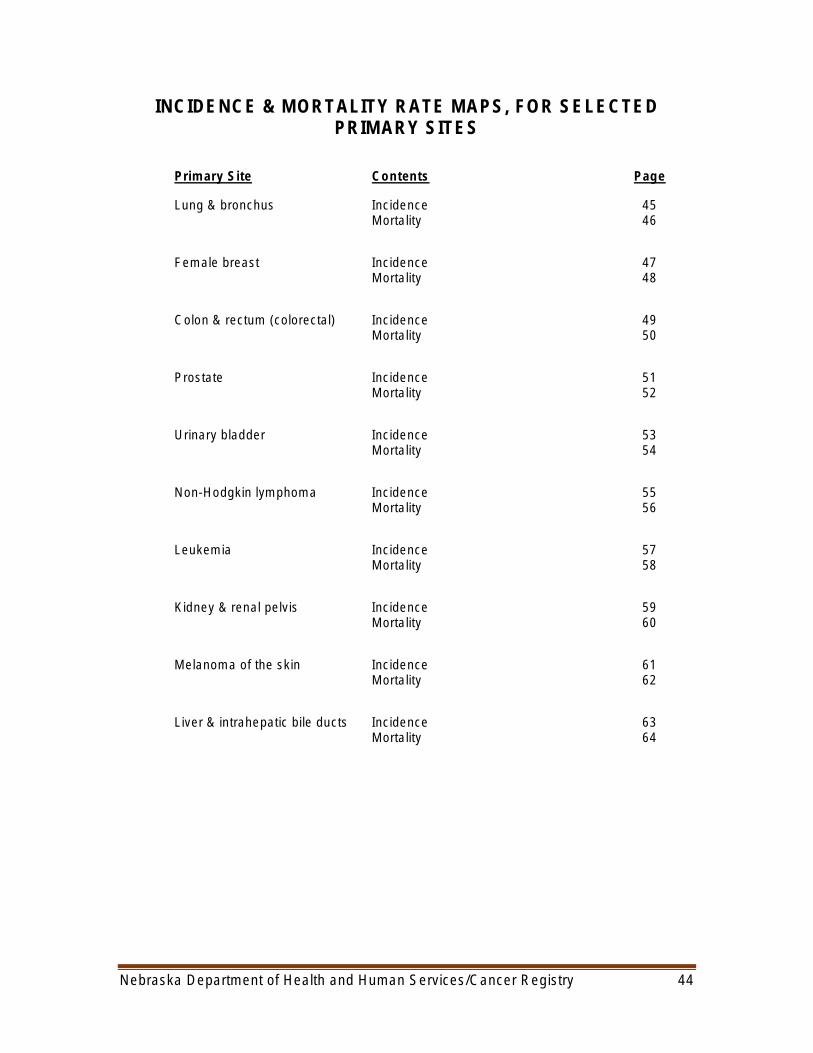
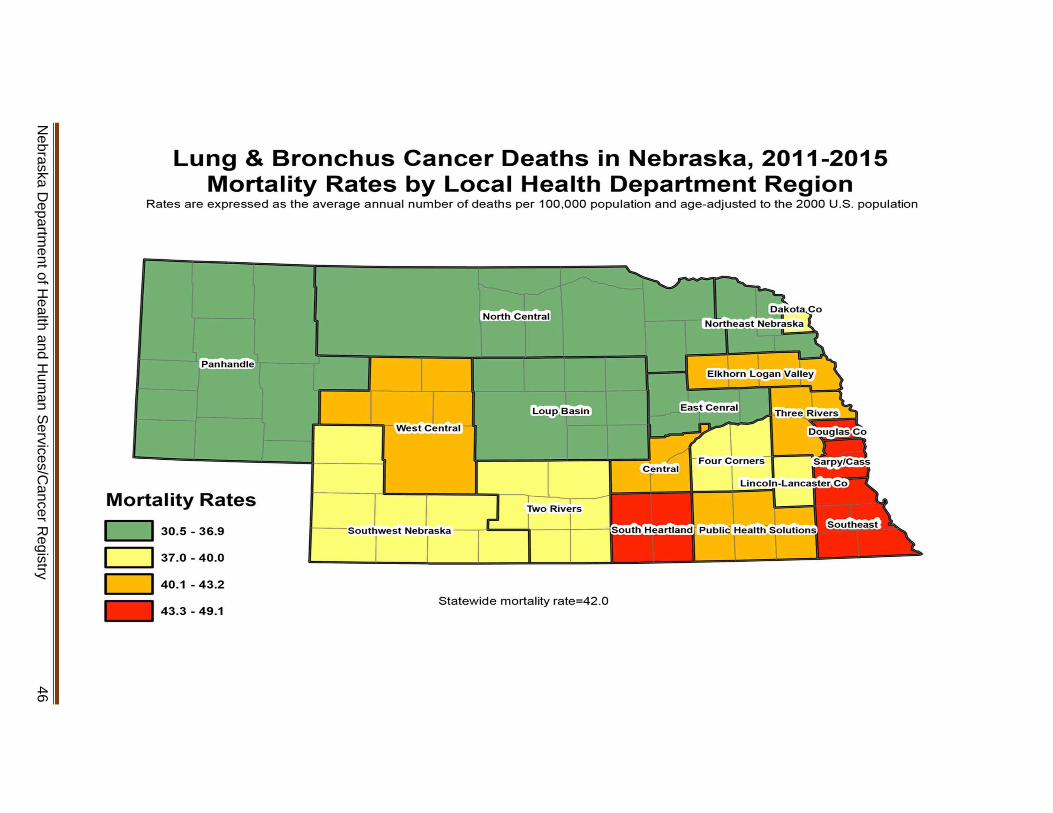
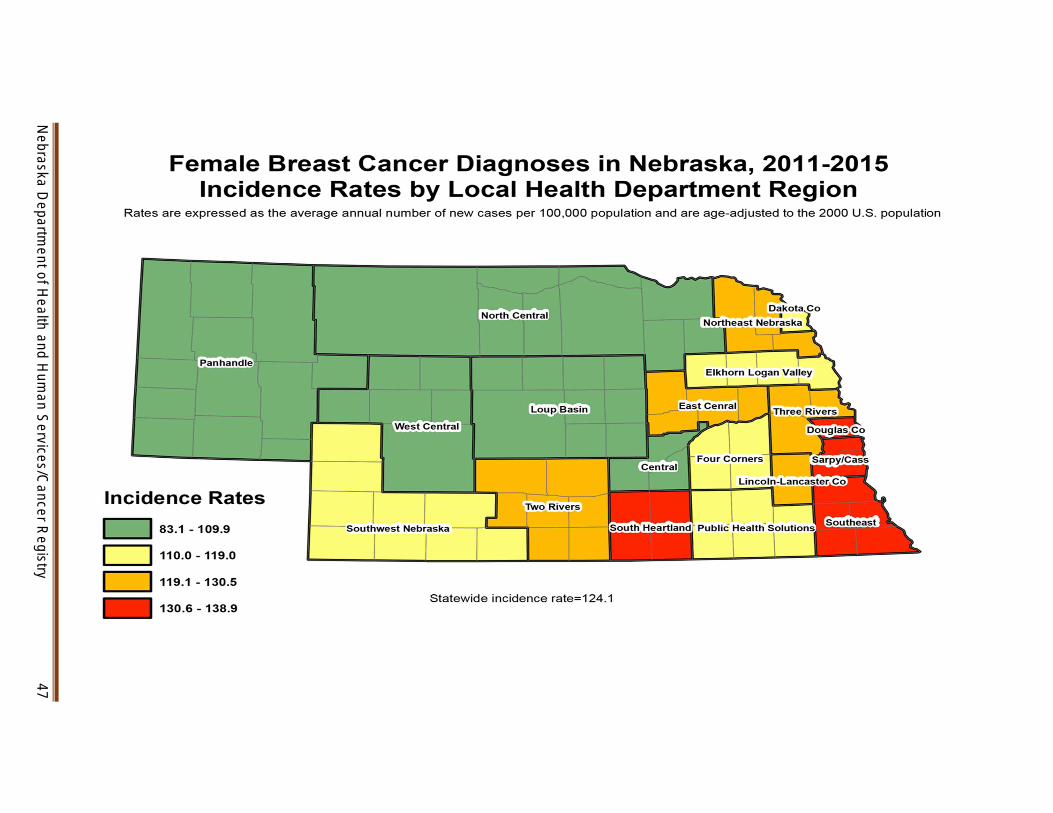
Nebraska D
epartment of H
ealth and Hum
an ServicesC
ancer Registry
47
Nebraska D
epartment of H
ealth and Hum
an ServicesC
ancer Registry
48
Nebraska D
epartment of H
ealth and Hum
an ServicesC
ancer Registry
49
Nebraska D
epartment of H
ealth and Hum
an ServicesC
ancer Registry
50
Nebraska D
epartment of H
ealth and Hum
an ServicesC
ancer Registry
51
Nebraska D
epartment of H
ealth and Hum
an ServicesC
ancer Registry
52
Nebraska D
epartment of H
ealth and Hum
an ServicesC
ancer Registry
53
Nebraska D
epartment of H
ealth and Hum
an ServicesC
ancer Registry
54
Non-Hodgkin Lymphoma Diagnoses in Nebraska 2011-2015 Incidence Rates by Local Health Department Region
Rates are expressed as the average annual number of new cases per 100000 population and are age-adj usted to the 2000 U S population
Incidence Rates
140 - 180
181 - 209
Statewide incidence rate=203 221 - 298
Nebraska D
epartment of H
ealth and Hum
an ServicesC
ancer Registry
55
Nebraska D
epartment of H
ealth and Hum
an ServicesC
ancer Registry
56
Nebraska D
epartment of H
ealth and Hum
an ServicesC
ancer Registry
57
Nebraska D
epartment of H
ealth and Hum
an ServicesC
ancer Registry
58
Nebraska D
epartment of H
ealth and Hum
an ServicesC
ancer Registry
59
Kidney amp Renal Pelvis Cancer Deaths in Nebraska 2011-2015 Mortality Rates by Local Health Department Region
Rates are expressed as the average annual number of deaths per 100000 population and age-adjusted to the 2000 U S population
Mortality Rates
2 4 - 3 8
39 - 42
43 - 55
56 - 69 Statewide mortality rate=45
Nebraska D
epartment of H
ealth and Hum
an ServicesC
ancer Registry
60
Nebraska D
epartment of H
ealth and Hum
an ServicesC
ancer Registry
61
Nebraska D
epartment of H
ealth and Hum
an ServicesC
ancer Registry
62
Nebraska D
epartment of H
ealth and Hum
an ServicesC
ancer Registry
63
Liver amp lntrahepatic Bile Ducts Cancer Deaths in Nebraska 2011-2015 Mortality Rates by Local Health Department Region
Rates are expressed as the average annual number of deaths per 100000 population and age-adjusted to the 2000 U S population
North Central
---1 West Central
Mortality Rates
12 - 36
37-41
5 3 - 9 3 Statewide mortality rate=4 7
Nebraska D
epartment of H
ealth and Hum
an ServicesC
ancer Registry
64
REFERENCES
American Cancer Society American Cancer Society Recommendations for the Early Detection of Breast Cancer 2017 Available at httpswwwcancerorgcancerbreast-cancerscreening-testsshyand-early-detectionamerican-cancer-society-recommendations-for-the-early-detection-of-breastshycancerhtml
American Cancer Society Cancer Facts and Figures 2018 Atlanta GA American Cancer Society 2018 Available at httpswwwcancerorgcontentdamcancer-orgresearchcancer-facts-and-statisticsannualshycancer-facts-and-figures2018cancer-facts-and-figures-2018pdf
American Cancer Society Colorectal Cancer Screening Guidelines 2018 Available at httpswwwcancerorghealth-care-professionalsamerican-cancer-society-prevention-earlyshydetection-guidelinescolorectal-cancer-screening-guidelineshtml
Fritz A Percy C Jack A Shanmugaratnam K Sobin L Parkin DM Whelan S International Classification of Diseases for Oncology 3rd edition (US interim version 2000) Geneva Switzerland World Health Organization 2000
National Cancer Institute SEER Cancer Stat Facts Bethesda MD National Cancer Institute Accessed on February 21 2018 Available at httpsseercancergovstatfacts
United States Cancer Statistics 1999-2014 Incidence CDC WONDER On-line Database US Department of Health and Human Services Centers for Disease Control and Prevention and National Cancer Institute 2016 Available at httpswondercdcgovcancer-v2014HTML
United States Cancer Statistics 1999-2014 Mortality CDC WONDER On-line Database US Department of Health and Human Services Centers for Disease Control and Prevention 2016 Available at httpswondercdcgovcancermort-v2014HTML
United States Department of Health and Human Services The Health Consequences of Smoking A Report of the Surgeon General US Department of Health and Human Services Centers for Disease Control and Prevention National Center for Chronic Disease Prevention and Health Promotion Office on Smoking and Health 2004 Available at httpswwwcdcgovtobaccodata_statisticssgr2004complete_reportindexhtm
US Preventive Services Task Force Final Recommendation Statement Breast Cancer Screening November 2016 Available at httpwwwuspreventiveservicestaskforceorgPageDocumentRecommendationStatementFinalb reast-cancer-screening1
US Preventive Services Task Force Final Recommendation Statement Colorectal Cancer Screening June 2017 Available at httpswwwuspreventiveservicestaskforceorgPageDocumentRecommendationStatementFinal colorectal-cancer-screening2
US Preventive Services Task Force Final Recommendation Statement Lung Cancer Screening December 2016 Available at httpwwwuspreventiveservicestaskforceorgPageDocumentRecommendationStatementFinall ung-cancer-screening
World Health Organization Manual of the International Statistical Classification of Diseases and Related Health Problems 10th revision Geneva Switzerland World Health Organization 1992
Nebraska Department of Health and Human ServicesCancer Registry 65
REPORTING FACILITIES
Ainsworth--Brown County Hospital Albion--Boone County Health Center Alliance--Box Butte General Hospital Alma--Harlan County Health System Atkinson--West Holt Memorial Hospital Inc Auburn--Nemaha County Hospital Aurora--Memorial Hospital Bassett--Rock County Hospital Beatrice--Beatrice Community Hospital amp Health Center Inc Benkelman--Dundy County Hospital Blair--Memorial Community Hospital Bridgeport--Morrill County Community Hospital Broken Bow--Jennie Melham Memorial Medical Ctr Callaway--Callaway District Hospital Cambridge--Tri Valley Health System Central City--Litzenberg Memorial County Hospital Chadron--Chadron Community Hospital amp Health Services Columbus--Columbus Community Hospital Inc Cozad--Cozad Community Hospital Creighton--Creighton Area Health Services Crete--Crete Area Medical Center David City--Butler County Health Care Center Fairbury--Jefferson Community Health Center Inc Falls City--Community Medical Center Inc Franklin--Franklin County Memorial Hospital Fremont--Fremont Area Medical Center Friend--Warren Memorial Hospital Geneva--Fillmore County Hospital Genoa--Genoa Community HospitalLTC Gordon--Gordon Memorial Hospital District Gothenburg--Gothenburg Memorial Hospital Grand Island--CHI Health St Francis Grant--Perkins County Health Services Hastings--Mary Lanning Memorial Hospital Hebron--Thayer County Health Services Henderson--Henderson Health Care Services Holdrege--Phelps Memorial Health Center Imperial--Chase County Community Hospital Kearney--CHI Health Good Samaritan Kearney--CHI Health Good Samaritan Pathology Kimball--Kimball Health Services amp Hospital Lexington--Tri-County Area Hospital District Lincoln--Bryan-LGH Medical Center East amp West Lincoln--CHI Health Saint Elizabeth Lincoln--Pathology Medical Services Lincoln--Williamsburg Radiation Center Lincoln--CHI Health Nebraska Heart Lincoln--UNMC College of Dentistry Lynch--Niobrara Valley Hospital Corp McCook--Community Hospital Minden--Kearney County Health Services Nebraska City--CHI Health St Marys Neligh--Antelope Memorial Hospital
Norfolk--Faith Regional Health Services East amp West North Platte--Great Plains Regional Medical Center North Platte--Pathology Services Oakland--Oakland Memorial Hospital Ogallala--Ogallala Community Hospital Omaha--CHI Health Bergan Mercy Omaha--CHI Health Immanuel Omaha--Childrens Hospital Omaha--VA Nebraska-Western Iowa Health Care System Omaha--Methodist Hospital Pathology Center Omaha--Nebraska Medical Center Omaha--Nebraska Methodist Hospital Omaha--CHI Health Creighton University Med Ctr Omaha--Boys Town National Research Hospital Omaha--CHI Health Lakeside Omaha--CHI Health Bergan Mercy Pathology Omaha--Bishop Clarkson Hospital Pathology Omaha--Creighton Pathology Associates Omaha--Physicians Lab ONeill--Avera St Anthonys Hospital Ord--Valley County Hospital Osceola--Annie Jeffrey Memorial County Health Ctr Oshkosh--Garden County Health Services Osmond--Osmond General Hospital Papillion--CHI Health Midlands Pawnee City--Pawnee County Memorial Hospital Pender--Pender Community Hospital Plainview--CHI Health Plainview Red Cloud--Webster County Community Hospital Schuyler--CHI Health Schuyler Scottsbluff--Regional West Medical Center Scottsbluff--Western Pathology Consultants Seward--Memorial Hospital Sidney--Memorial Health Center St Paul--Howard County Community Hospital Superior--Brodstone Memorial Hospital Syracuse--Community Memorial Hospital Tecumseh--Johnson County Hospital Tilden--Tilden Community Hospital Valentine--Cherry County Hospital Wahoo--Saunders County Health Services Wayne--Providence Medical Center West Point--St Francis Memorial Hospital Winnebago--USPHS Indian Hospital York--York General Hospital
Other States Sioux City IA--Mercy Medical Center
State cancer registries participating in the National Interstate Data Exchange Agreement and the state cancer registries of Illinois Kansas Minnesota Missouri and South Dakota
Nebraska Department of Health and Human ServicesCancer Registry 66
THE NEBRASKA DEPARTMENT OF HEALTH AND HUMAN SERVICES IS COMMITTED TO AFFIRMATIVE ACTION
EQUAL EMPLOYMENT OPPORTUNITIES AND DOES NOT DISCRIMINATE IN DELIVERING BENEFITS OR SERVICES
AAEOEADA
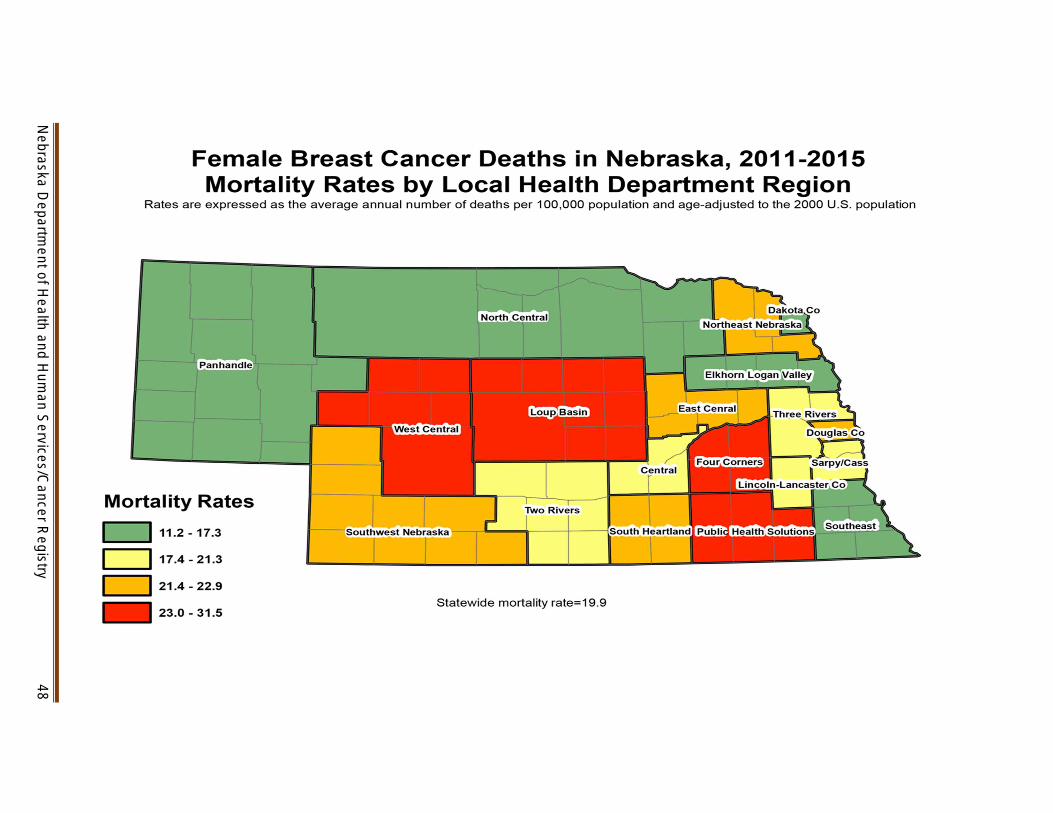
Nebraska D
epartment of H
ealth and Hum
an ServicesC
ancer Registry
52
Nebraska D
epartment of H
ealth and Hum
an ServicesC
ancer Registry
53
Nebraska D
epartment of H
ealth and Hum
an ServicesC
ancer Registry
54
Non-Hodgkin Lymphoma Diagnoses in Nebraska 2011-2015 Incidence Rates by Local Health Department Region
Rates are expressed as the average annual number of new cases per 100000 population and are age-adj usted to the 2000 U S population
Incidence Rates
140 - 180
181 - 209
Statewide incidence rate=203 221 - 298
Nebraska D
epartment of H
ealth and Hum
an ServicesC
ancer Registry
55
Nebraska D
epartment of H
ealth and Hum
an ServicesC
ancer Registry
56
Nebraska D
epartment of H
ealth and Hum
an ServicesC
ancer Registry
57
Nebraska D
epartment of H
ealth and Hum
an ServicesC
ancer Registry
58
Nebraska D
epartment of H
ealth and Hum
an ServicesC
ancer Registry
59
Kidney amp Renal Pelvis Cancer Deaths in Nebraska 2011-2015 Mortality Rates by Local Health Department Region
Rates are expressed as the average annual number of deaths per 100000 population and age-adjusted to the 2000 U S population
Mortality Rates
2 4 - 3 8
39 - 42
43 - 55
56 - 69 Statewide mortality rate=45
Nebraska D
epartment of H
ealth and Hum
an ServicesC
ancer Registry
60
Nebraska D
epartment of H
ealth and Hum
an ServicesC
ancer Registry
61
Nebraska D
epartment of H
ealth and Hum
an ServicesC
ancer Registry
62
Nebraska D
epartment of H
ealth and Hum
an ServicesC
ancer Registry
63
Liver amp lntrahepatic Bile Ducts Cancer Deaths in Nebraska 2011-2015 Mortality Rates by Local Health Department Region
Rates are expressed as the average annual number of deaths per 100000 population and age-adjusted to the 2000 U S population
North Central
---1 West Central
Mortality Rates
12 - 36
37-41
5 3 - 9 3 Statewide mortality rate=4 7
Nebraska D
epartment of H
ealth and Hum
an ServicesC
ancer Registry
64
REFERENCES
American Cancer Society American Cancer Society Recommendations for the Early Detection of Breast Cancer 2017 Available at httpswwwcancerorgcancerbreast-cancerscreening-testsshyand-early-detectionamerican-cancer-society-recommendations-for-the-early-detection-of-breastshycancerhtml
American Cancer Society Cancer Facts and Figures 2018 Atlanta GA American Cancer Society 2018 Available at httpswwwcancerorgcontentdamcancer-orgresearchcancer-facts-and-statisticsannualshycancer-facts-and-figures2018cancer-facts-and-figures-2018pdf
American Cancer Society Colorectal Cancer Screening Guidelines 2018 Available at httpswwwcancerorghealth-care-professionalsamerican-cancer-society-prevention-earlyshydetection-guidelinescolorectal-cancer-screening-guidelineshtml
Fritz A Percy C Jack A Shanmugaratnam K Sobin L Parkin DM Whelan S International Classification of Diseases for Oncology 3rd edition (US interim version 2000) Geneva Switzerland World Health Organization 2000
National Cancer Institute SEER Cancer Stat Facts Bethesda MD National Cancer Institute Accessed on February 21 2018 Available at httpsseercancergovstatfacts
United States Cancer Statistics 1999-2014 Incidence CDC WONDER On-line Database US Department of Health and Human Services Centers for Disease Control and Prevention and National Cancer Institute 2016 Available at httpswondercdcgovcancer-v2014HTML
United States Cancer Statistics 1999-2014 Mortality CDC WONDER On-line Database US Department of Health and Human Services Centers for Disease Control and Prevention 2016 Available at httpswondercdcgovcancermort-v2014HTML
United States Department of Health and Human Services The Health Consequences of Smoking A Report of the Surgeon General US Department of Health and Human Services Centers for Disease Control and Prevention National Center for Chronic Disease Prevention and Health Promotion Office on Smoking and Health 2004 Available at httpswwwcdcgovtobaccodata_statisticssgr2004complete_reportindexhtm
US Preventive Services Task Force Final Recommendation Statement Breast Cancer Screening November 2016 Available at httpwwwuspreventiveservicestaskforceorgPageDocumentRecommendationStatementFinalb reast-cancer-screening1
US Preventive Services Task Force Final Recommendation Statement Colorectal Cancer Screening June 2017 Available at httpswwwuspreventiveservicestaskforceorgPageDocumentRecommendationStatementFinal colorectal-cancer-screening2
US Preventive Services Task Force Final Recommendation Statement Lung Cancer Screening December 2016 Available at httpwwwuspreventiveservicestaskforceorgPageDocumentRecommendationStatementFinall ung-cancer-screening
World Health Organization Manual of the International Statistical Classification of Diseases and Related Health Problems 10th revision Geneva Switzerland World Health Organization 1992
Nebraska Department of Health and Human ServicesCancer Registry 65
REPORTING FACILITIES
Ainsworth--Brown County Hospital Albion--Boone County Health Center Alliance--Box Butte General Hospital Alma--Harlan County Health System Atkinson--West Holt Memorial Hospital Inc Auburn--Nemaha County Hospital Aurora--Memorial Hospital Bassett--Rock County Hospital Beatrice--Beatrice Community Hospital amp Health Center Inc Benkelman--Dundy County Hospital Blair--Memorial Community Hospital Bridgeport--Morrill County Community Hospital Broken Bow--Jennie Melham Memorial Medical Ctr Callaway--Callaway District Hospital Cambridge--Tri Valley Health System Central City--Litzenberg Memorial County Hospital Chadron--Chadron Community Hospital amp Health Services Columbus--Columbus Community Hospital Inc Cozad--Cozad Community Hospital Creighton--Creighton Area Health Services Crete--Crete Area Medical Center David City--Butler County Health Care Center Fairbury--Jefferson Community Health Center Inc Falls City--Community Medical Center Inc Franklin--Franklin County Memorial Hospital Fremont--Fremont Area Medical Center Friend--Warren Memorial Hospital Geneva--Fillmore County Hospital Genoa--Genoa Community HospitalLTC Gordon--Gordon Memorial Hospital District Gothenburg--Gothenburg Memorial Hospital Grand Island--CHI Health St Francis Grant--Perkins County Health Services Hastings--Mary Lanning Memorial Hospital Hebron--Thayer County Health Services Henderson--Henderson Health Care Services Holdrege--Phelps Memorial Health Center Imperial--Chase County Community Hospital Kearney--CHI Health Good Samaritan Kearney--CHI Health Good Samaritan Pathology Kimball--Kimball Health Services amp Hospital Lexington--Tri-County Area Hospital District Lincoln--Bryan-LGH Medical Center East amp West Lincoln--CHI Health Saint Elizabeth Lincoln--Pathology Medical Services Lincoln--Williamsburg Radiation Center Lincoln--CHI Health Nebraska Heart Lincoln--UNMC College of Dentistry Lynch--Niobrara Valley Hospital Corp McCook--Community Hospital Minden--Kearney County Health Services Nebraska City--CHI Health St Marys Neligh--Antelope Memorial Hospital
Norfolk--Faith Regional Health Services East amp West North Platte--Great Plains Regional Medical Center North Platte--Pathology Services Oakland--Oakland Memorial Hospital Ogallala--Ogallala Community Hospital Omaha--CHI Health Bergan Mercy Omaha--CHI Health Immanuel Omaha--Childrens Hospital Omaha--VA Nebraska-Western Iowa Health Care System Omaha--Methodist Hospital Pathology Center Omaha--Nebraska Medical Center Omaha--Nebraska Methodist Hospital Omaha--CHI Health Creighton University Med Ctr Omaha--Boys Town National Research Hospital Omaha--CHI Health Lakeside Omaha--CHI Health Bergan Mercy Pathology Omaha--Bishop Clarkson Hospital Pathology Omaha--Creighton Pathology Associates Omaha--Physicians Lab ONeill--Avera St Anthonys Hospital Ord--Valley County Hospital Osceola--Annie Jeffrey Memorial County Health Ctr Oshkosh--Garden County Health Services Osmond--Osmond General Hospital Papillion--CHI Health Midlands Pawnee City--Pawnee County Memorial Hospital Pender--Pender Community Hospital Plainview--CHI Health Plainview Red Cloud--Webster County Community Hospital Schuyler--CHI Health Schuyler Scottsbluff--Regional West Medical Center Scottsbluff--Western Pathology Consultants Seward--Memorial Hospital Sidney--Memorial Health Center St Paul--Howard County Community Hospital Superior--Brodstone Memorial Hospital Syracuse--Community Memorial Hospital Tecumseh--Johnson County Hospital Tilden--Tilden Community Hospital Valentine--Cherry County Hospital Wahoo--Saunders County Health Services Wayne--Providence Medical Center West Point--St Francis Memorial Hospital Winnebago--USPHS Indian Hospital York--York General Hospital
Other States Sioux City IA--Mercy Medical Center
State cancer registries participating in the National Interstate Data Exchange Agreement and the state cancer registries of Illinois Kansas Minnesota Missouri and South Dakota
Nebraska Department of Health and Human ServicesCancer Registry 66
THE NEBRASKA DEPARTMENT OF HEALTH AND HUMAN SERVICES IS COMMITTED TO AFFIRMATIVE ACTION
EQUAL EMPLOYMENT OPPORTUNITIES AND DOES NOT DISCRIMINATE IN DELIVERING BENEFITS OR SERVICES
AAEOEADA
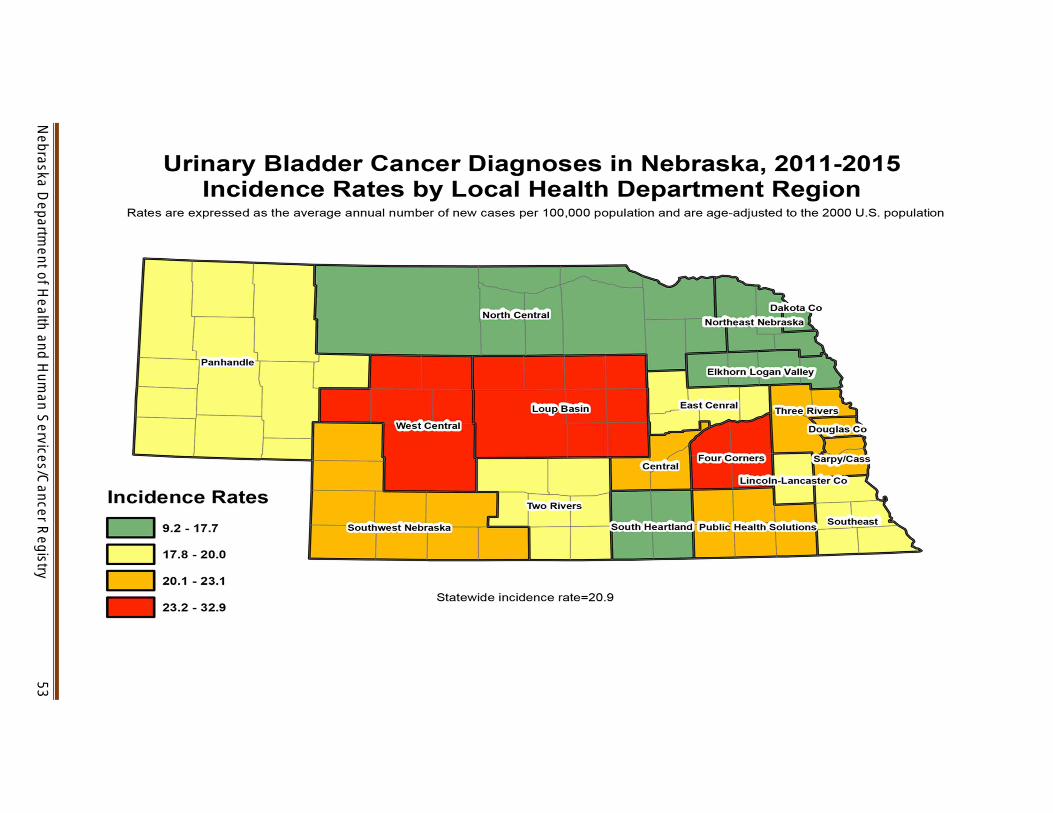
Nebraska D
epartment of H
ealth and Hum
an ServicesC
ancer Registry
53
Nebraska D
epartment of H
ealth and Hum
an ServicesC
ancer Registry
54
Non-Hodgkin Lymphoma Diagnoses in Nebraska 2011-2015 Incidence Rates by Local Health Department Region
Rates are expressed as the average annual number of new cases per 100000 population and are age-adj usted to the 2000 U S population
Incidence Rates
140 - 180
181 - 209
Statewide incidence rate=203 221 - 298
Nebraska D
epartment of H
ealth and Hum
an ServicesC
ancer Registry
55
Nebraska D
epartment of H
ealth and Hum
an ServicesC
ancer Registry
56
Nebraska D
epartment of H
ealth and Hum
an ServicesC
ancer Registry
57
Nebraska D
epartment of H
ealth and Hum
an ServicesC
ancer Registry
58
Nebraska D
epartment of H
ealth and Hum
an ServicesC
ancer Registry
59
Kidney amp Renal Pelvis Cancer Deaths in Nebraska 2011-2015 Mortality Rates by Local Health Department Region
Rates are expressed as the average annual number of deaths per 100000 population and age-adjusted to the 2000 U S population
Mortality Rates
2 4 - 3 8
39 - 42
43 - 55
56 - 69 Statewide mortality rate=45
Nebraska D
epartment of H
ealth and Hum
an ServicesC
ancer Registry
60
Nebraska D
epartment of H
ealth and Hum
an ServicesC
ancer Registry
61
Nebraska D
epartment of H
ealth and Hum
an ServicesC
ancer Registry
62
Nebraska D
epartment of H
ealth and Hum
an ServicesC
ancer Registry
63
Liver amp lntrahepatic Bile Ducts Cancer Deaths in Nebraska 2011-2015 Mortality Rates by Local Health Department Region
Rates are expressed as the average annual number of deaths per 100000 population and age-adjusted to the 2000 U S population
North Central
---1 West Central
Mortality Rates
12 - 36
37-41
5 3 - 9 3 Statewide mortality rate=4 7
Nebraska D
epartment of H
ealth and Hum
an ServicesC
ancer Registry
64
REFERENCES
American Cancer Society American Cancer Society Recommendations for the Early Detection of Breast Cancer 2017 Available at httpswwwcancerorgcancerbreast-cancerscreening-testsshyand-early-detectionamerican-cancer-society-recommendations-for-the-early-detection-of-breastshycancerhtml
American Cancer Society Cancer Facts and Figures 2018 Atlanta GA American Cancer Society 2018 Available at httpswwwcancerorgcontentdamcancer-orgresearchcancer-facts-and-statisticsannualshycancer-facts-and-figures2018cancer-facts-and-figures-2018pdf
American Cancer Society Colorectal Cancer Screening Guidelines 2018 Available at httpswwwcancerorghealth-care-professionalsamerican-cancer-society-prevention-earlyshydetection-guidelinescolorectal-cancer-screening-guidelineshtml
Fritz A Percy C Jack A Shanmugaratnam K Sobin L Parkin DM Whelan S International Classification of Diseases for Oncology 3rd edition (US interim version 2000) Geneva Switzerland World Health Organization 2000
National Cancer Institute SEER Cancer Stat Facts Bethesda MD National Cancer Institute Accessed on February 21 2018 Available at httpsseercancergovstatfacts
United States Cancer Statistics 1999-2014 Incidence CDC WONDER On-line Database US Department of Health and Human Services Centers for Disease Control and Prevention and National Cancer Institute 2016 Available at httpswondercdcgovcancer-v2014HTML
United States Cancer Statistics 1999-2014 Mortality CDC WONDER On-line Database US Department of Health and Human Services Centers for Disease Control and Prevention 2016 Available at httpswondercdcgovcancermort-v2014HTML
United States Department of Health and Human Services The Health Consequences of Smoking A Report of the Surgeon General US Department of Health and Human Services Centers for Disease Control and Prevention National Center for Chronic Disease Prevention and Health Promotion Office on Smoking and Health 2004 Available at httpswwwcdcgovtobaccodata_statisticssgr2004complete_reportindexhtm
US Preventive Services Task Force Final Recommendation Statement Breast Cancer Screening November 2016 Available at httpwwwuspreventiveservicestaskforceorgPageDocumentRecommendationStatementFinalb reast-cancer-screening1
US Preventive Services Task Force Final Recommendation Statement Colorectal Cancer Screening June 2017 Available at httpswwwuspreventiveservicestaskforceorgPageDocumentRecommendationStatementFinal colorectal-cancer-screening2
US Preventive Services Task Force Final Recommendation Statement Lung Cancer Screening December 2016 Available at httpwwwuspreventiveservicestaskforceorgPageDocumentRecommendationStatementFinall ung-cancer-screening
World Health Organization Manual of the International Statistical Classification of Diseases and Related Health Problems 10th revision Geneva Switzerland World Health Organization 1992
Nebraska Department of Health and Human ServicesCancer Registry 65
REPORTING FACILITIES
Ainsworth--Brown County Hospital Albion--Boone County Health Center Alliance--Box Butte General Hospital Alma--Harlan County Health System Atkinson--West Holt Memorial Hospital Inc Auburn--Nemaha County Hospital Aurora--Memorial Hospital Bassett--Rock County Hospital Beatrice--Beatrice Community Hospital amp Health Center Inc Benkelman--Dundy County Hospital Blair--Memorial Community Hospital Bridgeport--Morrill County Community Hospital Broken Bow--Jennie Melham Memorial Medical Ctr Callaway--Callaway District Hospital Cambridge--Tri Valley Health System Central City--Litzenberg Memorial County Hospital Chadron--Chadron Community Hospital amp Health Services Columbus--Columbus Community Hospital Inc Cozad--Cozad Community Hospital Creighton--Creighton Area Health Services Crete--Crete Area Medical Center David City--Butler County Health Care Center Fairbury--Jefferson Community Health Center Inc Falls City--Community Medical Center Inc Franklin--Franklin County Memorial Hospital Fremont--Fremont Area Medical Center Friend--Warren Memorial Hospital Geneva--Fillmore County Hospital Genoa--Genoa Community HospitalLTC Gordon--Gordon Memorial Hospital District Gothenburg--Gothenburg Memorial Hospital Grand Island--CHI Health St Francis Grant--Perkins County Health Services Hastings--Mary Lanning Memorial Hospital Hebron--Thayer County Health Services Henderson--Henderson Health Care Services Holdrege--Phelps Memorial Health Center Imperial--Chase County Community Hospital Kearney--CHI Health Good Samaritan Kearney--CHI Health Good Samaritan Pathology Kimball--Kimball Health Services amp Hospital Lexington--Tri-County Area Hospital District Lincoln--Bryan-LGH Medical Center East amp West Lincoln--CHI Health Saint Elizabeth Lincoln--Pathology Medical Services Lincoln--Williamsburg Radiation Center Lincoln--CHI Health Nebraska Heart Lincoln--UNMC College of Dentistry Lynch--Niobrara Valley Hospital Corp McCook--Community Hospital Minden--Kearney County Health Services Nebraska City--CHI Health St Marys Neligh--Antelope Memorial Hospital
Norfolk--Faith Regional Health Services East amp West North Platte--Great Plains Regional Medical Center North Platte--Pathology Services Oakland--Oakland Memorial Hospital Ogallala--Ogallala Community Hospital Omaha--CHI Health Bergan Mercy Omaha--CHI Health Immanuel Omaha--Childrens Hospital Omaha--VA Nebraska-Western Iowa Health Care System Omaha--Methodist Hospital Pathology Center Omaha--Nebraska Medical Center Omaha--Nebraska Methodist Hospital Omaha--CHI Health Creighton University Med Ctr Omaha--Boys Town National Research Hospital Omaha--CHI Health Lakeside Omaha--CHI Health Bergan Mercy Pathology Omaha--Bishop Clarkson Hospital Pathology Omaha--Creighton Pathology Associates Omaha--Physicians Lab ONeill--Avera St Anthonys Hospital Ord--Valley County Hospital Osceola--Annie Jeffrey Memorial County Health Ctr Oshkosh--Garden County Health Services Osmond--Osmond General Hospital Papillion--CHI Health Midlands Pawnee City--Pawnee County Memorial Hospital Pender--Pender Community Hospital Plainview--CHI Health Plainview Red Cloud--Webster County Community Hospital Schuyler--CHI Health Schuyler Scottsbluff--Regional West Medical Center Scottsbluff--Western Pathology Consultants Seward--Memorial Hospital Sidney--Memorial Health Center St Paul--Howard County Community Hospital Superior--Brodstone Memorial Hospital Syracuse--Community Memorial Hospital Tecumseh--Johnson County Hospital Tilden--Tilden Community Hospital Valentine--Cherry County Hospital Wahoo--Saunders County Health Services Wayne--Providence Medical Center West Point--St Francis Memorial Hospital Winnebago--USPHS Indian Hospital York--York General Hospital
Other States Sioux City IA--Mercy Medical Center
State cancer registries participating in the National Interstate Data Exchange Agreement and the state cancer registries of Illinois Kansas Minnesota Missouri and South Dakota
Nebraska Department of Health and Human ServicesCancer Registry 66
THE NEBRASKA DEPARTMENT OF HEALTH AND HUMAN SERVICES IS COMMITTED TO AFFIRMATIVE ACTION
EQUAL EMPLOYMENT OPPORTUNITIES AND DOES NOT DISCRIMINATE IN DELIVERING BENEFITS OR SERVICES
AAEOEADA
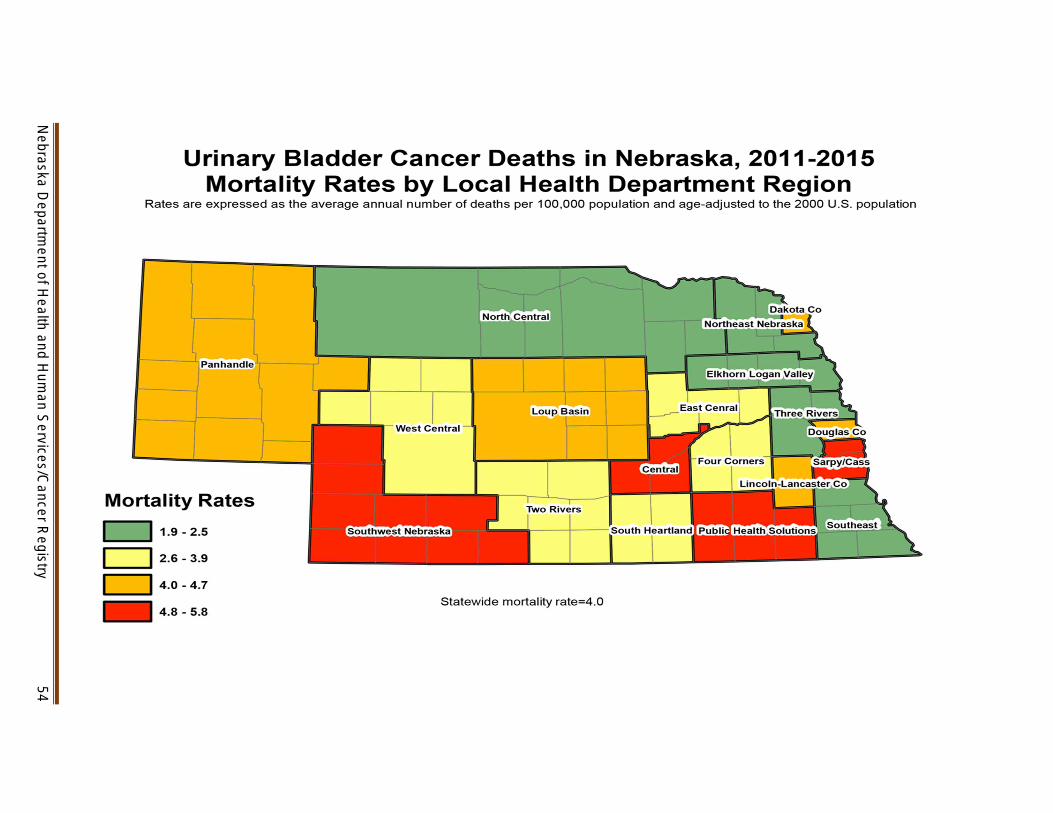
Nebraska D
epartment of H
ealth and Hum
an ServicesC
ancer Registry
54
Non-Hodgkin Lymphoma Diagnoses in Nebraska 2011-2015 Incidence Rates by Local Health Department Region
Rates are expressed as the average annual number of new cases per 100000 population and are age-adj usted to the 2000 U S population
Incidence Rates
140 - 180
181 - 209
Statewide incidence rate=203 221 - 298
Nebraska D
epartment of H
ealth and Hum
an ServicesC
ancer Registry
55
Nebraska D
epartment of H
ealth and Hum
an ServicesC
ancer Registry
56
Nebraska D
epartment of H
ealth and Hum
an ServicesC
ancer Registry
57
Nebraska D
epartment of H
ealth and Hum
an ServicesC
ancer Registry
58
Nebraska D
epartment of H
ealth and Hum
an ServicesC
ancer Registry
59
Kidney amp Renal Pelvis Cancer Deaths in Nebraska 2011-2015 Mortality Rates by Local Health Department Region
Rates are expressed as the average annual number of deaths per 100000 population and age-adjusted to the 2000 U S population
Mortality Rates
2 4 - 3 8
39 - 42
43 - 55
56 - 69 Statewide mortality rate=45
Nebraska D
epartment of H
ealth and Hum
an ServicesC
ancer Registry
60
Nebraska D
epartment of H
ealth and Hum
an ServicesC
ancer Registry
61
Nebraska D
epartment of H
ealth and Hum
an ServicesC
ancer Registry
62
Nebraska D
epartment of H
ealth and Hum
an ServicesC
ancer Registry
63
Liver amp lntrahepatic Bile Ducts Cancer Deaths in Nebraska 2011-2015 Mortality Rates by Local Health Department Region
Rates are expressed as the average annual number of deaths per 100000 population and age-adjusted to the 2000 U S population
North Central
---1 West Central
Mortality Rates
12 - 36
37-41
5 3 - 9 3 Statewide mortality rate=4 7
Nebraska D
epartment of H
ealth and Hum
an ServicesC
ancer Registry
64
REFERENCES
American Cancer Society American Cancer Society Recommendations for the Early Detection of Breast Cancer 2017 Available at httpswwwcancerorgcancerbreast-cancerscreening-testsshyand-early-detectionamerican-cancer-society-recommendations-for-the-early-detection-of-breastshycancerhtml
American Cancer Society Cancer Facts and Figures 2018 Atlanta GA American Cancer Society 2018 Available at httpswwwcancerorgcontentdamcancer-orgresearchcancer-facts-and-statisticsannualshycancer-facts-and-figures2018cancer-facts-and-figures-2018pdf
American Cancer Society Colorectal Cancer Screening Guidelines 2018 Available at httpswwwcancerorghealth-care-professionalsamerican-cancer-society-prevention-earlyshydetection-guidelinescolorectal-cancer-screening-guidelineshtml
Fritz A Percy C Jack A Shanmugaratnam K Sobin L Parkin DM Whelan S International Classification of Diseases for Oncology 3rd edition (US interim version 2000) Geneva Switzerland World Health Organization 2000
National Cancer Institute SEER Cancer Stat Facts Bethesda MD National Cancer Institute Accessed on February 21 2018 Available at httpsseercancergovstatfacts
United States Cancer Statistics 1999-2014 Incidence CDC WONDER On-line Database US Department of Health and Human Services Centers for Disease Control and Prevention and National Cancer Institute 2016 Available at httpswondercdcgovcancer-v2014HTML
United States Cancer Statistics 1999-2014 Mortality CDC WONDER On-line Database US Department of Health and Human Services Centers for Disease Control and Prevention 2016 Available at httpswondercdcgovcancermort-v2014HTML
United States Department of Health and Human Services The Health Consequences of Smoking A Report of the Surgeon General US Department of Health and Human Services Centers for Disease Control and Prevention National Center for Chronic Disease Prevention and Health Promotion Office on Smoking and Health 2004 Available at httpswwwcdcgovtobaccodata_statisticssgr2004complete_reportindexhtm
US Preventive Services Task Force Final Recommendation Statement Breast Cancer Screening November 2016 Available at httpwwwuspreventiveservicestaskforceorgPageDocumentRecommendationStatementFinalb reast-cancer-screening1
US Preventive Services Task Force Final Recommendation Statement Colorectal Cancer Screening June 2017 Available at httpswwwuspreventiveservicestaskforceorgPageDocumentRecommendationStatementFinal colorectal-cancer-screening2
US Preventive Services Task Force Final Recommendation Statement Lung Cancer Screening December 2016 Available at httpwwwuspreventiveservicestaskforceorgPageDocumentRecommendationStatementFinall ung-cancer-screening
World Health Organization Manual of the International Statistical Classification of Diseases and Related Health Problems 10th revision Geneva Switzerland World Health Organization 1992
Nebraska Department of Health and Human ServicesCancer Registry 65
REPORTING FACILITIES
Ainsworth--Brown County Hospital Albion--Boone County Health Center Alliance--Box Butte General Hospital Alma--Harlan County Health System Atkinson--West Holt Memorial Hospital Inc Auburn--Nemaha County Hospital Aurora--Memorial Hospital Bassett--Rock County Hospital Beatrice--Beatrice Community Hospital amp Health Center Inc Benkelman--Dundy County Hospital Blair--Memorial Community Hospital Bridgeport--Morrill County Community Hospital Broken Bow--Jennie Melham Memorial Medical Ctr Callaway--Callaway District Hospital Cambridge--Tri Valley Health System Central City--Litzenberg Memorial County Hospital Chadron--Chadron Community Hospital amp Health Services Columbus--Columbus Community Hospital Inc Cozad--Cozad Community Hospital Creighton--Creighton Area Health Services Crete--Crete Area Medical Center David City--Butler County Health Care Center Fairbury--Jefferson Community Health Center Inc Falls City--Community Medical Center Inc Franklin--Franklin County Memorial Hospital Fremont--Fremont Area Medical Center Friend--Warren Memorial Hospital Geneva--Fillmore County Hospital Genoa--Genoa Community HospitalLTC Gordon--Gordon Memorial Hospital District Gothenburg--Gothenburg Memorial Hospital Grand Island--CHI Health St Francis Grant--Perkins County Health Services Hastings--Mary Lanning Memorial Hospital Hebron--Thayer County Health Services Henderson--Henderson Health Care Services Holdrege--Phelps Memorial Health Center Imperial--Chase County Community Hospital Kearney--CHI Health Good Samaritan Kearney--CHI Health Good Samaritan Pathology Kimball--Kimball Health Services amp Hospital Lexington--Tri-County Area Hospital District Lincoln--Bryan-LGH Medical Center East amp West Lincoln--CHI Health Saint Elizabeth Lincoln--Pathology Medical Services Lincoln--Williamsburg Radiation Center Lincoln--CHI Health Nebraska Heart Lincoln--UNMC College of Dentistry Lynch--Niobrara Valley Hospital Corp McCook--Community Hospital Minden--Kearney County Health Services Nebraska City--CHI Health St Marys Neligh--Antelope Memorial Hospital
Norfolk--Faith Regional Health Services East amp West North Platte--Great Plains Regional Medical Center North Platte--Pathology Services Oakland--Oakland Memorial Hospital Ogallala--Ogallala Community Hospital Omaha--CHI Health Bergan Mercy Omaha--CHI Health Immanuel Omaha--Childrens Hospital Omaha--VA Nebraska-Western Iowa Health Care System Omaha--Methodist Hospital Pathology Center Omaha--Nebraska Medical Center Omaha--Nebraska Methodist Hospital Omaha--CHI Health Creighton University Med Ctr Omaha--Boys Town National Research Hospital Omaha--CHI Health Lakeside Omaha--CHI Health Bergan Mercy Pathology Omaha--Bishop Clarkson Hospital Pathology Omaha--Creighton Pathology Associates Omaha--Physicians Lab ONeill--Avera St Anthonys Hospital Ord--Valley County Hospital Osceola--Annie Jeffrey Memorial County Health Ctr Oshkosh--Garden County Health Services Osmond--Osmond General Hospital Papillion--CHI Health Midlands Pawnee City--Pawnee County Memorial Hospital Pender--Pender Community Hospital Plainview--CHI Health Plainview Red Cloud--Webster County Community Hospital Schuyler--CHI Health Schuyler Scottsbluff--Regional West Medical Center Scottsbluff--Western Pathology Consultants Seward--Memorial Hospital Sidney--Memorial Health Center St Paul--Howard County Community Hospital Superior--Brodstone Memorial Hospital Syracuse--Community Memorial Hospital Tecumseh--Johnson County Hospital Tilden--Tilden Community Hospital Valentine--Cherry County Hospital Wahoo--Saunders County Health Services Wayne--Providence Medical Center West Point--St Francis Memorial Hospital Winnebago--USPHS Indian Hospital York--York General Hospital
Other States Sioux City IA--Mercy Medical Center
State cancer registries participating in the National Interstate Data Exchange Agreement and the state cancer registries of Illinois Kansas Minnesota Missouri and South Dakota
Nebraska Department of Health and Human ServicesCancer Registry 66
THE NEBRASKA DEPARTMENT OF HEALTH AND HUMAN SERVICES IS COMMITTED TO AFFIRMATIVE ACTION
EQUAL EMPLOYMENT OPPORTUNITIES AND DOES NOT DISCRIMINATE IN DELIVERING BENEFITS OR SERVICES
AAEOEADA

Nebraska D
epartment of H
ealth and Hum
an ServicesC
ancer Registry
56
Nebraska D
epartment of H
ealth and Hum
an ServicesC
ancer Registry
57
Nebraska D
epartment of H
ealth and Hum
an ServicesC
ancer Registry
58
Nebraska D
epartment of H
ealth and Hum
an ServicesC
ancer Registry
59
Kidney amp Renal Pelvis Cancer Deaths in Nebraska 2011-2015 Mortality Rates by Local Health Department Region
Rates are expressed as the average annual number of deaths per 100000 population and age-adjusted to the 2000 U S population
Mortality Rates
2 4 - 3 8
39 - 42
43 - 55
56 - 69 Statewide mortality rate=45
Nebraska D
epartment of H
ealth and Hum
an ServicesC
ancer Registry
60
Nebraska D
epartment of H
ealth and Hum
an ServicesC
ancer Registry
61
Nebraska D
epartment of H
ealth and Hum
an ServicesC
ancer Registry
62
Nebraska D
epartment of H
ealth and Hum
an ServicesC
ancer Registry
63
Liver amp lntrahepatic Bile Ducts Cancer Deaths in Nebraska 2011-2015 Mortality Rates by Local Health Department Region
Rates are expressed as the average annual number of deaths per 100000 population and age-adjusted to the 2000 U S population
North Central
---1 West Central
Mortality Rates
12 - 36
37-41
5 3 - 9 3 Statewide mortality rate=4 7
Nebraska D
epartment of H
ealth and Hum
an ServicesC
ancer Registry
64
REFERENCES
American Cancer Society American Cancer Society Recommendations for the Early Detection of Breast Cancer 2017 Available at httpswwwcancerorgcancerbreast-cancerscreening-testsshyand-early-detectionamerican-cancer-society-recommendations-for-the-early-detection-of-breastshycancerhtml
American Cancer Society Cancer Facts and Figures 2018 Atlanta GA American Cancer Society 2018 Available at httpswwwcancerorgcontentdamcancer-orgresearchcancer-facts-and-statisticsannualshycancer-facts-and-figures2018cancer-facts-and-figures-2018pdf
American Cancer Society Colorectal Cancer Screening Guidelines 2018 Available at httpswwwcancerorghealth-care-professionalsamerican-cancer-society-prevention-earlyshydetection-guidelinescolorectal-cancer-screening-guidelineshtml
Fritz A Percy C Jack A Shanmugaratnam K Sobin L Parkin DM Whelan S International Classification of Diseases for Oncology 3rd edition (US interim version 2000) Geneva Switzerland World Health Organization 2000
National Cancer Institute SEER Cancer Stat Facts Bethesda MD National Cancer Institute Accessed on February 21 2018 Available at httpsseercancergovstatfacts
United States Cancer Statistics 1999-2014 Incidence CDC WONDER On-line Database US Department of Health and Human Services Centers for Disease Control and Prevention and National Cancer Institute 2016 Available at httpswondercdcgovcancer-v2014HTML
United States Cancer Statistics 1999-2014 Mortality CDC WONDER On-line Database US Department of Health and Human Services Centers for Disease Control and Prevention 2016 Available at httpswondercdcgovcancermort-v2014HTML
United States Department of Health and Human Services The Health Consequences of Smoking A Report of the Surgeon General US Department of Health and Human Services Centers for Disease Control and Prevention National Center for Chronic Disease Prevention and Health Promotion Office on Smoking and Health 2004 Available at httpswwwcdcgovtobaccodata_statisticssgr2004complete_reportindexhtm
US Preventive Services Task Force Final Recommendation Statement Breast Cancer Screening November 2016 Available at httpwwwuspreventiveservicestaskforceorgPageDocumentRecommendationStatementFinalb reast-cancer-screening1
US Preventive Services Task Force Final Recommendation Statement Colorectal Cancer Screening June 2017 Available at httpswwwuspreventiveservicestaskforceorgPageDocumentRecommendationStatementFinal colorectal-cancer-screening2
US Preventive Services Task Force Final Recommendation Statement Lung Cancer Screening December 2016 Available at httpwwwuspreventiveservicestaskforceorgPageDocumentRecommendationStatementFinall ung-cancer-screening
World Health Organization Manual of the International Statistical Classification of Diseases and Related Health Problems 10th revision Geneva Switzerland World Health Organization 1992
Nebraska Department of Health and Human ServicesCancer Registry 65
REPORTING FACILITIES
Ainsworth--Brown County Hospital Albion--Boone County Health Center Alliance--Box Butte General Hospital Alma--Harlan County Health System Atkinson--West Holt Memorial Hospital Inc Auburn--Nemaha County Hospital Aurora--Memorial Hospital Bassett--Rock County Hospital Beatrice--Beatrice Community Hospital amp Health Center Inc Benkelman--Dundy County Hospital Blair--Memorial Community Hospital Bridgeport--Morrill County Community Hospital Broken Bow--Jennie Melham Memorial Medical Ctr Callaway--Callaway District Hospital Cambridge--Tri Valley Health System Central City--Litzenberg Memorial County Hospital Chadron--Chadron Community Hospital amp Health Services Columbus--Columbus Community Hospital Inc Cozad--Cozad Community Hospital Creighton--Creighton Area Health Services Crete--Crete Area Medical Center David City--Butler County Health Care Center Fairbury--Jefferson Community Health Center Inc Falls City--Community Medical Center Inc Franklin--Franklin County Memorial Hospital Fremont--Fremont Area Medical Center Friend--Warren Memorial Hospital Geneva--Fillmore County Hospital Genoa--Genoa Community HospitalLTC Gordon--Gordon Memorial Hospital District Gothenburg--Gothenburg Memorial Hospital Grand Island--CHI Health St Francis Grant--Perkins County Health Services Hastings--Mary Lanning Memorial Hospital Hebron--Thayer County Health Services Henderson--Henderson Health Care Services Holdrege--Phelps Memorial Health Center Imperial--Chase County Community Hospital Kearney--CHI Health Good Samaritan Kearney--CHI Health Good Samaritan Pathology Kimball--Kimball Health Services amp Hospital Lexington--Tri-County Area Hospital District Lincoln--Bryan-LGH Medical Center East amp West Lincoln--CHI Health Saint Elizabeth Lincoln--Pathology Medical Services Lincoln--Williamsburg Radiation Center Lincoln--CHI Health Nebraska Heart Lincoln--UNMC College of Dentistry Lynch--Niobrara Valley Hospital Corp McCook--Community Hospital Minden--Kearney County Health Services Nebraska City--CHI Health St Marys Neligh--Antelope Memorial Hospital
Norfolk--Faith Regional Health Services East amp West North Platte--Great Plains Regional Medical Center North Platte--Pathology Services Oakland--Oakland Memorial Hospital Ogallala--Ogallala Community Hospital Omaha--CHI Health Bergan Mercy Omaha--CHI Health Immanuel Omaha--Childrens Hospital Omaha--VA Nebraska-Western Iowa Health Care System Omaha--Methodist Hospital Pathology Center Omaha--Nebraska Medical Center Omaha--Nebraska Methodist Hospital Omaha--CHI Health Creighton University Med Ctr Omaha--Boys Town National Research Hospital Omaha--CHI Health Lakeside Omaha--CHI Health Bergan Mercy Pathology Omaha--Bishop Clarkson Hospital Pathology Omaha--Creighton Pathology Associates Omaha--Physicians Lab ONeill--Avera St Anthonys Hospital Ord--Valley County Hospital Osceola--Annie Jeffrey Memorial County Health Ctr Oshkosh--Garden County Health Services Osmond--Osmond General Hospital Papillion--CHI Health Midlands Pawnee City--Pawnee County Memorial Hospital Pender--Pender Community Hospital Plainview--CHI Health Plainview Red Cloud--Webster County Community Hospital Schuyler--CHI Health Schuyler Scottsbluff--Regional West Medical Center Scottsbluff--Western Pathology Consultants Seward--Memorial Hospital Sidney--Memorial Health Center St Paul--Howard County Community Hospital Superior--Brodstone Memorial Hospital Syracuse--Community Memorial Hospital Tecumseh--Johnson County Hospital Tilden--Tilden Community Hospital Valentine--Cherry County Hospital Wahoo--Saunders County Health Services Wayne--Providence Medical Center West Point--St Francis Memorial Hospital Winnebago--USPHS Indian Hospital York--York General Hospital
Other States Sioux City IA--Mercy Medical Center
State cancer registries participating in the National Interstate Data Exchange Agreement and the state cancer registries of Illinois Kansas Minnesota Missouri and South Dakota
Nebraska Department of Health and Human ServicesCancer Registry 66
THE NEBRASKA DEPARTMENT OF HEALTH AND HUMAN SERVICES IS COMMITTED TO AFFIRMATIVE ACTION
EQUAL EMPLOYMENT OPPORTUNITIES AND DOES NOT DISCRIMINATE IN DELIVERING BENEFITS OR SERVICES
AAEOEADA
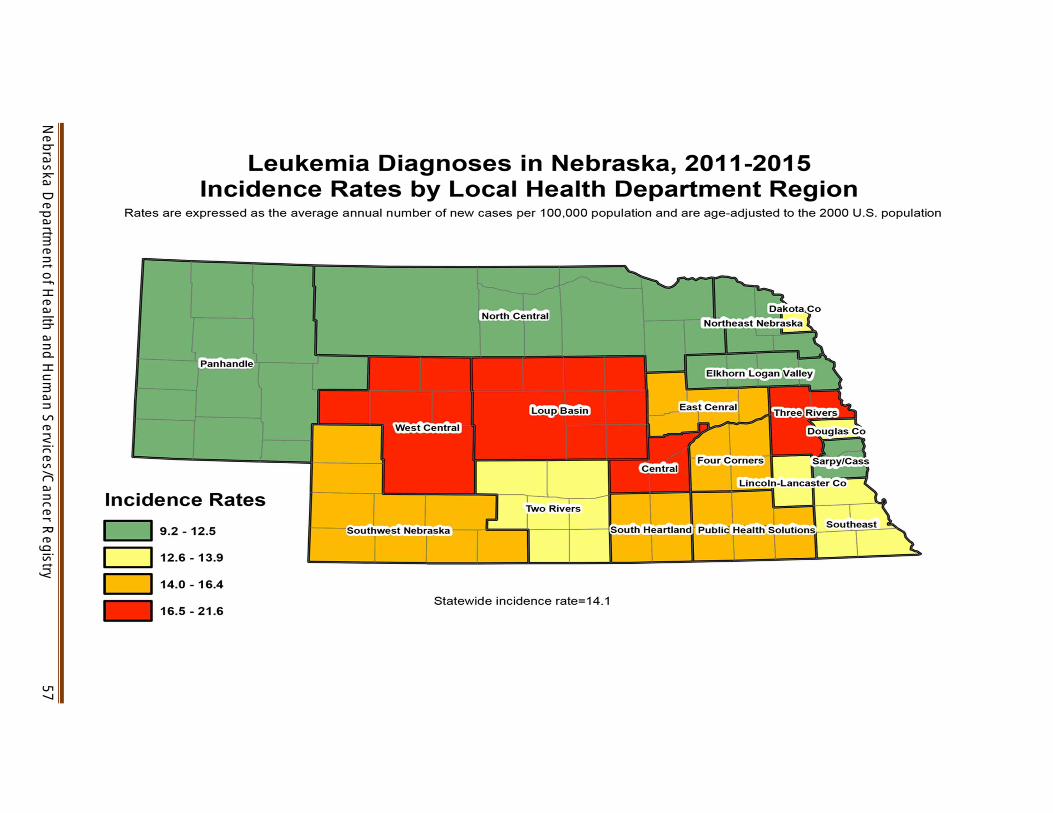
Nebraska D
epartment of H
ealth and Hum
an ServicesC
ancer Registry
59
Kidney amp Renal Pelvis Cancer Deaths in Nebraska 2011-2015 Mortality Rates by Local Health Department Region
Rates are expressed as the average annual number of deaths per 100000 population and age-adjusted to the 2000 U S population
Mortality Rates
2 4 - 3 8
39 - 42
43 - 55
56 - 69 Statewide mortality rate=45
Nebraska D
epartment of H
ealth and Hum
an ServicesC
ancer Registry
60
Nebraska D
epartment of H
ealth and Hum
an ServicesC
ancer Registry
61
Nebraska D
epartment of H
ealth and Hum
an ServicesC
ancer Registry
62
Nebraska D
epartment of H
ealth and Hum
an ServicesC
ancer Registry
63
Liver amp lntrahepatic Bile Ducts Cancer Deaths in Nebraska 2011-2015 Mortality Rates by Local Health Department Region
Rates are expressed as the average annual number of deaths per 100000 population and age-adjusted to the 2000 U S population
North Central
---1 West Central
Mortality Rates
12 - 36
37-41
5 3 - 9 3 Statewide mortality rate=4 7
Nebraska D
epartment of H
ealth and Hum
an ServicesC
ancer Registry
64
REFERENCES
American Cancer Society American Cancer Society Recommendations for the Early Detection of Breast Cancer 2017 Available at httpswwwcancerorgcancerbreast-cancerscreening-testsshyand-early-detectionamerican-cancer-society-recommendations-for-the-early-detection-of-breastshycancerhtml
American Cancer Society Cancer Facts and Figures 2018 Atlanta GA American Cancer Society 2018 Available at httpswwwcancerorgcontentdamcancer-orgresearchcancer-facts-and-statisticsannualshycancer-facts-and-figures2018cancer-facts-and-figures-2018pdf
American Cancer Society Colorectal Cancer Screening Guidelines 2018 Available at httpswwwcancerorghealth-care-professionalsamerican-cancer-society-prevention-earlyshydetection-guidelinescolorectal-cancer-screening-guidelineshtml
Fritz A Percy C Jack A Shanmugaratnam K Sobin L Parkin DM Whelan S International Classification of Diseases for Oncology 3rd edition (US interim version 2000) Geneva Switzerland World Health Organization 2000
National Cancer Institute SEER Cancer Stat Facts Bethesda MD National Cancer Institute Accessed on February 21 2018 Available at httpsseercancergovstatfacts
United States Cancer Statistics 1999-2014 Incidence CDC WONDER On-line Database US Department of Health and Human Services Centers for Disease Control and Prevention and National Cancer Institute 2016 Available at httpswondercdcgovcancer-v2014HTML
United States Cancer Statistics 1999-2014 Mortality CDC WONDER On-line Database US Department of Health and Human Services Centers for Disease Control and Prevention 2016 Available at httpswondercdcgovcancermort-v2014HTML
United States Department of Health and Human Services The Health Consequences of Smoking A Report of the Surgeon General US Department of Health and Human Services Centers for Disease Control and Prevention National Center for Chronic Disease Prevention and Health Promotion Office on Smoking and Health 2004 Available at httpswwwcdcgovtobaccodata_statisticssgr2004complete_reportindexhtm
US Preventive Services Task Force Final Recommendation Statement Breast Cancer Screening November 2016 Available at httpwwwuspreventiveservicestaskforceorgPageDocumentRecommendationStatementFinalb reast-cancer-screening1
US Preventive Services Task Force Final Recommendation Statement Colorectal Cancer Screening June 2017 Available at httpswwwuspreventiveservicestaskforceorgPageDocumentRecommendationStatementFinal colorectal-cancer-screening2
US Preventive Services Task Force Final Recommendation Statement Lung Cancer Screening December 2016 Available at httpwwwuspreventiveservicestaskforceorgPageDocumentRecommendationStatementFinall ung-cancer-screening
World Health Organization Manual of the International Statistical Classification of Diseases and Related Health Problems 10th revision Geneva Switzerland World Health Organization 1992
Nebraska Department of Health and Human ServicesCancer Registry 65
REPORTING FACILITIES
Ainsworth--Brown County Hospital Albion--Boone County Health Center Alliance--Box Butte General Hospital Alma--Harlan County Health System Atkinson--West Holt Memorial Hospital Inc Auburn--Nemaha County Hospital Aurora--Memorial Hospital Bassett--Rock County Hospital Beatrice--Beatrice Community Hospital amp Health Center Inc Benkelman--Dundy County Hospital Blair--Memorial Community Hospital Bridgeport--Morrill County Community Hospital Broken Bow--Jennie Melham Memorial Medical Ctr Callaway--Callaway District Hospital Cambridge--Tri Valley Health System Central City--Litzenberg Memorial County Hospital Chadron--Chadron Community Hospital amp Health Services Columbus--Columbus Community Hospital Inc Cozad--Cozad Community Hospital Creighton--Creighton Area Health Services Crete--Crete Area Medical Center David City--Butler County Health Care Center Fairbury--Jefferson Community Health Center Inc Falls City--Community Medical Center Inc Franklin--Franklin County Memorial Hospital Fremont--Fremont Area Medical Center Friend--Warren Memorial Hospital Geneva--Fillmore County Hospital Genoa--Genoa Community HospitalLTC Gordon--Gordon Memorial Hospital District Gothenburg--Gothenburg Memorial Hospital Grand Island--CHI Health St Francis Grant--Perkins County Health Services Hastings--Mary Lanning Memorial Hospital Hebron--Thayer County Health Services Henderson--Henderson Health Care Services Holdrege--Phelps Memorial Health Center Imperial--Chase County Community Hospital Kearney--CHI Health Good Samaritan Kearney--CHI Health Good Samaritan Pathology Kimball--Kimball Health Services amp Hospital Lexington--Tri-County Area Hospital District Lincoln--Bryan-LGH Medical Center East amp West Lincoln--CHI Health Saint Elizabeth Lincoln--Pathology Medical Services Lincoln--Williamsburg Radiation Center Lincoln--CHI Health Nebraska Heart Lincoln--UNMC College of Dentistry Lynch--Niobrara Valley Hospital Corp McCook--Community Hospital Minden--Kearney County Health Services Nebraska City--CHI Health St Marys Neligh--Antelope Memorial Hospital
Norfolk--Faith Regional Health Services East amp West North Platte--Great Plains Regional Medical Center North Platte--Pathology Services Oakland--Oakland Memorial Hospital Ogallala--Ogallala Community Hospital Omaha--CHI Health Bergan Mercy Omaha--CHI Health Immanuel Omaha--Childrens Hospital Omaha--VA Nebraska-Western Iowa Health Care System Omaha--Methodist Hospital Pathology Center Omaha--Nebraska Medical Center Omaha--Nebraska Methodist Hospital Omaha--CHI Health Creighton University Med Ctr Omaha--Boys Town National Research Hospital Omaha--CHI Health Lakeside Omaha--CHI Health Bergan Mercy Pathology Omaha--Bishop Clarkson Hospital Pathology Omaha--Creighton Pathology Associates Omaha--Physicians Lab ONeill--Avera St Anthonys Hospital Ord--Valley County Hospital Osceola--Annie Jeffrey Memorial County Health Ctr Oshkosh--Garden County Health Services Osmond--Osmond General Hospital Papillion--CHI Health Midlands Pawnee City--Pawnee County Memorial Hospital Pender--Pender Community Hospital Plainview--CHI Health Plainview Red Cloud--Webster County Community Hospital Schuyler--CHI Health Schuyler Scottsbluff--Regional West Medical Center Scottsbluff--Western Pathology Consultants Seward--Memorial Hospital Sidney--Memorial Health Center St Paul--Howard County Community Hospital Superior--Brodstone Memorial Hospital Syracuse--Community Memorial Hospital Tecumseh--Johnson County Hospital Tilden--Tilden Community Hospital Valentine--Cherry County Hospital Wahoo--Saunders County Health Services Wayne--Providence Medical Center West Point--St Francis Memorial Hospital Winnebago--USPHS Indian Hospital York--York General Hospital
Other States Sioux City IA--Mercy Medical Center
State cancer registries participating in the National Interstate Data Exchange Agreement and the state cancer registries of Illinois Kansas Minnesota Missouri and South Dakota
Nebraska Department of Health and Human ServicesCancer Registry 66
THE NEBRASKA DEPARTMENT OF HEALTH AND HUMAN SERVICES IS COMMITTED TO AFFIRMATIVE ACTION
EQUAL EMPLOYMENT OPPORTUNITIES AND DOES NOT DISCRIMINATE IN DELIVERING BENEFITS OR SERVICES
AAEOEADA

Nebraska D
epartment of H
ealth and Hum
an ServicesC
ancer Registry
61
Nebraska D
epartment of H
ealth and Hum
an ServicesC
ancer Registry
62
Nebraska D
epartment of H
ealth and Hum
an ServicesC
ancer Registry
63
Liver amp lntrahepatic Bile Ducts Cancer Deaths in Nebraska 2011-2015 Mortality Rates by Local Health Department Region
Rates are expressed as the average annual number of deaths per 100000 population and age-adjusted to the 2000 U S population
North Central
---1 West Central
Mortality Rates
12 - 36
37-41
5 3 - 9 3 Statewide mortality rate=4 7
Nebraska D
epartment of H
ealth and Hum
an ServicesC
ancer Registry
64
REFERENCES
American Cancer Society American Cancer Society Recommendations for the Early Detection of Breast Cancer 2017 Available at httpswwwcancerorgcancerbreast-cancerscreening-testsshyand-early-detectionamerican-cancer-society-recommendations-for-the-early-detection-of-breastshycancerhtml
American Cancer Society Cancer Facts and Figures 2018 Atlanta GA American Cancer Society 2018 Available at httpswwwcancerorgcontentdamcancer-orgresearchcancer-facts-and-statisticsannualshycancer-facts-and-figures2018cancer-facts-and-figures-2018pdf
American Cancer Society Colorectal Cancer Screening Guidelines 2018 Available at httpswwwcancerorghealth-care-professionalsamerican-cancer-society-prevention-earlyshydetection-guidelinescolorectal-cancer-screening-guidelineshtml
Fritz A Percy C Jack A Shanmugaratnam K Sobin L Parkin DM Whelan S International Classification of Diseases for Oncology 3rd edition (US interim version 2000) Geneva Switzerland World Health Organization 2000
National Cancer Institute SEER Cancer Stat Facts Bethesda MD National Cancer Institute Accessed on February 21 2018 Available at httpsseercancergovstatfacts
United States Cancer Statistics 1999-2014 Incidence CDC WONDER On-line Database US Department of Health and Human Services Centers for Disease Control and Prevention and National Cancer Institute 2016 Available at httpswondercdcgovcancer-v2014HTML
United States Cancer Statistics 1999-2014 Mortality CDC WONDER On-line Database US Department of Health and Human Services Centers for Disease Control and Prevention 2016 Available at httpswondercdcgovcancermort-v2014HTML
United States Department of Health and Human Services The Health Consequences of Smoking A Report of the Surgeon General US Department of Health and Human Services Centers for Disease Control and Prevention National Center for Chronic Disease Prevention and Health Promotion Office on Smoking and Health 2004 Available at httpswwwcdcgovtobaccodata_statisticssgr2004complete_reportindexhtm
US Preventive Services Task Force Final Recommendation Statement Breast Cancer Screening November 2016 Available at httpwwwuspreventiveservicestaskforceorgPageDocumentRecommendationStatementFinalb reast-cancer-screening1
US Preventive Services Task Force Final Recommendation Statement Colorectal Cancer Screening June 2017 Available at httpswwwuspreventiveservicestaskforceorgPageDocumentRecommendationStatementFinal colorectal-cancer-screening2
US Preventive Services Task Force Final Recommendation Statement Lung Cancer Screening December 2016 Available at httpwwwuspreventiveservicestaskforceorgPageDocumentRecommendationStatementFinall ung-cancer-screening
World Health Organization Manual of the International Statistical Classification of Diseases and Related Health Problems 10th revision Geneva Switzerland World Health Organization 1992
Nebraska Department of Health and Human ServicesCancer Registry 65
REPORTING FACILITIES
Ainsworth--Brown County Hospital Albion--Boone County Health Center Alliance--Box Butte General Hospital Alma--Harlan County Health System Atkinson--West Holt Memorial Hospital Inc Auburn--Nemaha County Hospital Aurora--Memorial Hospital Bassett--Rock County Hospital Beatrice--Beatrice Community Hospital amp Health Center Inc Benkelman--Dundy County Hospital Blair--Memorial Community Hospital Bridgeport--Morrill County Community Hospital Broken Bow--Jennie Melham Memorial Medical Ctr Callaway--Callaway District Hospital Cambridge--Tri Valley Health System Central City--Litzenberg Memorial County Hospital Chadron--Chadron Community Hospital amp Health Services Columbus--Columbus Community Hospital Inc Cozad--Cozad Community Hospital Creighton--Creighton Area Health Services Crete--Crete Area Medical Center David City--Butler County Health Care Center Fairbury--Jefferson Community Health Center Inc Falls City--Community Medical Center Inc Franklin--Franklin County Memorial Hospital Fremont--Fremont Area Medical Center Friend--Warren Memorial Hospital Geneva--Fillmore County Hospital Genoa--Genoa Community HospitalLTC Gordon--Gordon Memorial Hospital District Gothenburg--Gothenburg Memorial Hospital Grand Island--CHI Health St Francis Grant--Perkins County Health Services Hastings--Mary Lanning Memorial Hospital Hebron--Thayer County Health Services Henderson--Henderson Health Care Services Holdrege--Phelps Memorial Health Center Imperial--Chase County Community Hospital Kearney--CHI Health Good Samaritan Kearney--CHI Health Good Samaritan Pathology Kimball--Kimball Health Services amp Hospital Lexington--Tri-County Area Hospital District Lincoln--Bryan-LGH Medical Center East amp West Lincoln--CHI Health Saint Elizabeth Lincoln--Pathology Medical Services Lincoln--Williamsburg Radiation Center Lincoln--CHI Health Nebraska Heart Lincoln--UNMC College of Dentistry Lynch--Niobrara Valley Hospital Corp McCook--Community Hospital Minden--Kearney County Health Services Nebraska City--CHI Health St Marys Neligh--Antelope Memorial Hospital
Norfolk--Faith Regional Health Services East amp West North Platte--Great Plains Regional Medical Center North Platte--Pathology Services Oakland--Oakland Memorial Hospital Ogallala--Ogallala Community Hospital Omaha--CHI Health Bergan Mercy Omaha--CHI Health Immanuel Omaha--Childrens Hospital Omaha--VA Nebraska-Western Iowa Health Care System Omaha--Methodist Hospital Pathology Center Omaha--Nebraska Medical Center Omaha--Nebraska Methodist Hospital Omaha--CHI Health Creighton University Med Ctr Omaha--Boys Town National Research Hospital Omaha--CHI Health Lakeside Omaha--CHI Health Bergan Mercy Pathology Omaha--Bishop Clarkson Hospital Pathology Omaha--Creighton Pathology Associates Omaha--Physicians Lab ONeill--Avera St Anthonys Hospital Ord--Valley County Hospital Osceola--Annie Jeffrey Memorial County Health Ctr Oshkosh--Garden County Health Services Osmond--Osmond General Hospital Papillion--CHI Health Midlands Pawnee City--Pawnee County Memorial Hospital Pender--Pender Community Hospital Plainview--CHI Health Plainview Red Cloud--Webster County Community Hospital Schuyler--CHI Health Schuyler Scottsbluff--Regional West Medical Center Scottsbluff--Western Pathology Consultants Seward--Memorial Hospital Sidney--Memorial Health Center St Paul--Howard County Community Hospital Superior--Brodstone Memorial Hospital Syracuse--Community Memorial Hospital Tecumseh--Johnson County Hospital Tilden--Tilden Community Hospital Valentine--Cherry County Hospital Wahoo--Saunders County Health Services Wayne--Providence Medical Center West Point--St Francis Memorial Hospital Winnebago--USPHS Indian Hospital York--York General Hospital
Other States Sioux City IA--Mercy Medical Center
State cancer registries participating in the National Interstate Data Exchange Agreement and the state cancer registries of Illinois Kansas Minnesota Missouri and South Dakota
Nebraska Department of Health and Human ServicesCancer Registry 66
THE NEBRASKA DEPARTMENT OF HEALTH AND HUMAN SERVICES IS COMMITTED TO AFFIRMATIVE ACTION
EQUAL EMPLOYMENT OPPORTUNITIES AND DOES NOT DISCRIMINATE IN DELIVERING BENEFITS OR SERVICES
AAEOEADA
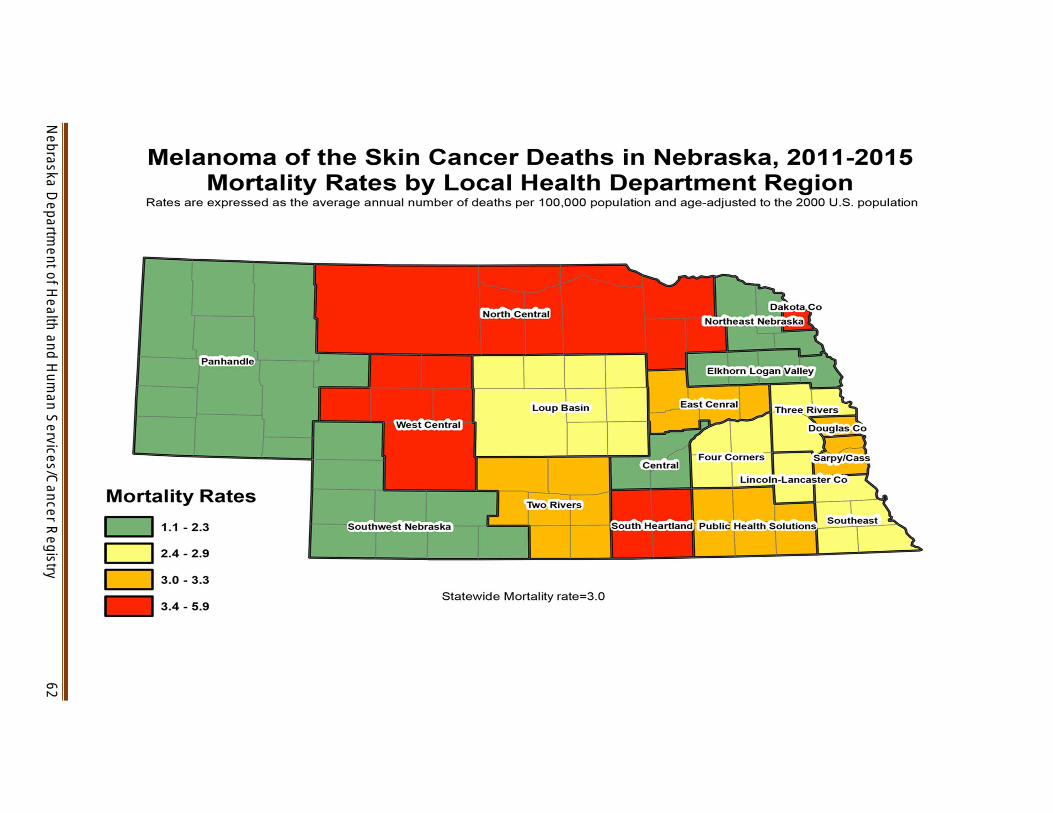
Nebraska D
epartment of H
ealth and Hum
an ServicesC
ancer Registry
63
Liver amp lntrahepatic Bile Ducts Cancer Deaths in Nebraska 2011-2015 Mortality Rates by Local Health Department Region
Rates are expressed as the average annual number of deaths per 100000 population and age-adjusted to the 2000 U S population
North Central
---1 West Central
Mortality Rates
12 - 36
37-41
5 3 - 9 3 Statewide mortality rate=4 7
Nebraska D
epartment of H
ealth and Hum
an ServicesC
ancer Registry
64
REFERENCES
American Cancer Society American Cancer Society Recommendations for the Early Detection of Breast Cancer 2017 Available at httpswwwcancerorgcancerbreast-cancerscreening-testsshyand-early-detectionamerican-cancer-society-recommendations-for-the-early-detection-of-breastshycancerhtml
American Cancer Society Cancer Facts and Figures 2018 Atlanta GA American Cancer Society 2018 Available at httpswwwcancerorgcontentdamcancer-orgresearchcancer-facts-and-statisticsannualshycancer-facts-and-figures2018cancer-facts-and-figures-2018pdf
American Cancer Society Colorectal Cancer Screening Guidelines 2018 Available at httpswwwcancerorghealth-care-professionalsamerican-cancer-society-prevention-earlyshydetection-guidelinescolorectal-cancer-screening-guidelineshtml
Fritz A Percy C Jack A Shanmugaratnam K Sobin L Parkin DM Whelan S International Classification of Diseases for Oncology 3rd edition (US interim version 2000) Geneva Switzerland World Health Organization 2000
National Cancer Institute SEER Cancer Stat Facts Bethesda MD National Cancer Institute Accessed on February 21 2018 Available at httpsseercancergovstatfacts
United States Cancer Statistics 1999-2014 Incidence CDC WONDER On-line Database US Department of Health and Human Services Centers for Disease Control and Prevention and National Cancer Institute 2016 Available at httpswondercdcgovcancer-v2014HTML
United States Cancer Statistics 1999-2014 Mortality CDC WONDER On-line Database US Department of Health and Human Services Centers for Disease Control and Prevention 2016 Available at httpswondercdcgovcancermort-v2014HTML
United States Department of Health and Human Services The Health Consequences of Smoking A Report of the Surgeon General US Department of Health and Human Services Centers for Disease Control and Prevention National Center for Chronic Disease Prevention and Health Promotion Office on Smoking and Health 2004 Available at httpswwwcdcgovtobaccodata_statisticssgr2004complete_reportindexhtm
US Preventive Services Task Force Final Recommendation Statement Breast Cancer Screening November 2016 Available at httpwwwuspreventiveservicestaskforceorgPageDocumentRecommendationStatementFinalb reast-cancer-screening1
US Preventive Services Task Force Final Recommendation Statement Colorectal Cancer Screening June 2017 Available at httpswwwuspreventiveservicestaskforceorgPageDocumentRecommendationStatementFinal colorectal-cancer-screening2
US Preventive Services Task Force Final Recommendation Statement Lung Cancer Screening December 2016 Available at httpwwwuspreventiveservicestaskforceorgPageDocumentRecommendationStatementFinall ung-cancer-screening
World Health Organization Manual of the International Statistical Classification of Diseases and Related Health Problems 10th revision Geneva Switzerland World Health Organization 1992
Nebraska Department of Health and Human ServicesCancer Registry 65
REPORTING FACILITIES
Ainsworth--Brown County Hospital Albion--Boone County Health Center Alliance--Box Butte General Hospital Alma--Harlan County Health System Atkinson--West Holt Memorial Hospital Inc Auburn--Nemaha County Hospital Aurora--Memorial Hospital Bassett--Rock County Hospital Beatrice--Beatrice Community Hospital amp Health Center Inc Benkelman--Dundy County Hospital Blair--Memorial Community Hospital Bridgeport--Morrill County Community Hospital Broken Bow--Jennie Melham Memorial Medical Ctr Callaway--Callaway District Hospital Cambridge--Tri Valley Health System Central City--Litzenberg Memorial County Hospital Chadron--Chadron Community Hospital amp Health Services Columbus--Columbus Community Hospital Inc Cozad--Cozad Community Hospital Creighton--Creighton Area Health Services Crete--Crete Area Medical Center David City--Butler County Health Care Center Fairbury--Jefferson Community Health Center Inc Falls City--Community Medical Center Inc Franklin--Franklin County Memorial Hospital Fremont--Fremont Area Medical Center Friend--Warren Memorial Hospital Geneva--Fillmore County Hospital Genoa--Genoa Community HospitalLTC Gordon--Gordon Memorial Hospital District Gothenburg--Gothenburg Memorial Hospital Grand Island--CHI Health St Francis Grant--Perkins County Health Services Hastings--Mary Lanning Memorial Hospital Hebron--Thayer County Health Services Henderson--Henderson Health Care Services Holdrege--Phelps Memorial Health Center Imperial--Chase County Community Hospital Kearney--CHI Health Good Samaritan Kearney--CHI Health Good Samaritan Pathology Kimball--Kimball Health Services amp Hospital Lexington--Tri-County Area Hospital District Lincoln--Bryan-LGH Medical Center East amp West Lincoln--CHI Health Saint Elizabeth Lincoln--Pathology Medical Services Lincoln--Williamsburg Radiation Center Lincoln--CHI Health Nebraska Heart Lincoln--UNMC College of Dentistry Lynch--Niobrara Valley Hospital Corp McCook--Community Hospital Minden--Kearney County Health Services Nebraska City--CHI Health St Marys Neligh--Antelope Memorial Hospital
Norfolk--Faith Regional Health Services East amp West North Platte--Great Plains Regional Medical Center North Platte--Pathology Services Oakland--Oakland Memorial Hospital Ogallala--Ogallala Community Hospital Omaha--CHI Health Bergan Mercy Omaha--CHI Health Immanuel Omaha--Childrens Hospital Omaha--VA Nebraska-Western Iowa Health Care System Omaha--Methodist Hospital Pathology Center Omaha--Nebraska Medical Center Omaha--Nebraska Methodist Hospital Omaha--CHI Health Creighton University Med Ctr Omaha--Boys Town National Research Hospital Omaha--CHI Health Lakeside Omaha--CHI Health Bergan Mercy Pathology Omaha--Bishop Clarkson Hospital Pathology Omaha--Creighton Pathology Associates Omaha--Physicians Lab ONeill--Avera St Anthonys Hospital Ord--Valley County Hospital Osceola--Annie Jeffrey Memorial County Health Ctr Oshkosh--Garden County Health Services Osmond--Osmond General Hospital Papillion--CHI Health Midlands Pawnee City--Pawnee County Memorial Hospital Pender--Pender Community Hospital Plainview--CHI Health Plainview Red Cloud--Webster County Community Hospital Schuyler--CHI Health Schuyler Scottsbluff--Regional West Medical Center Scottsbluff--Western Pathology Consultants Seward--Memorial Hospital Sidney--Memorial Health Center St Paul--Howard County Community Hospital Superior--Brodstone Memorial Hospital Syracuse--Community Memorial Hospital Tecumseh--Johnson County Hospital Tilden--Tilden Community Hospital Valentine--Cherry County Hospital Wahoo--Saunders County Health Services Wayne--Providence Medical Center West Point--St Francis Memorial Hospital Winnebago--USPHS Indian Hospital York--York General Hospital
Other States Sioux City IA--Mercy Medical Center
State cancer registries participating in the National Interstate Data Exchange Agreement and the state cancer registries of Illinois Kansas Minnesota Missouri and South Dakota
Nebraska Department of Health and Human ServicesCancer Registry 66
THE NEBRASKA DEPARTMENT OF HEALTH AND HUMAN SERVICES IS COMMITTED TO AFFIRMATIVE ACTION
EQUAL EMPLOYMENT OPPORTUNITIES AND DOES NOT DISCRIMINATE IN DELIVERING BENEFITS OR SERVICES
AAEOEADA
THE NEBRASKA DEPARTMENT OF HEALTH AND HUMAN SERVICES IS COMMITTED TO AFFIRMATIVE ACTION
EQUAL EMPLOYMENT OPPORTUNITIES AND DOES NOT DISCRIMINATE IN DELIVERING BENEFITS OR SERVICES
AAEOEADA


