113
Cancer New registrations and deaths 2013 Released 2016 health.govt.nz
CancerNew registrations and deaths
2013
Released 2016 health.govt.nz
Citation: Ministry of Health. 2016. Cancer: New registrations and deaths 2013. Wellington: Ministry of Health.
Published in November 2016by the Ministry of Health
PO Box 5013, Wellington 6140, New Zealand
ISBN 978-0-947515-75-1 (online)HP 6506
This document is available at health.govt.nz
This work is licensed under the Creative Commons Attribution 4.0 International licence. In essence, you are free to: share ie, copy and redistribute the material in any medium or format; adapt ie, remix, transform and build upon the material. You must give appropriate credit, provide a link to the licence and indicate if changes were made.
AcknowledgementsMany people have assisted in the production of this publication. In particular, the Ministry of Health thanks the peer reviewers for their valuable contribution.
SourceCancer registration data for this publication is sourced from the New Zealand Cancer Registry, and mortality data is sourced from the New Zealand Mortality Collection. Both are held by the Ministry of Health.
DisclaimerThe purpose of this publication is to inform discussion and assist policy development. The opinions expressed in the publication do not necessarily reflect the official views of the Ministry of Health.
All care has been taken in the production of this publication. The data is considered to be accurate at the time of publication, but may be subject to slight changes over time as further information is received. It is advisable to check the current status of figures given here with the Ministry of Health before quoting or using them in further analysis.
National collection, coding and collation of cancer registrations is a complex process. This is because the information in the New Zealand Cancer Registry comes from laboratory reports, hospital information and mortality information, and cannot be finalised until data has become available from all sources. In addition, several steps are required to ensure the final information is of good quality.
The Ministry of Health makes no warranty, expressed or implied, nor assumes any legal liability or responsibility for the accuracy, correctness, completeness or use of the information or data in this publication. Further, the Ministry of Health shall not be liable for any loss or damage arising directly or indirectly from the information or data presented in this publication.
The Ministry of Health welcomes comments and suggestions about this publication.
Cancer: New registrations and deaths 2013 iii

ContentsKey facts for 2013
Cancer registrationsCancer deaths
IntroductionOverviewData sourcesStructureHow cancers are grouped in this reportData presentation
New cancer registrationsRegistrations in 2013Registrations between 2004 and 2013Common cancersLife-stage age groupsMāori and non-MāoriDeprivationVariation within New Zealand, 2011–2013
Cancer deathsCancer deaths in 2013Cancer deaths between 2004 and 2013Common cancer deathsLife-stage age groupsMāori and non-MāoriDeprivationVariation within New Zealand 2011–2013
AppendicesAppendix A: Technical notesAppendix B: Cancer registrations and deaths data for all cancers, 2013Appendix C: Full text of the Cancer Registry Act 1993Appendix D: Full text of the Cancer Registry Regulations 1994
References
List of Tables
Cancer: New registrations and deaths 2013 v
Table 1: Grouped cancers and relevant ICD three-character codesTable 2: Number and rate of cancer registrations, by sex, 2004–2013
Table 3: Numbers and rates of cancer deaths, by sex, 2004–2013Table A1: The WHO World Standard population distribution
Table A2: Examples of 2006 domicile records and linked 2006 and 2013 New Zealand deprivation index quintiles
Table A3: Distribution of sex and ethnic groups among records included and excluded from deprivation analysis presented in this report, percentages
Table A4: Distribution of deprivation among records included and excluded from deprivation analysis presented in this report, percentages
Table B1: Numbers and rates of new cancer cases, by cancer type and sex, 2013
Table B2: Numbers and rates of new cancer cases, by cancer type and sex, for Māori, 2013
Table B3: Numbers and rates of new cancer cases, by cancer type and sex, for non-Māori, 2013
Table B4: Numbers and rates of cancer deaths, by cancer type and sex, 2013
Table B5: Numbers and rates of cancer deaths, by cancer type and sex, for Māori, 2013
Table B6: Numbers and rates of cancer deaths, by cancer type and sex, for non-Māori, 2013
List of FiguresFigure 1: Numbers and age-specific rates of cancer registrations, by age
group, 2013
Figure 2: Age-specific rates of cancer, by sex and age group, 2013Figure 3: Number and rate of cancer registrations, 2004–2013
Figure 4: Number and rate of cancer registrations, by sex, 2004–2013Figure 5: The 10 most common cancers in males, 2013
Figure 6: The 10 most common cancers in females, 2013Figure 7: Cancer registration rates for males and females, by life-stage
group,2004–2013
Figure 8: The most common cancer registrations for males and females aged0–24 years, 2013
Figure 9: The most common cancer registrations for males and females aged25–44 years, 2013
vi Cancer: New registrations and deaths 2013
Figure 10: The most common cancer registrations for males and females aged45–64 years, 2013
Figure 11: The most common cancer registrations for males and females aged65–74 years, 2013
Figure 12: The most common cancer registrations for males and females aged 75 years and older, 2013
Figure 13: Cancer registration rates for males and females, by ethnic group, 2004–2013
Figure 14: Cancer registration rates of the most common cancers for Māori and non-Māori males, 2013
Figure 15: Cancer registration rates of the most common cancers for Māori and non-Māori females, 2013
Figure 16: Cancer registration rates for males and females, by deprivation quintile, 2013
Figure 17: Registration rates of the most common cancers for males, by deprivation quintile, 2013
Figure 18: Registration rates of the most common female cancers, by deprivation quintile, 2013
Figure 19: Cancer registration rates, by DHB, 2011–2013Figure 20: Comparison of DHB region cancer registration rates, 2011–2013
Figure 21: Numbers and age-specific rates of cancer deaths, by age group, 2013
Figure 22: Age-specific rates of cancer death, by sex and age group, 2013Figure 23: Numbers and rate of cancer deaths, 2004–2013
Figure 24: Numbers and rates of cancer deaths, by sex, 2004–2013Figure 25: The 10 most common cancer deaths in males, 2013
Figure 26: The 10 most common cancer deaths in females, 2012Figure 27: Cancer mortality rates for males and females, by life-stage group,
2004–2013Figure 28: The most common causes of cancer death for males and females
aged0–24 years, 2013
Figure 29: The most common causes of cancer death for males and females aged25–44 years, 2013
Figure 30: The most common causes of cancer death for males and females aged45–64 years, 2013
Figure 30: The most common causes of cancer death for males and females aged45–64 years, 2013
Cancer: New registrations and deaths 2013 vii
Figure 32: The most common causes of cancer death for males and females aged 75+ years, 2013
Figure 33: Cancer mortality rates for males and females, by ethnic group, 2004–2013
Figure 34: Cancer mortality rates of most common cancer deaths for Māori and non-Māori males, 2013
Figure 35: Cancer mortality rates of most common cancer deaths for Māori and non-Māori females, 2013
Figure 36: Cancer mortality rates, by deprivation quintile, 2013Figure 37: Mortality rates of the most common causes of cancer death for
males, by deprivation quintile, 2013Figure 38: Mortality rates of the most common causes of cancer death for
females, by deprivation quintile, 2013Figure 39: Cancer mortality rates, by DHB, 2011–2013
Figure 40: Comparison of DHB region cancer mortality rates, 2011–2013Figure A1: Data and the New Zealand Cancer Registry
viii Cancer: New registrations and deaths 2013
Cancer: New registrations and deaths 2013 ix

Key facts for 2013Cancer registrations There were 22,166 new cases of cancer registered in New Zealand. More than half of cancers registered were for males (11,491 cases, 52%). The age-standardised registration rate was 335.5 cases per 100,000 population.
Most common cancers The most commonly registered cancers were prostate (3129 cases), colorectal
(3075), breast (3046), melanoma (2366) and lung (2037). For males the most commonly registered cancers were prostate (3129 cases),
colorectal (1622), melanoma (1226), lung (1032) and non-Hodgkin lymphoma (462).
For females the most commonly registered cancers were breast (3020 cases), colorectal (1453), melanoma (1140), lung (1005) and uterine (542).
Age People aged 60 years and older accounted for nearly 7 out of 10 new cancer
cases. In people aged 0–24 years the most common cancer registered was leukaemia,
for both males and females. In people aged 25–44 years the most common cancer registered was melanoma
for males and breast cancer for females. In people aged 45–64 and 65–74 years the most common cancer registered was
prostate cancer for males and breast cancer for females. In people aged 75 years and older the most common cancer registered was
prostate cancer for males and colorectal cancer for females.
Ethnic group A total of 2220 Māori and 19,946 non-Māori were registered with cancer. Māori had a registration rate of 418.9 per 100,000 Māori population, which was
27.6 percent higher than the rate for non-Māori (328.2 per 100,000 non-Māori population).
District Health Board (2011–2013) The highest registration rate for 2011–2013 was in Whanganui District Health
Board (DHB) (359.0 per 100,000), followed by Lakes DHB (356.2 per 100,000). The lowest registration rate was in Nelson Marlborough DHB (306.7 per 100,000), followed by Capital & Coast DHB (314.8 per 100,000).
x Cancer: New registrations and deaths 2013
Cancer deaths There were 9063 deaths due to cancer in New Zealand. More than half of cancer deaths were male (4821 cases, 53.2%). The age-standardised mortality rate was 122.8 deaths per 100,000 population.
Most common cancer deaths The most common cancer deaths were from lung (1656 deaths), colorectal
(1252), prostate (647), breast (641) and pancreatic (463) cancer. For males the most common cancer deaths were from lung (864 deaths),
colorectal (659), prostate (647), melanoma (232) and pancreatic (215) cancer. For females the most common cancer deaths were from lung (792 deaths),
breast (633), colorectal (593), pancreatic (248) and ovarian (178) cancer.
Age People aged 65 years and older accounted for at least 7 out of 10 cancer deaths. In people aged 0–24 years the most common causes of cancer death were
leukaemia, bone and articular cartilage and brain cancers for males, and brain cancer for females.
In people aged 25–44 years the most common cause of cancer death was brain cancer for males and breast cancer for females.
In people aged 45–64 years the most common cause of cancer death was lung cancer for males and breast cancer for females.
In people aged 65–74 years the most common cause of cancer death was lung cancer for both males and females.
In people aged 75 years and older the most common cause of cancer death was prostate cancer for males and colorectal cancer for females.
Ethnic group A total of 989 Māori and 8074 non-Māori died from cancer. Māori had a cancer mortality rate of 197.9 per 100,000 Māori population, which
was 1.7 times the rate for non-Māori (116.0 per 100,000 non-Māori population).
District Health Board (2011–2013) The highest cancer mortality rate for 2011–2013 was in Lakes DHB (143.5 per
100,000), followed by Northland DHB (141.7 per 100,000). The lowest mortality rates were in Auckland and Waitemata DHBs (110.4 and 110.7 per 100,000 respectively).
Cancer: New registrations and deaths 2013 xi
IntroductionOverviewCancer: New registrations and deaths 2013 presents information about new cases of primary cancer diagnosed and reported to the New Zealand Cancer Registry for the 2013 calendar year. It also presents information on deaths registered in New Zealand in the same time period where cancer was recorded as the underlying cause of death.
Data sourcesNew cancer cases diagnosed in New Zealand are registered with the New Zealand Cancer Registry. Cancers are registered once, in the year of their first known diagnosis. Registrations cover new cases of primary cancer, or secondary cancers where the primary cancer is unknown. The data in this publication is incident registrations, this means that if a person has more than one different primary cancer tumour registered in a year then they will be counted more than once.
Data in this publication relating to cancer deaths comes from the New Zealand Mortality Collection (see Appendix A for further information).
StructureCancer: new registrations and deathsThis report presents information for cancer registrations followed by information for cancer deaths for 2013. Both sections follow the same format, presenting data by sex, age, ethnicity, deprivation quintile and DHB region of domicile. Data is presented for all cancers combined, followed by a focus on the most common cancer registrations and deaths for the above breakdowns, except DHB regions. Some data is presented from 2004 to 2013 to provide a time trend.
Data is presented in graphs and maps so that you can observe trends and relationships. Graphs and maps are not designed as a means for you to look up individual values. The underlying numbers used to create graphs and maps in this publication are provided in the accompanying online tables (‘Cancer trends 2013’).
Appendix B provides supplementary tables containing numbers and rates of cancer registrations and deaths for all individual cancers and cancer groups.
Cancer: New registrations and deaths 2013 1
Online accompanying tables: Cancer trends 2013The online tables that accompany this report provide the following additional data: selected cancers: key commentary for registration and mortality data (numbers
and rates) for a selection of the most common cancers, by Māori and non-Māori, and by sex, 2004–2013
cancer groups: mortality data (numbers and rates) for all cancer sites, by sex, 2013
individual cancers: numbers of deaths for individual cancer sites, by sex, ethnic group, life-stage group, deprivation quintile, DHB region of domicile and regional cancer network, 2013.
How cancers are grouped in this reportThis report classifies cancers using the International Statistical Classification of Diseases and Related Health Problems, Tenth Revision, Australian Modification (ICD-10-AM), sixth edition. It uses the International Classification of Diseases for Oncology (ICD-O), third edition, to classify the morphology (histology, type and behaviour) of tumours.
In this report data for all cancers combined includes ICD codes C00–C96 and D45–D47. Cancers are presented at the level of the ICD three-character code (eg, breast cancer is C50). A number of cancers referred to in this report are a group of two or more three-character ICD codes. These cancers and the relevant codes are outlined in Table 1. Appendix B, Tables B1–B6, provide figures for all ICD three-character code cancer sites.
Table 1: Grouped cancers and relevant ICD three-character codes
Cancer (ICD codes) Sites (ICD three-character code)
Bone and articular cartilage(C40–C41)
Bone and articular cartilage of limbs (C40) Bone and articular cartilage of other and unspecified sites (C41)
Colorectal cancer(C18–C21)
Colon (C18) Rectosigmoid junction (C19) Rectum (C20) Anus and anal canal (C21)
Lung cancer(C33–C34)
Trachea (C33) Bronchus and lung (C34)
Leukaemia(C91–C95)
Lymphoid leukaemia (C91) Myeloid leukaemia (C92) Monocytic leukaemia (C93) Other leukaemias of specified cell type (C94) Leukaemia of unspecified cell type (C95)
Non-Hodgkin lymphoma(C82–C85, C96)
Follicular (nodular) non-Hodgkin lymphoma (C82) Diffuse non-Hodgkin lymphoma (C83) Peripheral and cutaneous T-cell lymphomas (C84) Other and unspecified types of non-Hodgkin lymphoma (C85) Other and unspecified malignant neoplasms of lymphoid, haematopoietic
and related tissue (C96)
Uterine(C54–C55)
Corpus uteri (C54) Uterus, part unspecified (C55)
2 Cancer: New registrations and deaths 2013
Data presentationNumbers and ratesThis report presents data as numbers and rates. It provides two types of rate: age-specific and age-standardised. Age-specific rates measure the frequency of cancer registrations or deaths for specific age groups (eg, five-year age groups and life-stage age groups). Age-standardised rates measure the frequency of cancer registrations and deaths in a group, and are adjusted to account for any differences in age distribution of the population over time or between groups.
Rates for specific groups (eg, Māori, those residing in the least deprived areas, females, and populations in specific DHB regions) are calculated using the best available population for that specific group.
All percentage calculations comparing numbers or rates between years have been undertaken using the raw data. Due to rounding, this may mean the resultant information is slightly different to any calculations based on tabular data supplied in this report.
District Health Board regionAge-standardised rates were calculated for each DHB region of domicile. The cancer data for DHB regions was aggregated over three years (2011–2013), since rates can vary considerably from year to year for each DHB.
The figures provide 99 percent confidence intervals to aid interpretation. Where a confidence interval for a DHB crosses the national rate, this means the registration or mortality rate for the DHB was not statistically significantly different from the national rate.
Cancer: New registrations and deaths 2013 3
New cancer registrationsThe New Zealand Cancer Registry records cancers diagnosed in New Zealand. It registers cancers once, in the year of their first known diagnosis. Registrations cover new cases of primary cancer, or secondary cancers where the primary cancer is unknown. This report presents data for all cancers combined (ICD codes C00–C96 and D45–D47), as well as by individual cancers. It does not include in situ cancers. The following section focuses on registrations for all cancers combined in 2013 and between 2004 and 2013.
Registrations in 2013In 2013 the New Zealand Cancer Registry received 22,166 new cancer registrations. This was a rate of 335.5 new cases of cancer per 100,000 population. Males accounted for more than half (52%) of new cancer cases registered. The registration rate for males was significantly higher than the rate for females.
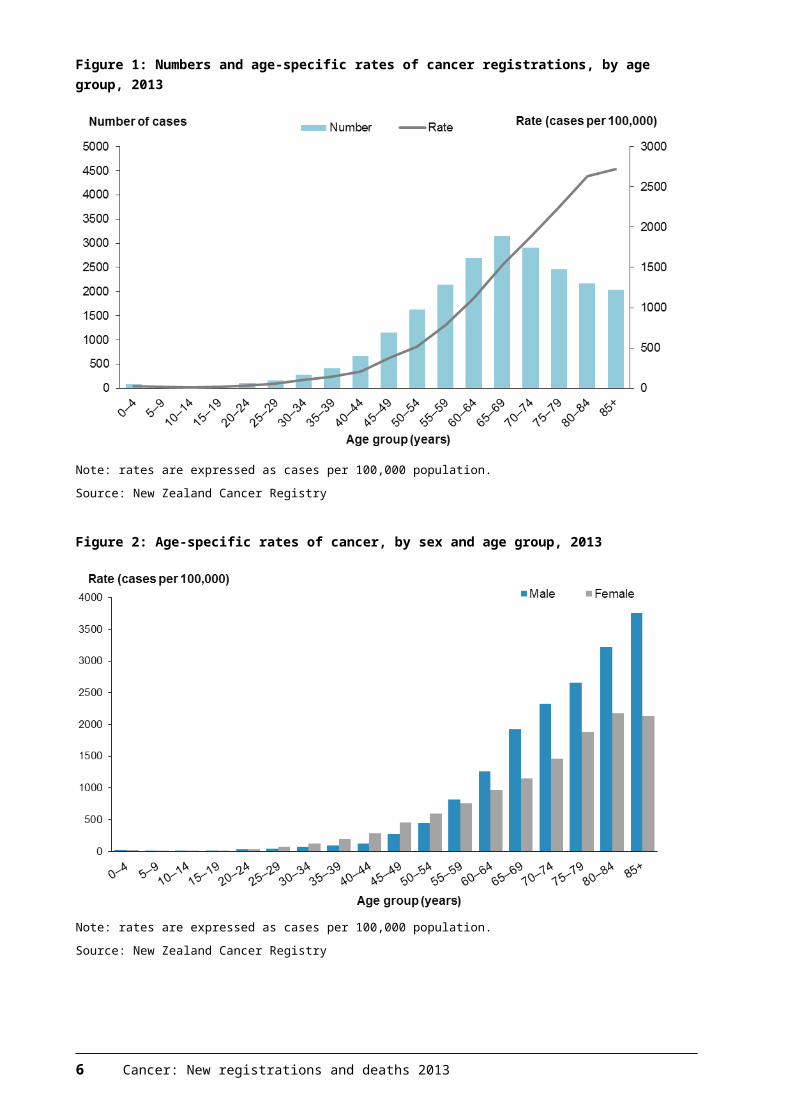
Cancer was mainly registered in older people. People aged 60 years and older accounted for nearly 7 out of 10 new cancer cases. In 2013 the age group with the largest number of cancer cases registered was 65–69 years (3141 cases); however, the registration rate was highest for those aged 85 years and over (2722.9 cases per 100,000) (Figure 1). Registration rates for females were significantly higher than rates for males for ages 25–54 years. However, registration rates for those 60 years and older were significantly higher for males than for females (Figure 2).
Figure 1: Numbers and age-specific rates of cancer registrations, by age group, 2013
4 Cancer: New registrations and deaths 2013
Note: rates are expressed as cases per 100,000 population.
Source: New Zealand Cancer Registry
Figure 2: Age-specific rates of cancer, by sex and age group, 2013
Note: rates are expressed as cases per 100,000 population.
Source: New Zealand Cancer Registry
Cancer: New registrations and deaths 2013 5
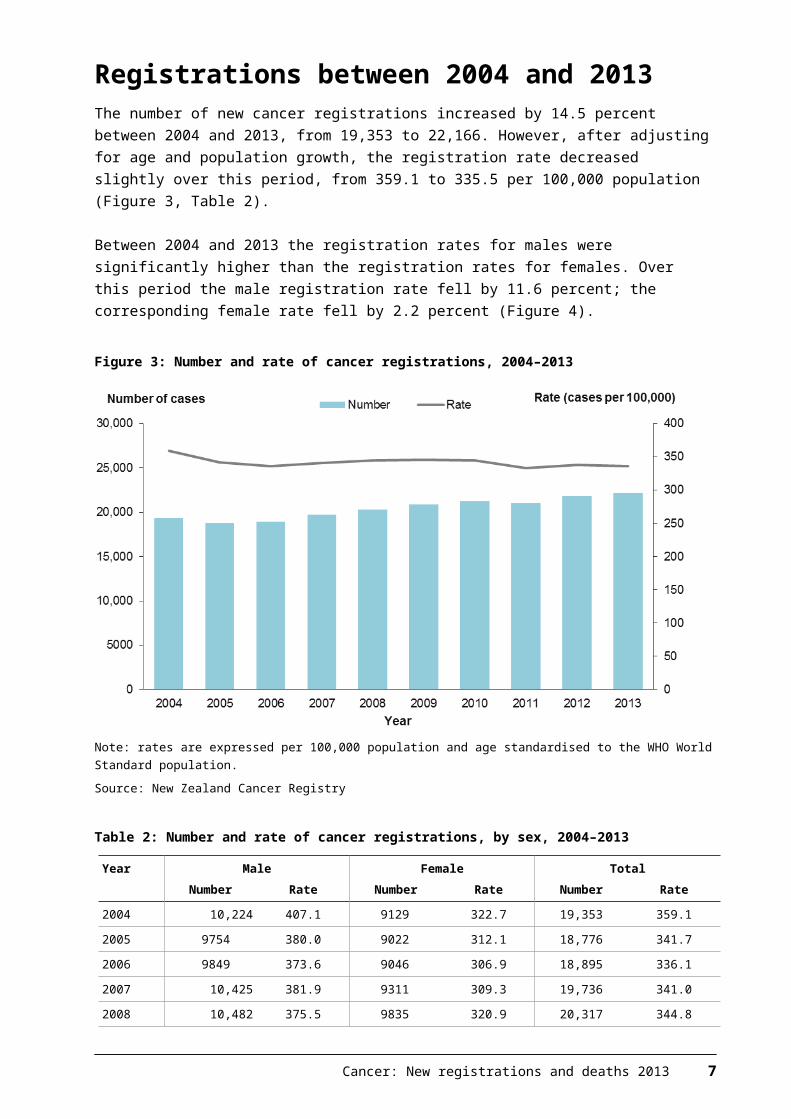
Registrations between 2004 and 2013The number of new cancer registrations increased by 14.5 percent between 2004 and 2013, from 19,353 to 22,166. However, after adjusting for age and population growth, the registration rate decreased slightly over this period, from 359.1 to 335.5 per 100,000 population (Figure 3, Table 2).
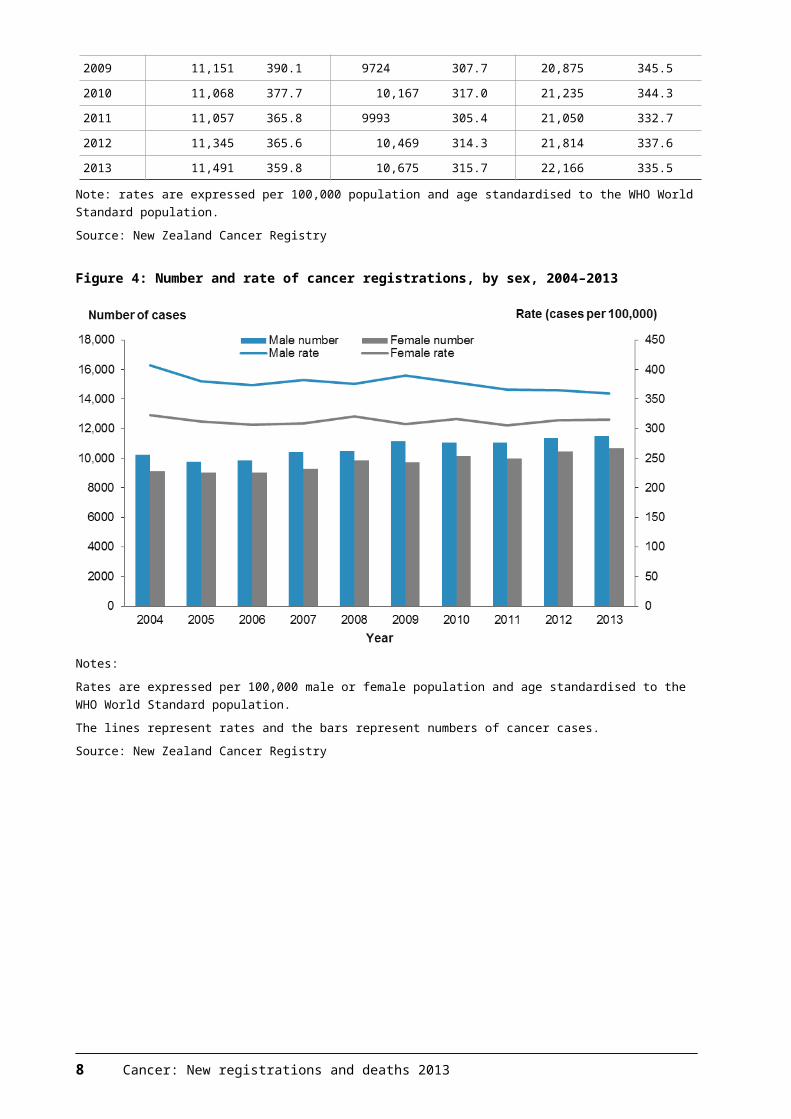
Between 2004 and 2013 the registration rates for males were significantly higher than the registration rates for females. Over this period the male registration rate fell by 11.6 percent; the corresponding female rate fell by 2.2 percent (Figure 4).
Figure 3: Number and rate of cancer registrations, 2004–2013
Note: rates are expressed per 100,000 population and age standardised to the WHO World Standard population.
Source: New Zealand Cancer Registry
Table 2: Number and rate of cancer registrations, by sex, 2004–2013
Year Male Female TotalNumber Rate Number Rate Number Rate
2004 10,224 407.1 9129 322.7 19,353 359.1
2005 9754 380.0 9022 312.1 18,776 341.7
2006 9849 373.6 9046 306.9 18,895 336.1
2007 10,425 381.9 9311 309.3 19,736 341.0
2008 10,482 375.5 9835 320.9 20,317 344.8
2009 11,151 390.1 9724 307.7 20,875 345.5
2010 11,068 377.7 10,167 317.0 21,235 344.3
2011 11,057 365.8 9993 305.4 21,050 332.7
2012 11,345 365.6 10,469 314.3 21,814 337.6
2013 11,491 359.8 10,675 315.7 22,166 335.5
Note: rates are expressed per 100,000 population and age standardised to the WHO World Standard population.
6 Cancer: New registrations and deaths 2013
Source: New Zealand Cancer Registry
Figure 4: Number and rate of cancer registrations, by sex, 2004–2013
Notes:
Rates are expressed per 100,000 male or female population and age standardised to the WHO World Standard population.
The lines represent rates and the bars represent numbers of cancer cases.
Source: New Zealand Cancer Registry
Cancer: New registrations and deaths 2013 7
Common cancersIn 2013 there were registrations for nearly 90 different (three-character-code) cancer sites, but just five main cancers accounted for 61.6 percent of all registrations. The following section focuses on the most commonly registered cancers in 2013, for the total population and for males and females. Appendix B, Tables B1–B3, and the online tables accompanying this publication (‘Cancer trends 2013’) present more detailed data for all individual cancers.
Most commonly registered cancersProstate cancer was the most common cancer registered in 2013: there were 3129 new cases. Colorectal cancer was the second commonest with 3075 new cases (1622 males and 1453 females). Together prostate and colorectal cancers accounted for 28.0 percent of all registrations. These were followed by breast cancer (3046, 13.7%), melanoma (2366, 10.7%) and lung cancer (2037, 9.2%).
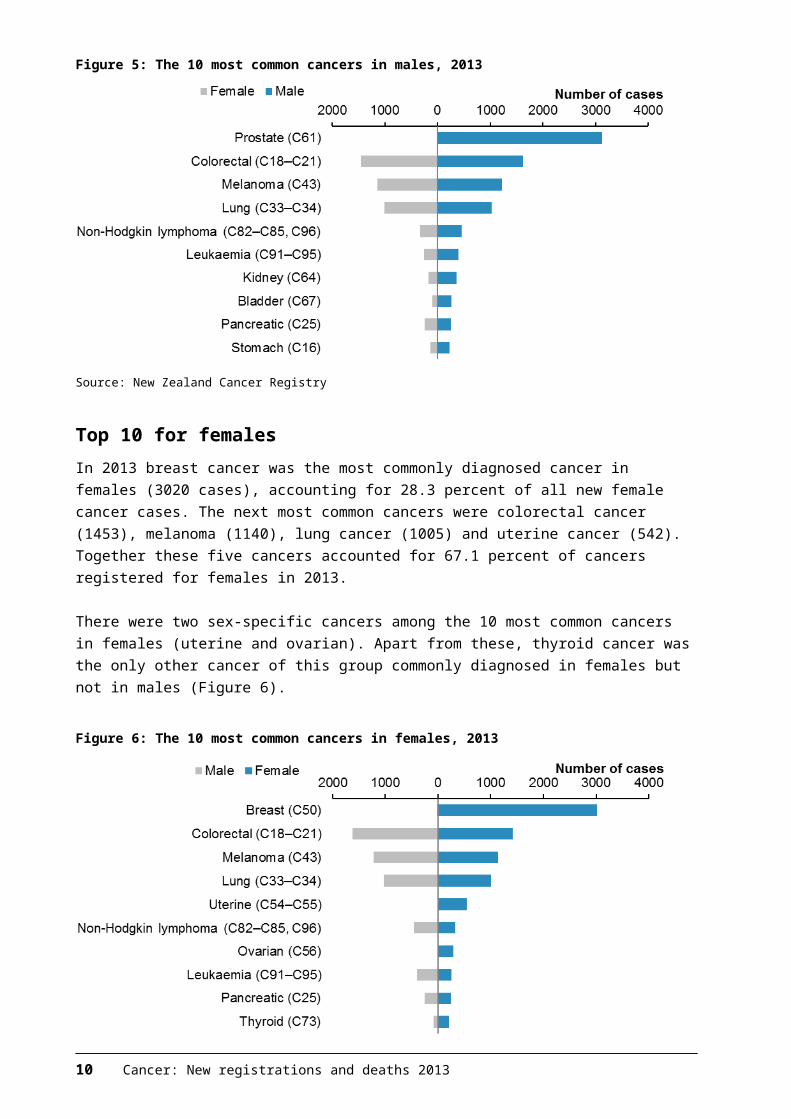
Top 10 for malesProstate cancer was the most commonly diagnosed cancer in males (3129 cases) in 2013, followed by colorectal cancer (1622), melanoma (1226), lung cancer (1032) and non-Hodgkin lymphoma (462). Together these five cancers accounted for 65.0 percent of cancers registered for males.
Prostate cancer was the only sex-specific cancer in the 10 most common cancers in males. Kidney, stomach and bladder cancer were also among the 10 most common cancers diagnosed in males, but not in females (Figure 5).
Figure 5: The 10 most common cancers in males, 2013
Source: New Zealand Cancer Registry
8 Cancer: New registrations and deaths 2013
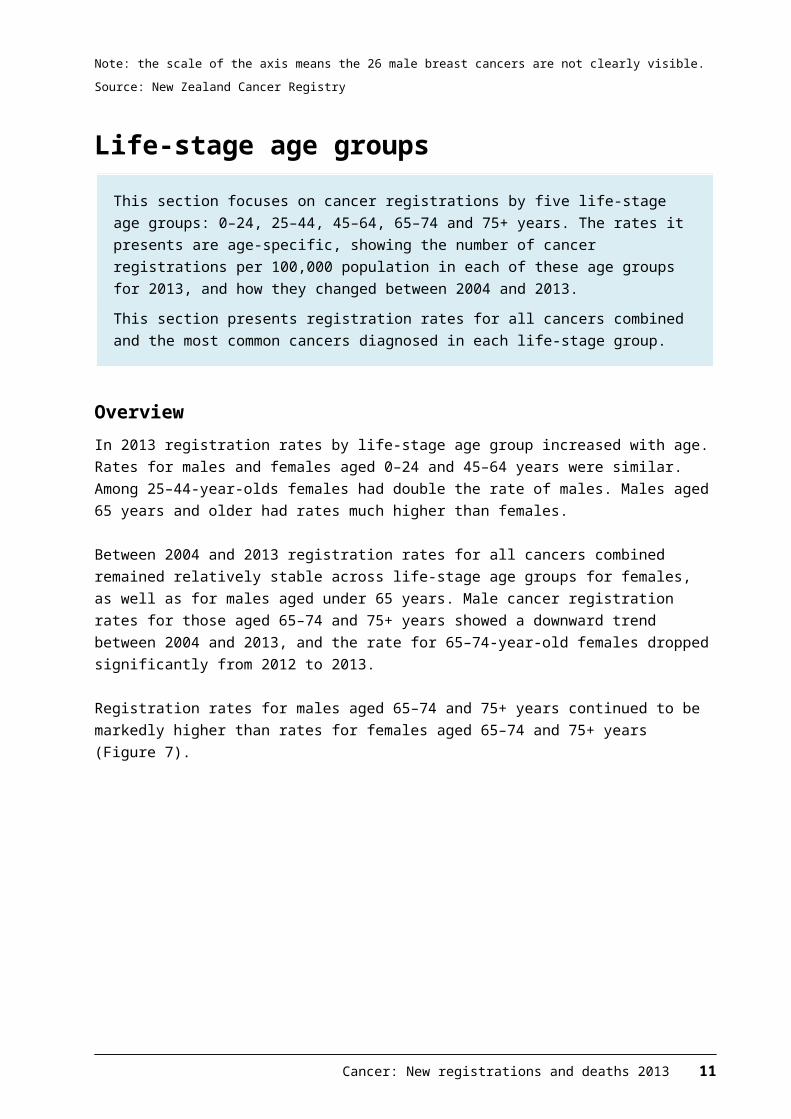
Top 10 for femalesIn 2013 breast cancer was the most commonly diagnosed cancer in females (3020 cases), accounting for 28.3 percent of all new female cancer cases. The next most common cancers were colorectal cancer (1453), melanoma (1140), lung cancer (1005) and uterine cancer (542). Together these five cancers accounted for 67.1 percent of cancers registered for females in 2013.
There were two sex-specific cancers among the 10 most common cancers in females (uterine and ovarian). Apart from these, thyroid cancer was the only other cancer of this group commonly diagnosed in females but not in males (Figure 6).
Figure 6: The 10 most common cancers in females, 2013
Note: the scale of the axis means the 26 male breast cancers are not clearly visible.
Source: New Zealand Cancer Registry
Cancer: New registrations and deaths 2013 9
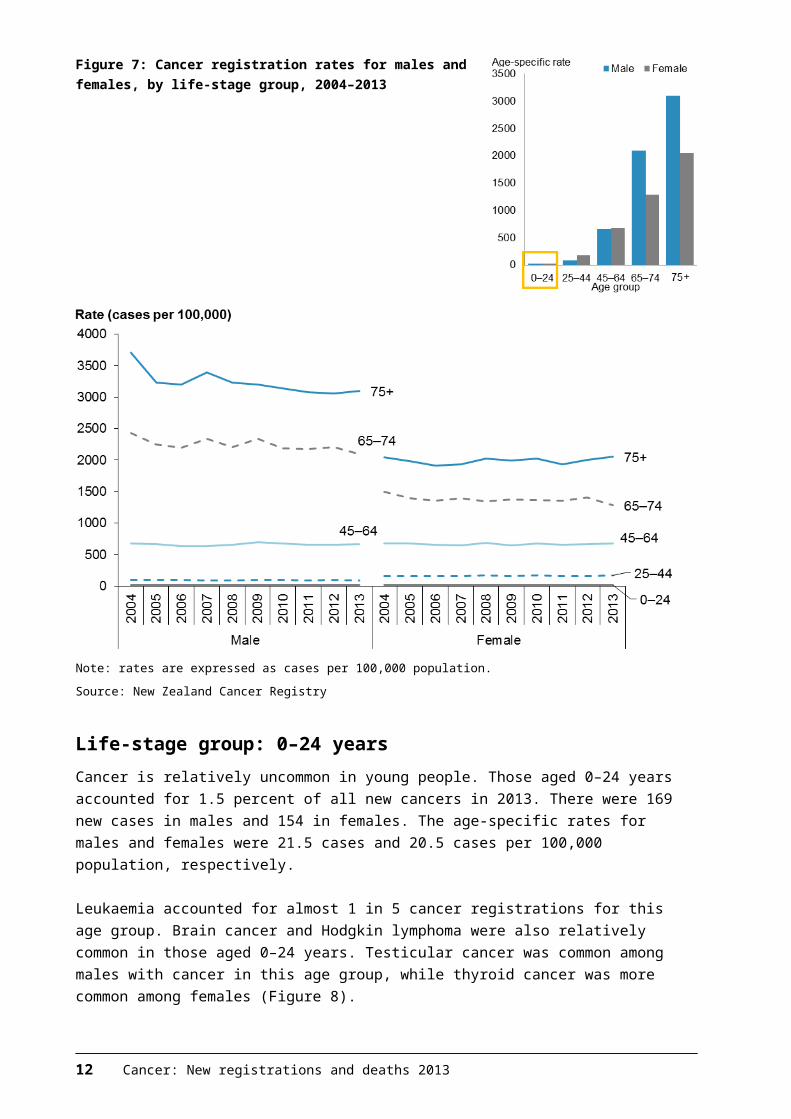
Life-stage age groupsThis section focuses on cancer registrations by five life-stage age groups: 0–24, 25–44, 45–64, 65–74 and 75+ years. The rates it presents are age-specific, showing the number of cancer registrations per 100,000 population in each of these age groups for 2013, and how they changed between 2004 and 2013.This section presents registration rates for all cancers combined and the most common cancers diagnosed in each life-stage group.
OverviewIn 2013 registration rates by life-stage age group increased with age. Rates for males and females aged 0–24 and 45–64 years were similar. Among 25–44-year-olds females had double the rate of males. Males aged 65 years and older had rates much higher than females.
Between 2004 and 2013 registration rates for all cancers combined remained relatively stable across life-stage age groups for females, as well as for males aged under 65 years. Male cancer registration rates for those aged 65–74 and 75+ years showed a downward trend between 2004 and 2013, and the rate for 65–74-year-old females dropped significantly from 2012 to 2013.
Registration rates for males aged 65–74 and 75+ years continued to be markedly higher than rates for females aged 65–74 and 75+ years (Figure 7).
Figure 7: Cancer registration rates for males and females, by life-stage group, 2004–2013
Note: rates are expressed as cases per 100,000 population.
Source: New Zealand Cancer Registry
10 Cancer: New registrations and deaths 2013
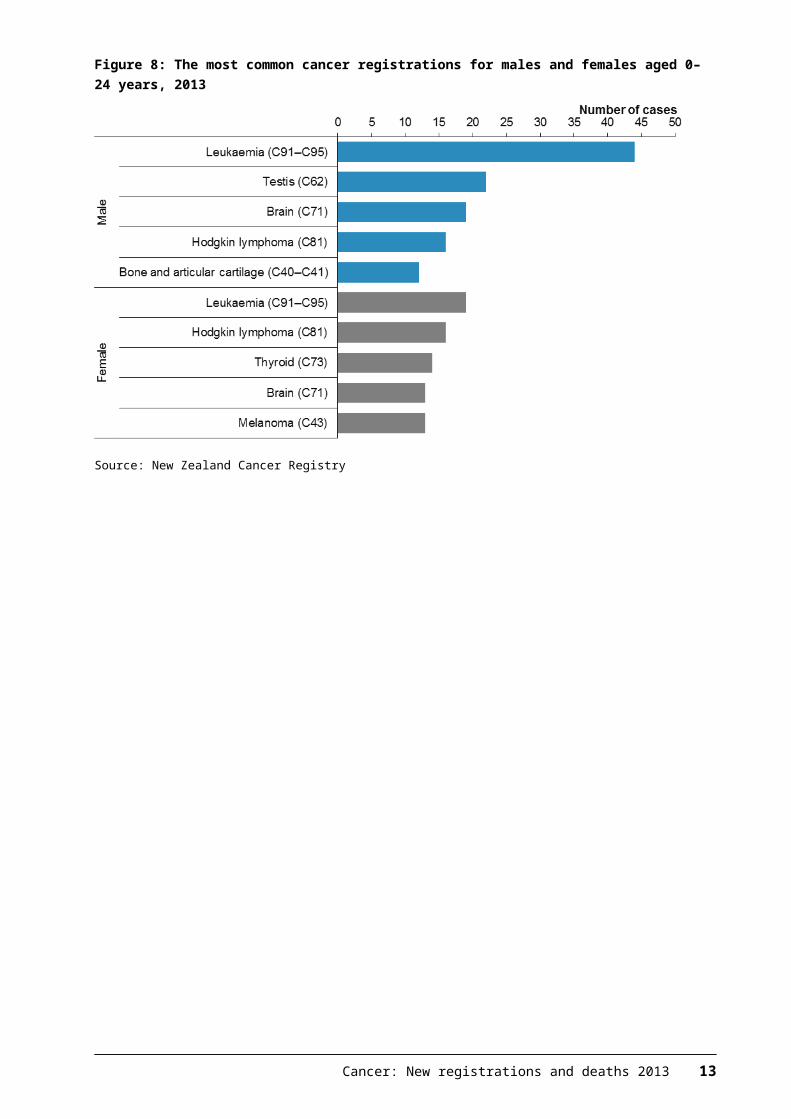
Life-stage group: 0–24 yearsCancer is relatively uncommon in young people. Those aged 0–24 years accounted for 1.5 percent of all new cancers in 2013. There were 169 new cases in males and 154 in females. The age-specific rates for males and females were 21.5 cases and 20.5 cases per 100,000 population, respectively.
Leukaemia accounted for almost 1 in 5 cancer registrations for this age group. Brain cancer and Hodgkin lymphoma were also relatively common in those aged 0–24 years. Testicular cancer was common among males with cancer in this age group, while thyroid cancer was more common among females (Figure 8).
Figure 8: The most common cancer registrations for males and females aged 0–24 years, 2013
Source: New Zealand Cancer Registry
Cancer: New registrations and deaths 2013 11
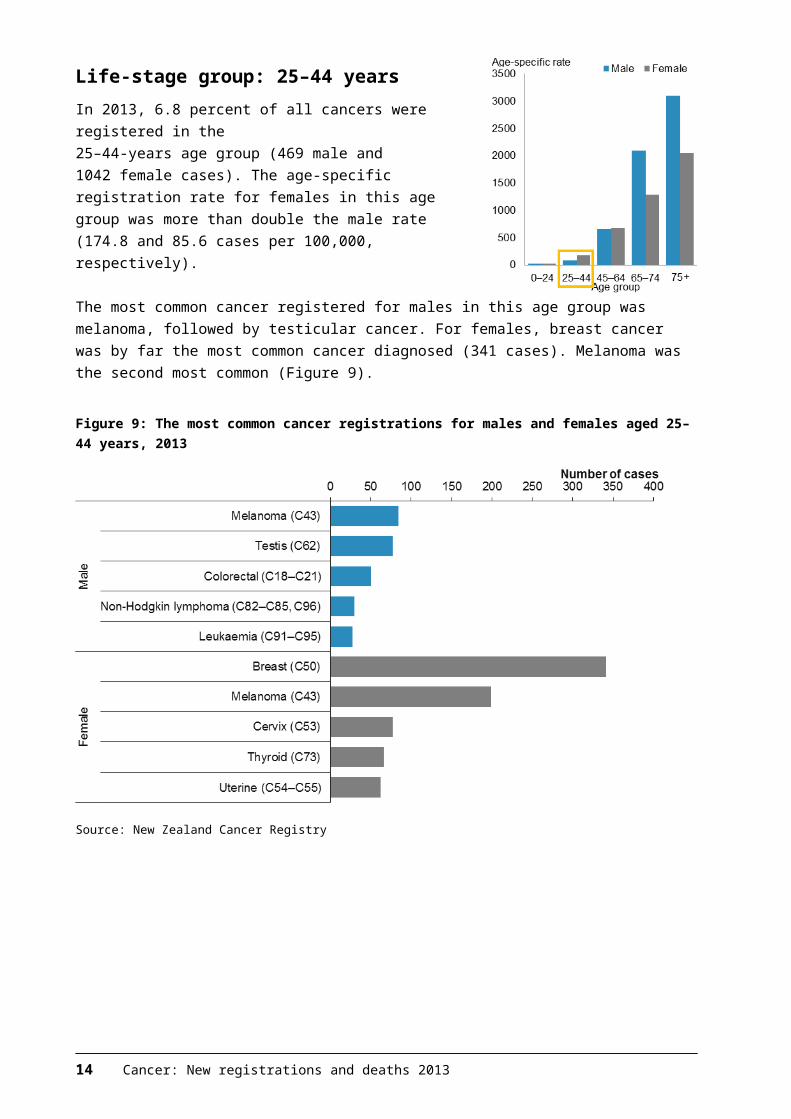
Life-stage group: 25–44 yearsIn 2013, 6.8 percent of all cancers were registered in the25–44-years age group (469 male and 1042 female cases). The age-specific registration rate for females in this age group was more than double the male rate (174.8 and 85.6 cases per 100,000, respectively).
The most common cancer registered for males in this age group was melanoma, followed by testicular cancer. For females, breast cancer was by far the most common cancer diagnosed (341 cases). Melanoma was the second most common (Figure 9).
Figure 9: The most common cancer registrations for males and females aged 25–44 years, 2013
Source: New Zealand Cancer Registry
12 Cancer: New registrations and deaths 2013
Life-stage group: 45–64 yearsIn 2013, 34.4 percent of all cancers were registered in the45–64-years age group (3655 male and 3973 female cases). The age-specific registration rates for males and females in this age group were similar (662.0 and 677.2 cases per 100,000).
Prostate cancer was the most common cancer registered in males aged 45–64 years. For females, breast cancer was by far the most common cancer registered, accounting for 39.7 percent (1577) of new cases in women aged 45–64 years. The next most common cancers were melanoma, colorectal and lung cancer for both males and females (Figure 10).
Figure 10: The most common cancer registrations for males and females aged 45–64 years, 2013
Source: New Zealand Cancer Registry
Cancer: New registrations and deaths 2013 13
Life-stage group: 65–74 yearsIn 2013 there were 6045 new cases of cancer in people aged 65–74 years (3666 male and 2379 female cases). This age group accounted for 27.3 percent of new cancer cases in 2013. The age-specific registration rate for males in this age group was significantly higher than the rate for females (2099.1 and 1284.2 cases per 100,000, respectively).
For males in this age group, prostate cancer was by far the most common cancer diagnosed, accounting for over one-third (1319) of new cases in males aged 65–74 years. For females, breast cancer was the most common cancer diagnosed. Other common cancers were colorectal, lung and melanoma (Figure 11).
Figure 11: The most common cancer registrations for males and females aged 65–74 years, 2013
Source: New Zealand Cancer Registry
14 Cancer: New registrations and deaths 2013
Life-stage group: 75+ yearsIn 2013 there were 6659 new cases of cancer in people aged 75 years and older (3532 male and 3127 female cases). This age group accounted for 30.0 percent of all new cancer cases in 2013. The age-specific registration rate for males in this group was significantly higher than the rate for females (3096.3 and 2052.9 cases per 100,000, respectively).
For males aged 75 years and older, prostate cancer was the most common cancer diagnosed, followed by colorectal and lung cancer, melanoma and non-Hodgkin lymphoma. Colorectal cancer was the most common cancer in females accounting for one in five new cancer cases in females aged 75 years and older. The next most common cancers were breast cancer, lung cancer, melanoma and non-Hodgkin lymphoma (Figure 12).
Figure 12: The most common cancer registrations for males and females aged 75 years and older, 2013
Source: New Zealand Cancer Registry
Cancer: New registrations and deaths 2013 15
Māori and non-MāoriThis section presents cancer data for the Māori and non-Māori ethnic groups. Ethnicity information for registrations is based on self-identification. For more information on this, see Appendix A. This section provides registration rates for all cancers combined for 2004–2013. The other focus is on the most commonly diagnosed cancers in each of these ethnic groups in 2013. Appendix B, Tables B2 and B3, and the online tables accompanying this publication (‘Cancer trends 2013’) present more detailed data for individual cancers by ethnic group.
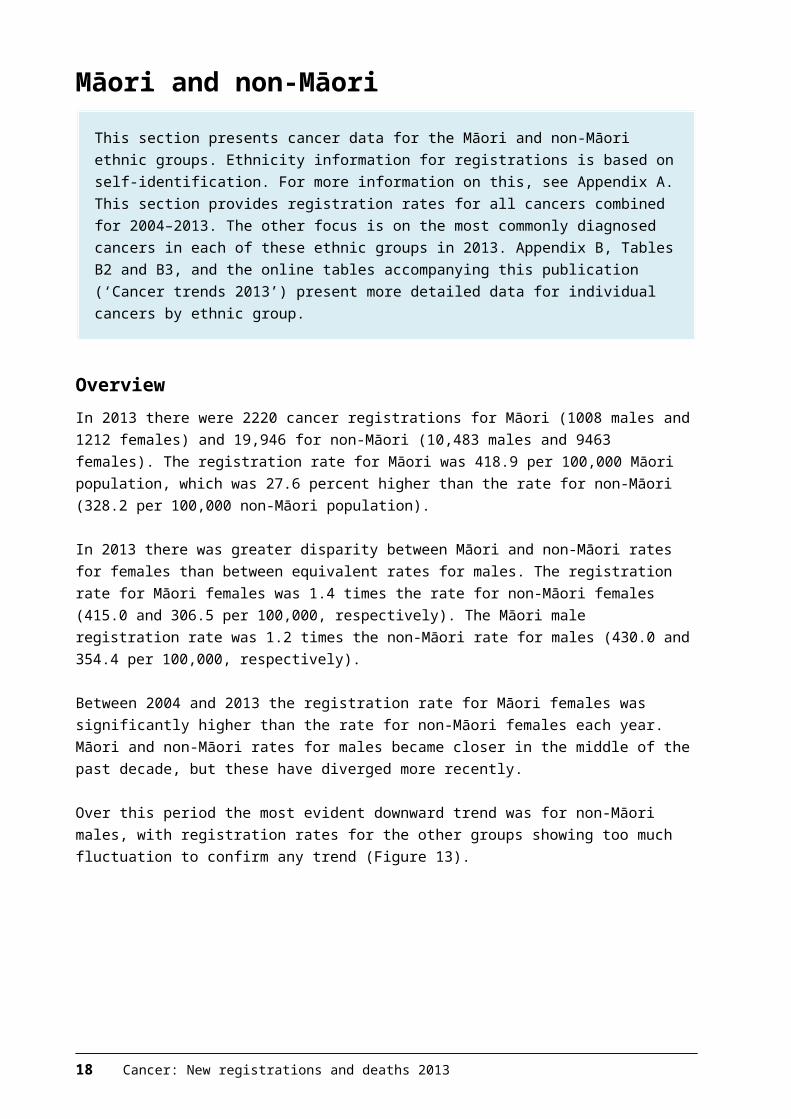
OverviewIn 2013 there were 2220 cancer registrations for Māori (1008 males and 1212 females) and 19,946 for non-Māori (10,483 males and 9463 females). The registration rate for Māori was 418.9 per 100,000 Māori population, which was 27.6 percent higher than the rate for non-Māori (328.2 per 100,000 non-Māori population).
In 2013 there was greater disparity between Māori and non-Māori rates for females than between equivalent rates for males. The registration rate for Māori females was 1.4 times the rate for non-Māori females (415.0 and 306.5 per 100,000, respectively). The Māori male registration rate was 1.2 times the non-Māori rate for males (430.0 and 354.4 per 100,000, respectively).
Between 2004 and 2013 the registration rate for Māori females was significantly higher than the rate for non-Māori females each year. Māori and non-Māori rates for males became closer in the middle of the past decade, but these have diverged more recently.
Over this period the most evident downward trend was for non-Māori males, with registration rates for the other groups showing too much fluctuation to confirm any trend (Figure 13).
16 Cancer: New registrations and deaths 2013
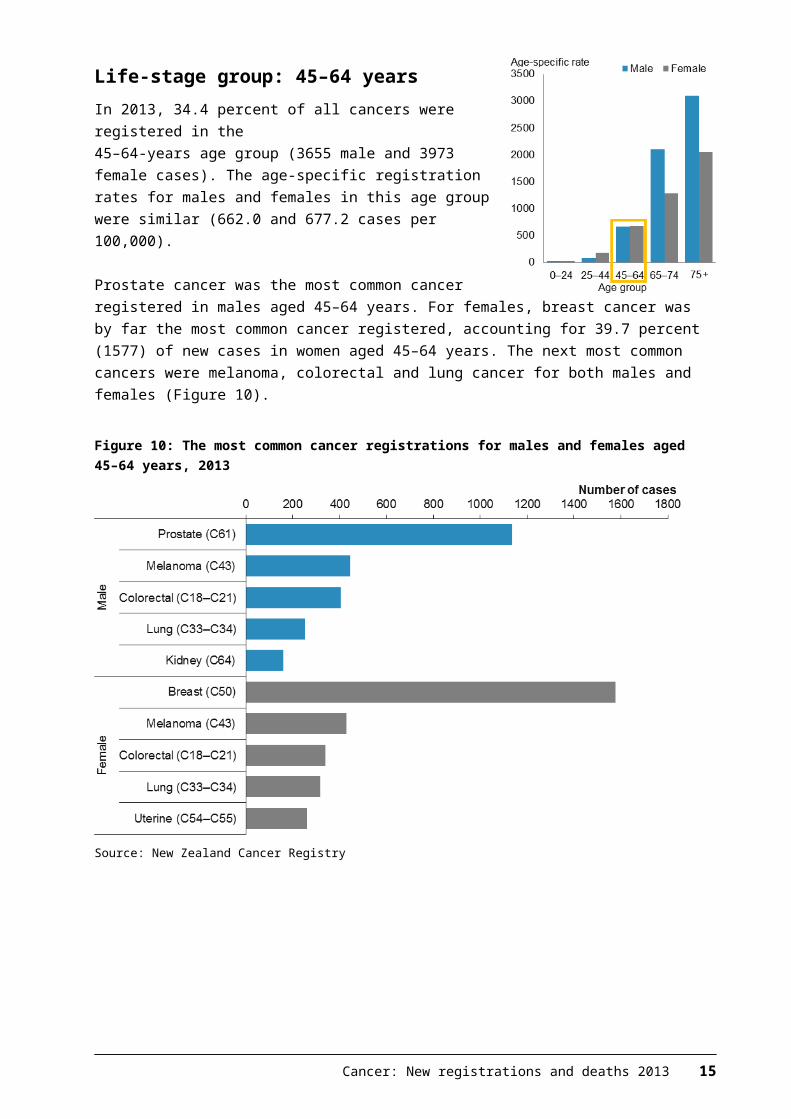
Figure 13: Cancer registration rates for males and females, by ethnic group, 2004–2013
Notes:
Rates are expressed per 100,000 Māori or non-Māori population and age standardised to the WHO World Standard population.
Error bars represent 95 percent confidence intervals.
Source: New Zealand Cancer Registry
Common cancers in Māori and non-MāoriIn 2013 the most common cancers diagnosed in Māori and non-Māori were similar. Prostate, colorectal, breast, lung, leukaemia, pancreatic, kidney and uterine cancer were among the 10 most common cancers diagnosed in both ethnic groups. Among these cancers, the disparity between ethnic groups was greatest for lung, pancreatic and uterine cancer, where Māori had rates 1.5–3.5 times the rates for non-Māori.
Stomach and liver cancer were more common diagnoses among Māori than non-Māori. Melanoma was more commonly diagnosed in non-Māori than in Māori: the non-Māori rate for melanoma was 5.5 times the rate for Māori (see Appendix B, Tables B2 and B3).
MalesThe most common cancer registration for Māori males was prostate cancer (91.8 per 100,000), followed closely by lung cancer (81.5 per 100,000). Together these two cancers accounted for nearly 40 percent of Māori male cancers.
Prostate cancer was also the most common cancer registered for non-Māori males (96.3 per 100,000), and accounted for nearly 3 in 10 non-Māori male cancer cases. Colorectal cancer featured prominently for both ethnic groups (Figure 14).
Cancer: New registrations and deaths 2013 17
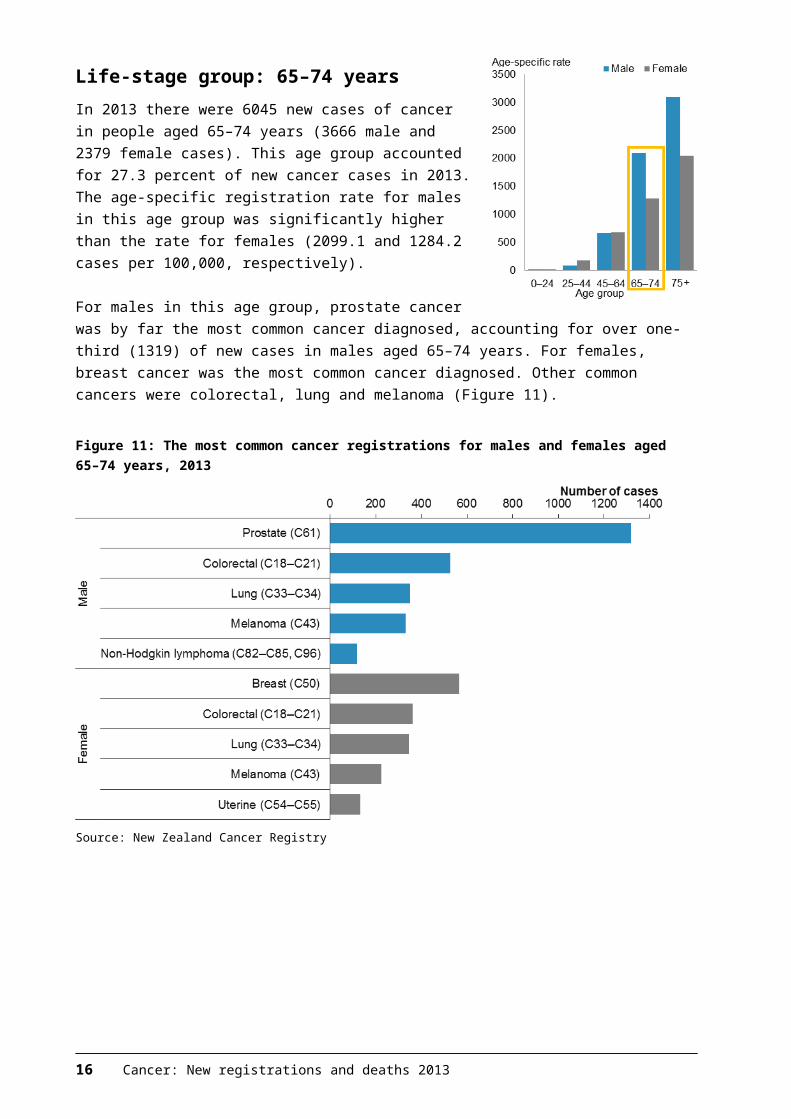
Figure 14: Cancer registration rates of the most common cancers for Māori and non-Māori males, 2013
Note: rates are expressed per 100,000 Māori or non-Māori population and age standardised to the WHO World Standard population.
Source: New Zealand Cancer Registry
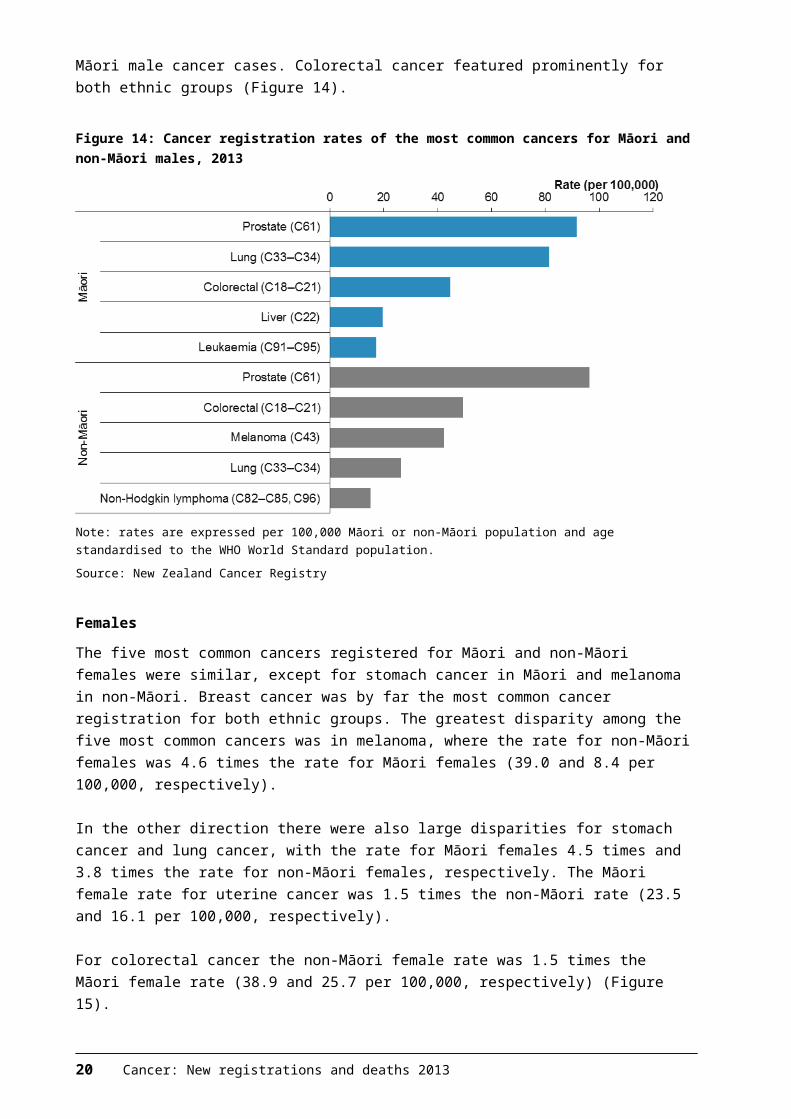
FemalesThe five most common cancers registered for Māori and non-Māori females were similar, except for stomach cancer in Māori and melanoma in non-Māori. Breast cancer was by far the most common cancer registration for both ethnic groups. The greatest disparity among the five most common cancers was in melanoma, where the rate for non-Māori females was 4.6 times the rate for Māori females (39.0 and 8.4 per 100,000, respectively).
In the other direction there were also large disparities for stomach cancer and lung cancer, with the rate for Māori females 4.5 times and 3.8 times the rate for non-Māori females, respectively. The Māori female rate for uterine cancer was 1.5 times the non-Māori rate (23.5 and 16.1 per 100,000, respectively).
For colorectal cancer the non-Māori female rate was 1.5 times the Māori female rate (38.9 and 25.7 per 100,000, respectively) (Figure 15).
18 Cancer: New registrations and deaths 2013
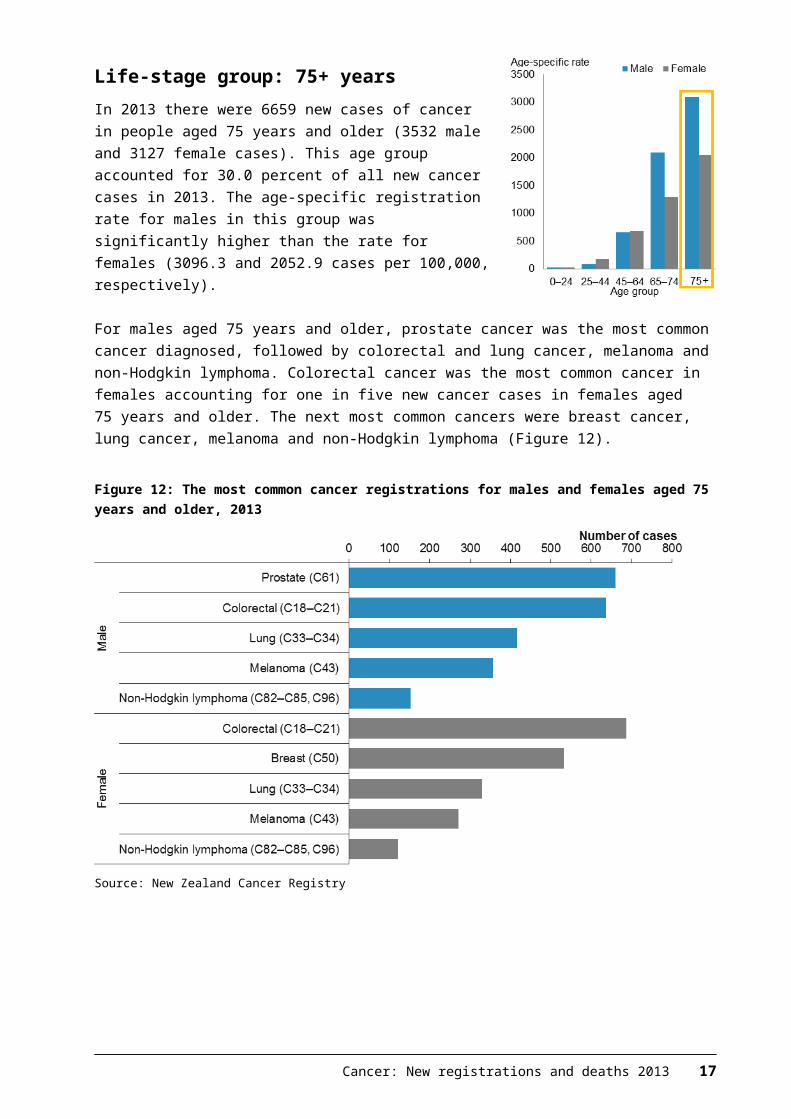
Figure 15: Cancer registration rates of the most common cancers for Māori and non-Māori females, 2013
Note: rates are expressed per 100,000 Māori or non-Māori population and age standardised to the WHO World Standard population.
Source: New Zealand Cancer Registry
DeprivationThis section presents registration rates by deprivation quintile for all cancers combined and for the most commonly diagnosed cancers in males and females in 2013.
Deprivation quintiles represent the level of deprivation of a particular area of residence, according to the New Zealand Deprivation Index 2013 (NZDep 2013). Deprivation quintile 1 represents the least deprived and quintile 5 represents the most deprived.
Note that the deprivation classification used in this report differs from previous years, so comparing with figures published previously is not recommended. See Appendix A for more information.
OverviewIn 2013 cancer registration rates were higher for those residing in more deprived areas. Registration rates in quintiles 1─3 were significantly lower than rates in quintiles 4 and 5.
For males, cancer registration rates were highest for those residing in deprivation quintile 5 (404.4 cases per 100,000) and lowest for those residing in quintile 2 (330.4 per 100,000).
Cancer: New registrations and deaths 2013 19
Similarly for females, registration rates were highest for those residing in deprivation quintile 5 (365.6 cases per 100,000) and lowest for those residing in quintile 2 (286.2 per 100,000) (Figure 16).
Figure 16: Cancer registration rates for males and females, by deprivation quintile, 2013
Notes:
Rates are expressed per 100,000 quintile population and age standardised to the WHO World Standard population.
Error bars represent 95 percent confidence intervals.
There were 778 registrations (3.5%) with no deprivation quintile information.
Source: New Zealand Cancer Registry
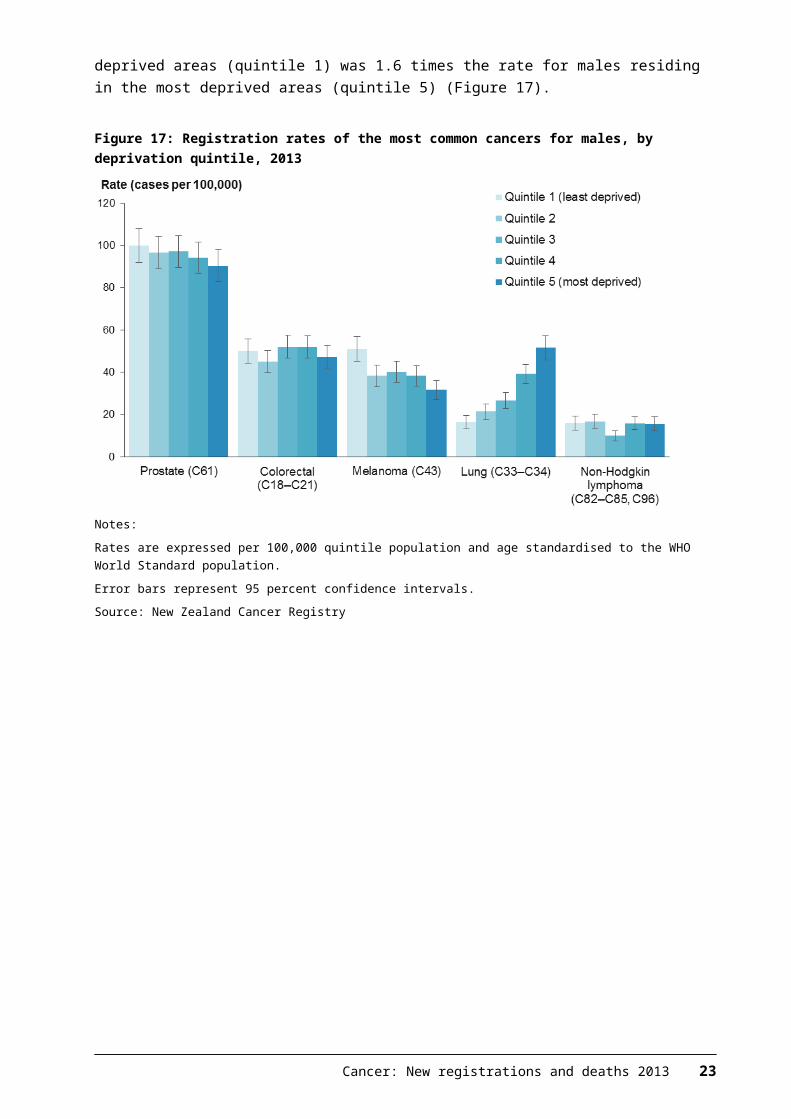
Common cancers, by deprivation quintileMalesIn 2013 registration rates for two of the five most common male cancers differed by deprivation quintile. The greatest disparity was seen in lung cancer rates. Males residing in the most deprived areas had a lung cancer rate that was 3.2 times the rate for those living in the least deprived areas (51.5 per 100,000 for quintile 5 compared with 16.3 per 100,000 for quintile 1). Melanoma rates showed the opposite trend: the registration rate for males residing in the least deprived areas (quintile 1) was 1.6 times the rate for males residing in the most deprived areas (quintile 5) (Figure 17).
20 Cancer: New registrations and deaths 2013
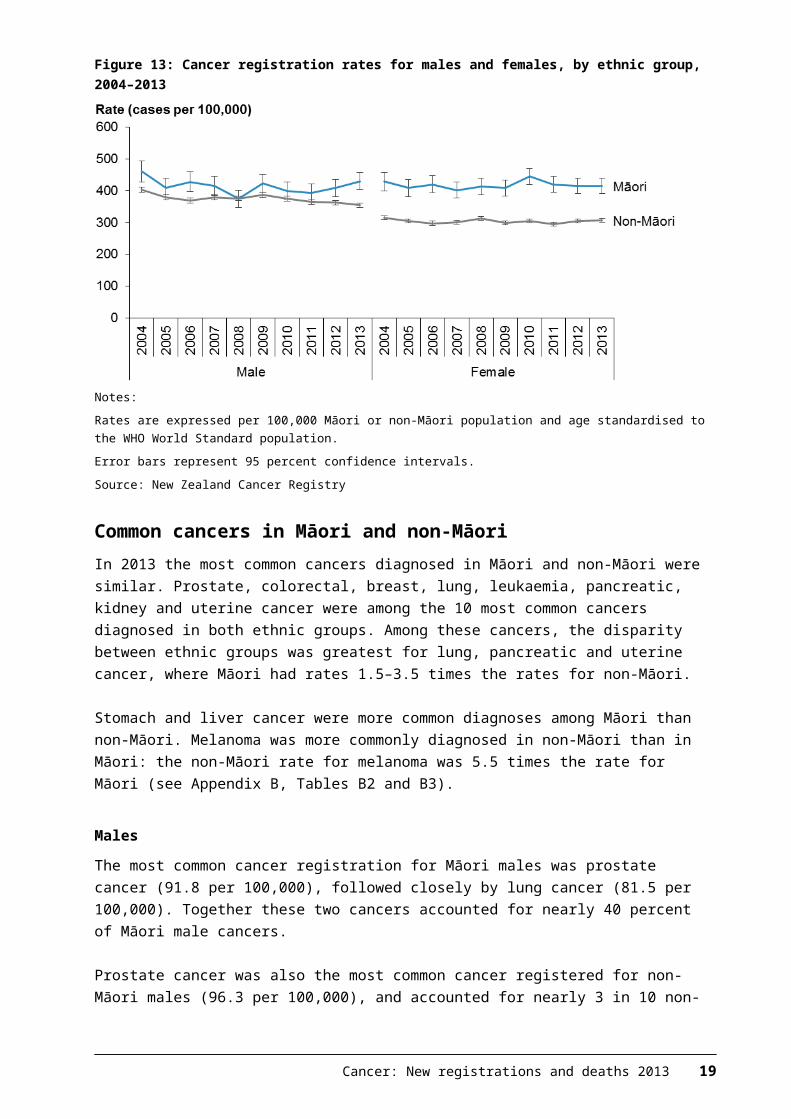
Figure 17: Registration rates of the most common cancers for males, by deprivation quintile, 2013
Notes:
Rates are expressed per 100,000 quintile population and age standardised to the WHO World Standard population.
Error bars represent 95 percent confidence intervals.
Source: New Zealand Cancer Registry
Cancer: New registrations and deaths 2013 21
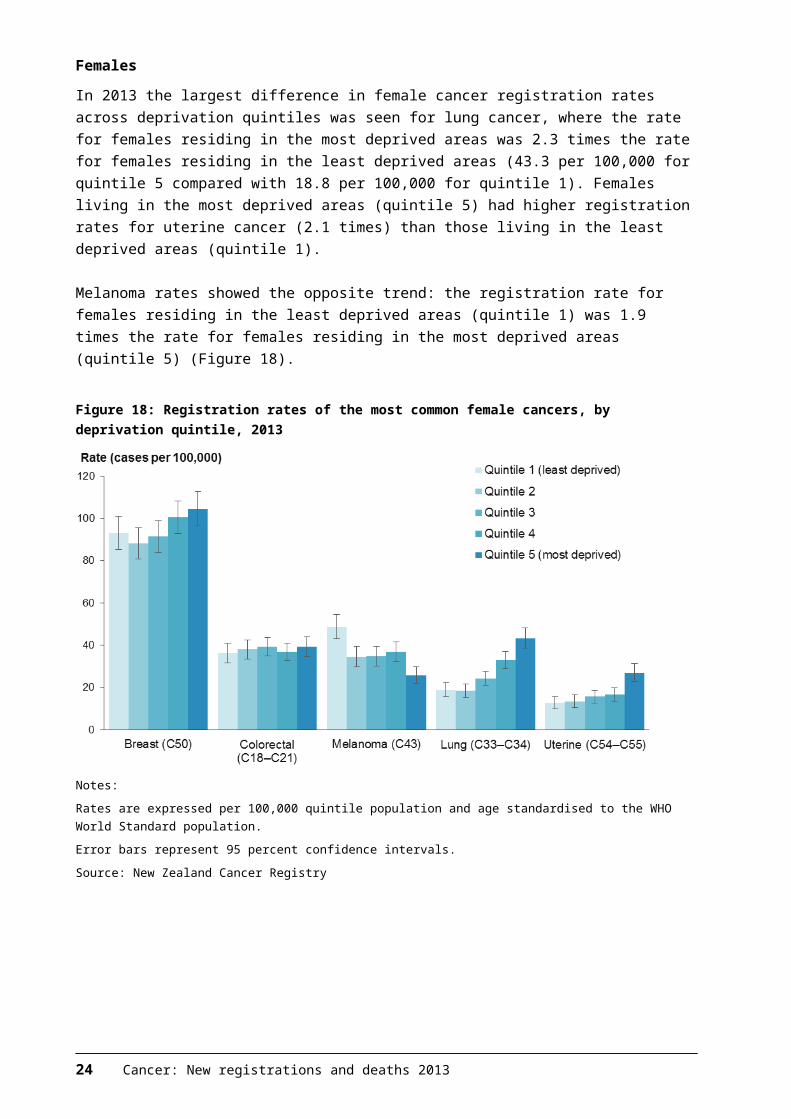
FemalesIn 2013 the largest difference in female cancer registration rates across deprivation quintiles was seen for lung cancer, where the rate for females residing in the most deprived areas was 2.3 times the rate for females residing in the least deprived areas (43.3 per 100,000 for quintile 5 compared with 18.8 per 100,000 for quintile 1). Females living in the most deprived areas (quintile 5) had higher registration rates for uterine cancer (2.1 times) than those living in the least deprived areas (quintile 1).
Melanoma rates showed the opposite trend: the registration rate for females residing in the least deprived areas (quintile 1) was 1.9 times the rate for females residing in the most deprived areas (quintile 5) (Figure 18).
Figure 18: Registration rates of the most common female cancers, by deprivation quintile, 2013
Notes:
Rates are expressed per 100,000 quintile population and age standardised to the WHO World Standard population.
Error bars represent 95 percent confidence intervals.
Source: New Zealand Cancer Registry
22 Cancer: New registrations and deaths 2013
Variation within New Zealand, 2011–2013
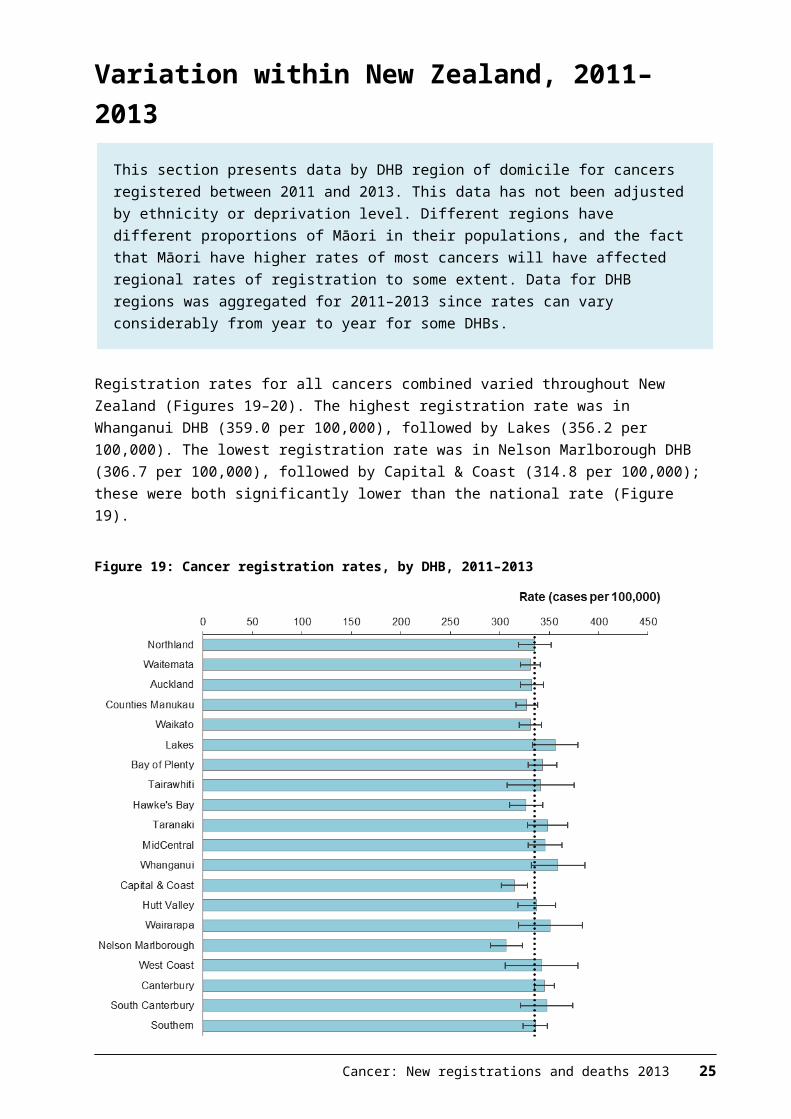
This section presents data by DHB region of domicile for cancers registered between 2011 and 2013. This data has not been adjusted by ethnicity or deprivation level. Different regions have different proportions of Māori in their populations, and the fact that Māori have higher rates of most cancers will have affected regional rates of registration to some extent. Data for DHB regions was aggregated for 2011–2013 since rates can vary considerably from year to year for some DHBs.
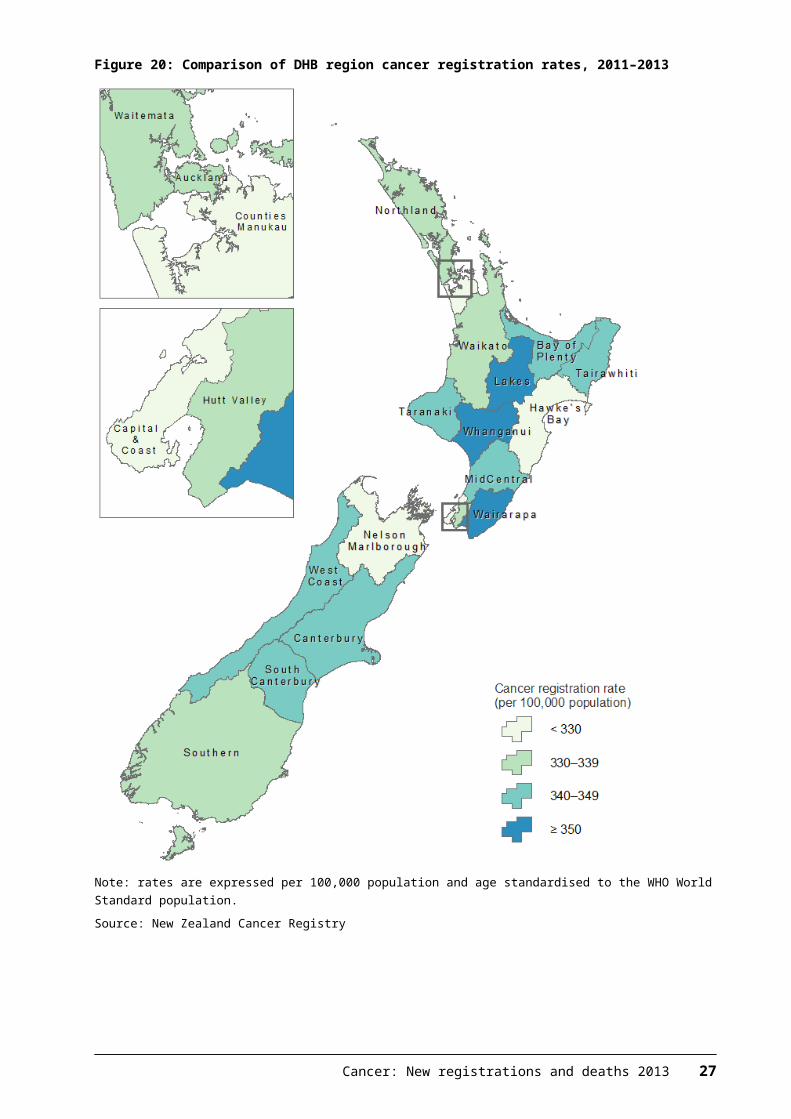
Registration rates for all cancers combined varied throughout New Zealand (Figures 19–20). The highest registration rate was in Whanganui DHB (359.0 per 100,000), followed by Lakes (356.2 per 100,000). The lowest registration rate was in Nelson Marlborough DHB (306.7 per 100,000), followed by Capital & Coast (314.8 per 100,000); these were both significantly lower than the national rate (Figure 19).
Figure 19: Cancer registration rates, by DHB, 2011–2013
Notes:
The dashed line represents the aggregated national rate for 2011–2013 of 335.3 cases per 100,000 population.
Rates are expressed per 100,000 DHB population and age standardised to the WHO World Standard population.
Error bars represent 99 percent confidence intervals.
Source: New Zealand Cancer Registry
Cancer: New registrations and deaths 2013 23
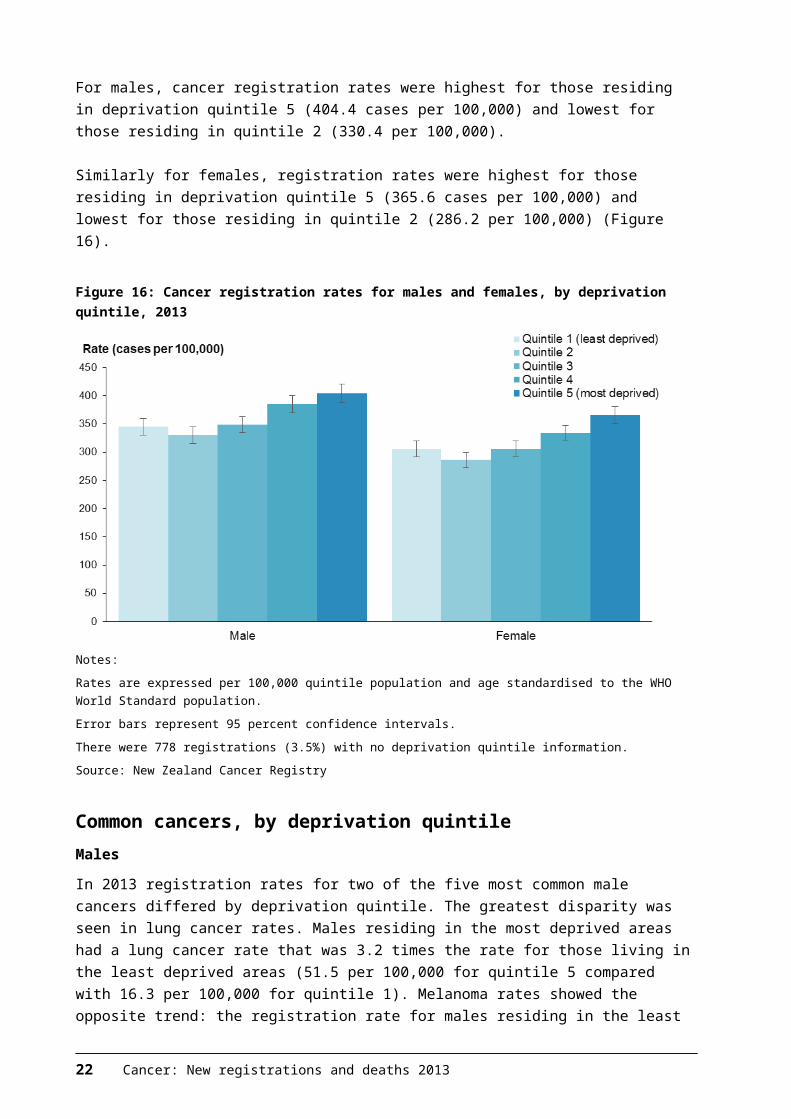
Figure 20: Comparison of DHB region cancer registration rates, 2011–2013
Note: rates are expressed per 100,000 population and age standardised to the WHO World Standard population.
Source: New Zealand Cancer Registry
24 Cancer: New registrations and deaths 2013
Cancer deathsThis report presents information on deaths registered in New Zealand in 2013 for which cancer was recorded as the underlying cause of death. Data comes from the New Zealand Mortality Collection. This report presents deaths data for all cancers combined (C00–C96 and D45–D47), as well as for individual cancers. The first section focuses on deaths for all cancers combined registered in 2013 and between 2004 and 2013.
Cancer deaths in 2013In 2013 there were 9063 deaths from cancer, which is a rate of 122.8 cancer deaths per 100,000 population. Cancer was the most common cause of death in New Zealand in 2013, accounting for nearly one in three deaths (30.6%) (Ministry of Health 2015). Males accounted for more than half (53%) of cancer deaths. The mortality rate for males was significantly higher than the rate for females (141.3 and 108.5 per 100,000, respectively).
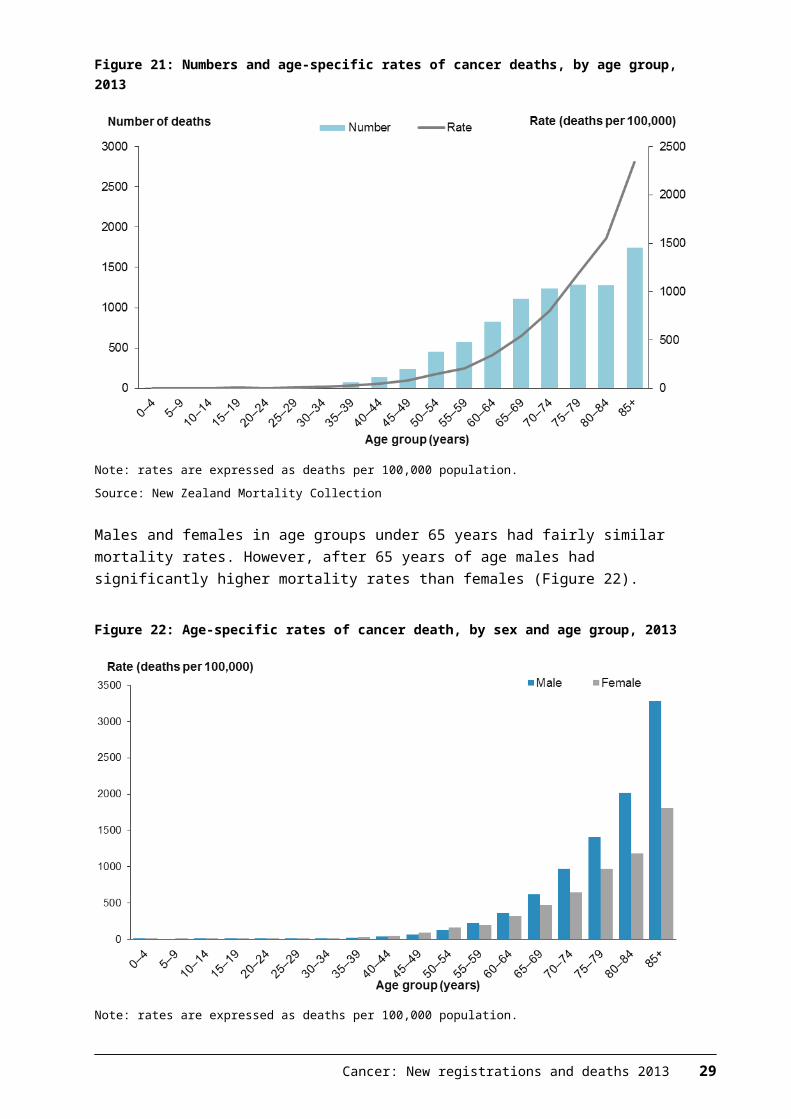
In 2013 more than 70 percent of cancer deaths were in people aged 65 years and older. Adult age-specific mortality rates increased steadily with age. The highest mortality rate was seen in people aged 85 years and older (2338.7 per 100,000) (Figure 21).
Figure 21: Numbers and age-specific rates of cancer deaths, by age group, 2013
Note: rates are expressed as deaths per 100,000 population.
Source: New Zealand Mortality Collection
Cancer: New registrations and deaths 2013 25
Males and females in age groups under 65 years had fairly similar mortality rates. However, after 65 years of age males had significantly higher mortality rates than females (Figure 22).
Figure 22: Age-specific rates of cancer death, by sex and age group, 2013
Note: rates are expressed as deaths per 100,000 population.
Source: New Zealand Mortality Collection
26 Cancer: New registrations and deaths 2013
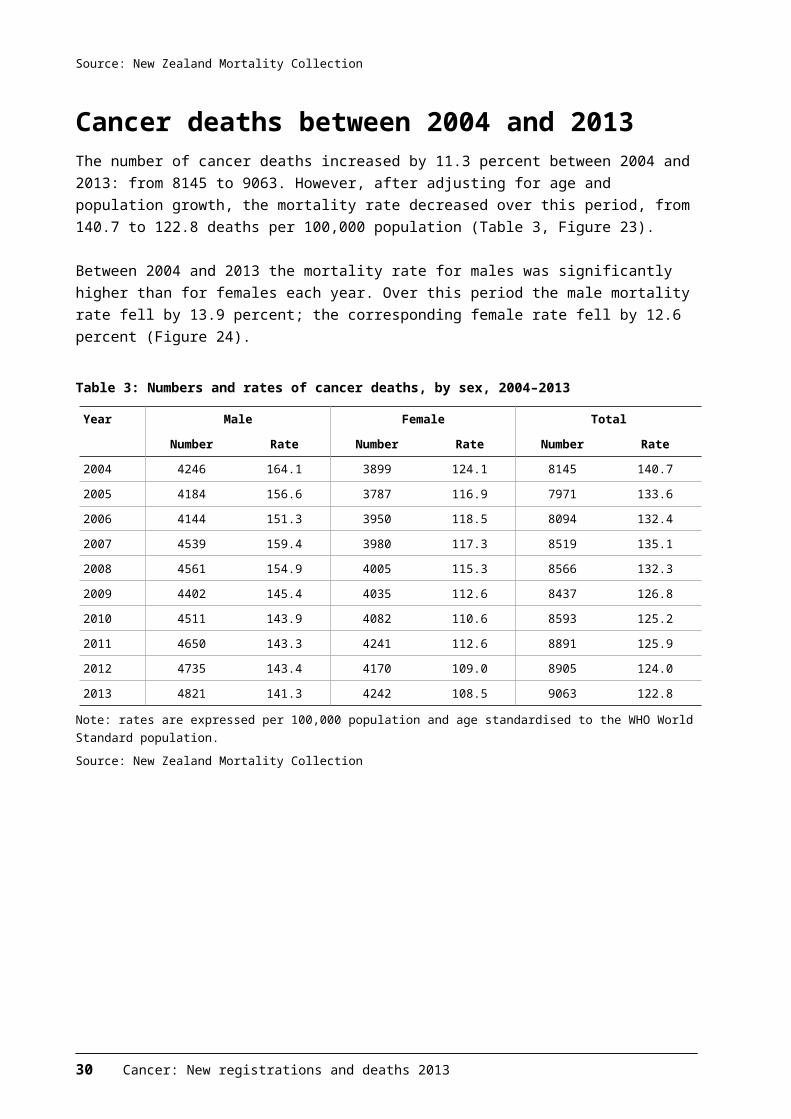
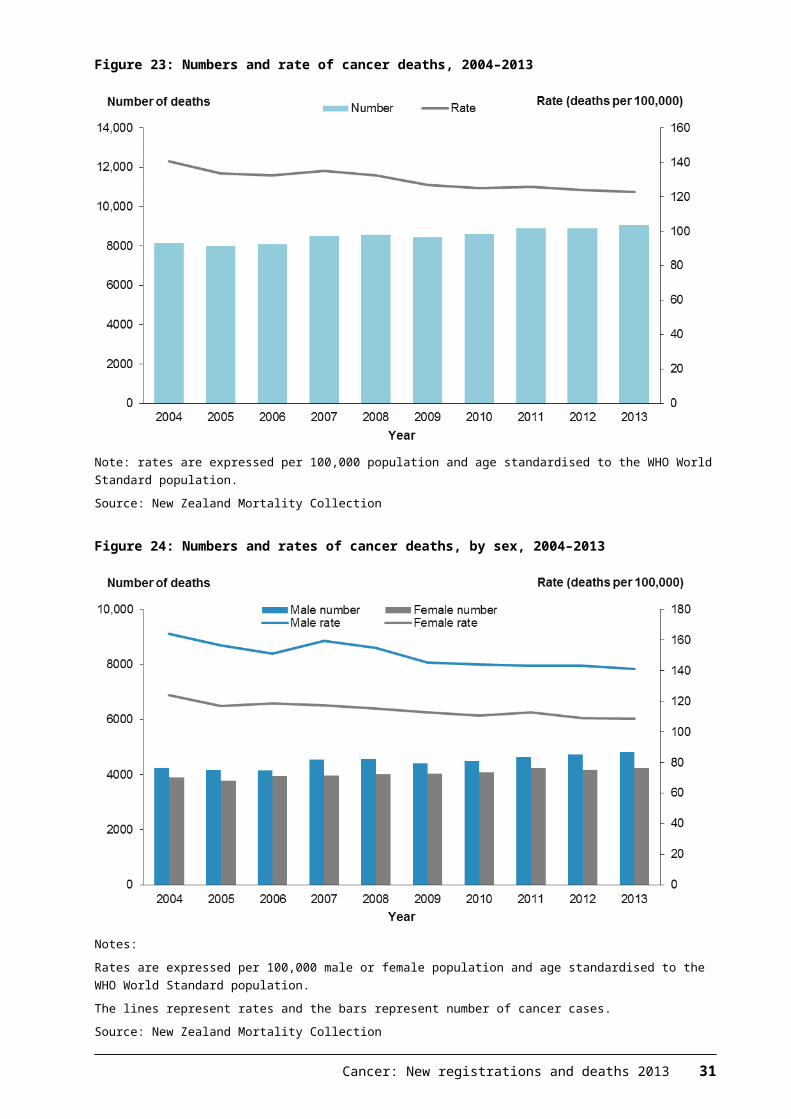
Cancer deaths between 2004 and 2013The number of cancer deaths increased by 11.3 percent between 2004 and 2013: from 8145 to 9063. However, after adjusting for age and population growth, the mortality rate decreased over this period, from 140.7 to 122.8 deaths per 100,000 population (Table 3, Figure 23).
Between 2004 and 2013 the mortality rate for males was significantly higher than for females each year. Over this period the male mortality rate fell by 13.9 percent; the corresponding female rate fell by 12.6 percent (Figure 24).
Table 3: Numbers and rates of cancer deaths, by sex, 2004–2013
Year Male Female Total
Number Rate Number Rate Number Rate
2004 4246 164.1 3899 124.1 8145 140.7
2005 4184 156.6 3787 116.9 7971 133.6
2006 4144 151.3 3950 118.5 8094 132.4
2007 4539 159.4 3980 117.3 8519 135.1
2008 4561 154.9 4005 115.3 8566 132.3
2009 4402 145.4 4035 112.6 8437 126.8
2010 4511 143.9 4082 110.6 8593 125.2
2011 4650 143.3 4241 112.6 8891 125.9
2012 4735 143.4 4170 109.0 8905 124.0
2013 4821 141.3 4242 108.5 9063 122.8
Note: rates are expressed per 100,000 population and age standardised to the WHO World Standard population.
Source: New Zealand Mortality Collection
Figure 23: Numbers and rate of cancer deaths, 2004–2013
Cancer: New registrations and deaths 2013 27
Note: rates are expressed per 100,000 population and age standardised to the WHO World Standard population.
Source: New Zealand Mortality Collection
Figure 24: Numbers and rates of cancer deaths, by sex, 2004–2013
Notes:
Rates are expressed per 100,000 male or female population and age standardised to the WHO World Standard population.
The lines represent rates and the bars represent number of cancer cases.
Source: New Zealand Mortality Collection
28 Cancer: New registrations and deaths 2013
Common cancer deathsIn 2013 cancer deaths related to over 80 different cancer sites, but just five sites accounted for half of all deaths. The following section focuses on the most common cancer deaths in 2013 for the total population and for males and females. Appendix B, Tables B4–B6 and the online tables accompanying this publication (‘Cancer trends 2013’) present more detailed data for all individual cancers.
Most common cancer deathsIn 2013 lung cancer was the leading cause of cancer deaths (1656 deaths), accounting for nearly one in every five deaths from cancer. Colorectal cancer was the second commonest, accounting for 1252 deaths. Together lung and colorectal cancers accounted for nearly one-third of all cancer deaths. These were followed by prostate (647), breast (633 females and 8 males) and pancreatic cancer (463).
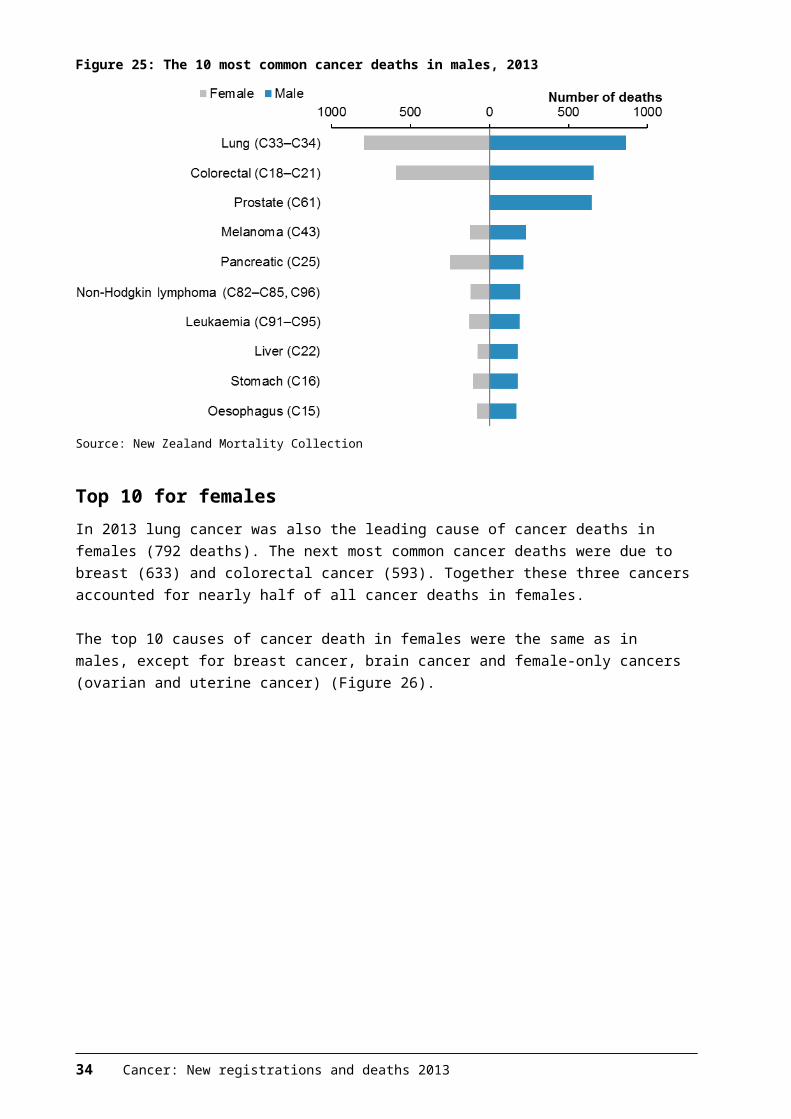
Top 10 for malesIn 2013 lung cancer was the most common cause of cancer deaths in males (864 deaths), followed by colorectal (659), prostate (647), melanoma (232) and pancreatic cancer (215). Together these five cancers accounted for 54.0 percent of cancer deaths in males. Prostate cancer was the only sex-specific cancer in the 10 most common cancer deaths in males. Stomach, oesophageal and liver cancer were also among the 10 most common cancer deaths for males, but not for females (Figure 25).
Figure 25: The 10 most common cancer deaths in males, 2013
Source: New Zealand Mortality Collection
Cancer: New registrations and deaths 2013 29
Top 10 for femalesIn 2013 lung cancer was also the leading cause of cancer deaths in females (792 deaths). The next most common cancer deaths were due to breast (633) and colorectal cancer (593). Together these three cancers accounted for nearly half of all cancer deaths in females.
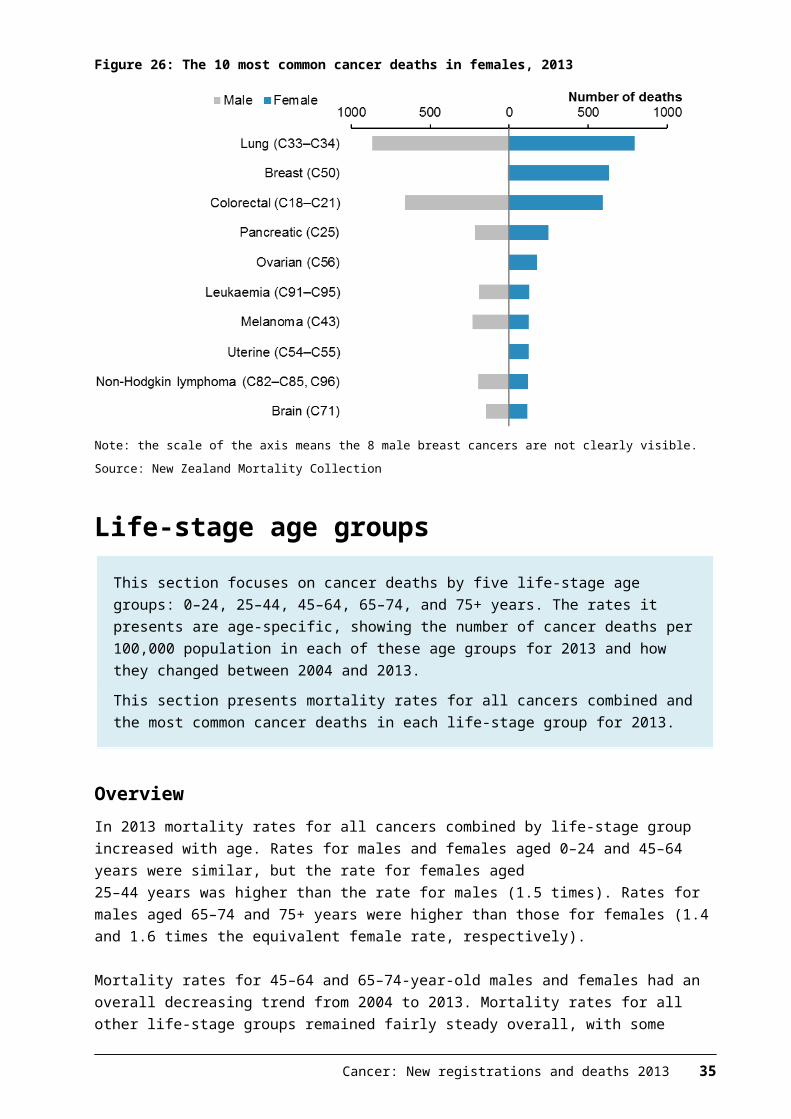
The top 10 causes of cancer death in females were the same as in males, except for breast cancer, brain cancer and female-only cancers (ovarian and uterine cancer) (Figure 26).
Figure 26: The 10 most common cancer deaths in females, 2013
Note: the scale of the axis means the 8 male breast cancers are not clearly visible.
Source: New Zealand Mortality Collection
30 Cancer: New registrations and deaths 2013
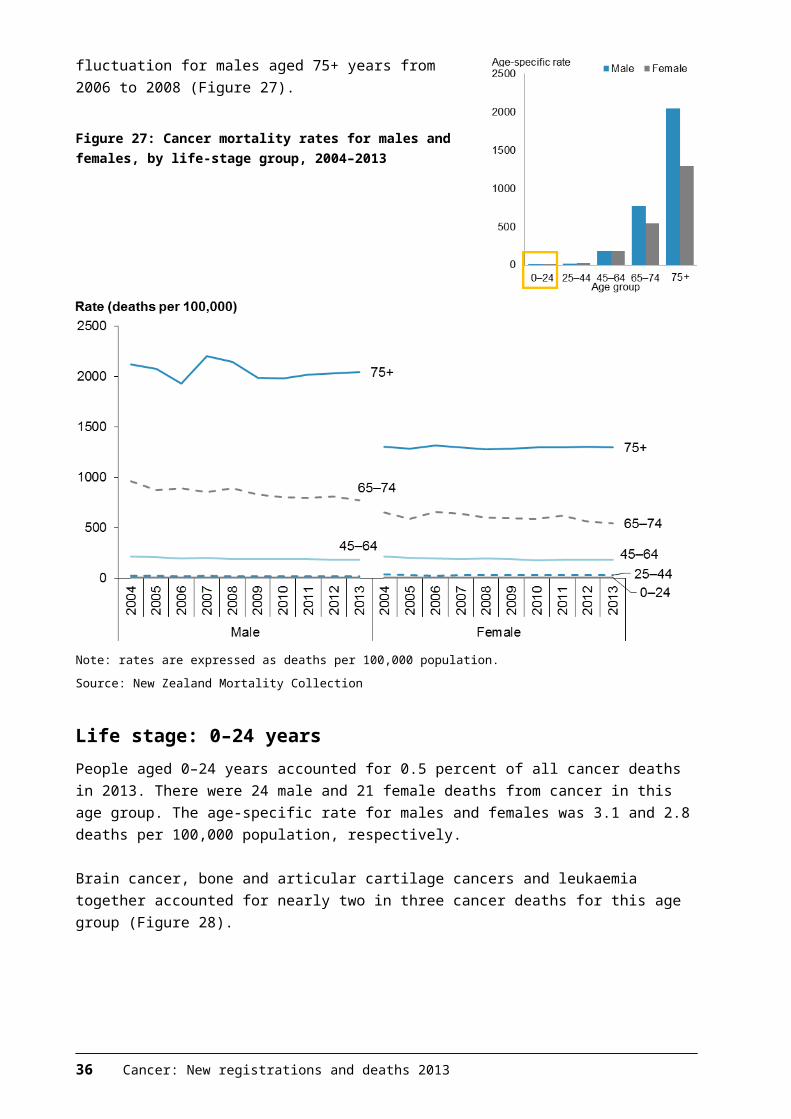
Life-stage age groupsThis section focuses on cancer deaths by five life-stage age groups: 0–24, 25–44, 45–64, 65–74, and 75+ years. The rates it presents are age-specific, showing the number of cancer deaths per 100,000 population in each of these age groups for 2013 and how they changed between 2004 and 2013.This section presents mortality rates for all cancers combined and the most common cancer deaths in each life-stage group for 2013.
OverviewIn 2013 mortality rates for all cancers combined by life-stage group increased with age. Rates for males and females aged 0–24 and 45–64 years were similar, but the rate for females aged25–44 years was higher than the rate for males (1.5 times). Rates for males aged 65–74 and 75+ years were higher than those for females (1.4 and 1.6 times the equivalent female rate, respectively).
Mortality rates for 45–64 and 65–74-year-old males and females had an overall decreasing trend from 2004 to 2013. Mortality rates for all other life-stage groups remained fairly steady overall, with some fluctuation for males aged 75+ years from 2006 to 2008 (Figure 27).
Figure 27: Cancer mortality rates for males and females, by life-stage group, 2004–2013
Note: rates are expressed as deaths per 100,000 population.
Source: New Zealand Mortality Collection
Cancer: New registrations and deaths 2013 31
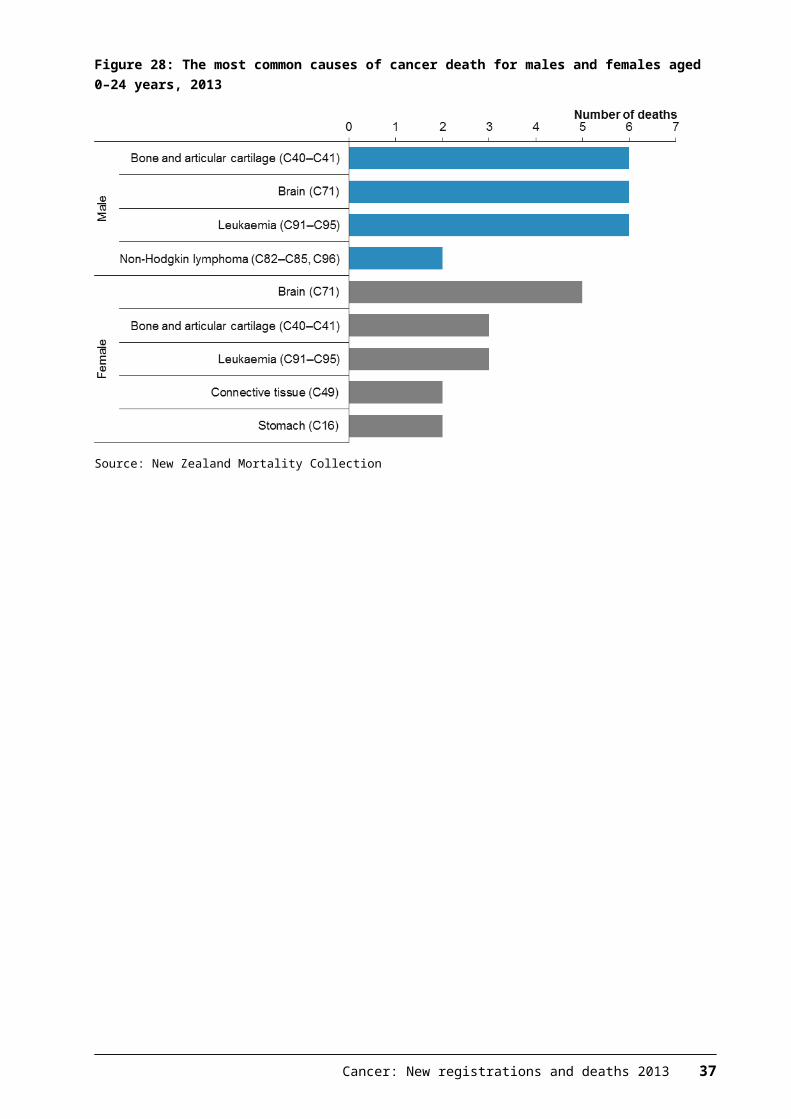
Life stage: 0–24 yearsPeople aged 0–24 years accounted for 0.5 percent of all cancer deaths in 2013. There were 24 male and 21 female deaths from cancer in this age group. The age-specific rate for males and females was 3.1 and 2.8 deaths per 100,000 population, respectively.
Brain cancer, bone and articular cartilage cancers and leukaemia together accounted for nearly two in three cancer deaths for this age group (Figure 28).
Figure 28: The most common causes of cancer death for males and females aged0–24 years, 2013
Source: New Zealand Mortality Collection
32 Cancer: New registrations and deaths 2013
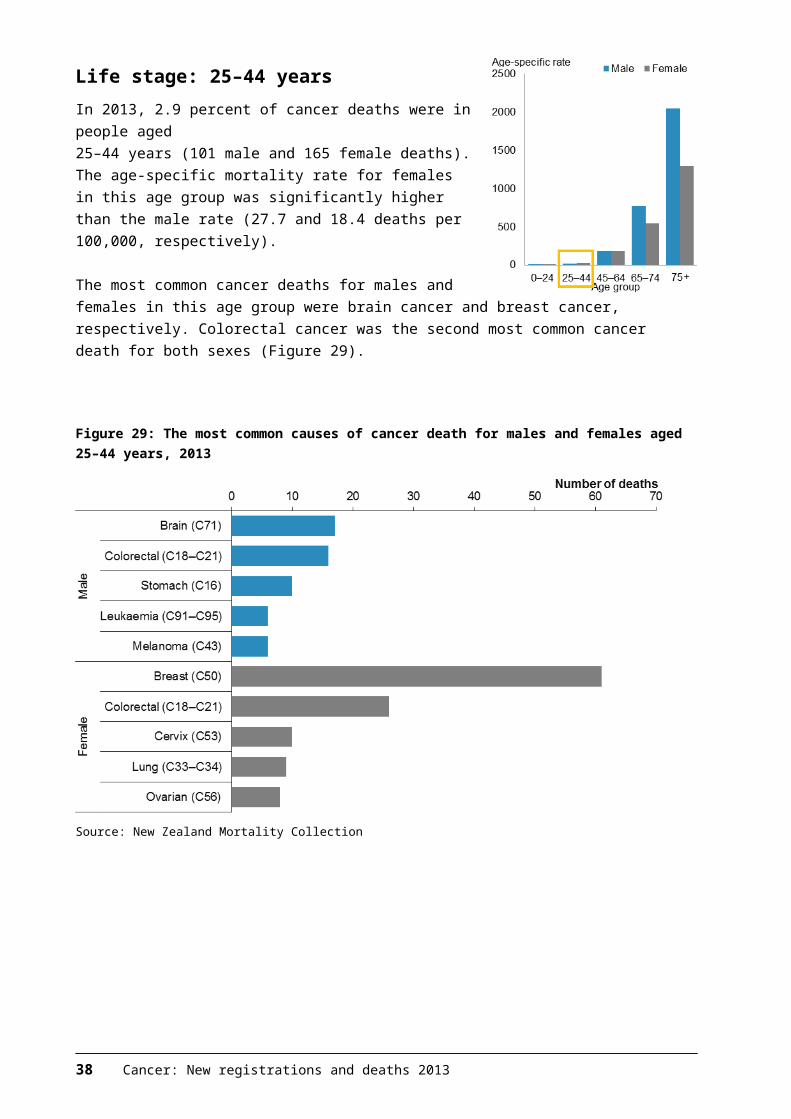
Life stage: 25–44 yearsIn 2013, 2.9 percent of cancer deaths were in people aged25–44 years (101 male and 165 female deaths). The age-specific mortality rate for females in this age group was significantly higher than the male rate (27.7 and 18.4 deaths per 100,000, respectively).
The most common cancer deaths for males and females in this age group were brain cancer and breast cancer, respectively. Colorectal cancer was the second most common cancer death for both sexes (Figure 29).
Figure 29: The most common causes of cancer death for males and females aged25–44 years, 2013
Source: New Zealand Mortality Collection
Cancer: New registrations and deaths 2013 33

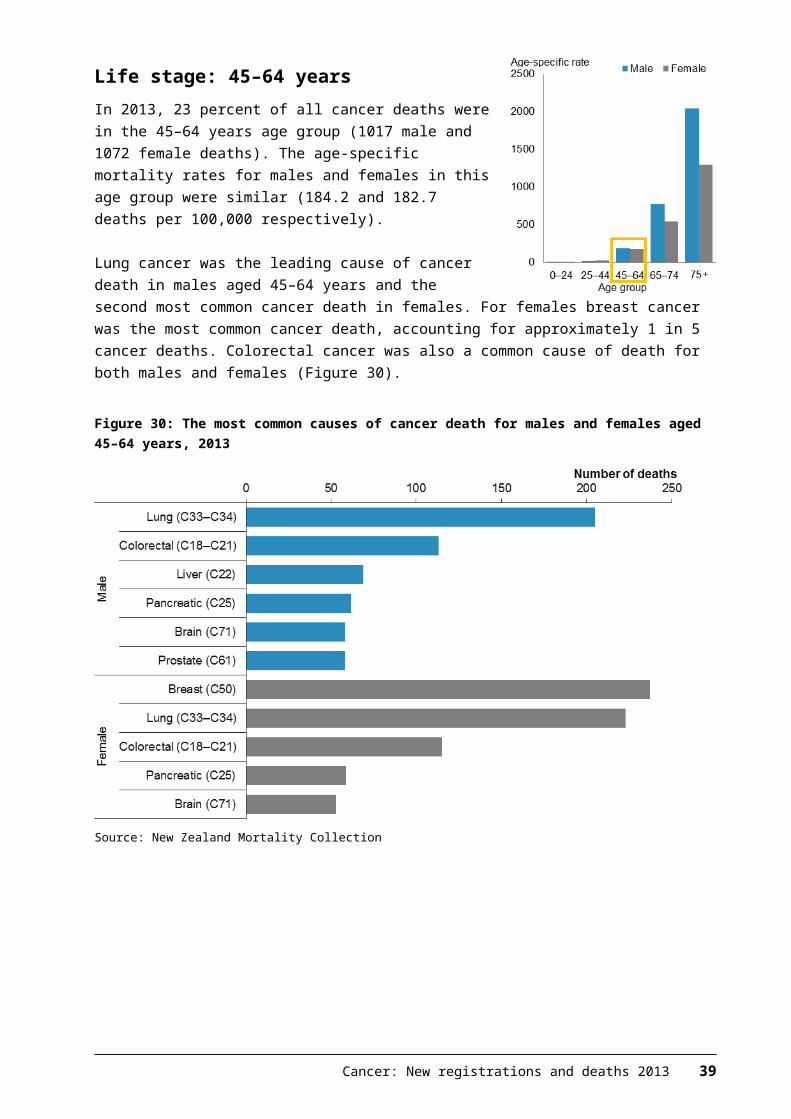
Life stage: 45–64 yearsIn 2013, 23 percent of all cancer deaths were in the 45–64 years age group (1017 male and 1072 female deaths). The age-specific mortality rates for males and females in this age group were similar (184.2 and 182.7 deaths per 100,000 respectively).
Lung cancer was the leading cause of cancer death in males aged 45–64 years and the second most common cancer death in females. For females breast cancer was the most common cancer death, accounting for approximately 1 in 5 cancer deaths. Colorectal cancer was also a common cause of death for both males and females (Figure 30).
Figure 30: The most common causes of cancer death for males and females aged45–64 years, 2013
Source: New Zealand Mortality Collection
34 Cancer: New registrations and deaths 2013
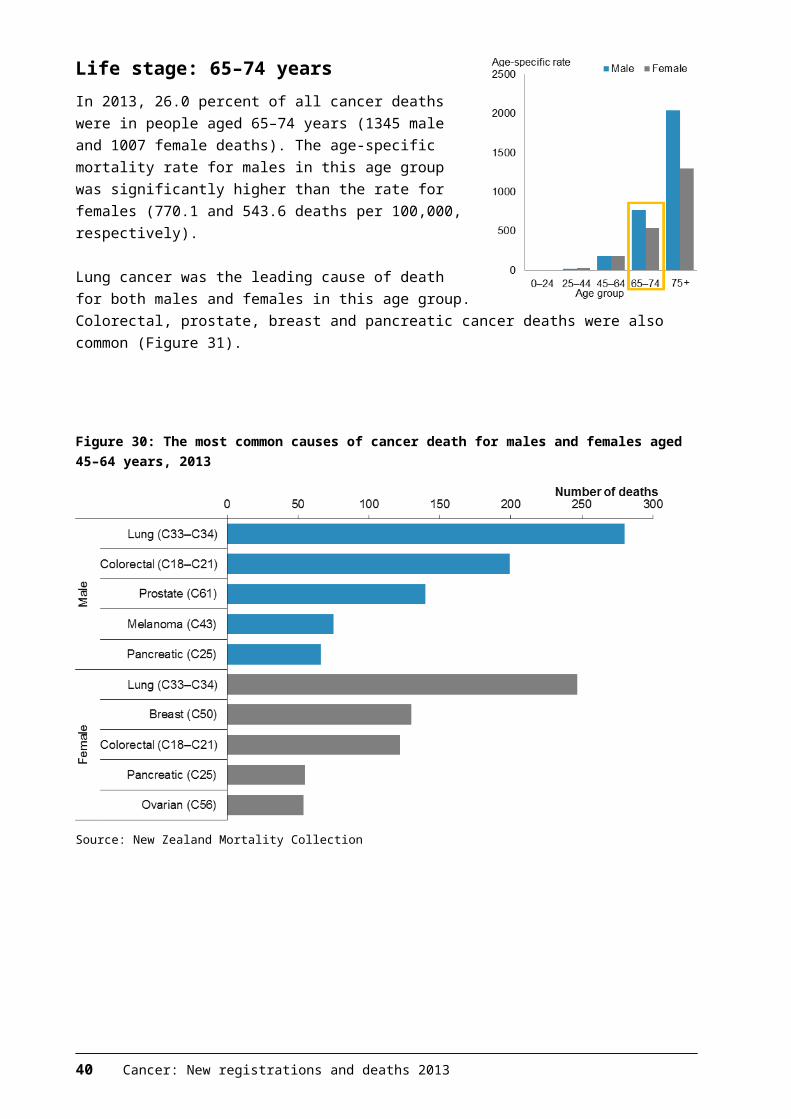
Life stage: 65–74 yearsIn 2013, 26.0 percent of all cancer deaths were in people aged 65–74 years (1345 male and 1007 female deaths). The age-specific mortality rate for males in this age group was significantly higher than the rate for females (770.1 and 543.6 deaths per 100,000, respectively).
Lung cancer was the leading cause of death for both males and females in this age group. Colorectal, prostate, breast and pancreatic cancer deaths were also common (Figure 31).
Figure 30: The most common causes of cancer death for males and females aged45–64 years, 2013
Source: New Zealand Mortality Collection
Cancer: New registrations and deaths 2013 35
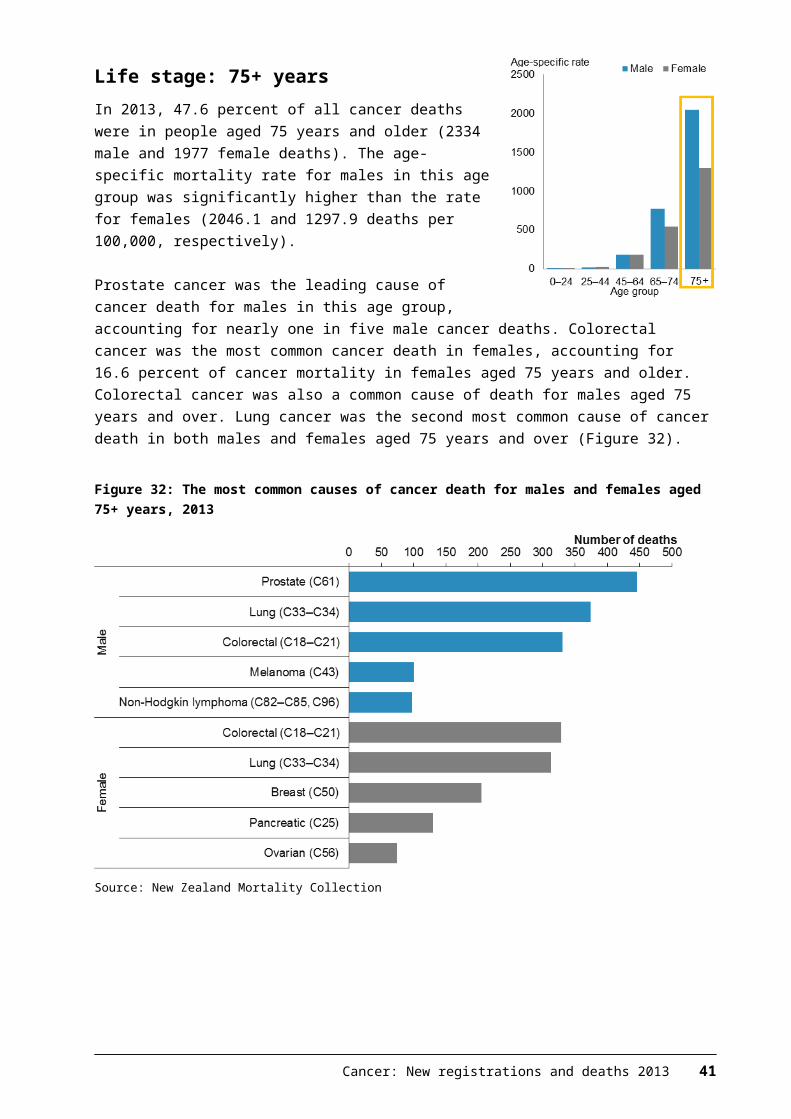
Life stage: 75+ yearsIn 2013, 47.6 percent of all cancer deaths were in people aged 75 years and older (2334 male and 1977 female deaths). The age-specific mortality rate for males in this age group was significantly higher than the rate for females (2046.1 and 1297.9 deaths per 100,000, respectively).
Prostate cancer was the leading cause of cancer death for males in this age group, accounting for nearly one in five male cancer deaths. Colorectal cancer was the most common cancer death in females, accounting for 16.6 percent of cancer mortality in females aged 75 years and older. Colorectal cancer was also a common cause of death for males aged 75 years and over. Lung cancer was the second most common cause of cancer death in both males and females aged 75 years and over (Figure 32).
Figure 32: The most common causes of cancer death for males and females aged 75+ years, 2013
Source: New Zealand Mortality Collection
36 Cancer: New registrations and deaths 2013
Māori and non-MāoriEthnicity data for deaths was sourced from Births, Deaths and Marriages. This section presents cancer data for Māori and non-Māori groups. It presents mortality rates for all cancers combined for 2004–2013. The other focus is on the most common cancer deaths for each of these ethnic groups in 2013. Appendix B, Tables B5 and B6, and the online tables accompanying this publication (‘Cancer trends 2013’) present more detailed data for individual cancers by ethnic group.
OverviewIn 2013 there were 989 Māori (459 males and 530 females) and 8074 non-Māori (4362 males and 3712 females) deaths from cancer. The cancer mortality rate for Māori was 197.9 per 100,000 Māori population, which was 1.7 times the rate for non-Māori (116.0 per 100,000 non-Māori population).
In 2013 there was greater disparity between the Māori and non-Māori rates for females than for males. The mortality rate for Māori females was 1.9 times the rate for non-Māori females (191.7 and 100.7 per 100,000). The Māori male mortality rate was 1.5 times the non-Māori male rate for males (208.5 and 135.6 per 100,000).
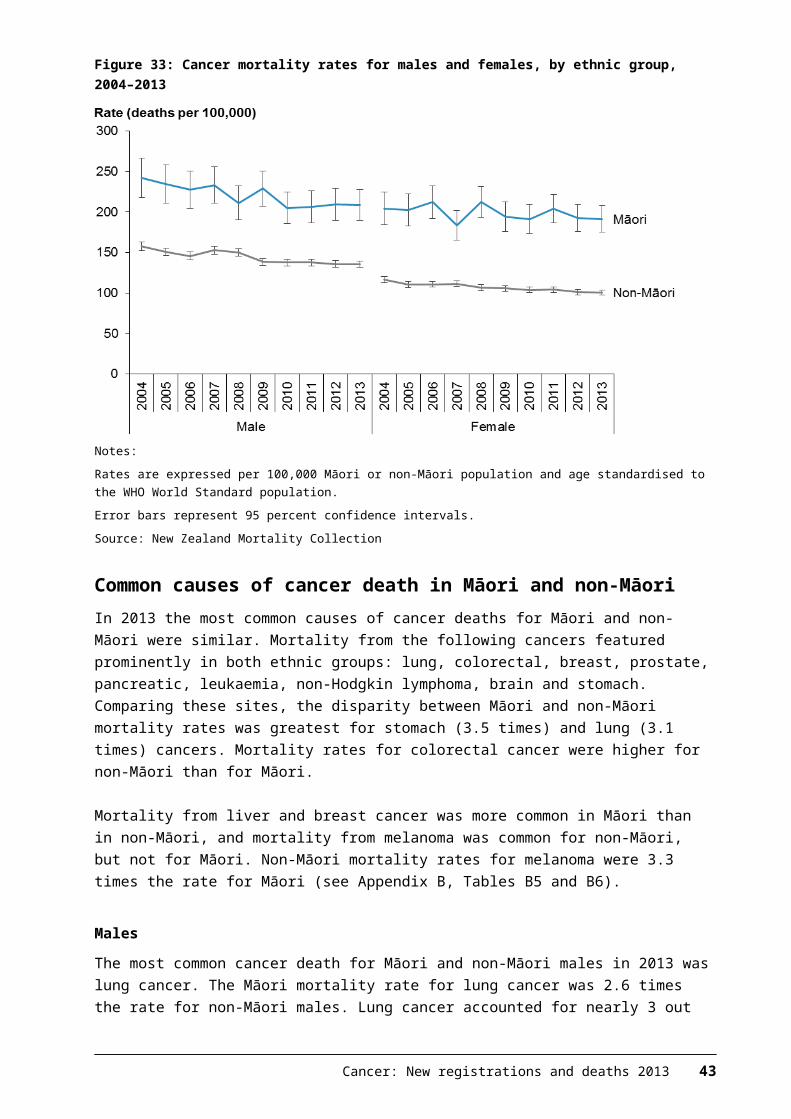
Between 2004 and 2013 the mortality rate for Māori males and females was consistently significantly higher than the rate for non-Māori males and females each year. Over this period mortality rates showed a general downward trend for each group except Māori females, where the rate was variable and did not show a clear trend (Figure 33).
Figure 33: Cancer mortality rates for males and females, by ethnic group, 2004–2013
Cancer: New registrations and deaths 2013 37
Notes:
Rates are expressed per 100,000 Māori or non-Māori population and age standardised to the WHO World Standard population.
Error bars represent 95 percent confidence intervals.
Source: New Zealand Mortality Collection
Common causes of cancer death in Māori and non-MāoriIn 2013 the most common causes of cancer deaths for Māori and non-Māori were similar. Mortality from the following cancers featured prominently in both ethnic groups: lung, colorectal, breast, prostate, pancreatic, leukaemia, non-Hodgkin lymphoma, brain and stomach. Comparing these sites, the disparity between Māori and non-Māori mortality rates was greatest for stomach (3.5 times) and lung (3.1 times) cancers. Mortality rates for colorectal cancer were higher for non-Māori than for Māori.
Mortality from liver and breast cancer was more common in Māori than in non-Māori, and mortality from melanoma was common for non-Māori, but not for Māori. Non-Māori mortality rates for melanoma were 3.3 times the rate for Māori (see Appendix B, Tables B5 and B6).
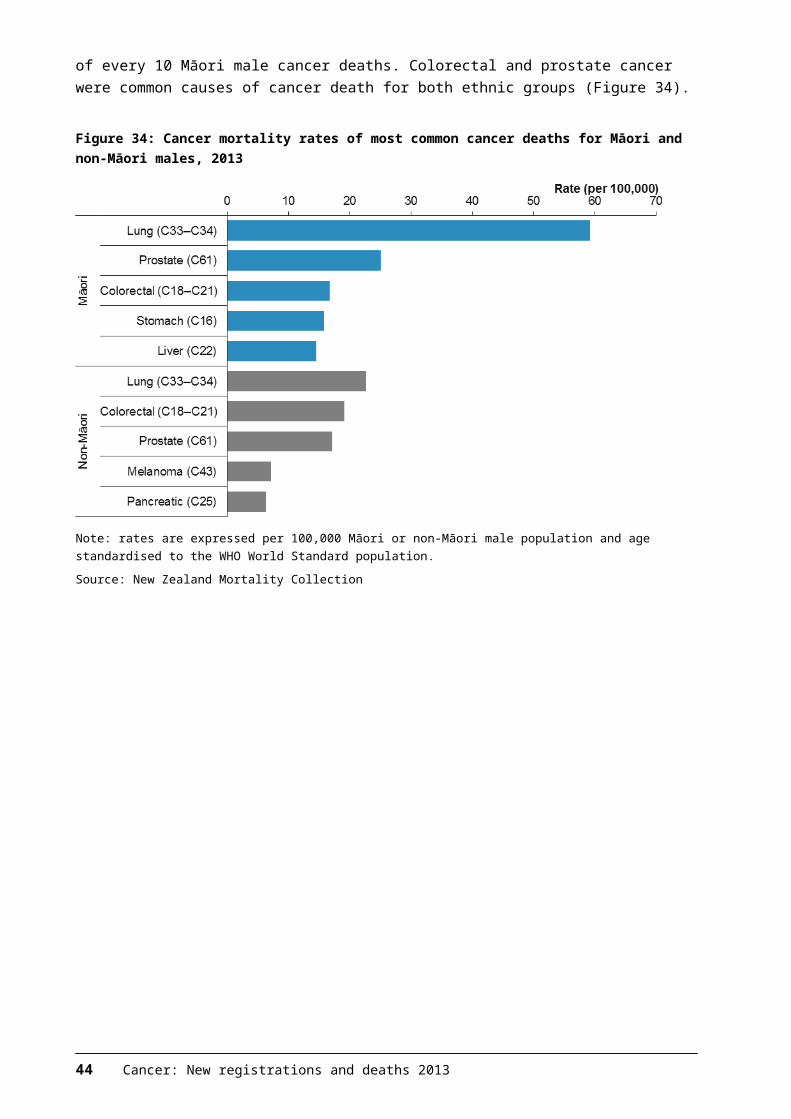
MalesThe most common cancer death for Māori and non-Māori males in 2013 was lung cancer. The Māori mortality rate for lung cancer was 2.6 times the rate for non-Māori males. Lung cancer accounted for nearly 3 out of every 10 Māori male cancer deaths. Colorectal and prostate cancer were common causes of cancer death for both ethnic groups (Figure 34).
Figure 34: Cancer mortality rates of most common cancer deaths for Māori and non-Māori males, 2013
Note: rates are expressed per 100,000 Māori or non-Māori male population and age standardised to the WHO World Standard population.
38 Cancer: New registrations and deaths 2013
Source: New Zealand Mortality Collection
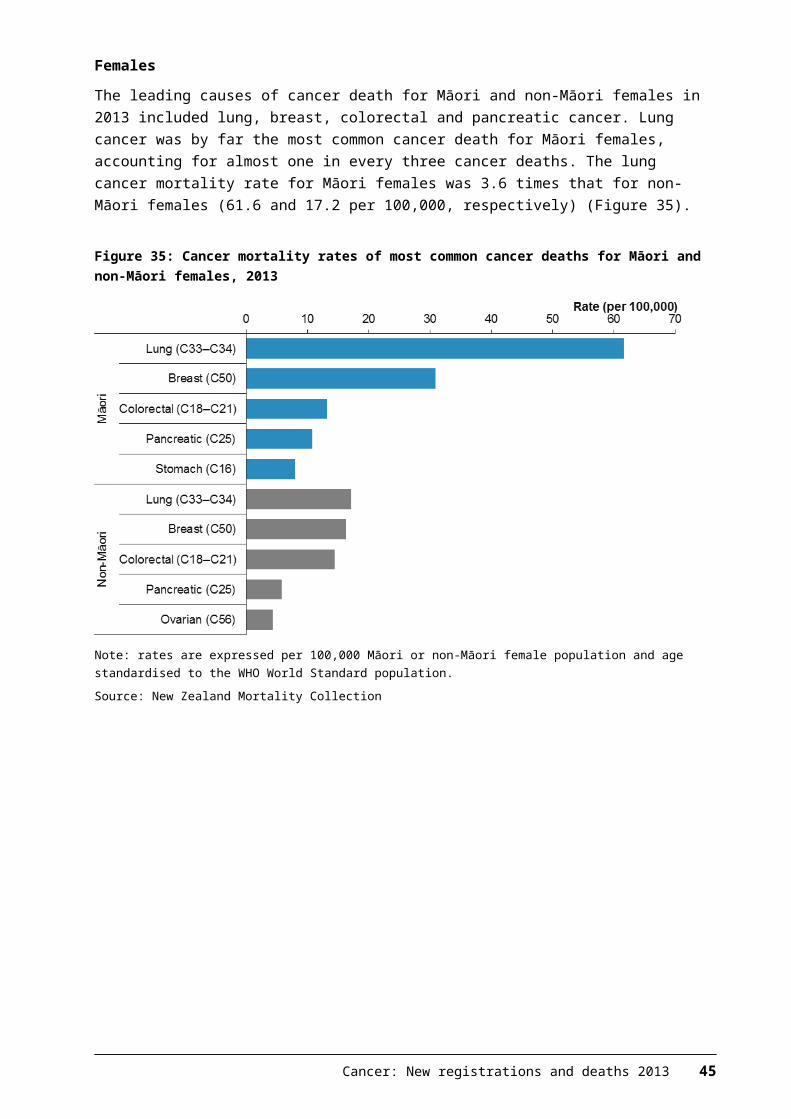
FemalesThe leading causes of cancer death for Māori and non-Māori females in 2013 included lung, breast, colorectal and pancreatic cancer. Lung cancer was by far the most common cancer death for Māori females, accounting for almost one in every three cancer deaths. The lung cancer mortality rate for Māori females was 3.6 times that for non-Māori females (61.6 and 17.2 per 100,000, respectively) (Figure 35).
Figure 35: Cancer mortality rates of most common cancer deaths for Māori and non-Māori females, 2013
Note: rates are expressed per 100,000 Māori or non-Māori female population and age standardised to the WHO World Standard population.
Source: New Zealand Mortality Collection
Cancer: New registrations and deaths 2013 39
DeprivationThis section presents mortality rates by deprivation quintile for all cancers combined and for the most common cancer deaths in males and females for 2013.
Deprivation quintiles represent the level of deprivation of a particular area of residence, according to the New Zealand Deprivation Index 2013 (NZDep 2013). Deprivation quintile 1 represents the least deprived and quintile 5 represents the most deprived.
Note that the deprivation classification used in this report differs from previous years, so comparing with figures published previously is not recommended. See Appendix A for more information.
OverviewIn 2013 cancer mortality rates for all cancers combined were higher for those residing in more deprived areas. Mortality rates in quintiles 3─5 were significantly higher than those in quintiles 1 and 2.
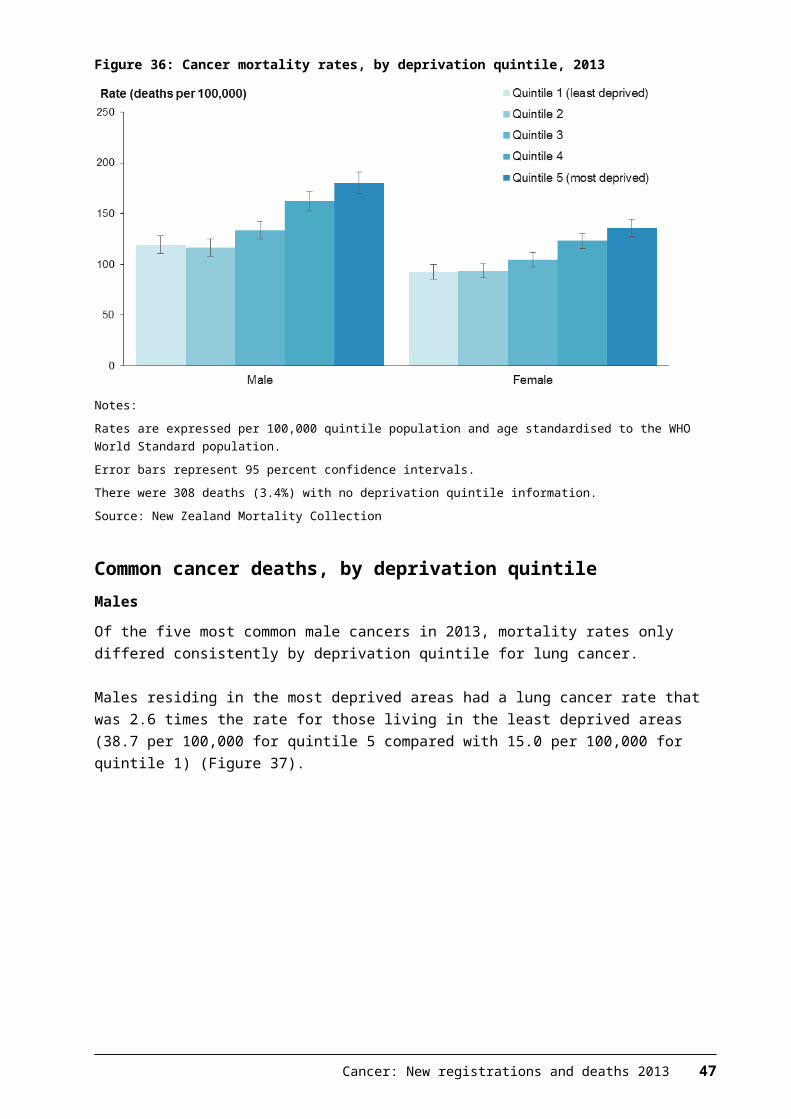
For males, the cancer mortality rate was highest for those residing in deprivation quintile 5 (180.0 deaths per 100,000) and lowest for those residing in quintiles 1 and 2 (119.2 and 116.4 per 100,000 respectively).
For females a similar pattern was seen, with mortality rates being lowest in quintiles 1 and 2 (92.5 and 93.5 per 100,000, respectively) and highest for those residing in the most deprived areas, quintile 5 (136.0 per 100,000) (Figure 36).
Figure 36: Cancer mortality rates, by deprivation quintile, 2013
Notes:
Rates are expressed per 100,000 quintile population and age standardised to the WHO World Standard population.
Error bars represent 95 percent confidence intervals.
There were 308 deaths (3.4%) with no deprivation quintile information.
40 Cancer: New registrations and deaths 2013
Source: New Zealand Mortality Collection
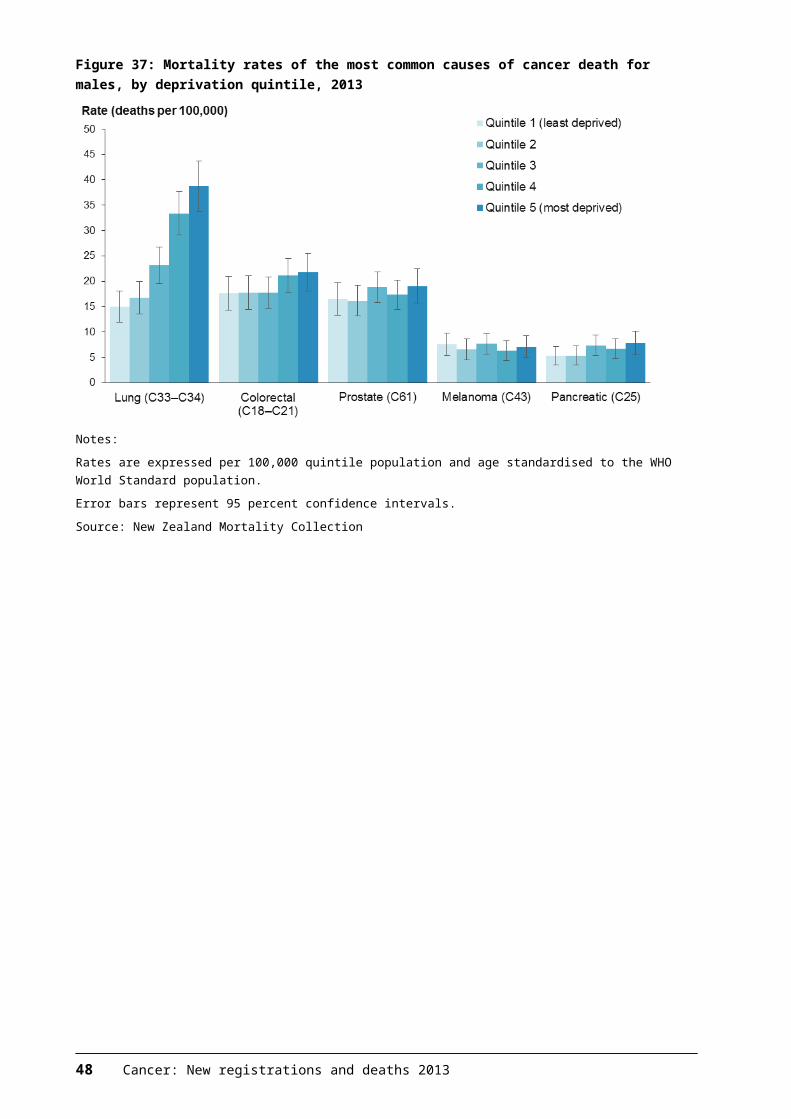
Common cancer deaths, by deprivation quintileMalesOf the five most common male cancers in 2013, mortality rates only differed consistently by deprivation quintile for lung cancer.
Males residing in the most deprived areas had a lung cancer rate that was 2.6 times the rate for those living in the least deprived areas (38.7 per 100,000 for quintile 5 compared with 15.0 per 100,000 for quintile 1) (Figure 37).
Figure 37: Mortality rates of the most common causes of cancer death for males, by deprivation quintile, 2013
Notes:
Rates are expressed per 100,000 quintile population and age standardised to the WHO World Standard population.
Error bars represent 95 percent confidence intervals.
Source: New Zealand Mortality Collection
Cancer: New registrations and deaths 2013 41
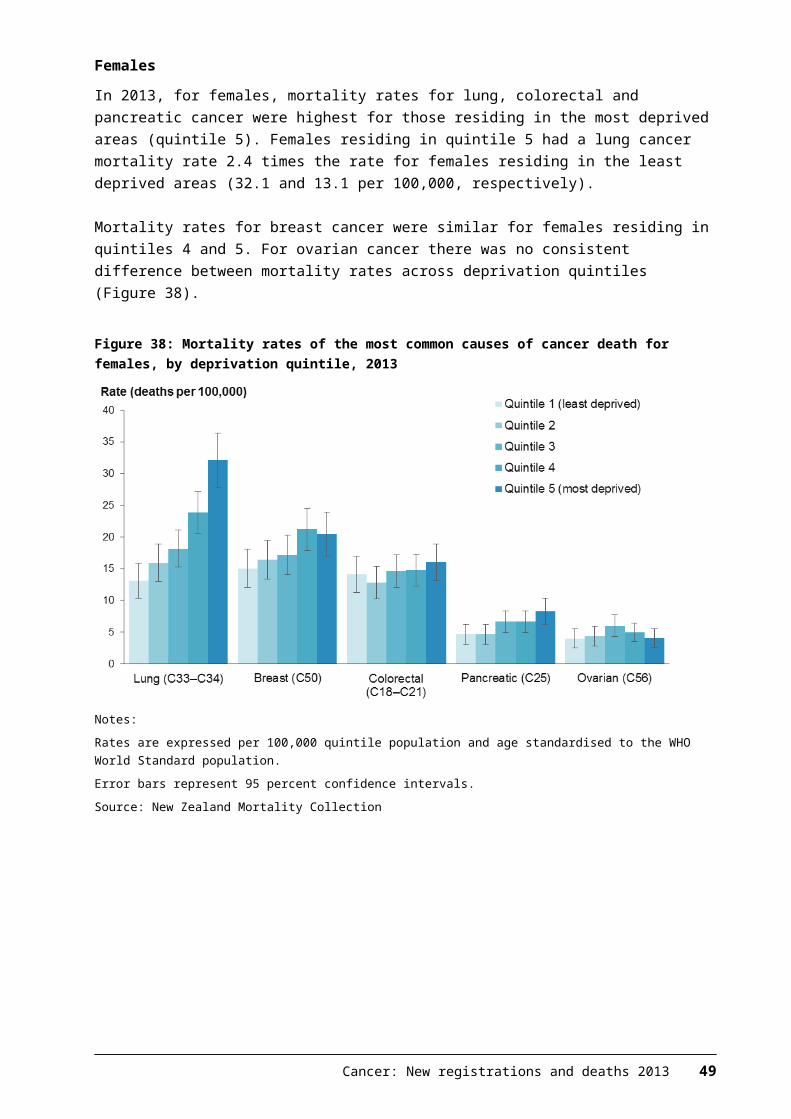
FemalesIn 2013, for females, mortality rates for lung, colorectal and pancreatic cancer were highest for those residing in the most deprived areas (quintile 5). Females residing in quintile 5 had a lung cancer mortality rate 2.4 times the rate for females residing in the least deprived areas (32.1 and 13.1 per 100,000, respectively).
Mortality rates for breast cancer were similar for females residing in quintiles 4 and 5. For ovarian cancer there was no consistent difference between mortality rates across deprivation quintiles (Figure 38).
Figure 38: Mortality rates of the most common causes of cancer death for females, by deprivation quintile, 2013
Notes:
Rates are expressed per 100,000 quintile population and age standardised to the WHO World Standard population.
Error bars represent 95 percent confidence intervals.
Source: New Zealand Mortality Collection
42 Cancer: New registrations and deaths 2013
Variation within New Zealand 2011–2013This section presents data by DHB region of domicile for cancer deaths between 2011 and 2013. This data has not been adjusted by ethnicity or deprivation level. Different regions have different proportions of Māori in their populations, and the fact that Māori have higher mortality rates for some cancers will have affected regional rates of mortality to some extent. Data for DHB regions was aggregated for 2011–2013 since rates can vary considerably from year to year for some DHBs.
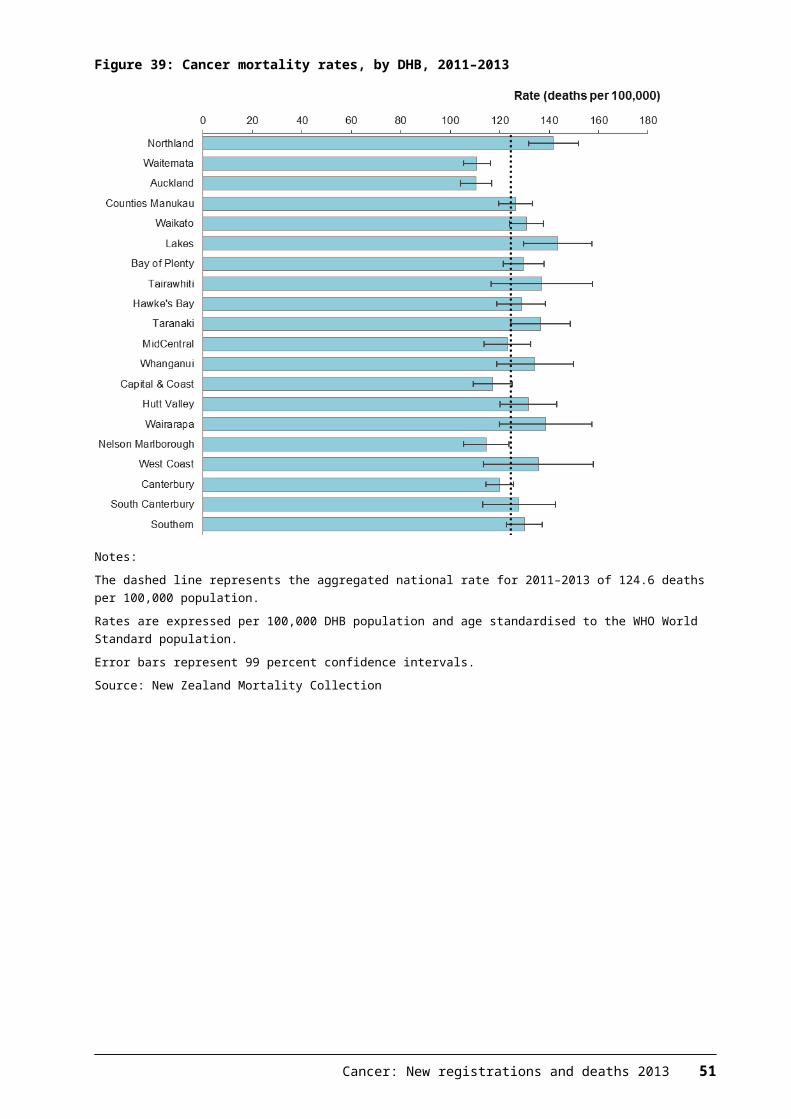
Mortality rates for all cancers combined varied throughout New Zealand (Figures 39–40). The highest cancer mortality rate was in Lakes DHB (143.5 deaths per 100,000), followed by Northland (141.7 per 100,000). The lowest mortality rates were in Auckland and Waitemata DHBs (110.4 and 110.7 per 100,000 respectively) (Figure 39).
Lakes, Northland and Taranaki DHBs had mortality rates significantly higher than the national rate (124.6 per 100,000). Auckland, Waitemata and Nelson Marlborough DHBs had mortality rates significantly lower than the national rate.
Figure 39: Cancer mortality rates, by DHB, 2011–2013
Notes:
The dashed line represents the aggregated national rate for 2011–2013 of 124.6 deaths per 100,000 population.
Rates are expressed per 100,000 DHB population and age standardised to the WHO World Standard population.
Error bars represent 99 percent confidence intervals.
Cancer: New registrations and deaths 2013 43
Source: New Zealand Mortality Collection
Figure 40: Comparison of DHB region cancer mortality rates, 2011–2013
Note: rates are expressed per 100,000 population and age standardised to the WHO World Standard population.
44 Cancer: New registrations and deaths 2013
Source: New Zealand Mortality Collection
Cancer: New registrations and deaths 2013 45
Appendix A: Technical notesData sourcesRegistration dataThe New Zealand Cancer Registry is a collection of data on malignant disease cases that have been diagnosed in New Zealand. Registrations are based on discrete primary cancer cases that are distinguished by differences in topography or histology. Cancers are registered once, in the year of their first known diagnosis (see the Cancer Registry Act 1993 in Appendix C).
Registrations cover new cases of primary cancer, or secondary cancers where the primary cancer is unknown. The process of collecting, coding and collating national information on cancer registrations and deaths is complex. Data in the Cancer Registry comes from laboratory reports, hospital information and mortality information (Figure A1). To ensure a high standard of data, Registry staff comprehensively screen all records before adding them to the Registry. Deaths from cancer are reconciled with cancer registrations recorded on the Registry.
Figure A1: Data and the New Zealand Cancer Registry
Changes in legislationOn 1 July 1994 the Cancer Registry Act 1993 and Cancer Registry Regulations 1994 came into force, introducing fundamental changes to the collection of cancer data in New Zealand. Appendices C and D contain the full text of the Cancer Registry Act and Cancer Registry Regulations. The effect of legislation on cancer registration statistics is discussed in Cancer: New registrations and deaths 1996 (Ministry of Health 2000).
46 Cancer: New registrations and deaths 2013
Health care user information
Mortality dataCancer mortality data is sourced from the New Zealand Mortality Collection. This contains data on all deaths registered in New Zealand. Death and stillbirth registration data is sent electronically to the Collection monthly from Births, Deaths and Marriages. In addition, the Ministry of Health receives medical certificates of causes of death (completed by certifying doctors) from funeral directors, as well as coronial findings relating to deaths from Coronial Services of New Zealand (Ministry of Justice). The Ministry of Health assigns each death an underlying cause. For those registered in 2013 the ICD-10-AM, sixth edition, was used (National Centre for Classification in Health 2008). The timing of publication of this data is affected by manual processing of death data and the need to wait until almost all coroners’ findings for any particular year have been received. Several final steps ensure the final information is of good quality.
Ethnicity dataThe Ministry of Health requires providers to collect and classify ethnicity data according to its ethnicity data protocols for the health and disability sector (see Ministry of Health 2004). Under the protocols, ethnicity information is collected through self-identification or, when this is not possible, by appropriate proxy using a standard question format. Individuals may select up to three ethnicities they feel they belong to.
This publication categorises ethnicity information as either Māori or non-Māori. Thus, any person who selects Māori as one of their three ethnicities will be recorded as Māori. Registrations without an ethnic identification have been included in the non-Māori group.
Cancer registrationsThe Cancer Registry gathers ethnicity information from hospital discharge information, the National Health Index and the Mortality Collection The less contact a patient has with the hospital system, the less likely they are to have an accurate ethnicity recorded. In 2013 ethnicity was not recorded for 603 cancer registrations (2.7%).
Cancer deathsThe New Zealand Mortality Collection sources ethnicity data for deaths from Births, Deaths and Marriages. Family members or others assisting with a death registration provide ethnicity data to funeral directors, who record it on the BDM28 ‘Notification of Deaths for Registration’ form. There have been no recent changes in the way ethnicity is assigned to death records. All records of cancer deaths in 2013 included ethnicity.
Changes to ethnicity codingIn 2009 the New Zealand Cancer Registry adjusted the way it recorded ethnicities in order to rectify a perceived undercount of some ethnicities. The changes were applied to information from 1989 onwards, and resulted in some significant changes in the proportions of cancer registrations allocated to particular ethnicities. Updated registration data was used in Cancer: New registrations and
Cancer: New registrations and deaths 2013 47
deaths 2006 (Ministry of Health 2011). This change means that information relating to ethnicities in publications prior to 2006 cannot be directly compared with that presented in this publication.
Clinical coding of cancer dataPopulation dataThis publicationCancer rates for 2013 in this publication were calculated using the following population data sets supplied by Statistics New Zealand: estimated resident population for Māori and non-Māori, by age and sex, mean
year ended 31 December, 2013 estimated resident population by age, sex and DHB as at 30 June, 2011–2013.
Estimated resident population by age, sex and 2013 area unit as at 30 June 2013 was sourced from NZ.Stat on 15 September 2016, linked to 2006 via the 2013 area concordance file accessed from Statistics New Zealand on the same day. This was the basis for the population data used to calculate the rates by deprivation. See below for more information.
Rates presented for years prior to 2013 are as published in the Cancer: New registrations and deaths series. They were calculated using the estimated resident population available at the time of release (ie, aligned with the 2006 Census results) and have not been recalculated for this report.
Registration dataThe ICD-10-AM, sixth edition, was used to classify the site or topography for the 2009–2013 cancer registrations. For data from 2004 to 2008 the ICD-10-AM, third edition, was used.
Mortality dataThe ICD-10-AM, second edition, was used to classify cancer sites for the 2004–2007 mortality data. The ICD-10-AM, sixth edition, was used to classify the 2008–2013 mortality data.
MorphologyThe ICD-O third edition was used to classify the morphology (histology, type and behaviour) of tumours.
Bladder cancerSince 1 January 2005 superficial transitional cell carcinoma of the bladder has not been coded as an invasive cancer. This coding change has resulted in a decrease in the number of bladder cancer registrations when compared with previous years.
48 Cancer: New registrations and deaths 2013
Skin cancersThe Cancer Registry does not record basal cell epithelioma and squamous cell carcinoma of the skin except when of the skin of genital organs. The registration of these cancers was discontinued in 1958 because of resource considerations.
A small number of non-melanoma cases (for example, dermatofibrosarcoma and Merkel cell tumours) have been registered and classified to site ICD C44.
In situ cancersIn situ cancers are localised lesions that have not invaded beyond the basement membrane. All in situ cancers have been excluded from the data presented.
Multiple primary tumoursIncidence counts and rates in this publication are based on the number of primary tumours rather than the number of individuals with cancer. The New Zealand Cancer Registry database records multiple primary cancers in the same person, of which only some are counted for incidence purposes, according to rules set out by the International Agency for Research on Cancer and the International Association of Cancer Registries. In brief, these rules state the following.1. Recognition of the existence of two or more primary cancers does not depend
on time.2. A primary cancer is one that originates in a primary site or tissue and is thus
neither an extension, nor a recurrence or a metastasis (transfer of cancerous cells to other parts of the body) of a pre-existing tumour.
3. Only one tumour shall be recognised in an organ or pair of organs or tissue (as defined by a letter and a series of numerals of the ICD-10 topography) unless of different histology.
Under these rules, a cancer with a different histology in the same organ is counted as a new tumour. There are 17 defined groups of malignant neoplasms considered to be histologically different (International Agency for Research on Cancer et al 2004). Incidence reporting of multiple tumours is based on these groups.
Analytical methods definitionsNumbers, rates and ratiosThe number of cancer registrations and deaths refers to the number of people who have been registered with cancer, or died with an underlying cause of cancer.
The rate of cancer registrations or deaths refers to the frequency with which these events occur relative to the number of people in a defined population and a defined time period.
Age-specific ratesAn age-specific rate measures the frequency with which an event occurs relative to the number of people in a defined age group. In Cancer: New registrations and
Cancer: New registrations and deaths 2013 49
deaths, age-specific rates are given in both five-year age groups and life-stage age groups.
Age-standardised rates and rate ratiosAn age-standardised rate is a rate that has been adjusted to account for differences in the age distribution of the population over time or between different groups (for example, different ethnic groups). These rates are calculated by the direct standardisation method, which multiplies the age-specific rates by a standard population. The standard population used in this publication is the WHO World Standard population (Table A1) (Ahmad et al 2001). All rates in this publication are age standardised unless otherwise stated.
Prior to 2005, publications in the Cancer: New registrations and deaths series used Segi’s world population, and therefore the rates presented in publications prior to 2005 are not comparable with those stated in this document.
Table A1: The WHO World Standard population distribution
Age group (years)
Population distribution (%)
0–4 8.86
5–9 8.69
10–14 8.60
15–19 8.47
20–24 8.22
25–29 7.93
30–34 7.61
35–39 7.15
40–44 6.59
45–49 6.04
50–54 5.37
55–59 4.55
60–64 3.72
65–69 2.96
70–74 2.21
75–79 1.52
80–84 0.91
85+ 0.63
Total 100.00
Note: the WHO Standard age group 85+ is an aggregate of the age groups 85–89, 90–94, 95–99 and 100+.
Source: Ahmad et al 2001
Confidence intervals and statistical significanceThe confidence intervals in this report have been calculated for rates at the 95 or 99 percent level, using the method presented in Keyfitz 1966.
50 Cancer: New registrations and deaths 2013
A confidence interval is a range of values used to describe the uncertainty around a single value (such as an age-standardised rate). Confidence intervals describe how different the estimate could have been if chance had led to a different set of data. Confidence intervals are calculated with a stated probability, typically 95 percent (which would indicate that there is a 95 percent chance that the true value lies within the confidence intervals). In this report confidence intervals for DHB rates are calculated at the 99 percent level, which gives a wider interval than 95 percent and provides greater certainty that the value is contained within the interval.
If two confidence intervals do not overlap for two time periods or groups, then the differences can be said to be statistically significantly different (ie, any difference between the two groups being compared is not due to chance). If they do overlap, then statistical testing can be done to ascertain whether the difference is statistically significant. Unless stated, this has not been applied to the data in this report.
DeprivationDeprivation has been associated with various adverse health outcomes. From the social inequalities literature it is evident that those who are most deprived generally experience poorer health (Benzeval et al 2001; White et al 2008). This report presents cancer registration and mortality rates by deprivation quintile according to the New Zealand Deprivation Index 2013 (NZDep2013) (Atkinson et al 2014).
The New Zealand Deprivation Index is a measure of socioeconomic status calculated for small geographic areas. The calculation uses a range of variables from the 2013 Census of Population and Dwellings that represent nine dimensions of social deprivation. The Deprivation Index is calculated at the level of meshblocks (the smallest geographical units that Statistics New Zealand uses to collect and measure statistical data, containing 60−110 people), and the Ministry of Health maps these meshblocks to domicile codes, which are built up to the relevant geographic scale using weighted average census (usually resident population) counts.
The nine variables (proportions in small areas) in the index, by decreasing weight, are:1. communication: people aged under 65 with no access to the internet at home2. income: people aged 18–64 years receiving a means-tested benefit3. income: people living in an equivalised1 household whose income is below a
certain threshold4. employment: people aged 18–64 years who are unemployed5. qualifications: people aged 18–64 years with no qualifications6. home ownership: people not living in their own home7. support: people aged under 65 years living in a single-parent family8. living space: people living in an equivalised1 household below a bedroom
occupancy threshold
1 Equivalisation is a method used to control for the range of possible household compositions.
Cancer: New registrations and deaths 2013 51
9. transport: people with no access to a car.
In this report NZDep2013 is presented as deprivation quintiles, with 1 being people who live in areas with the lowest levels of deprivation and 5 being people who live in areas with the highest levels of deprivation.
Further information is available from www.health.govt.nz (search for ‘NZDep2013 Index of Deprivation’).
Application of NZDep2013 for this publicationDomiciles are area units that represent the area a New Zealander resides in. Domicile codes are re-categorised each Census but take some time to be categorised and implemented. This means that 2013 domicile codes were not applied to the Ministry of Health collections until 2015. The re-categorisation usually means most domicile codes remain the same. However, with population changes, some areas can get bigger and some can get smaller. This means that some domicile codes from the 2006 Census were split into two or more different codes in 2013, while others were retired altogether, the areas they represent being combined into other domicile codes. Domicile codes are the primary method of linking the New Zealand Index of Deprivation codes to the Ministry of Health’s national collections.
Because New Zealand’s 2011 Census was postponed until 2013 it is important to assess the applicability of NZDep2006 to the analysis of 2013 data. The 2013 data analysed in this report has 2006 domicile codes attached to it. Upon investigation we found that for cancer records with a domicile code that is unchanged from 2006 to 2013, a quarter of the records are classified differently using NZDep2013 than they would be using NZDep2006.
For this report and accompanying tables an NZDep2013 quintile was assigned for records where: the domicile area code was the same for both the 2006 and the 2013
categorisations the 2006 domicile was split into more than one domicile after the 2013 census
but the NZDep2013 quintile is the same across all of the domicile areas it was split into.
This means that approximately 3.5 percent of the cancer registration and death records analysed and presented in this report are not assigned an NZDep2013 quintile.
Table A2 shows examples of some of the 2006 domicile codes and linked NZDep2006 quintiles. Alongside these are the possible NZDep2013 quintiles that link to each domicile code. The final column describes whether each record is included in the deprivation analysis presented in this report. Record numbers 2, 3, 8, 10, 13 and 14 are examples of those where the
NZDep2006 quintile is not the same as the NZDep2013 quintile. Approximately a quarter of the ‘included’ records were like this.
52 Cancer: New registrations and deaths 2013
Blue-shaded records, numbers 1, 2, 3, 4, 10, 13 and 14, are examples of those where there was just one NZDep2013 quintile (ie, the domicile code was not ‘split’). Most of the records were like this.
Grey-shaded record numbers, 5, 8, 11, 12 and 16, are examples of records that had more than one NZDep2013 quintile (ie, the domicile codes were ‘split’), but those quintiles were all matching. These were included.
Unshaded record numbers, 6, 7, 9 and 15, are examples of records that had more than one NZDep2013 quintile, and not all of them were the same value. These were excluded.
Record number 17 is an example of a record that had no deprivation score assigned, as areas that represent bodies of water or small islands were not included in the NZ Deprivation Index analyses.
Table A2: Examples of 2006 domicile records and linked 2006 and 2013 New Zealand deprivation index quintiles
Record number
Census 2006 domicile code
NZDep2006 quintile
NZDep2013 quintile Inclusion in 2013 analysis?
Split 1 Split 2 Split 3 Split 4 Split 5 Split 6
1 0009 5 5 Include
2 0029 2 3 Include
3 0037 1 2 Include
4 0064 3 3 Include
5 0085 2 2 2 Include
6 0089 2 3 1 1 Exclude
7 0116 2 1 2 3 3 2 Exclude
8 0812 3 4 4 Include
9 0847 3 3 4 Exclude
10 1320 2 1 Include
11 2095 1 1 1 Include
12 2215 4 4 4 Include
13 2506 3 2 Include
14 2828 4 3 Include
15 3070 3 1 3 Exclude
16 3120 1 1 1 1 1 1 1 Include
17 3268 Exclude
Table A3 demonstrates the sex and ethnic group characteristics of the records that were ‘included’ and ‘excluded’ from the deprivation analysis presented in this report. This shows that people whose records are ‘included’ are less likely to be male and more likely to be Māori than people whose records are ‘excluded’ from the deprivation analysis in this report.
Table A3: Distribution of sex and ethnic groups among records included and excluded from deprivation analysis presented in this report, percentages
2013 cancer registrations 2013 cancer deaths
Cancer: New registrations and deaths 2013 53
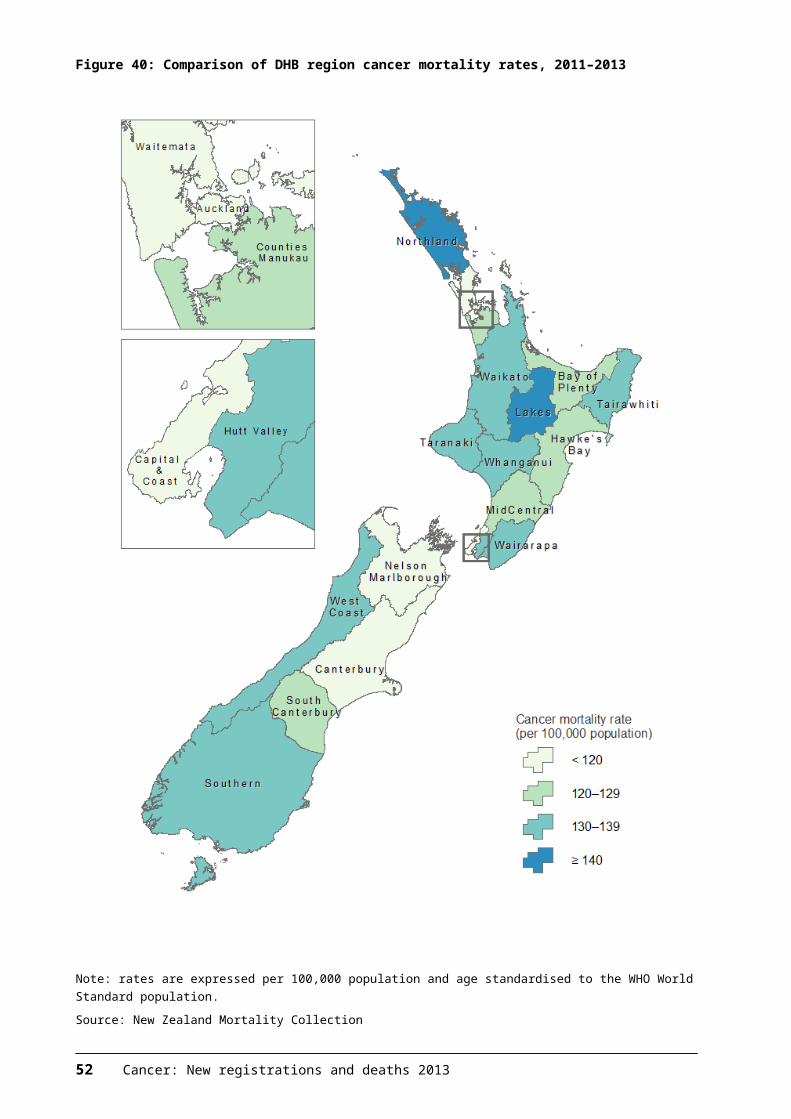
Records includedin NZDep2013
analysis
Records excludedfrom NZDep2013
analysis
Records includedin NZDep2013
analysis
Records excludedfrom NZDep2013
analysis
Male 51.7 55.5 53.0 58.7
Female 48.3 44.5 47.0 41.3
Māori 10.1 7.8 11.1 6.0
Non-Māori 89.9 92.2 89.0 94.1
‘Quintile’ means that across the New Zealand population 20 percent, or one-fifth, of people live in areas of each level of deprivation. Table A4 compares the distribution of NZDep2006 quintiles for the records ‘excluded’ from the deprivation analysis in this report with the distribution of NZDep2013 quintiles for the ‘included’ records. It looks like the ‘included’ NZDep2013 records are less likely to be for people from neighbourhoods with lower levels of deprivation than the ‘excluded’ records.
Table A4: Distribution of deprivation among records included and excluded from deprivation analysis presented in this report, percentages
2013 cancer registrations 2013 cancer deaths
Records includedin NZDep2013
analysis
Records excludedfrom NZDep2013
analysis
Records includedin NZDep2013
analysis
Records excludedfrom NZDep2013
analysis
Quintile 1 17.9 21.2 15.3 23.4
Quintile 2 17.6 38.2 16.0 36.1
Quintile 3 20.2 19.3 20.6 16.3
Quintile 4 22.8 15.8 25.0 21.4
Quintile 5 21.6 5.5 23.1 2.8
Note: records ‘included’ in the deprivation analysis presented in this report use NZDep2013; records ‘excluded’ from the deprivation analysis in this report are presented here using NZDep2006.
The domiciles for which no NZDep2013 quintile has been calculated have been excluded from the population data set used to calculate the deprivation rates presented in this publication.
Note that this method is different from that used in the New Cancer Registrations 2013 tables published online in December 2015. Counts using this current method are included in Cancer Trends 2013.
54 Cancer: New registrations and deaths 2013

Additional information available from the Ministry of HealthCancer: Historical summary 1948–2013The Ministry of Health publishes tables containing numbers and rates of cancer registrations and deaths by sex and year since 1948. The tables only cover selected cancers. Data in this document reflects that published in the Cancer: New registrations and deaths series and is sourced from the New Zealand Cancer Registry and the New Zealand Mortality Collection. See: www.health.govt.nz/nz-health-statistics/health-statistics-and-data-sets/cancer-data-and-stats
Cancer patient survival 1994–2011The Ministry of Health publishes an interactive report on cancer survival for 1994–2011 which presents a broad overview of cancer survival in New Zealand, including survival information for 24 cancers by age, sex, ethnic group, extent of disease and deprivation. To produce this report, survival data was analysed over time to show how one-year and five-year survival changed between 1998 and 2011. This report also presents cumulative relative and interval-specific survival to show survival for up to 10 years after the dates of diagnosis. Data is sourced from the New Zealand Cancer Registry and the New Zealand Mortality Collection. See: www.health.govt.nz/publication/cancer-patient-survival-1994-2011
The Ministry of Health’s Cancer Projections publicationThe Ministry of Health released Cancer Projections: Incidence 2004–08 to 2014–18 in 2010 to report on the estimated future burden of cancer in New Zealand. Like this publication, the Cancer Projections document uses data obtained from the New Zealand Cancer Registry. Cancer registration rates reported in the Cancer Projections publication have not been calculated using the same criteria as those used in this report, and therefore the two documents cannot be compared. See: www.health.govt.nz/publication/cancer-projections-incidence-2004-08-2014-18
If you require additional information, analysis or material not included in this report, or material tabulated in different ways, please contact:
National Collections and ReportingClient Insights and AnalyticsMinistry of HealthPO Box 5013WellingtonNew ZealandPhone: (04) 496 2001Fax: (04) 816 2898Email: [email protected]
Further Ministry of Health publications can be found online at: www.health.govt.nz/nz-health-statistics/publications-data-sets-and-stats
Cancer: New registrations and deaths 2013 55
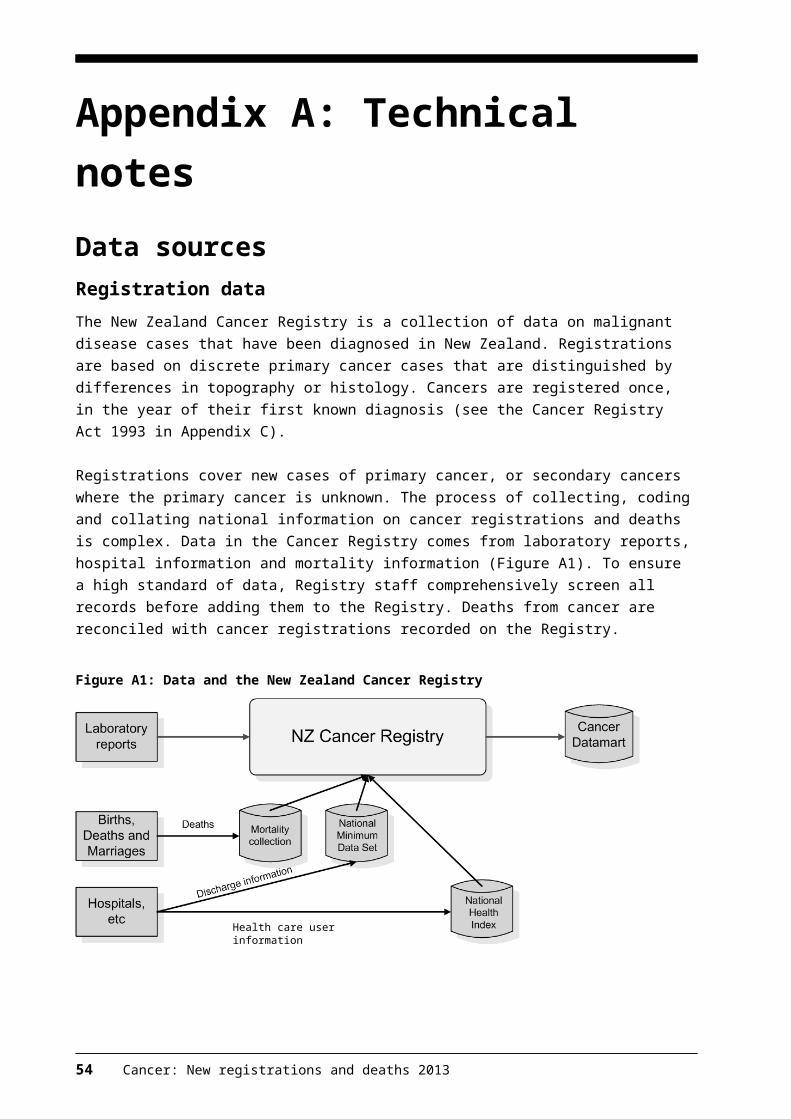
Appendix B: Cancer registrations and deaths data for all cancers, 2013Table B1: Numbers and rates of new cancer cases, by cancer type and sex, 2013
Cancer (ICD code) Number of cases Rate (cases per 100,000)Male Female Total Male Female Total
All cancers (C00–C96, D45–D47) 11,491 10,675 22,166 359.8 315.7 335.5
Lip, oral cavity and pharynx (C00–C14) 270 166 436 9.0 4.7 6.8
Lip (C00) 35 15 50 1.2 0.4 0.8
Tongue – base of (C01) 37 12 49 1.2 0.4 0.8
Tongue – other and unspecified (C02) 46 39 85 1.5 1.1 1.3
Gum (C03) 12 14 26 0.4 0.3 0.4
Mouth – floor of (C04) 9 12 21 0.3 0.3 0.3
Palate (C05) 9 13 22 0.3 0.4 0.3
Mouth – other and unspecified (C06) 23 15 38 0.8 0.4 0.6
Parotid gland (C07) 11 18 29 0.4 0.6 0.5
Major salivary glands – other and unspecified (C08) 4 3 7 0.1 0.1 0.1
Tonsil (C09) 48 9 57 1.6 0.3 0.9
Oropharynx (C10) 11 5 16 0.4 0.1 0.2
Nasopharynx (C11) 12 5 17 0.4 0.2 0.3
Pyriform sinus (C12) 2 2 4 0.1 0.1 0.1
Hypopharynx (C13) 7 3 10 0.2 0.1 0.1
Lip, oral cavity and pharynx – other and ill-defined sites (C14)
4 1 5 0.1 0.0 0.1
Digestive organs (C15–C26) 2687 2215 4902 81.6 57.9 69.0
Oesophagus (C15) 220 94 314 6.5 2.3 4.3
Stomach (C16) 231 140 371 7.2 3.9 5.5
Small intestine (C17) 49 46 95 1.6 1.4 1.5
Colorectum and anus (C18–21) 1622 1453 3075 49.0 37.8 43.1
Colorectum (C18–C20) 1590 1415 3005 48.1 36.7 42.0
Colon (C18) 955 1030 1985 28.4 26.3 27.2
Rectosigmoid junction (C19) 137 102 239 4.2 2.8 3.5
Rectum 498 283 781 15.4 7.6 11.3
Anus (C21) 32 38 70 1.0 1.2 1.1
Liver and intrahepatic bile ducts (C22) 204 85 289 6.5 2.4 4.3
Gallbladder (C23) 28 52 80 0.9 1.4 1.2
Biliary tract – other and unspecified parts (C24) 33 30 63 1.0 0.8 0.9
Pancreas (C25) 257 247 504 7.7 6.3 6.9
Digestive organs – other and ill-defined (C26) 43 68 111 1.3 1.5 1.4
56 Cancer: New registrations and deaths 2013
Table B1 (continued)Cancer (ICD code) Number of cases Rate (cases per 100,000)
Male Female Total Male Female TotalRespiratory system and intrathoracic organs (C30–C39)
1134 1031 2165 33.8 27.9 30.5
Nasal cavity and middle ear (C30) 6 3 9 0.2 0.1 0.2Accessory sinuses (C31) 6 4 10 0.2 0.1 0.2Larynx (C32) 72 9 81 2.2 0.2 1.2Lung (C33–C34) 1032 1005 2037 30.6 27.1 28.5Trachea (C33) 2 1 3 0.1 0.0 0.1Bronchus and lung (C34) 1030 1004 2034 30.5 27 28.4Thymus (C37) 11 4 15 0.4 0.1 0.2Heart, mediastinum and pleura (C38) 7 6 13 0.3 0.2 0.3Respiratory system and intrathoracic organs – other and ill-defined sites (C39)
0 0 0 0.0 0.0 0.0
Bones, joints and articular cartilage (C40–C41) 30 21 51 1.3 0.9 1.1Bone and articular cartilage of limbs (C40) 14 8 22 0.7 0.4 0.5Bone and articular cartilage of other and unspecified sites (C41)
16 13 29 0.7 0.5 0.6
Skin (C43–C44) 1332 1198 2530 42.3 37.3 39.4Melanoma (C43) 1226 1140 2366 39.4 35.8 37.3Skin – other (C44) 106 58 164 3.0 1.5 2.1Mesothelial and soft tissue (C45–C49) 163 95 258 5.3 3.2 4.1Mesothelioma (C45) 82 26 108 2.4 0.7 1.5Kaposi sarcoma (C46) 6 0 6 0.2 0.0 0.1Peripheral nerves and autonomic nervous system (C47)
4 5 9 0.2 0.3 0.2
Retroperitoneum and peritoneum (C48) 11 19 30 0.4 0.6 0.5Other connective and soft tissue (C49) 60 45 105 2.1 1.6 1.8Breast (C50) 26 3020 3046 0.8 94.4 49.6Breast (C50) 26 3020 3046 0.8 94.4 49.6Female genital organs (C51–C58) – 1126 – 35.4 –Vulva (C51) – 56 – 1.5 –Vagina (C52) – 23 – 0.7 –Cervix (C53) – 158 – 6.3 –Uterus (C54–C55) – 542 – 16.8 –Corpus uteri (C54) – 531 – 16.6 –Uterus, part unspecified (C55) – 11 – 0.3 –Ovary (C56) – 290 – 8.5 –Female genital organs – other and unspecified (C57) – 55 – 1.5 –Placenta (C58) – 2 – 0.1 –Male genital organs (C60–C63) 3288 – – 102.7 – –Penis (C60) 19 – – 0.6 – –Prostate (C61) 3129 – – 95.3 – –Testis (C62) 137 – – 6.7 – –Male genital organs – other and unspecified (C63) 3 – – 0.1 – –Urinary tract (C64–C68) 679 296 975 21.0 8.2 14.1Kidney – except renal pelvis (C64) 358 167 525 11.6 5.0 8.1Renal pelvis (C65) 18 15 33 0.6 0.4 0.5Ureter (C66) 19 8 27 0.6 0.2 0.4Bladder (C67) 270 99 369 7.8 2.5 4.9Urinary organs – other and unspecified (C68) 14 7 21 0.4 0.1 0.3
Cancer: New registrations and deaths 2013 57
Table B1 (continued)
Cancer (ICD code) Number of cases Rate (cases per 100,000)Male Female Total Male Female Total
Eye, brain and other parts of the central nervous system (C69–C72)
228 178 406 8.3 6.3 7.2
Eye and adnexa (C69) 36 34 70 1.3 1.2 1.3
Meninges (C70) 2 3 5 0.1 0.1 0.1
Brain (C71) 185 137 322 6.7 4.7 5.7
Spinal cord, cranial nerves and other parts of central nervous system (C72)
5 4 9 0.2 0.2 0.2
Thyroid and other endocrine glands (C73–C75) 97 226 323 3.6 8.8 6.3
Thyroid gland (C73) 85 213 298 3.1 8.2 5.7
Adrenal gland (C74) 10 11 21 0.5 0.5 0.5
Endocrine glands and related structures – other (C75)
2 2 4 0.1 0.1 0.1
Ill-defined, secondary or unspecified sites(C76–C80)
207 228 435 6.1 5.4 5.7
Other and ill-defined sites (C76) 7 11 18 0.2 0.2 0.2
Lymph nodes – secondary and unspecified (C77) 37 30 67 1.2 0.9 1.0
Respiratory and digestive organs – secondary (C78) 97 115 212 2.9 2.7 2.8
Secondary other sites (C79) 51 41 92 1.5 1.0 1.2
Malignant neoplasm without specification of site (C80)
15 31 46 0.4 0.5 0.5
Lymphoid, haematopoietic and related tissue (C81–C96, D45–D47)
1350 875 2225 43.9 25.4 34.0
Hodgkin lymphoma (C81) 66 51 117 2.9 2.3 2.6
Non-Hodgkin lymphoma (C82–C85, C96) 462 327 789 14.8 9.2 11.8
Follicular non-Hodgkin Lymphoma (C82) 87 70 157 2.9 2.0 2.4
Diffuse non-Hodgkin lymphoma (C83) 265 166 431 8.3 4.7 6.4
Peripheral and cutaneous T-cell lymphomas (C84) 39 20 59 1.4 0.6 1.0
Other and unspecified types of non-Hodgkin lymphoma (C85)
66 68 134 2.0 1.7 1.8
Malignant immunoproliferative diseases (C88) 12 3 15 0.4 0.1 0.2
Multiple myeloma and malignant plasma cell neoplasms (C90)
228 128 356 6.9 3.4 5.1
Leukaemia (C91–C95) 395 252 647 13.5 7.6 10.4Lymphoid leukaemia (C91) 205 129 334 7.1 4.1 5.5
Myeloid leukaemia (C92) 135 100 235 4.7 2.9 3.8
Monocytic leukaemia (C93) 12 4 16 0.5 0.2 0.3
Other leukaemia of unspecified cell type (C94) 39 15 54 1.2 0.4 0.7
Leukaemia of unspecified cell type (C95) 4 4 8 0.1 0.1 0.1
Other and unspecified malignant neoplasms of lymphoid, haematopoietic and related tissue (C96)
5 3 8 0.2 0.1 0.2
Polycythaemia vera (D45) 18 8 26 0.6 0.2 0.4
Myelodysplastic syndromes (D46) 130 76 206 3.7 1.8 2.6
Lymphoid, haematopoietic and related tissue – other neoplasms of uncertain or unknown behaviour (D47)
39 30 69 1.1 0.8 1.0
Note: rates are expressed per 100,000 population and age standardised to the WHO World Standard population.Source: New Zealand Cancer Registry
58 Cancer: New registrations and deaths 2013
Table B2: Numbers and rates of new cancer cases, by cancer type and sex, for Māori, 2013
Cancer (ICD code) Number of cases Rate (cases per 100,000)Male Female Total Male Female Total
All cancers (C00–C96, D45–D47) 1008 1212 2220 430 415 418.9Lip, oral cavity and pharynx (C00–C14) 18 9 27 6.6 2.8 4.5Lip (C00) 1 0 1 0.3 0.0 0.2
Tongue – base of (C01) 3 1 4 1.1 0.3 0.7
Tongue – other and unspecified (C02) 1 3 4 0.7 1.0 0.8
Gum (C03) 0 1 1 0.0 0.3 0.1
Mouth – floor of (C04) 1 0 1 0.3 0.0 0.2
Palate (C05) 1 0 1 0.3 0.0 0.2
Mouth – other and unspecified (C06) 0 0 0 0.0 0.0 0.0
Parotid gland (C07) 1 3 4 0.2 0.9 0.6
Major salivary glands – other and unspecified (C08) 0 0 0 0.0 0.0 0.0
Tonsil (C09) 6 0 6 2.0 0.0 0.9
Oropharynx (C10) 0 1 1 0.0 0.3 0.1
Nasopharynx (C11) 1 0 1 0.3 0.0 0.2
Pyriform sinus (C12) 1 0 1 0.3 0.0 0.1
Hypopharynx (C13) 2 0 2 1.0 0.0 0.4
Lip, oral cavity and pharynx – other and ill-defined sites (C14)
0 0 0 0.0 0.0 0.0
Digestive organs (C15–C26) 266 180 446 116 65.3 88.2Oesophagus (C15) 26 7 33 11.5 2.5 6.6
Stomach (C16) 42 38 80 17.0 12.9 14.6
Small intestine (C17) 8 4 12 3.1 1.4 2.2
Colorectum and anus (C18–21) 97 69 166 44.7 25.7 34.3Colorectum (C18–C20) 94 68 162 43.4 25.4 33.6Colon (C18) 50 44 94 24.2 16.4 19.8
Rectosigmoid junction (C19) 9 8 17 3.8 3.1 3.5
Rectum 35 16 51 15.5 5.9 10.2
Anus (C21) 3 1 4 1.3 0.3 0.7
Liver and intrahepatic bile ducts (C22) 51 14 65 19.5 4.7 11.6
Gallbladder (C23) 7 7 14 3.6 2.3 2.7
Biliary tract – other and unspecified parts (C24) 1 6 7 0.5 2.2 1.4
Pancreas (C25) 31 28 59 14.7 10.7 12.5
Digestive organs – other and ill-defined (C26) 3 7 10 1.5 2.8 2.2
Respiratory system and intrathoracic organs (C30–C39)
201 240 441 87.0 86.5 86.2
Nasal cavity and middle ear (C30) 1 0 1 0.3 0.0 0.2
Accessory sinuses (C31) 0 1 1 0.0 0.4 0.2
Larynx (C32) 6 2 8 3.0 0.8 1.8
Lung (C33–C34) 188 233 421 81.5 84.1 82.5Trachea (C33) 1 0 1 0.4 0.0 0.2
Bronchus and lung (C34) 187 233 420 81.1 84.1 82.3
Thymus (C37) 6 1 7 2.1 0.3 1.1
Heart, mediastinum and pleura (C38) 0 3 3 0.0 0.9 0.5
Respiratory system and intrathoracic organs – other and ill-defined sites (C39)
0 0 0 0.0 0.0 0.0
Cancer: New registrations and deaths 2013 59
Table B2 (continued)
Cancer (ICD code) Number of cases Rate (cases per 100,000)Male Female Total Male Female Total
Bones, joints and articular cartilage (C40–C41) 4 5 9 1.1 1.5 1.3Bone and articular cartilage of limbs (C40) 3 1 4 0.7 0.3 0.5
Bone and articular cartilage of other and unspecified sites (C41)
1 4 5 0.4 1.2 0.8
Skin (C43–C44) 17 28 45 6.6 9.1 7.9Melanoma (C43) 16 26 42 6.1 8.4 7.3
Skin – other (C44) 1 2 3 0.5 0.7 0.6
Mesothelial and soft tissue (C45–C49) 7 10 17 2.5 3.6 3.1Mesothelioma (C45) 1 2 3 0.4 0.6 0.5
Kaposi sarcoma (C46) 0 0 0 0.0 0.0 0.0
Peripheral nerves and autonomic nervous system (C47)
0 0 0 0.0 0.0 0.0
Retroperitoneum and peritoneum (C48) 4 2 6 1.4 0.8 1.1
Other connective and soft tissue (C49) 2 6 8 0.7 2.1 1.5
Breast (C50) 1 381 382 0.4 125.4 67.7Breast (C50) 1 381 382 0.4 125.4 67.7
Female genital organs (C51–C58) – 147 – – 48.8 –Vulva (C51) – 7 – – 2.3 –
Vagina (C52) – 6 – – 1.9 –
Cervix (C53) – 39 – – 12.7 –
Uterus (C54–C55) – 70 – – 23.5 –Corpus uteri (C54) – 68 – – 22.6 –
Uterus, part unspecified (C55) – 2 – – 0.9 –
Ovary (C56) – 21 – – 7.1 –
Female genital organs – other and unspecified (C57) – 3 – – 0.9 –
Placenta (C58) – 1 – – 0.3 –
Male genital organs (C60–C63) 239 – – 104.1 – –Penis (C60) 0 – – 0.0 – –
Prostate (C61) 205 – – 91.8 – –
Testis (C62) 34 – – 12.3 – –
Male genital organs – other and unspecified (C63) 0 – – 0.0 – –
Urinary tract (C64–C68) 55 33 88 23.1 11.3 16.6Kidney – except renal pelvis (C64) 38 19 57 14.6 6.0 10.0
Renal pelvis (C65) 0 0 0 0.0 0.0 0.0
Ureter (C66) 1 0 1 0.4 0.0 0.2
Bladder (C67) 15 14 29 7.7 5.3 6.2
Urinary organs – other and unspecified (C68) 1 0 1 0.4 0.0 0.2
Eye, brain and other parts of the central nervous system (C69–C72)
25 17 42 7.1 5.3 6.3
Eye and adnexa (C69) 4 0 4 0.8 0.0 0.4
Meninges (C70) 0 0 0 0.0 0.0 0.0
Brain (C71) 19 17 36 5.9 5.3 5.7
Spinal cord, cranial nerves and other parts of central nervous system (C72)
2 0 2 0.4 0.0 0.2
60 Cancer: New registrations and deaths 2013
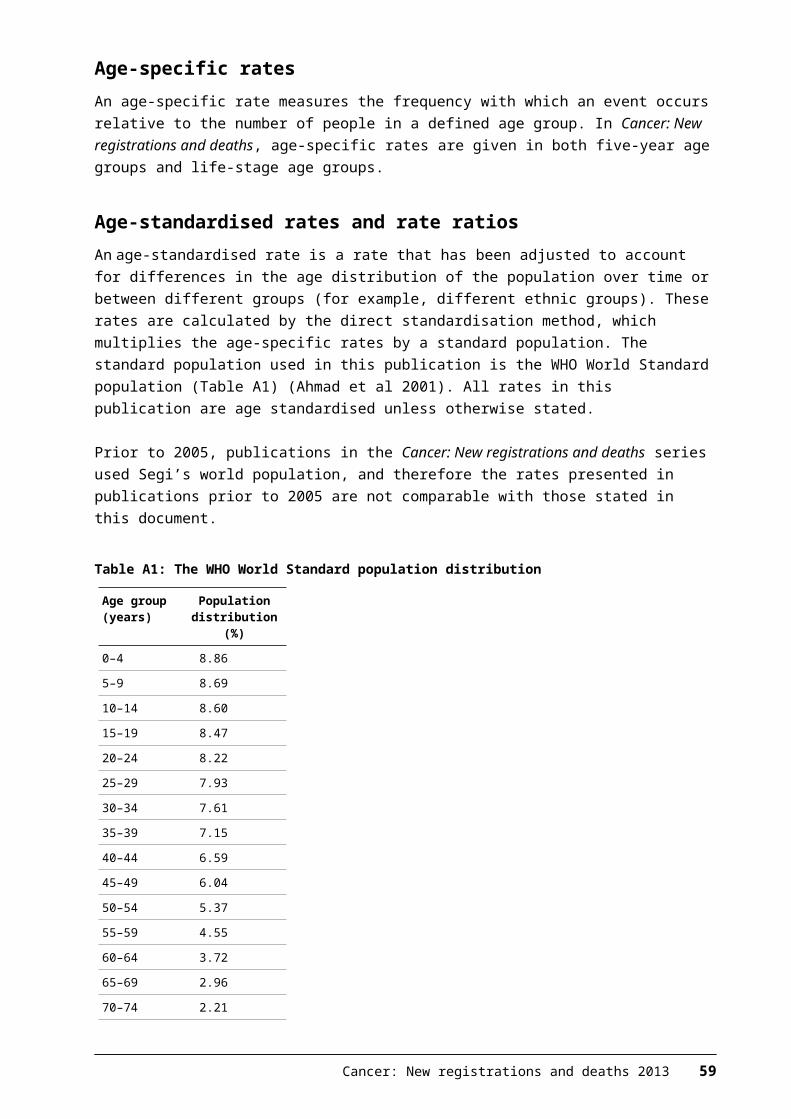
Table B2 (continued)
Cancer (ICD code) Number of cases Rate (cases per 100,000)Male Female Total Male Female Total
Thyroid and other endocrine glands (C73–C75) 16 45 61 5.7 13.8 10.1Thyroid gland (C73) 14 41 55 5.0 12.7 9.2
Adrenal gland (C74) 2 3 5 0.7 0.9 0.8
Endocrine glands and related structures – other (C75)
0 1 1 0.0 0.2 0.1
Ill-defined, secondary or unspecified sites(C76–C80)
25 33 58 10.9 12.2 11.6
Other and ill-defined sites (C76) 2 1 3 1.1 0.3 0.6
Lymph nodes – secondary and unspecified (C77) 1 5 6 0.3 1.6 1.0
Respiratory and digestive organs – secondary (C78) 16 19 35 6.8 6.8 6.9
Secondary other sites (C79) 6 5 11 2.7 2.1 2.3
Malignant neoplasm without specification of site (C80)
0 3 3 0.0 1.4 0.8
Lymphoid, haematopoietic and related tissue (C81–C96, D45–D47)
134 84 218 58.7 29.5 42.2
Hodgkin lymphoma (C81) 5 8 13 1.6 2.3 2.0
Non-Hodgkin lymphoma (C82–C85, C96) 32 18 50 13.4 6.5 9.6Follicular non-Hodgkin Lymphoma (C82) 2 3 5 0.7 1.2 1.0
Diffuse non-Hodgkin lymphoma (C83) 19 10 29 8.3 3.6 5.7
Peripheral and cutaneous T-cell lymphomas (C84) 7 0 7 2.9 0.0 1.3
Other and unspecified types of non-Hodgkin lymphoma (C85)
4 4 8 1.5 1.5 1.5
Malignant immunoproliferative diseases (C88) 0 0 0 0.0 0.0 0.0
Multiple myeloma and malignant plasma cell neoplasms (C90)
25 12 37 11.1 4.7 7.6
Leukaemia (C91–C95) 45 35 80 17.2 11.8 14.2Lymphoid leukaemia (C91) 25 17 42 9.2 5.4 7.0
Myeloid leukaemia (C92) 17 18 35 7.0 6.4 6.7
Monocytic leukaemia (C93) 2 0 2 0.6 0.0 0.3
Other leukaemia of unspecified cell type (C94) 0 0 0 0.0 0.0 0.0
Leukaemia of unspecified cell type (C95) 1 0 1 0.4 0.0 0.2
Other and unspecified malignant neoplasms of lymphoid, haematopoietic and related tissue (C96)
0 1 1 0.0 0.2 0.1
Polycythaemia vera (D45) 5 3 8 2.1 1.1 1.5
Myelodysplastic syndromes (D46) 18 4 22 10.5 1.9 5.5
Lymphoid, haematopoietic and related tissue – other neoplasms of uncertain or unknown behaviour (D47)
4 4 8 2.8 1.4 1.8
Note: rates are expressed per 100,000 population and age standardised to the WHO World Standard population.
Source: New Zealand Cancer Registry
Cancer: New registrations and deaths 2013 61
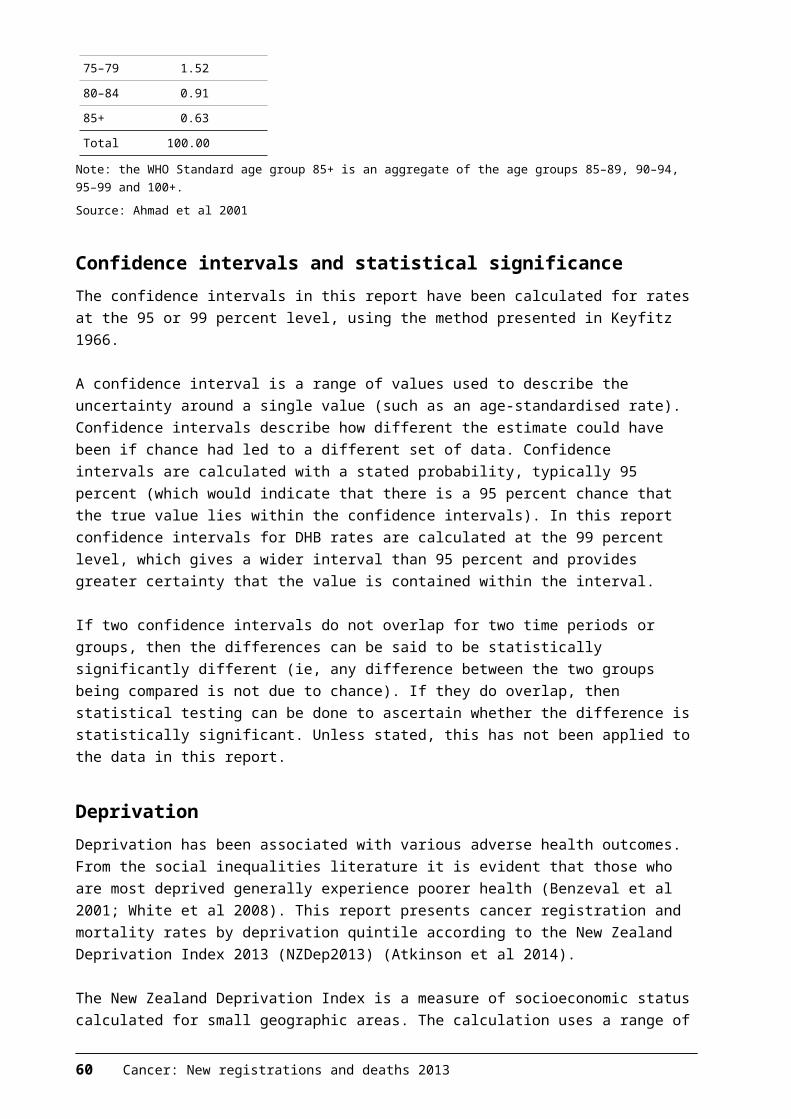
Table B3: Numbers and rates of new cancer cases, by cancer type and sex, for non-Māori, 2013
Cancer (ICD code) Number of cases Rate (cases per 100,000)Male Female Total Male Female Total
All cancers (C00–C96, D45–D47) 10,483 9463 19,946 354.4 306.5 328.2Lip, oral cavity and pharynx (C00–C14) 252 157 409 9.2 4.9 6.9Lip (C00) 34 15 49 1.2 0.4 0.8
Tongue – base of (C01) 34 11 45 1.2 0.4 0.8
Tongue – other and unspecified (C02) 45 36 81 1.7 1.1 1.4
Gum (C03) 12 13 25 0.4 0.3 0.4
Mouth – floor of (C04) 8 12 20 0.3 0.4 0.3
Palate (C05) 8 13 21 0.3 0.4 0.4
Mouth – other and unspecified (C06) 23 15 38 0.9 0.4 0.6
Parotid gland (C07) 10 15 25 0.4 0.5 0.4
Major salivary glands – other and unspecified (C08) 4 3 7 0.2 0.1 0.1
Tonsil (C09) 42 9 51 1.6 0.3 0.9
Oropharynx (C10) 11 4 15 0.4 0.1 0.2
Nasopharynx (C11) 11 5 16 0.4 0.2 0.3
Pyriform sinus (C12) 1 2 3 0.0 0.1 0.0
Hypopharynx (C13) 5 3 8 0.1 0.1 0.1
Lip, oral cavity and pharynx – other and ill-defined sites (C14)
4 1 5 0.1 0.0 0.1
Digestive organs (C15–C26) 2421 2035 4456 78.6 57 67.1Oesophagus (C15) 194 87 281 6.1 2.2 4.1
Stomach (C16) 189 102 291 6.2 2.9 4.4
Small intestine (C17) 41 42 83 1.4 1.5 1.4
Colorectum and anus (C18–21) 1525 1384 2909 49.4 38.9 43.8Colorectum (C18–C20) 1496 1347 2843 48.5 37.6 42.7Colon (C18) 905 986 1891 28.8 26.9 27.8
Rectosigmoid junction (C19) 128 94 222 4.3 2.8 3.5
Rectum 463 267 730 15.4 7.9 11.5
Anus (C21) 29 37 66 0.9 1.2 1.1
Liver and intrahepatic bile ducts (C22) 153 71 224 5.2 2.2 3.6
Gallbladder (C23) 21 45 66 0.7 1.3 1.0
Biliary tract – other and unspecified parts (C24) 32 24 56 1.0 0.6 0.8
Pancreas (C25) 226 219 445 7.2 6.0 6.6
Digestive organs – other and ill-defined (C26) 40 61 101 1.3 1.4 1.4
Respiratory system and intrathoracic organs (C30–C39)
933 791 1724 29.5 22.7 25.7
Nasal cavity and middle ear (C30) 5 3 8 0.2 0.1 0.1
Accessory sinuses (C31) 6 3 9 0.2 0.1 0.1
Larynx (C32) 66 7 73 2.2 0.2 1.1
Lung (C33–C34) 844 772 1616 26.4 22.0 23.9Trachea (C33) 1 1 2 0.0 0.1 0.0
Bronchus and lung (C34) 843 771 1614 26.3 22 23.8
Thymus (C37) 5 3 8 0.1 0.1 0.1
Heart, mediastinum and pleura (C38) 7 3 10 0.4 0.1 0.2
Respiratory system and intrathoracic organs – other and ill-defined sites (C39)
0 0 0 0.0 0.0 0.0
62 Cancer: New registrations and deaths 2013
Table B3 (continued)
Cancer (ICD code) Number of cases Rate (cases per 100,000)Male Female Total Male Female Total
Bones, joints and articular cartilage (C40–C41) 26 16 42 1.4 0.9 1.1Bone and articular cartilage of limbs (C40) 11 7 18 0.6 0.4 0.5
Bone and articular cartilage of other and unspecified sites (C41)
15 9 24 0.8 0.5 0.6
Skin (C43–C44) 1315 1170 2485 45.6 40.6 42.7Melanoma (C43) 1210 1114 2324 42.4 39 40.4
Skin – other (C44) 105 56 161 3.2 1.5 2.2
Mesothelial and soft tissue (C45–C49) 156 85 241 5.6 3.3 4.3Mesothelioma (C45) 81 24 105 2.5 0.7 1.6
Kaposi sarcoma (C46) 6 0 6 0.3 0.0 0.1
Peripheral nerves and autonomic nervous system (C47)
4 5 9 0.2 0.3 0.3
Retroperitoneum and peritoneum (C48) 7 17 24 0.3 0.6 0.5
Other connective and soft tissue (C49) 58 39 97 2.2 1.6 1.9
Breast (C50) 25 2639 2664 0.8 91.3 47.9Breast (C50) 25 2639 2664 0.8 91.3 47.9
Female genital organs (C51–C58) – 979 – – 33.9 –Vulva (C51) – 49 – – 1.4 –
Vagina (C52) – 17 – – 0.6 –
Cervix (C53) – 119 – – 5.6 –
Uterus (C54–C55) – 472 – – 16.1 –Corpus uteri (C54) – 463 – – 15.9 –
Uterus, part unspecified (C55) – 9 – – 0.2 –
Ovary (C56) – 269 – – 8.7 –
Female genital organs – other and unspecified (C57) – 52 – – 1.5 –
Placenta (C58) – 1 – – 0.0 –
Male genital organs (C60–C63) 3049 – – 102.8 – –Penis (C60) 19 – – 0.6 – –
Prostate (C61) 2924 – – 96.3 – –
Testis (C62) 103 – – 5.8 – –
Male genital organs – other and unspecified (C63) 3 – – 0.1 – –
Urinary tract (C64–C68) 624 263 887 20.7 7.9 13.9Kidney – except renal pelvis (C64) 320 148 468 11.3 4.8 7.9
Renal pelvis (C65) 18 15 33 0.6 0.4 0.5
Ureter (C66) 18 8 26 0.6 0.2 0.4
Bladder (C67) 255 85 340 7.8 2.2 4.8
Urinary organs – other and unspecified (C68) 13 7 20 0.4 0.1 0.3
Eye, brain and other parts of the central nervous system (C69–C72)
203 161 364 8.0 6.5 7.2
Eye and adnexa (C69) 32 34 66 1.2 1.5 1.3
Meninges (C70) 2 3 5 0.1 0.2 0.1
Brain (C71) 166 120 286 6.7 4.6 5.6
Spinal cord, cranial nerves and other parts of central nervous system (C72)
3 4 7 0.1 0.2 0.2
Cancer: New registrations and deaths 2013 63
Table B3 (continued)
Cancer (ICD code) Number of cases Rate (cases per 100,000)Male Female Total Male Female Total
Thyroid and other endocrine glands (C73–C75) 81 181 262 3.4 8.0 5.8Thyroid gland (C73) 71 172 243 2.8 7.5 5.2
Adrenal gland (C74) 8 8 16 0.5 0.4 0.5
Endocrine glands and related structures – other (C75)
2 1 3 0.1 0.1 0.1
Ill-defined, secondary or unspecified sites(C76–C80)
182 195 377 5.7 4.7 5.2
Other and ill-defined sites (C76) 5 10 15 0.2 0.2 0.2
Lymph nodes – secondary and unspecified (C77) 36 25 61 1.2 0.8 1.0
Respiratory and digestive organs – secondary (C78) 81 96 177 2.5 2.3 2.4
Secondary other sites (C79) 45 36 81 1.4 0.9 1.1
Malignant neoplasm without specification of site (C80)
15 28 43 0.4 0.5 0.5
Lymphoid, haematopoietic and related tissue (C81–C96, D45–D47)
1216 791 2007 43.1 25 33.5
Hodgkin lymphoma (C81) 61 43 104 3.1 2.3 2.7
Non-Hodgkin lymphoma (C82–C85, C96) 430 309 739 15.0 9.4 12.0
Follicular non-Hodgkin Lymphoma (C82) 85 67 152 3.1 2.1 2.6
Diffuse non-Hodgkin lymphoma (C83) 246 156 402 8.4 4.9 6.5
Peripheral and cutaneous T-cell lymphomas (C84) 32 20 52 1.3 0.7 1.0
Other and unspecified types of non-Hodgkin lymphoma (C85)
62 64 126 2.0 1.7 1.9
Malignant immunoproliferative diseases (C88) 12 3 15 0.4 0.1 0.2
Multiple myeloma and malignant plasma cell neoplasms (C90)
203 116 319 6.7 3.3 4.9
Leukaemia (C91–C95) 350 217 567 13.1 7.1 10.0Lymphoid leukaemia (C91) 180 112 292 6.8 3.8 5.3
Myeloid leukaemia (C92) 118 82 200 4.5 2.6 3.5
Monocytic leukaemia (C93) 10 4 14 0.4 0.2 0.3
Other leukaemia of unspecified cell type (C94) 39 15 54 1.3 0.4 0.8
Leukaemia of unspecified cell type (C95) 3 4 7 0.1 0.1 0.1
Other and unspecified malignant neoplasms of lymphoid, haematopoietic and related tissue (C96)
5 2 7 0.2 0.1 0.2
Polycythaemia vera (D45) 13 5 18 0.4 0.1 0.2
Myelodysplastic syndromes (D46) 112 72 184 3.3 1.9 2.5
Lymphoid, haematopoietic and related tissue – other neoplasms of uncertain or unknown behaviour (D47)
35 26 61 1.1 0.7 0.9
Note: rates are expressed per 100,000 population and age standardised to the WHO World Standard population.
Source: New Zealand Cancer Registry
64 Cancer: New registrations and deaths 2013
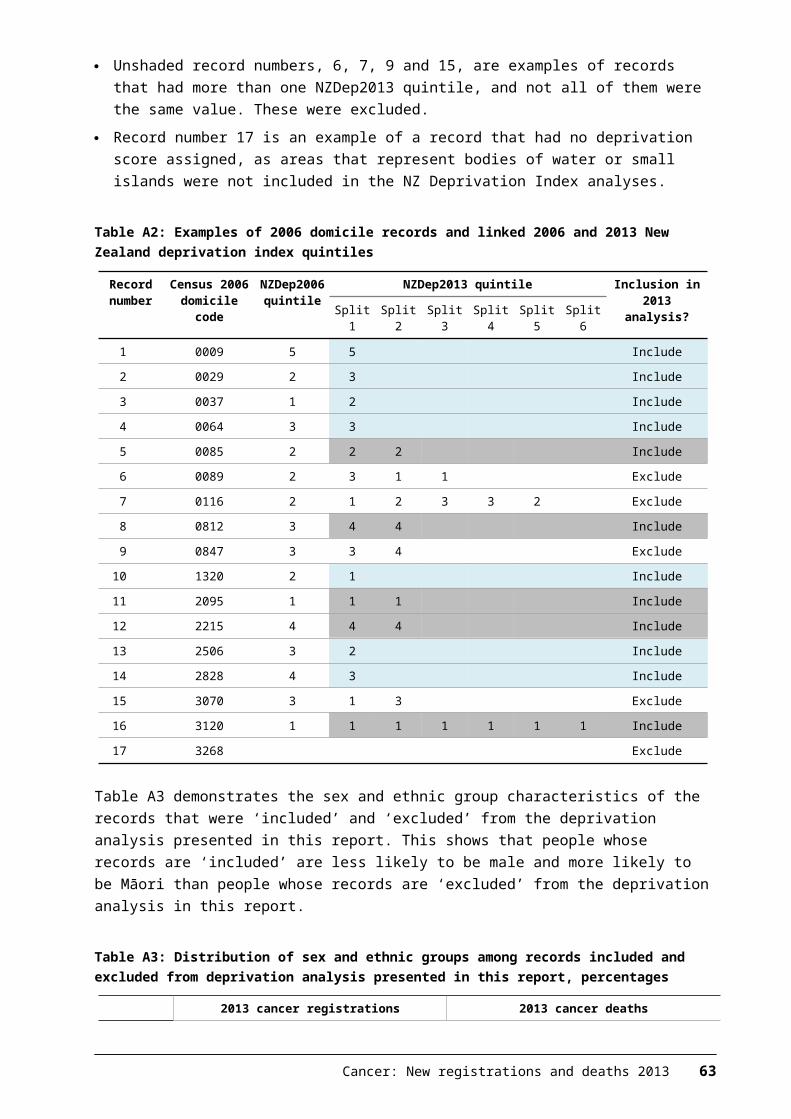
Table B4: Numbers and rates of cancer deaths, by cancer type and sex, 2013
Cancer (ICD code) Number of deaths Rate (deaths per 100,000)Male Female Total Male Female Total
All cancers (C00–C96, D45–D47) 4821 4242 9063 141.3 108.5 122.8Lip, oral cavity and pharynx (C00–C14) 87 49 136 2.7 1.2 1.9Lip (C00) 2 2 4 0.1 0.1 0.1
Tongue – base of (C01) 11 2 13 0.3 0.0 0.2
Tongue – other and unspecified (C02) 15 12 27 0.5 0.3 0.4
Gum (C03) 5 6 11 0.1 0.1 0.1
Mouth – floor of (C04) 4 2 6 0.1 0.1 0.1
Palate (C05) 4 2 6 0.1 0.1 0.1
Mouth – other and unspecified (C06) 8 6 14 0.2 0.1 0.2
Parotid gland (C07) 10 2 12 0.3 0.0 0.2
Major salivary glands – other and unspecified (C08) 1 2 3 0.0 0.1 0.1
Tonsil (C09) 9 3 12 0.3 0.1 0.2
Oropharynx (C10) 4 2 6 0.1 0.0 0.1
Nasopharynx (C11) 7 4 11 0.2 0.1 0.2
Pyriform sinus (C12) 1 1 2 0.0 0.0 0.0
Hypopharynx (C13) 3 0 3 0.1 0.0 0.0
Lip, oral cavity and pharynx – other and ill-defined sites (C14)
3 3 6 0.1 0.1 0.1
Digestive organs (C15–C26) 1502 1245 2747 44.4 30.5 36.9Oesophagus (C15) 170 79 249 4.9 1.8 3.3
Stomach (C16) 177 105 282 5.3 2.8 3.9
Small intestine (C17) 25 23 48 0.8 0.6 0.7
Colorectum and anus (C18–21) 659 593 1252 19.1 14.3 16.5Colorectum (C18–C20) 644 579 1223 18.7 14.0 16.1Colon (C18) 372 430 802 10.7 10.3 10.4
Rectosigmoid junction (C19) 58 50 108 1.7 1.3 1.5
Rectum 214 99 313 6.3 2.4 4.2
Anus (C21) 15 14 29 0.4 0.3 0.4
Liver and intrahepatic bile ducts (C22) 177 75 252 5.5 1.9 3.6
Gallbladder (C23) 11 35 46 0.3 0.9 0.6
Biliary tract – other and unspecified parts (C24) 15 24 39 0.5 0.6 0.5
Pancreas (C25) 215 248 463 6.5 6.1 6.3
Digestive organs – other and ill-defined (C26) 53 63 116 1.6 1.4 1.5
Respiratory system and intrathoracic organs (C30–C39)
911 810 1721 26.7 21.2 23.7
Nasal cavity and middle ear (C30) 4 3 7 0.1 0.1 0.1
Accessory sinuses (C31) 1 4 5 0.0 0.2 0.1
Larynx (C32) 26 6 32 0.8 0.1 0.4
Lung (C33–C34) 864 792 1656 25.3 20.7 22.7Trachea (C33) 1 0 1 0.0 0.0 0.0
Bronchus and lung (C34) 863 792 1655 25.3 20.7 22.7
Thymus (C37) 7 4 11 0.3 0.1 0.2
Heart, mediastinum and pleura (C38) 6 1 7 0.2 0.0 0.1
Respiratory system and intrathoracic organs – other and ill-defined sites (C39)
3 0 3 0.1 0.0 0.0
Cancer: New registrations and deaths 2013 65
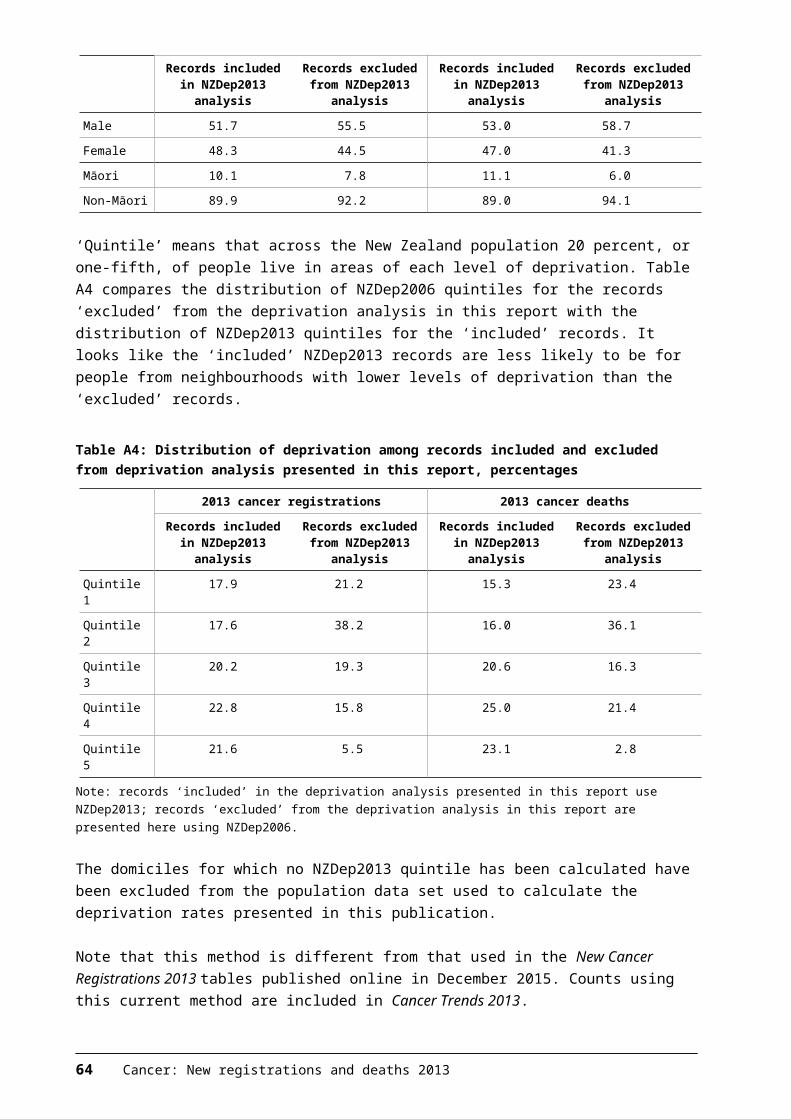
Table B4 (continued)
Cancer (ICD code) Number of deaths Rate (deaths per 100,000)Male Female Total Male Female Total
Bones, joints and articular cartilage (C40–C41) 17 11 28 0.7 0.4 0.6Bone and articular cartilage of limbs (C40) 7 2 9 0.3 0.1 0.2
Bone and articular cartilage of other and unspecified sites (C41)
10 9 19 0.4 0.3 0.4
Skin (C43–C44) 320 169 489 9.3 3.9 6.4Melanoma (C43) 232 124 356 6.9 3.1 4.9
Skin – other (C44) 88 45 133 2.4 0.8 1.5
Mesothelial and soft tissue (C45–C49) 101 50 151 3.0 1.4 2.1Mesothelioma (C45) 72 18 90 2.1 0.5 1.2
Kaposi sarcoma (C46) 0 0 0 0.0 0.0 0.0
Peripheral nerves and autonomic nervous system (C47)
0 1 1 0.0 0.0 0.0
Retroperitoneum and peritoneum (C48) 8 12 20 0.3 0.3 0.3
Other connective and soft tissue (C49) 21 19 40 0.7 0.6 0.6
Breast (C50) 8 633 641 0.2 17.7 9.5Breast (C50) 8 633 641 0.2 17.7 9.5
Female genital organs (C51–C58) – 399 – – 10.6 –Vulva (C51) – 16 – – 0.4 –
Vagina (C52) – 5 – – 0.1 –
Cervix (C53) – 54 – – 1.7 –
Uterus (C54–C55) – 122 – – 3.2 –Corpus uteri (C54) – 112 – – 2.9 –
Uterus, part unspecified (C55) – 10 – – 0.2 –
Ovary (C56) – 178 – – 4.6 –
Female genital organs – other and unspecified (C57) – 24 – – 0.6 –
Placenta (C58) – 0 – – 0.0 –
Male genital organs (C60–C63) 654 – – 17.7 – –Penis (C60) 1 – – 0.0 – –
Prostate (C61) 647 – – 17.4 – –
Testis (C62) 6 – – 0.3 – –
Male genital organs – other and unspecified (C63) 0 – – 0.0 – –
Urinary tract (C64–C68) 280 143 423 8.1 3.5 5.5Kidney – except renal pelvis (C64) 130 76 206 3.9 2.0 2.8
Renal pelvis (C65) 12 5 17 0.4 0.1 0.2
Ureter (C66) 6 4 10 0.2 0.1 0.1
Bladder (C67) 126 54 180 3.5 1.2 2.2
Urinary organs – other and unspecified (C68) 6 4 10 0.2 0.1 0.1
Eye, brain and other parts of the central nervous system (C69–C72)
154 127 281 5.3 3.9 4.5
Eye and adnexa (C69) 6 9 15 0.2 0.2 0.2
Meninges (C70) 0 2 2 0.0 0.1 0.0
Brain (C71) 146 116 262 5.1 3.6 4.3
Spinal cord, cranial nerves and other parts of central nervous system (C72)
2 0 2 0.1 0.0 0.0
66 Cancer: New registrations and deaths 2013

Table B4 (continued)
Cancer (ICD code) Number of deaths Rate (deaths per 100,000)Male Female Total Male Female Total
Thyroid and other endocrine glands (C73–C75) 19 16 35 0.7 0.5 0.6Thyroid gland (C73) 11 11 22 0.4 0.3 0.3
Adrenal gland (C74) 6 4 10 0.2 0.1 0.2
Endocrine glands and related structures – other (C75)
2 1 3 0.1 0.1 0.1
Ill-defined, secondary or unspecified sites(C76–C80)
189 203 392 5.4 4.5 4.9
Other and ill-defined sites (C76) 6 9 15 0.2 0.2 0.2
Lymph nodes – secondary and unspecified (C77) 0 0 0 0.0 0.0 0.0
Respiratory and digestive organs – secondary (C78) 0 0 0 0.0 0.0 0.0
Secondary other sites (C79) 0 0 0 0.0 0.0 0.0
Malignant neoplasm without specification of site (C80)
183 194 377 5.2 4.3 4.7
Lymphoid, haematopoietic and related tissue (C81–C96, D45–D47)
579 387 966 17.0 9.2 12.7
Hodgkin lymphoma (C81) 18 7 25 0.6 0.2 0.4
Non-Hodgkin lymphoma (C82–C85, C96) 196 121 317 5.8 2.9 4.2Follicular non-Hodgkin Lymphoma (C82) 21 12 33 0.6 0.3 0.4
Diffuse non-Hodgkin lymphoma (C83) 125 67 192 3.7 1.7 2.6
Peripheral and cutaneous T-cell lymphomas (C84) 16 8 24 0.5 0.3 0.4
Other and unspecified types of non-Hodgkin lymphoma (C85)
31 34 65 0.9 0.7 0.8
Malignant immunoproliferative diseases (C88) 3 2 5 0.1 0.0 0.1
Multiple myeloma and malignant plasma cell neoplasms (C90)
90 84 174 2.6 2.0 2.3
Leukaemia (C91–C95) 190 126 316 5.7 3.2 4.4Lymphoid leukaemia (C91) 65 46 111 1.9 1.0 1.4
Myeloid leukaemia (C92) 92 60 152 2.8 1.6 2.1
Monocytic leukaemia (C93) 12 3 15 0.4 0.1 0.3
Other leukaemia of unspecified cell type (C94) 17 10 27 0.5 0.3 0.4
Leukaemia of unspecified cell type (C95) 4 7 11 0.1 0.1 0.1
Other and unspecified malignant neoplasms of lymphoid, haematopoietic and related tissue (C96)
3 0 3 0.1 0.0 0.0
Polycythaemia vera (D45) 4 3 7 0.1 0.1 0.1
Myelodysplastic syndromes (D46) 56 22 78 1.5 0.4 0.9
Lymphoid, haematopoietic and related tissue – other neoplasms of uncertain or unknown behaviour (D47)
22 22 44 0.6 0.4 0.5
Note: rates are expressed per 100,000 population and age standardised to the WHO World Standard population.
Source: New Zealand Mortality Collection
Cancer: New registrations and deaths 2013 67
Table B5: Numbers and rates of cancer deaths, by cancer type and sex, for Māori, 2013
Cancer (ICD code) Number of deaths Rate (deaths per 100,000)Male Female Total Male Female Total
All cancers (C00–C96, D45–D47) 459 530 989 208.5 191.7 197.9Lip, oral cavity and pharynx (C00–C14) 5 3 8 1.7 0.9 1.3Lip (C00) 0 0 0 0.0 0.0 0.0
Tongue – base of (C01) 1 0 1 0.4 0.0 0.2
Tongue – other and unspecified (C02) 0 0 0 0.0 0.0 0.0
Gum (C03) 0 0 0 0.0 0.0 0.0
Mouth – floor of (C04) 0 0 0 0.0 0.0 0.0
Palate (C05) 0 0 0 0.0 0.0 0.0
Mouth – other and unspecified (C06) 0 1 1 0.0 0.3 0.2
Parotid gland (C07) 0 0 0 0.0 0.0 0.0
Major salivary glands – other and unspecified (C08) 0 1 1 0.0 0.3 0.2
Tonsil (C09) 1 1 2 0.3 0.3 0.3
Oropharynx (C10) 2 0 2 0.7 0.0 0.3
Nasopharynx (C11) 0 0 0 0.0 0.0 0.0
Pyriform sinus (C12) 0 0 0 0.0 0.0 0.0
Hypopharynx (C13) 0 0 0 0.0 0.0 0.0
Lip, oral cavity and pharynx – other and ill-defined sites (C14)
1 0 1 0.3 0.0 0.1
Digestive organs (C15–C26) 155 111 266 68.0 42.5 54.4Oesophagus (C15) 15 1 16 6.9 0.4 3.3
Stomach (C16) 35 22 57 15.9 8.0 11.4
Small intestine (C17) 4 2 6 1.5 0.7 1.1
Colorectum and anus (C18–21) 38 34 72 16.8 13.2 15.1Colorectum (C18–C20) 37 32 69 16.4 12.6 14.6Colon (C18) 18 24 42 8.0 9.2 8.8
Rectosigmoid junction (C19) 4 4 8 1.5 1.6 1.7
Rectum 15 4 19 6.8 1.8 4.0
Anus (C21) 1 2 3 0.4 0.6 0.5
Liver and intrahepatic bile ducts (C22) 37 13 50 14.6 5.1 9.5
Gallbladder (C23) 3 6 9 2.1 2.1 2.0
Biliary tract – other and unspecified parts (C24) 0 4 4 0.0 1.6 0.9
Pancreas (C25) 19 27 46 8.5 10.8 10.0
Digestive organs – other and ill-defined (C26) 4 2 6 1.7 0.8 1.2
Respiratory system and intrathoracic organs (C30–C39)
134 171 305 60.3 62.7 61.1
Nasal cavity and middle ear (C30) 0 1 1 0.0 0.3 0.1
Accessory sinuses (C31) 0 1 1 0.0 0.4 0.2
Larynx (C32) 1 0 1 0.4 0.0 0.2
Lung (C33–C34) 131 168 299 59.2 61.6 60Trachea (C33) 0 0 0 0.0 0.0 0.0
Bronchus and lung (C34) 131 168 299 59.2 61.6 60
Thymus (C37) 2 1 3 0.8 0.4 0.6
Heart, mediastinum and pleura (C38) 0 0 0 0.0 0.0 0.0
Respiratory system and intrathoracic organs – other and ill-defined sites (C39)
0 0 0 0.0 0.0 0.0
68 Cancer: New registrations and deaths 2013
Table B5 (continued)
Cancer (ICD code) Number of deaths Rate (deaths per 100,000)Male Female Total Male Female Total
Bones, joints and articular cartilage (C40–C41) 3 3 6 1.2 0.9 1.1Bone and articular cartilage of limbs (C40) 1 0 1 0.4 0.0 0.2
Bone and articular cartilage of other and unspecified sites (C41)
2 3 5 0.8 0.9 0.9
Skin (C43–C44) 6 4 10 2.5 1.3 1.8Melanoma (C43) 5 4 9 1.9 1.3 1.5
Skin – other (C44) 1 0 1 0.7 0.0 0.3
Mesothelial and soft tissue (C45–C49) 6 5 11 2.9 1.6 2.1Mesothelioma (C45) 1 1 2 0.4 0.3 0.3
Kaposi sarcoma (C46) 0 0 0 0.0 0.0 0.0
Peripheral nerves and autonomic nervous system (C47)
0 0 0 0.0 0.0 0.0
Retroperitoneum and peritoneum (C48) 1 0 1 0.3 0.0 0.2
Other connective and soft tissue (C49) 4 4 8 2.2 1.3 1.6
Breast (C50) 2 93 95 0.8 30.9 17Breast (C50) 2 93 95 0.8 30.9 17
Female genital organs (C51–C58) – 46 – – 16.0 –Vulva (C51) – 2 – – 0.8 –
Vagina (C52) – 1 – – 0.5 –
Cervix (C53) – 12 – – 4.0 –
Uterus (C54–C55) – 13 – – 4.8 –Corpus uteri (C54) – 12 – – 4.4 –
Uterus, part unspecified (C55) – 1 – – 0.5 –
Ovary (C56) – 14 – – 4.5 –
Female genital organs – other and unspecified (C57) – 4 – – 1.4 –
Placenta (C58) – 0 – – 0.0 –
Male genital organs (C60–C63) 41 – – 25.1 – –Penis (C60) 0 – – 0.0 – –
Prostate (C61) 41 – – 25.1 – –
Testis (C62) 0 – – 0.0 – –
Male genital organs – other and unspecified (C63) 0 – – 0.0 – –
Urinary tract (C64–C68) 20 12 32 8.5 4.6 6.5Kidney – except renal pelvis (C64) 16 5 21 6.5 1.7 4
Renal pelvis (C65) 0 0 0 0.0 0.0 0.0
Ureter (C66) 0 0 0 0.0 0.0 0.0
Bladder (C67) 4 7 11 1.9 2.9 2.5
Urinary organs – other and unspecified (C68) 0 0 0 0.0 0.0 0.0
Eye, brain and other parts of the central nervous system (C69–C72)
15 11 26 5.4 3.7 4.5
Eye and adnexa (C69) 1 0 1 0.4 0.0 0.2
Meninges (C70) 0 1 1 0.0 0.4 0.2
Brain (C71) 14 10 24 4.9 3.3 4.1
Spinal cord, cranial nerves and other parts of central nervous system (C72)
0 0 0 0.0 0.0 0.0
Cancer: New registrations and deaths 2013 69
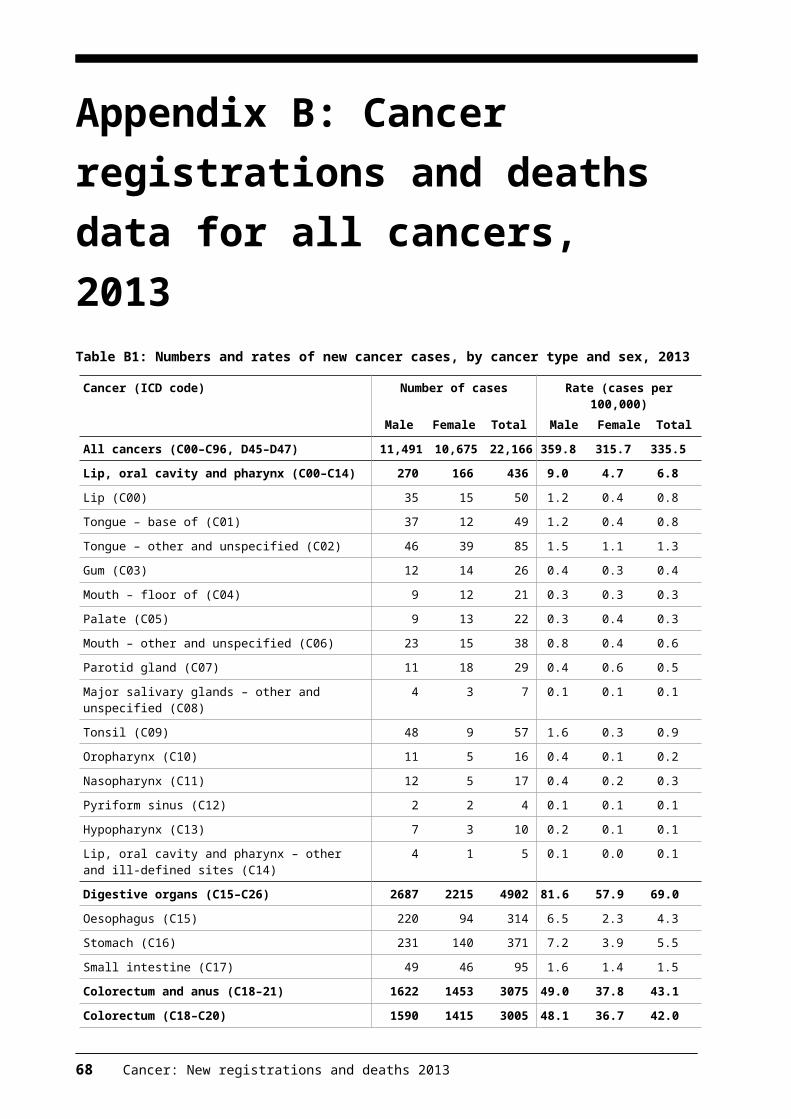
Table B5 (continued)
Cancer (ICD code) Number of deaths Rate (deaths per 100,000)Male Female Total Male Female Total
Thyroid and other endocrine glands (C73–C75) 3 1 4 1.0 0.3 0.7Thyroid gland (C73) 2 0 2 0.6 0.0 0.3
Adrenal gland (C74) 1 1 2 0.4 0.3 0.4
Endocrine glands and related structures – other (C75)
0 0 0 0.0 0.0 0.0
Ill-defined, secondary or unspecified sites(C76–C80)
18 32 50 8.3 12.3 10.6
Other and ill-defined sites (C76) 1 1 2 0.4 0.4 0.4
Lymph nodes – secondary and unspecified (C77) 0 0 0 0.0 0.0 0.0
Respiratory and digestive organs – secondary (C78) 0 0 0 0.0 0.0 0.0
Secondary other sites (C79) 0 0 0 0.0 0.0 0.0
Malignant neoplasm without specification of site (C80)
17 31 48 7.9 11.8 10.2
Lymphoid, haematopoietic and related tissue (C81–C96, D45–D47)
51 38 89 22.7 14.0 17.8
Hodgkin lymphoma (C81) 2 0 2 0.7 0.0 0.4
Non-Hodgkin lymphoma (C82–C85, C96) 13 10 23 5.4 3.6 4.4Follicular non-Hodgkin Lymphoma (C82) 1 1 2 1.0 0.5 0.6
Diffuse non-Hodgkin lymphoma (C83) 11 7 18 4.0 2.5 3.2
Peripheral and cutaneous T-cell lymphomas (C84) 1 1 2 0.3 0.3 0.3
Other and unspecified types of non-Hodgkin lymphoma (C85)
0 1 1 0.0 0.4 0.2
Malignant immunoproliferative diseases (C88) 0 0 0 0.0 0.0 0.0
Multiple myeloma and malignant plasma cell neoplasms (C90)
7 11 18 3.1 3.8 3.4
Leukaemia (C91–C95) 23 13 36 10.6 4.8 7.3Lymphoid leukaemia (C91) 9 6 15 4.7 2.1 3.1
Myeloid leukaemia (C92) 11 7 18 4.9 2.8 3.7
Monocytic leukaemia (C93) 2 0 2 0.7 0.0 0.3
Other leukaemia of unspecified cell type (C94) 1 0 1 0.4 0.0 0.2
Leukaemia of unspecified cell type (C95) 0 0 0 0.0 0.0 0.0
Other and unspecified malignant neoplasms of lymphoid, haematopoietic and related tissue (C96)
0 0 0 0.0 0.0 0.0
Polycythaemia vera (D45) 0 1 1 0.0 0.5 0.3
Myelodysplastic syndromes (D46) 5 2 7 2.4 0.9 1.6
Lymphoid, haematopoietic and related tissue – other neoplasms of uncertain or unknown behaviour (D47)
1 1 2 0.6 0.4 0.4
Note: rates are expressed per 100,000 population and age standardised to the WHO World Standard population.
Source: New Zealand Mortality Collection
70 Cancer: New registrations and deaths 2013
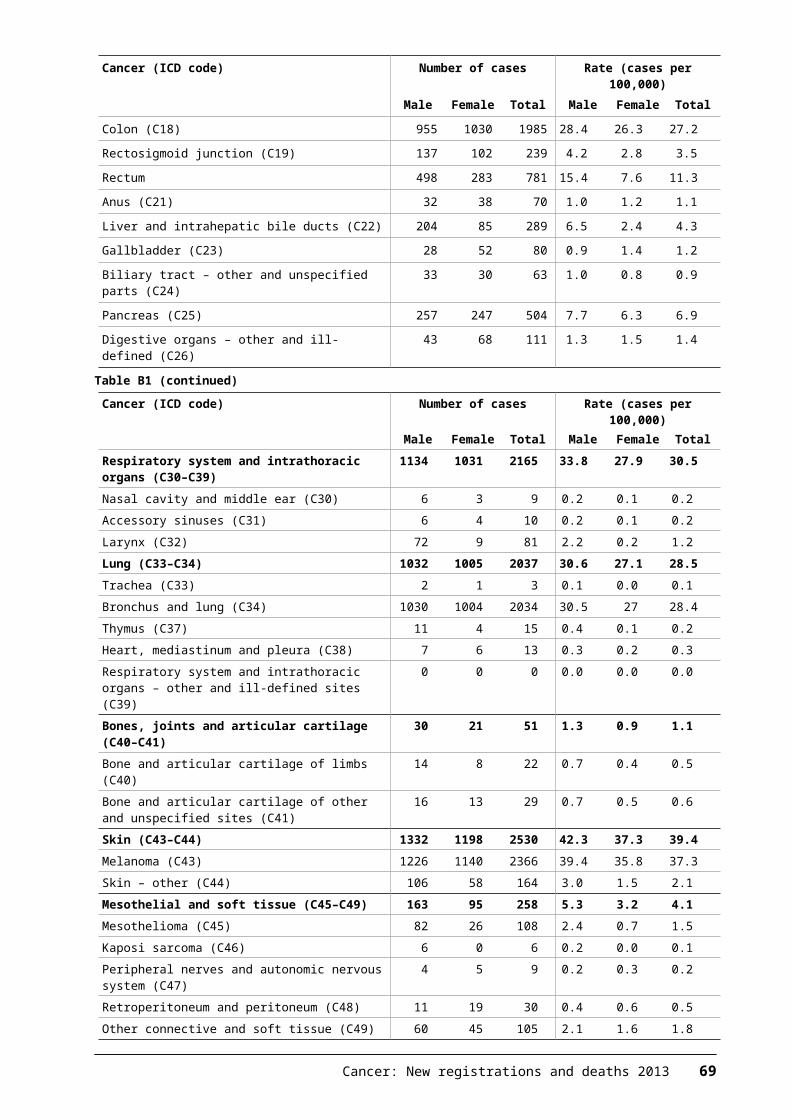
Table B6: Numbers and rates of cancer deaths, by cancer type and sex, for non-Māori, 2013
Cancer (ICD code) Number of deaths Rate (deaths per 100,000)Male Female Total Male Female Total
All cancers (C00–C96, D45–D47) 4362 3712 8074 135.6 100.7 116.0Lip, oral cavity and pharynx (C00–C14) 82 46 128 2.7 1.2 1.9Lip (C00) 2 2 4 0.1 0.1 0.1
Tongue – base of (C01) 10 2 12 0.3 0.0 0.2
Tongue – other and unspecified (C02) 15 12 27 0.5 0.3 0.4
Gum (C03) 5 6 11 0.2 0.1 0.1
Mouth – floor of (C04) 4 2 6 0.1 0.1 0.1
Palate (C05) 4 2 6 0.1 0.1 0.1
Mouth – other and unspecified (C06) 8 5 13 0.2 0.1 0.1
Parotid gland (C07) 10 2 12 0.3 0.0 0.2
Major salivary glands – other and unspecified (C08) 1 1 2 0.0 0.0 0.0
Tonsil (C09) 8 2 10 0.3 0.1 0.2
Oropharynx (C10) 2 2 4 0.1 0.0 0.1
Nasopharynx (C11) 7 4 11 0.3 0.2 0.2
Pyriform sinus (C12) 1 1 2 0.0 0.0 0.0
Hypopharynx (C13) 3 0 3 0.1 0.0 0.0
Lip, oral cavity and pharynx – other and ill-defined sites (C14)
2 3 5 0.1 0.1 0.1
Digestive organs (C15–C26) 1347 1134 2481 42.3 29.5 35.4Oesophagus (C15) 155 78 233 4.8 1.9 3.2
Stomach (C16) 142 83 225 4.4 2.3 3.3
Small intestine (C17) 21 21 42 0.7 0.6 0.6
Colorectum and anus (C18–21) 621 559 1180 19.2 14.5 16.6Colorectum (C18–C20) 607 547 1154 18.8 14.2 16.3Colon (C18) 354 406 760 10.8 10.3 10.5
Rectosigmoid junction (C19) 54 46 100 1.7 1.3 1.5
Rectum 199 95 294 6.2 2.6 4.2
Anus (C21) 14 12 26 0.4 0.3 0.3
Liver and intrahepatic bile ducts (C22) 140 62 202 4.6 1.6 3.0
Gallbladder (C23) 8 29 37 0.2 0.8 0.5
Biliary tract – other and unspecified parts (C24) 15 20 35 0.5 0.5 0.5
Pancreas (C25) 196 221 417 6.3 5.8 6.1
Digestive organs – other and ill-defined (C26) 49 61 110 1.5 1.4 1.5
Respiratory system and intrathoracic organs (C30–C39)
777 639 1416 24.2 17.6 20.6
Nasal cavity and middle ear (C30) 4 2 6 0.1 0.1 0.1
Accessory sinuses (C31) 1 3 4 0.0 0.1 0.1
Larynx (C32) 25 6 31 0.8 0.2 0.5
Lung (C33–C34) 733 624 1357 22.7 17.2 19.7Trachea (C33) 1 0 1 0.0 0.0 0.0
Bronchus and lung (C34) 732 624 1356 22.7 17.2 19.7
Thymus (C37) 5 3 8 0.2 0.0 0.1
Heart, mediastinum and pleura (C38) 6 1 7 0.2 0.0 0.1
Respiratory system and intrathoracic organs – other and ill-defined sites (C39)
3 0 3 0.1 0.0 0.0
Cancer: New registrations and deaths 2013 71
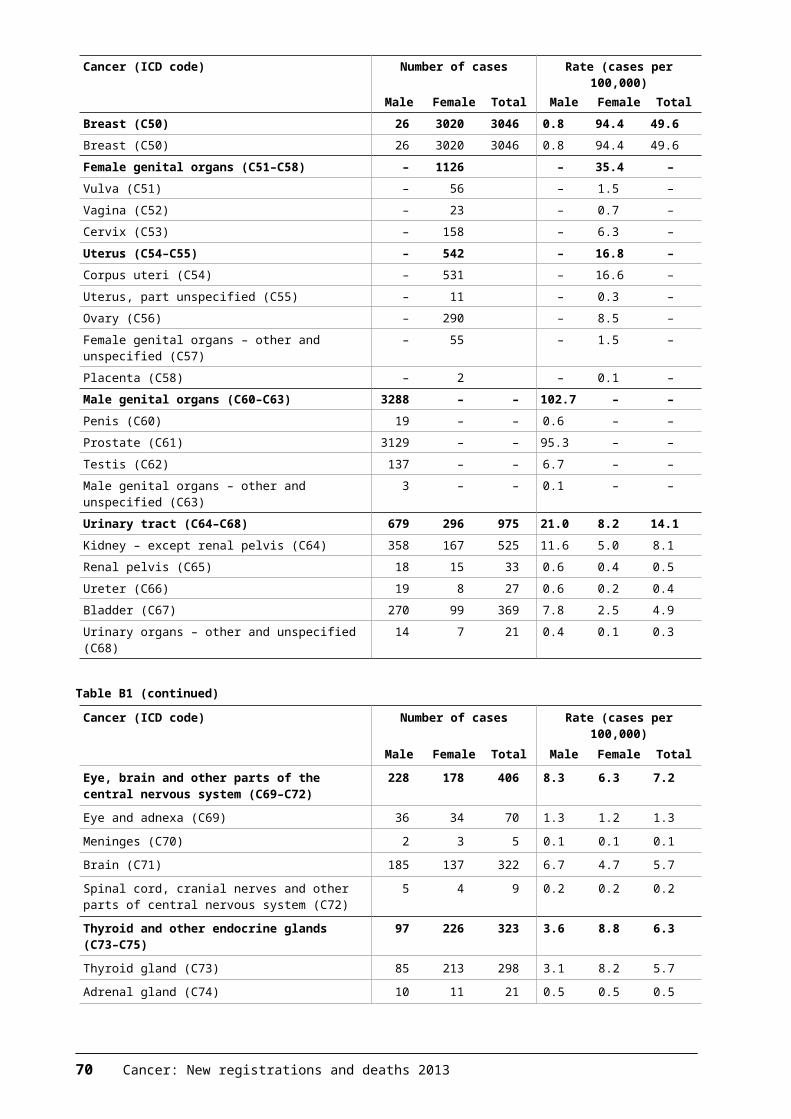
Table B6 (continued)
Cancer (ICD code) Number of deaths Rate (deaths per 100,000)Male Female Total Male Female Total
Bones, joints and articular cartilage (C40–C41) 14 8 22 0.7 0.4 0.6Bone and articular cartilage of limbs (C40) 6 2 8 0.3 0.1 0.2
Bone and articular cartilage of other and unspecified sites (C41)
8 6 14 0.4 0.3 0.3
Skin (C43–C44) 314 165 479 9.8 4.1 6.7Melanoma (C43) 227 120 347 7.2 3.2 5.1
Skin – other (C44) 87 45 132 2.5 0.8 1.6
Mesothelial and soft tissue (C45–C49) 95 45 140 3.0 1.4 2.1Mesothelioma (C45) 71 17 88 2.2 0.5 1.2
Kaposi sarcoma (C46) 0 0 0 0.0 0.0 0.0
Peripheral nerves and autonomic nervous system (C47)
0 1 1 0.0 0.0 0.0
Retroperitoneum and peritoneum (C48) 7 12 19 0.2 0.4 0.3
Other connective and soft tissue (C49) 17 15 32 0.6 0.5 0.6
Breast (C50) 6 540 546 0.2 16.3 8.7Breast (C50) 6 540 546 0.2 16.3 8.7
Female genital organs (C51–C58) – 353 – – 9.9 –Vulva (C51) – 14 – – 0.3 –
Vagina (C52) – 4 – – 0.1 –
Cervix (C53) – 42 – – 1.4 –
Uterus (C54–C55) – 109 – – 3.0 –Corpus uteri (C54) – 100 – – 2.8 –
Uterus, part unspecified (C55) – 9 – – 0.2 –
Ovary (C56) – 164 – – 4.4 –
Female genital organs – other and unspecified (C57) – 20 – – 0.6 –
Placenta (C58) – 0 – – 0.0 –
Male genital organs (C60–C63) 613 – – 17.4 – –Penis (C60) 1 – – 0.0 – –
Prostate (C61) 606 – – 17.1 – –
Testis (C62) 6 – – 0.3 – –
Male genital organs – other and unspecified (C63) 0 – – 0.0 – –
Urinary tract (C64–C68) 260 131 391 8.0 3.4 5.4Kidney – except renal pelvis (C64) 114 71 185 3.7 1.9 2.7
Renal pelvis (C65) 12 5 17 0.4 0.1 0.3
Ureter (C66) 6 4 10 0.2 0.1 0.1
Bladder (C67) 122 47 169 3.6 1.1 2.2
Urinary organs – other and unspecified (C68) 6 4 10 0.2 0.1 0.1
Eye, brain and other parts of the central nervous system (C69–C72)
139 116 255 5.2 3.9 4.6
Eye and adnexa (C69) 5 9 14 0.2 0.2 0.2
Meninges (C70) 0 1 1 0.0 0.0 0.0
Brain (C71) 132 106 238 5.0 3.7 4.3
Spinal cord, cranial nerves and other parts of central nervous system (C72)
2 0 2 0.1 0.0 0.0
72 Cancer: New registrations and deaths 2013
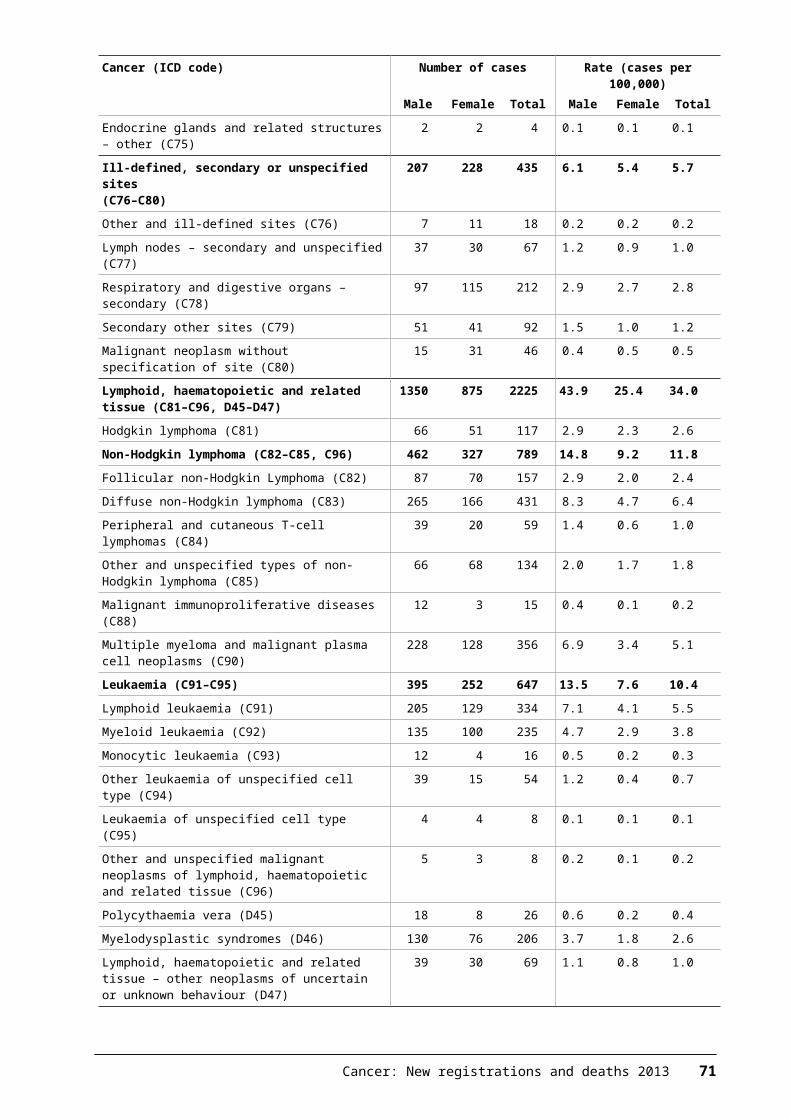
Table B6 (continued)
Cancer (ICD code) Number of deaths Rate (deaths per 100,000)Male Female Total Male Female Total
Thyroid and other endocrine glands (C73–C75) 16 15 31 0.6 0.5 0.6Thyroid gland (C73) 9 11 20 0.3 0.3 0.3
Adrenal gland (C74) 5 3 8 0.2 0.1 0.2
Endocrine glands and related structures – other (C75)
2 1 3 0.1 0.1 0.1
Ill-defined, secondary or unspecified sites(C76–C80)
171 171 342 5.2 3.8 4.4
Other and ill-defined sites (C76) 5 8 13 0.1 0.2 0.2
Lymph nodes – secondary and unspecified (C77) 0 0 0 0.0 0.0 0.0
Respiratory and digestive organs – secondary (C78) 0 0 0 0.0 0.0 0.0
Secondary other sites (C79) 0 0 0 0.0 0.0 0.0
Malignant neoplasm without specification of site (C80)
166 163 329 5.0 3.6 4.3
Lymphoid, haematopoietic and related tissue (C81–C96, D45–D47)
528 349 877 16.4 8.8 12.2
Hodgkin lymphoma (C81) 16 7 23 0.6 0.2 0.4
Non-Hodgkin lymphoma (C82–C85, C96) 183 111 294 5.7 2.9 4.2Follicular non-Hodgkin Lymphoma (C82) 20 11 31 0.6 0.3 0.4
Diffuse non-Hodgkin lymphoma (C83) 114 60 174 3.5 1.6 2.5
Peripheral and cutaneous T-cell lymphomas (C84) 15 7 22 0.5 0.3 0.4
Other and unspecified types of non-Hodgkin lymphoma (C85)
31 33 64 0.9 0.7 0.8
Malignant immunoproliferative diseases (C88) 3 2 5 0.1 0.0 0.1
Multiple myeloma and malignant plasma cell neoplasms (C90)
83 73 156 2.5 1.8 2.1
Leukaemia (C91–C95) 167 113 280 5.3 3.1 4.1Lymphoid leukaemia (C91) 56 40 96 1.7 0.9 1.3
Myeloid leukaemia (C92) 81 53 134 2.6 1.5 2.0
Monocytic leukaemia (C93) 10 3 13 0.4 0.2 0.3
Other leukaemia of unspecified cell type (C94) 16 10 26 0.5 0.3 0.4
Leukaemia of unspecified cell type (C95) 4 7 11 0.1 0.2 0.1
Other and unspecified malignant neoplasms of lymphoid, haematopoietic and related tissue (C96)
3 0 3 0.1 0.0 0.0
Polycythaemia vera (D45) 4 2 6 0.1 0.0 0.1
Myelodysplastic syndromes (D46) 51 20 71 1.5 0.4 0.8
Lymphoid, haematopoietic and related tissue – other neoplasms of uncertain or unknown behaviour (D47)
21 21 42 0.6 0.4 0.5
Note: rates are expressed per 100,000 population and age standardised to the WHO World Standard population.
Source: New Zealand Mortality Collection
Cancer: New registrations and deaths 2013 73
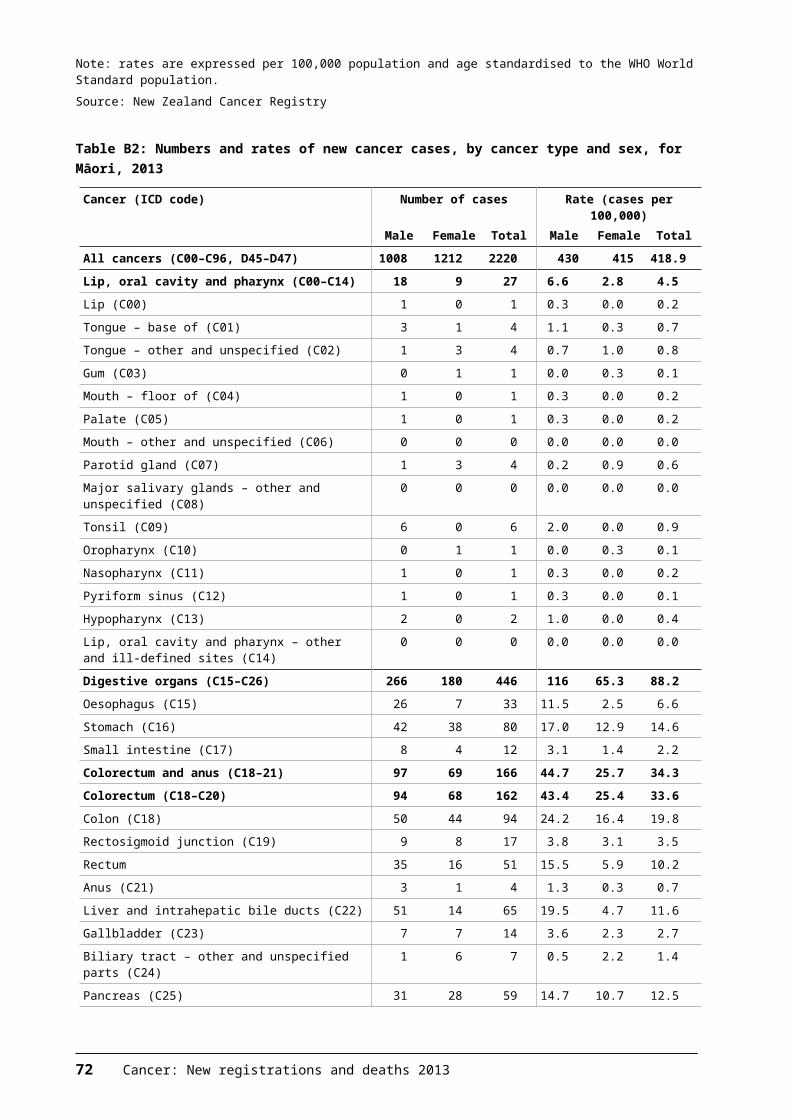
Appendix C: Full text of the Cancer Registry Act 19931993 Cancer Registry No. 102
Title1. Short Title and commencement2. Interpretation3. Act to bind the Crown4. Maintenance of Cancer Registry5. Reporting of cancer
6. Director General may require supply of further information
7. Protection against actions8. Offences9. Regulations
1993, No. 102
An Act to make better provision for the compilation of a statistical record of the incidence of cancer in its various forms, to provide a basis for the better direction of programmes for research and for cancer prevention.
BE IT ENACTED by the Parliament of New Zealand as follows:
1. Short Title and commencement(1) This Act may be cited as the Cancer Registry Act 1993.
(2) This Act shall come into force on the 1st day of July 1994.
2. Interpretation – In this Act, unless the context otherwise requires:“Cancer”:
(a) means a malignant growth of human tissue that, if unchecked:(i) is likely to spread to adjacent tissue or beyond its place of origin;
and(ii) may have the propensity to recur; and
(b) without limiting the generality of paragraph (a) of this definition, includes carcinoma-in-situ, carcinoma, sarcoma (including Kaposi’s sarcoma), any mixed tumour, leukaemia, any type of lymphoma, and melanoma; but
(c) does not include:(i) any secondary or metastatic cancer, except where the primary
cancer is not identified;(ii) any type of cancer that is declared by regulations made under this
Act to be a cancer to which this Act does not apply.
74 Cancer: New registrations and deaths 2013
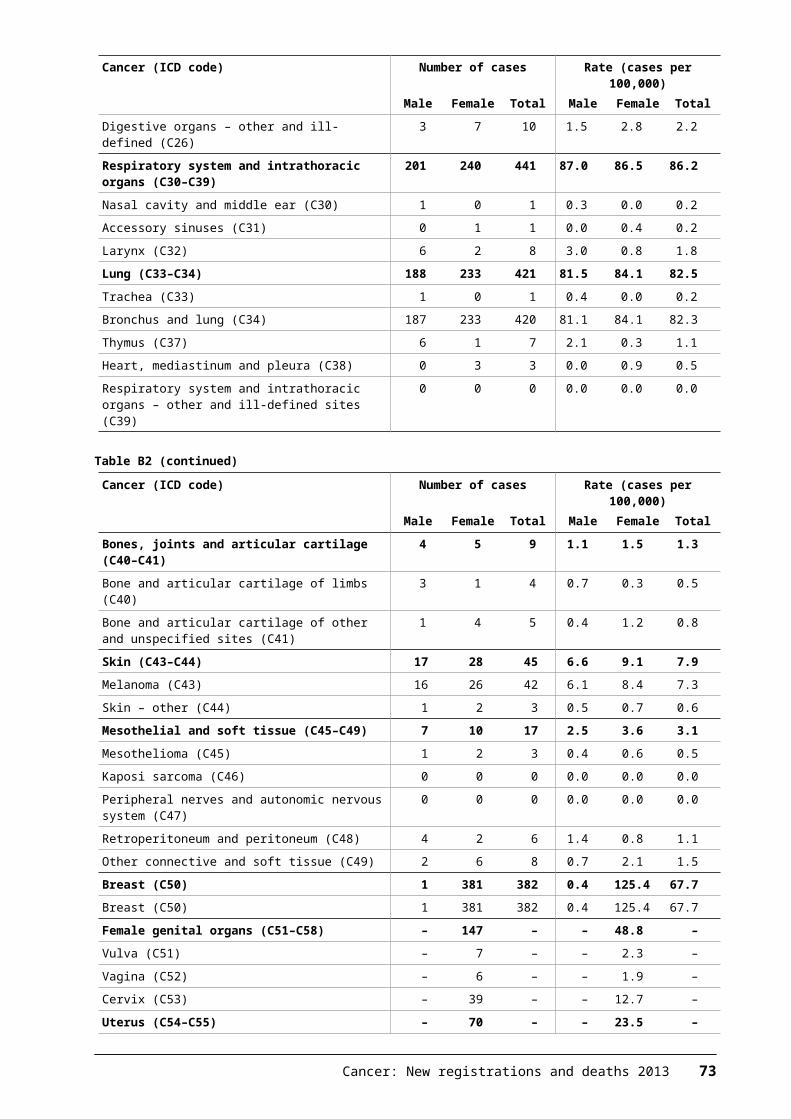
“Cancer test” means any examination or test (including the examination of any blood, cytological or tissue biopsy specimen, or other material) that is carried out in any pathology laboratory to determine the presence or absence of cancer in any person (including a deceased person).
“Director-General” means the Director-General of Health.
3. Act to bind the Crown – This Act binds the Crown.
4. Maintenance of Cancer Registry(1) The Director-General shall maintain or arrange for the maintenance of a
Cancer Registry.
(2) The purposes of the Cancer Registry are:(a) to provide information on the incidence of, and mortality from,
cancer; and(b) to provide a basis for cancer survival studies and research
programmes.
5. Reporting of cancer(1) Where a cancer test indicates the presence of cancer in any person
(including a deceased person) the person in charge of the laboratory where that test was carried out shall cause a report of that test to be made to the Director-General for the purposes of the Cancer Registry.
(2) Where a post-mortem examination of any deceased person indicates the presence of cancer in that person, the person who carried out that examination shall cause a report of that examination to be made to the Director-General for the purposes of the Cancer Registry.
(3) Every report under subsection (1) or subsection (2) of this section:(a) shall be made within the prescribed time; and(b) shall be made in the prescribed form and manner.
(4) No person is required to make a report under this section with respect to:(a) any cancer test that indicates the presence of cancer in any person
(including a deceased person); or(b) any post-mortem examination of any deceased person that indicates
the presence of cancer in that person –if the first-mentioned person has good reason to believe that the presence of that particular cancer in that other person has already been reported to the Director-General, whether in a report made under this section or pursuant to any arrangements that were in place before the commencement of this Act or otherwise.
6. Director-General may require supply of further information(1) Where any report made under section 5 of this Act is incomplete in any
respect by reason that the person making the report does not have available to that person certain information necessary to enable a complete report to be made, the Director-General may, for the purpose of obtaining that information, by notice in writing require any person (being a medical practitioner or the person in charge of any hospital)
Cancer: New registrations and deaths 2013 75
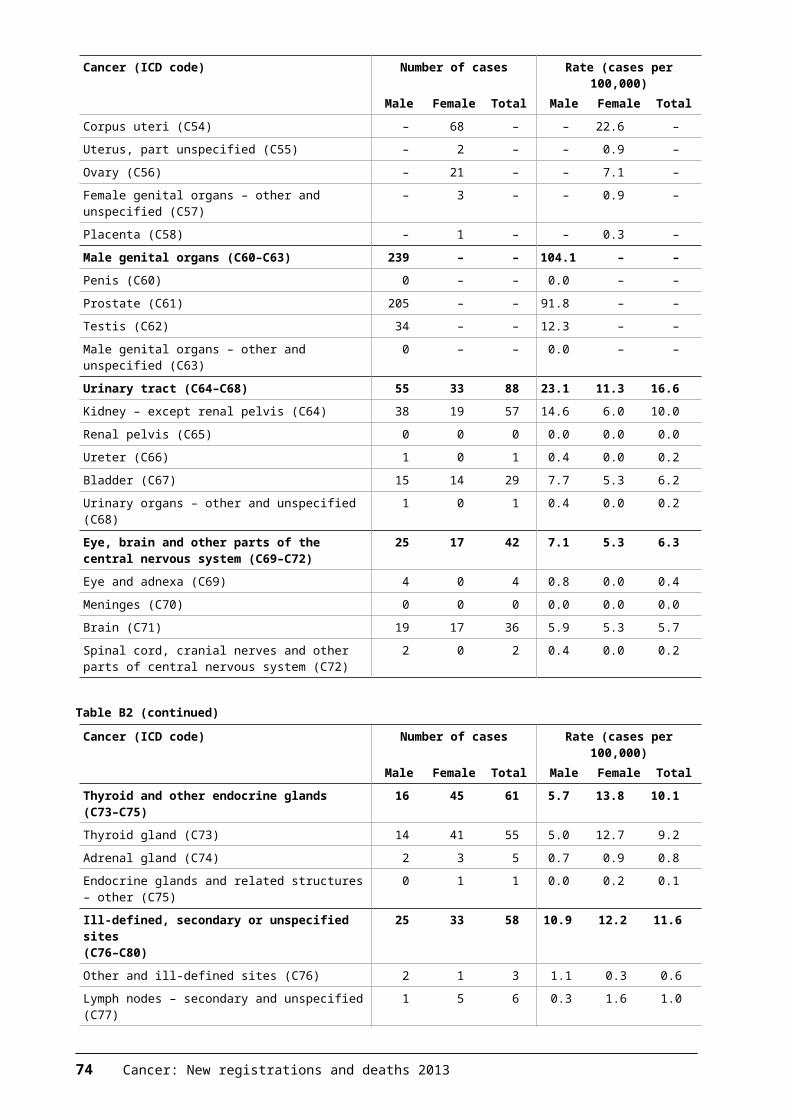
that the Director-General reasonably believes may have all or any of that information to provide to the Director-General such information as may be specified in the notice.
(2) Every person to whom a notice is given under this section and who has any of the information specified in that notice shall provide that information within such time, and in such form and manner, as may be specified in the notice.
(3) In subsection (1) “medical practitioner” means a health practitioner who is, or is deemed to be, registered with the Medical Council of New Zealand continued by section 114(1)(a) of the Health Practitioners Competence Assurance Act 2003 as a practitioner of the profession of medicine.
7. Protection against actions(1) No proceedings, civil or criminal, shall lie against any person by reason
of that person having made available any information for the purposes of complying with the requirements of section 5 or section 6(2) of this Act.
(2) Nothing in subsection (1) of this section applies in respect of proceedings for an offence against section 8 of this Act.
8. Offences – Every person commits an offence and is liable on summary conviction to a fine not exceeding $500 who:(a) fails, without reasonable excuse, to comply with the requirements of
section 5 or section 6(2) of this Act; or(b) knowingly supplies information that is false or misleading in purported
compliance with section 5 or section 6(2) of this Act.
9. Regulations – The Governor-General may from time to time, by Order in Council, make regulations for all or any of the following purposes:
(a) prescribing the form and manner in which reports are to be made to the Director-General under section 5 of this Act:
(b) prescribing the time within which reports are to be made to the Director-General under section 5 of this Act:
(c) declaring any type of cancer to be a cancer to which this Act does not apply:
(d) providing for such other matters as are contemplated by or necessary for giving full effect to this Act and for its due administration.
This Act is administered by the Ministry of Health.
76 Cancer: New registrations and deaths 2013
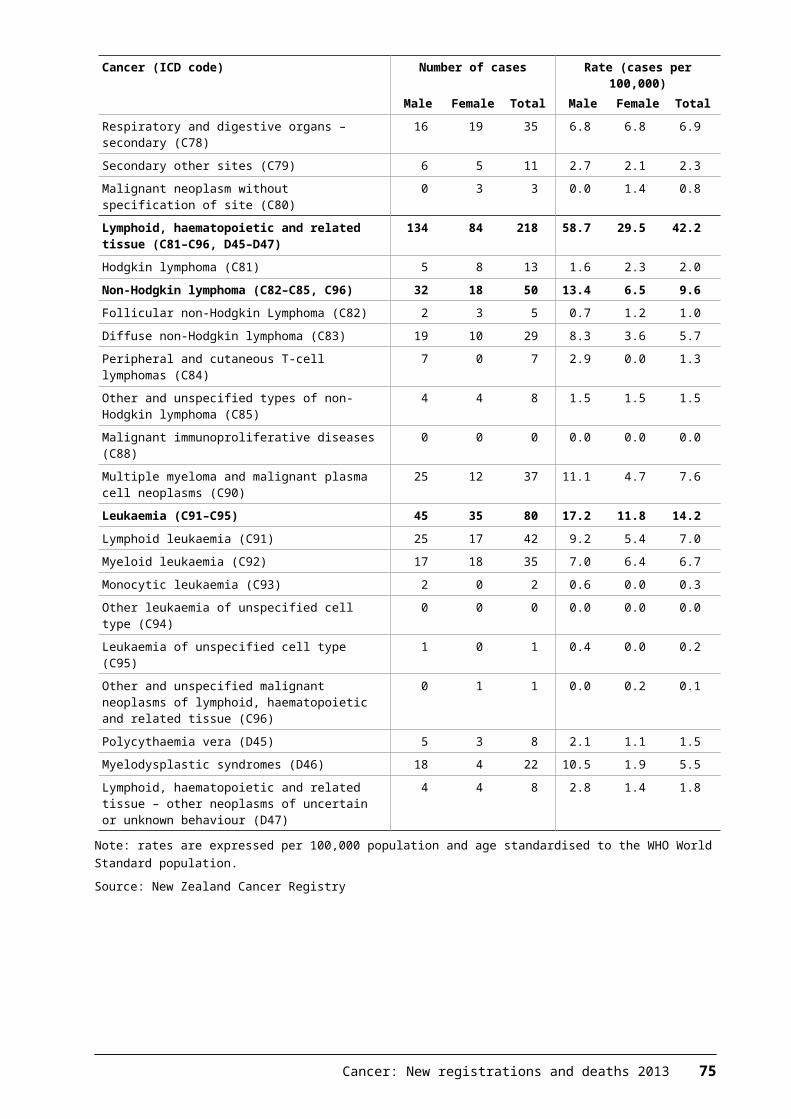
Appendix D: Full text of the Cancer Registry Regulations 1994
1994/89
THE CANCER REGISTRY REGULATIONS 1994
CATHERINE A TIZARD, Governor-GeneralORDER IN COUNCIL
At Wellington this 30th day of May 1994Present:
Her Excellency the Governor-General in Council
Pursuant to section 9 of the Cancer Registry Act 1993, Her Excellency the Governor-General, acting by and with the advice and consent of the Executive Council, hereby makes the following regulations.
REGULATIONS
1. Title and commencement(1) These regulations may be cited as the Cancer Registry Regulations 1994.
(2) These regulations shall come into force on the 1st day of July 1994.
2. Interpretation(1) In these regulations, unless the context otherwise requires:
“the Act” means the Cancer Registry Act 1993;“Report” means a report to the Director-General under section 5 of the Act.
(2) Where any expression used in these regulations is not defined in these regulations but is defined in the Act, that expression shall, unless the context otherwise requires, have, in these regulations, the meaning given to it by the Act.
3. Time within which reports to be made – Every report shall be made no later than 21 days after the end of the calendar month in which the cancer test to which the report relates was carried out.
Cancer: New registrations and deaths 2013 77
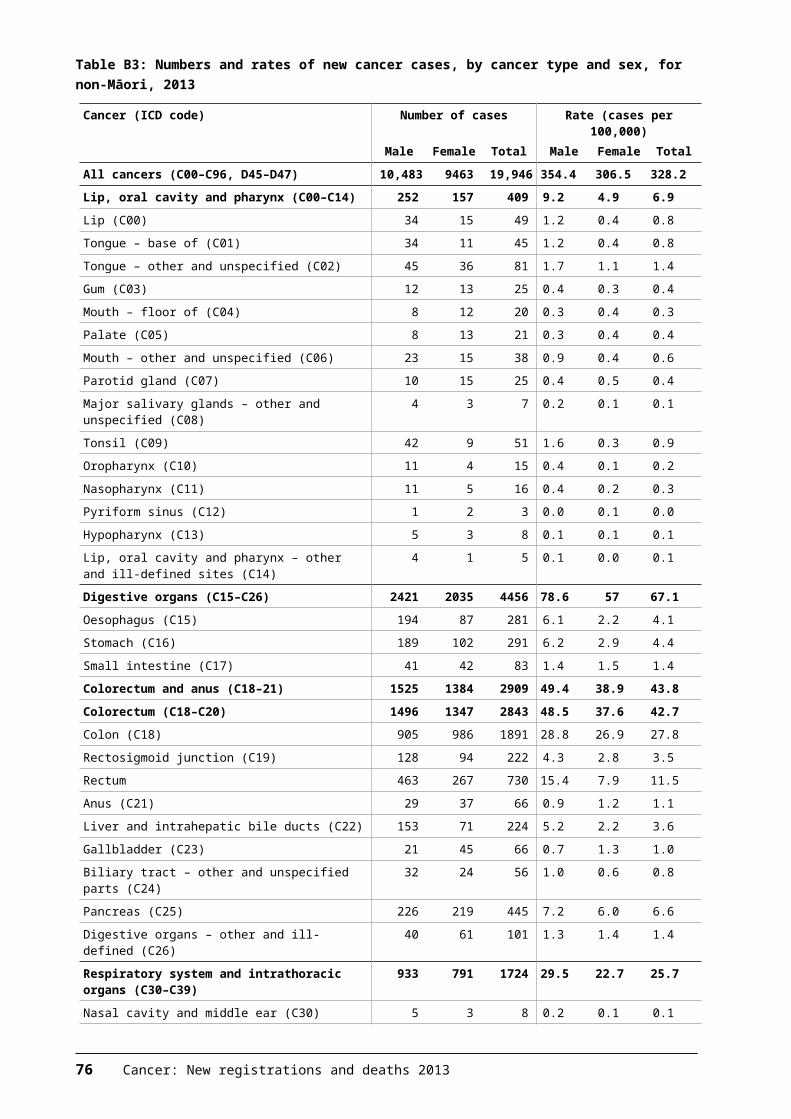
4. Form of reports(1) Every report shall contain the following information:
(a) The full name of the person who carried out the cancer test to which the report relates.
(b) In relation to the person who requested the carrying out of the cancer test to which the report relates:(i) the full name of that person; and(ii) the name of the health-care institution by which that person is
employed or engaged or in which that person otherwise works (if any).
(c) In relation to the person in respect of whom the cancer test to which the report relates was carried out:(i) either that person’s National Health Index Identifier or that
person’s full name, maiden name (if any) and any known aliases;
(ii) that person’s date of birth;(iii) that person’s sex;(iv) where available, that person’s ethnic group;(v) where available, that person’s full address;(vi) where available, that person’s occupation.
(d) In relation to the cancer test to which the report relates:(i) the category into which the test falls, which shall be one of the
categories set out in subclause (2) of this regulation;(ii) a description of the anatomical site from which the sample in
respect of which the test was carried out was obtained, as indicated with the request for the test;
(iii) whether that site is the primary site or the secondary site of the cancer indicated by the test.
(e) In relation to the cancer indicated by the cancer test to which the report relates:(i) a full description of the pathological nature of the cancer;(ii) in the case of melanoma of the skin:
(A) the thickness of the tumour, measured in accordance with Breslow’s method;
(B) the extent of tumour invasion, expressed by reference to Clark’s levels;
(iii) where available, the stage of the cancer (other than for lymphoma, leukaemia, and melanoma of the skin).
(2) The categories referred to in subclause (1)(d)(i) of this regulation are as follows:
(a) the histology of the primary lesion or, in the absence of a known primary lesion, the metastases;
(b) cytology or haematology, or both;(c) specific biochemical or immunological test, or both;
(d) autopsy with concurrent or previous histology.
78 Cancer: New registrations and deaths 2013
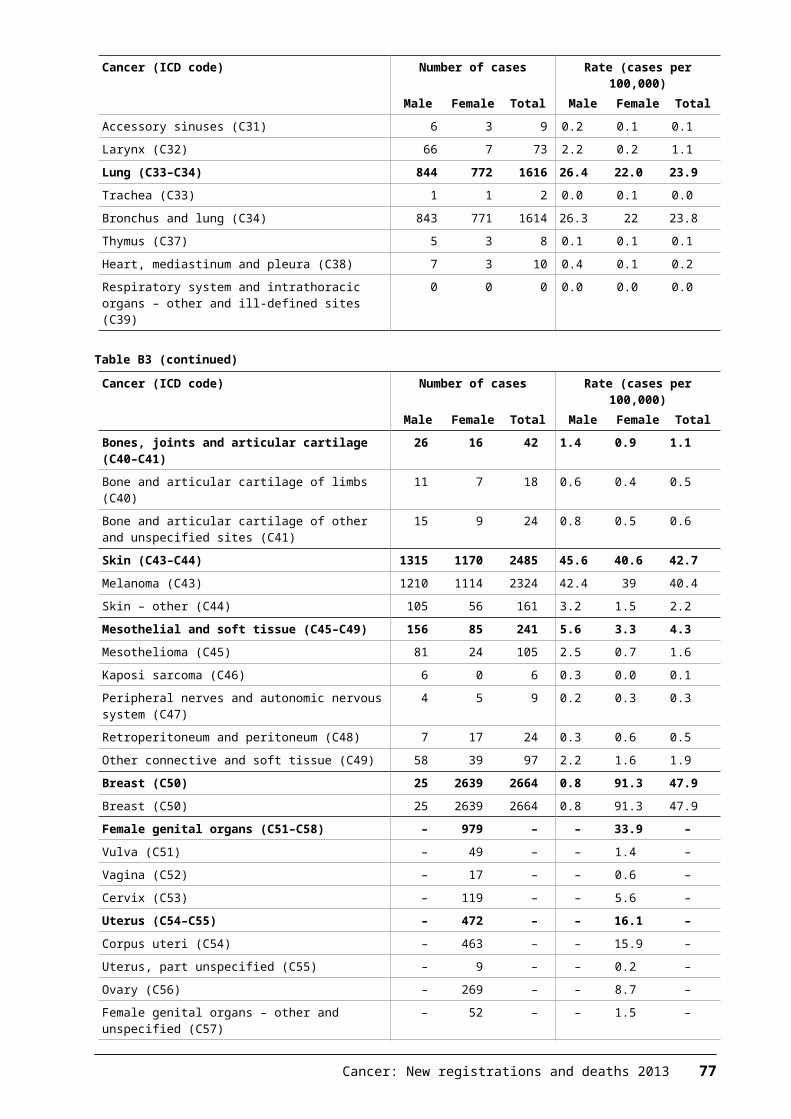
(3) Where any information required to be included in any report is unavailable at the time the report is made, or is unobtainable:(a) the report shall indicate that the information is unavailable or, as
the case may be, unobtainable; and(b) if that information subsequently becomes available, the person
required to make the report shall, as soon as practicable, transmit that information to the Director-General.
5. Manner in which reports to be made – A report shall be made:(a) in a written document; or
(b) on computer tape, disk, or diskette; or(c) by directly inputting data into a database maintained in electronic form
by the Director-General for the purposes of the Cancer Registry, such inputting being made by means of remote logon access to the database.
6. Act not to apply to certain cancers – It is hereby declared that the following types of cancer are cancers to which the Act does not apply:(a) basal cell cancer arising in the skin
(b) squamous cell cancer arising in the skin.MARIE SHROFF
Clerk of the Executive Council.
Explanatory noteThis note is not part of the regulations, but is intended to indicate their general effect.These regulations, which come into force on 1 July 1994, prescribe certain matters for the purposes of the Cancer Registry Act 1993. The regulations:(a) prescribe the form and manner in which reports on cancer tests are to be
made to the Director-General of Health under the Act; and(b) prescribe the time within which such reports are to be made; and(c) declare that certain types of cancer are cancers to which the Act does not
apply.
Issued under the authority of the Acts and Regulations Publication Act 1989.Date of notification in Gazette: 2 June 1994.
These regulations are administered by the Ministry of Health.
Cancer: New registrations and deaths 2013 79
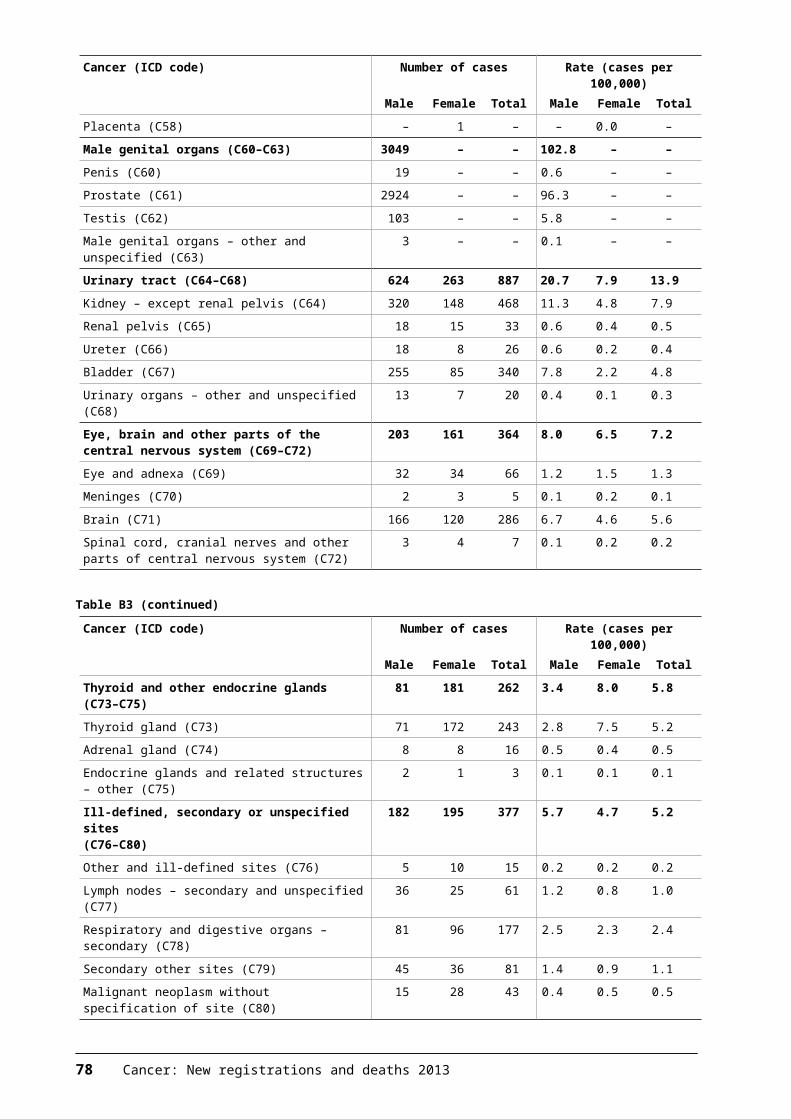
ReferencesAhmad O, Boschi-Pinto C, Lopez AD, et al. 2001. Age Standardization of Rates: A new WHO standard. GPE Discussion Paper Series No. 31. Geneva: World Health Organization. URL: www.who.int/healthinfo/paper31.pdf (accessed 12 August 2016).
Atkinson J, Salmond C, Crampton P. 2014. NZDep2013 Index of Deprivation User’s Manual. Wellington: University of Otago.
Benzeval M, Judge K, Shouls S. 2001. Understanding the relationship between income and health: how much can be gleaned from cross-sectional data? Social Policy and Administration 35: 376–96.
International Agency for Research on Cancer, World Health Organization, International Association of Cancer Registries, et al. 2004. International Rules for Multiple Primary Cancers (ICD-O Third Edition. Internal Report No. 2004/02. Lyon: International Agency for Research on Cancer. URL: www.iacr.com.fr/images/doc/MPrules_july2004.pdf (accessed 30 August 2016).
Keyfitz N. 1966. Sampling variance of standardized mortality rates. Human Biology 38: 309–17.
Ministry of Health. 2000. Cancer: New registrations and deaths 1996. Wellington: Ministry of Health.
Ministry of Health. 2004. Ethnic Group Data Protocols for the Health and Disability Sector. Wellington: Ministry of Health.
Ministry of Health. 2011. Cancer: New registrations and deaths 2006. Wellington: Ministry of Health.
Ministry of Health. 2015. Mortality 2013 Online Tables. Wellington: Ministry of Health.
National Centre for Classification in Health. 2008. International Statistical Classification of Diseases and Related Health Problems, Tenth Revision, Australian Modification, sixth edition. Sydney: National Centre for Classification in Health.
White P, Gunston J, Salmond C, et al. 2008. Atlas of Socioeconomic Deprivation in New Zealand NZDep2006. Wellington: Ministry of Health.
80 Cancer: New registrations and deaths 2013


